Article

Evaluation of ERA5 Wave Parameters with In Situ Data in the South China Sea

1
State Key Laboratory of Tropical Oceanography, Key Laboratory of Science and Technology on Operational Oceanography, Marine Environmental Engineering Center, South China Sea Institute of Oceanology, Chinese Academy of Sciences, Guangzhou 511458, China
2
Southern Marine Science and Engineering Guangdong Laboratory (Guangzhou), Guangzhou 511458, China
3
Sanya Institute of Oceanology, South China Sea Institute of Oceanology, Chinese Academy of Sciences, Sanya 572025, China
4
Guangdong Provincial Observation and Research Station for Coastal Upwelling Ecosystem, Shantou 515041, China
*
Authors to whom correspondence should be addressed.
These authors contributed equally to this work.
Atmosphere 2022, 13(6), 935; https://doi.org/10.3390/atmos13060935
Submission received: 7 May 2022 / Revised: 30 May 2022 / Accepted: 7 June 2022 / Published: 9 June 2022
(This article belongs to the Special Issue Air-Sea Interaction: Modeling and Dynamics)

Abstract

:
In this paper, the accuracy of wave parameters of the European Centre for Medium-Range Weather Forecasting Reanalysis v5 (ERA5) in the South China Sea (SCS) is systematically examined with field measured data of two buoys at offshore sites and a subsea-based platform at a nearshore site, which has a total observational period of nearly three years. It is suggested that the wave parameters provided by ERA5, such as significant wave height (Hs) and mean wave period (Tm), are in good agreement with the observational data of the three sites. Compared with the in situ data, the correlation coefficient of ERA5 Hs is in the range of 0.87–0.93, and the root mean square error is only in the range of 0.22–0.57 m. The error of standard deviation does not exceed 0.29 m and is even as low as 0.04 m at two sites. The wave propagation directions of the ERA5 and in situ data are also basically the same. However, when the data are applied in engineering, some wave parameters extracted from ERA5 may deviate from the measured statistics. It is possible to significantly overestimate the average duration of a particular Hs. Further analysis shows that the possible errors of ERA5 wave parameters may be due to insufficient description of topographic conditions, which shows that the error value changes obviously with the wave direction. The results preliminarily confirm the validity of ERA5 data in the SCS, but also indicate that it is necessary to calibrate and validate the data adequately when applying the global model and its reanalysis data to specific ocean areas.

1. Introduction

Wave data are important for many aspects such as shipping, cross-border trade, marine resource development, engineering construction, and scientific research. Extreme dynamic processes such as huge waves may cause damage to shorelines or infrastructure [1,2]. Therefore, sufficient wave information needs to be obtained in the process of ocean engineering design and construction.
Wave data can generally be derived from in situ observations [3,4], satellite remoting [5,6], and numerical models [7,8,9,10,11,12]. The European Center for Medium-Term Weather Forecasting (ECMWF) is one of the world’s leading reanalysis centers. It publishes the latest (fifth) generation reanalysis dataset (ERA5). The dataset provides high-quality global coverage of wave parameters [13,14], which has been applied in a large number of scientific research and engineering practices [5,15,16].
However, it is necessary to validate the data adequately when applying the results of global-scale numerical models to the local ocean. For example, the South China Sea (SCS) has complex submarine topographical features, which may have a significant impact on the wave propagation process. The waves in the SCS mainly spread southwestward from the Luzon Strait to the west and south of the SCS through islands and reefs with shallow water topography [6,9,10]. During the process of waves experiencing shallow terrains, such as islands and reefs, refraction, diffraction, and deformation, will occur. The parameters, such as wave height, wavelength (period), and propagation direction, will consequently change significantly [10,17,18]. However, this shallow topographic information is hard to accurately depict using the common numerical models. For example, the resolution of the ERA5 model (0.25 degree) is much larger than that of the size of the reef, which is usually only several hundred meters [19].
Comparative studies of the parameters of the atmosphere and ocean defined in the ERA5 model with measurement data have already been carried out by many researchers [20,21,22,23]. It is shown by their results that, on average, the ERA5 database can be effectively used in research, despite significant differences in hourly data. However, probably due to the scarcity of long-term field observation data, although the performance of ERA5 wave data in the SCS has been preliminarily validated [16], the data still needs more systematic assessment, especially for the southern areas far from the mainland.
This study systematically evaluates the accuracy of ERA5 wave parameters, such as significant wave height (Hs), mean wave period (Tm), and wave direction (Dir), by using field observational data of two buoys and a subsea-based platform in the SCS, as well as the feasibility of applying ERA5 to analyze engineering wave parameters.

2. Data and Methods

2.1. Wave Data from the ERA5 Dataset

ERA5 is the fifth generation of ECMWF atmospheric reanalysis data set for the global climate, which combines a large number of historical observations into global estimates using advanced modeling and data assimilation systems [13,14]. Compared with the previous generation of ERA-Interim data sets, the ERA5 assimilation system significantly improves the accuracy of the data by using several integrated forecasting systems developed specifically for reanalysis. ERA5 data has a time resolution of an hour and a spatial resolution of 0.25 degrees. The dataset spans from January 1979 to the present. Three wave parameters (Hs, Tm, and Dir) are obtained in this study. The parameters are determined by the following equations in the ERA5 dataset [14]:
H s = 4 m 0
T m = m 0 / m 2
where mn is the moment of order n of wave spectrum F(f, θ), which describes how the wave energy is distributed as a function of frequency f and propagation direction θ. The mean period used in this study is based on the second moment of the wave spectrum. In addition, the mean direction is defined as [14]:
D i r = atan ( S F / C F )
where SF is the integral of sin(θ)F(f, θ) over f and θ and CF is the integral of cos(θ)F(f, θ) over f and θ. Note that the direction is encoded using the meteorological convention, i.e., 0 means from North, and 90 from East.

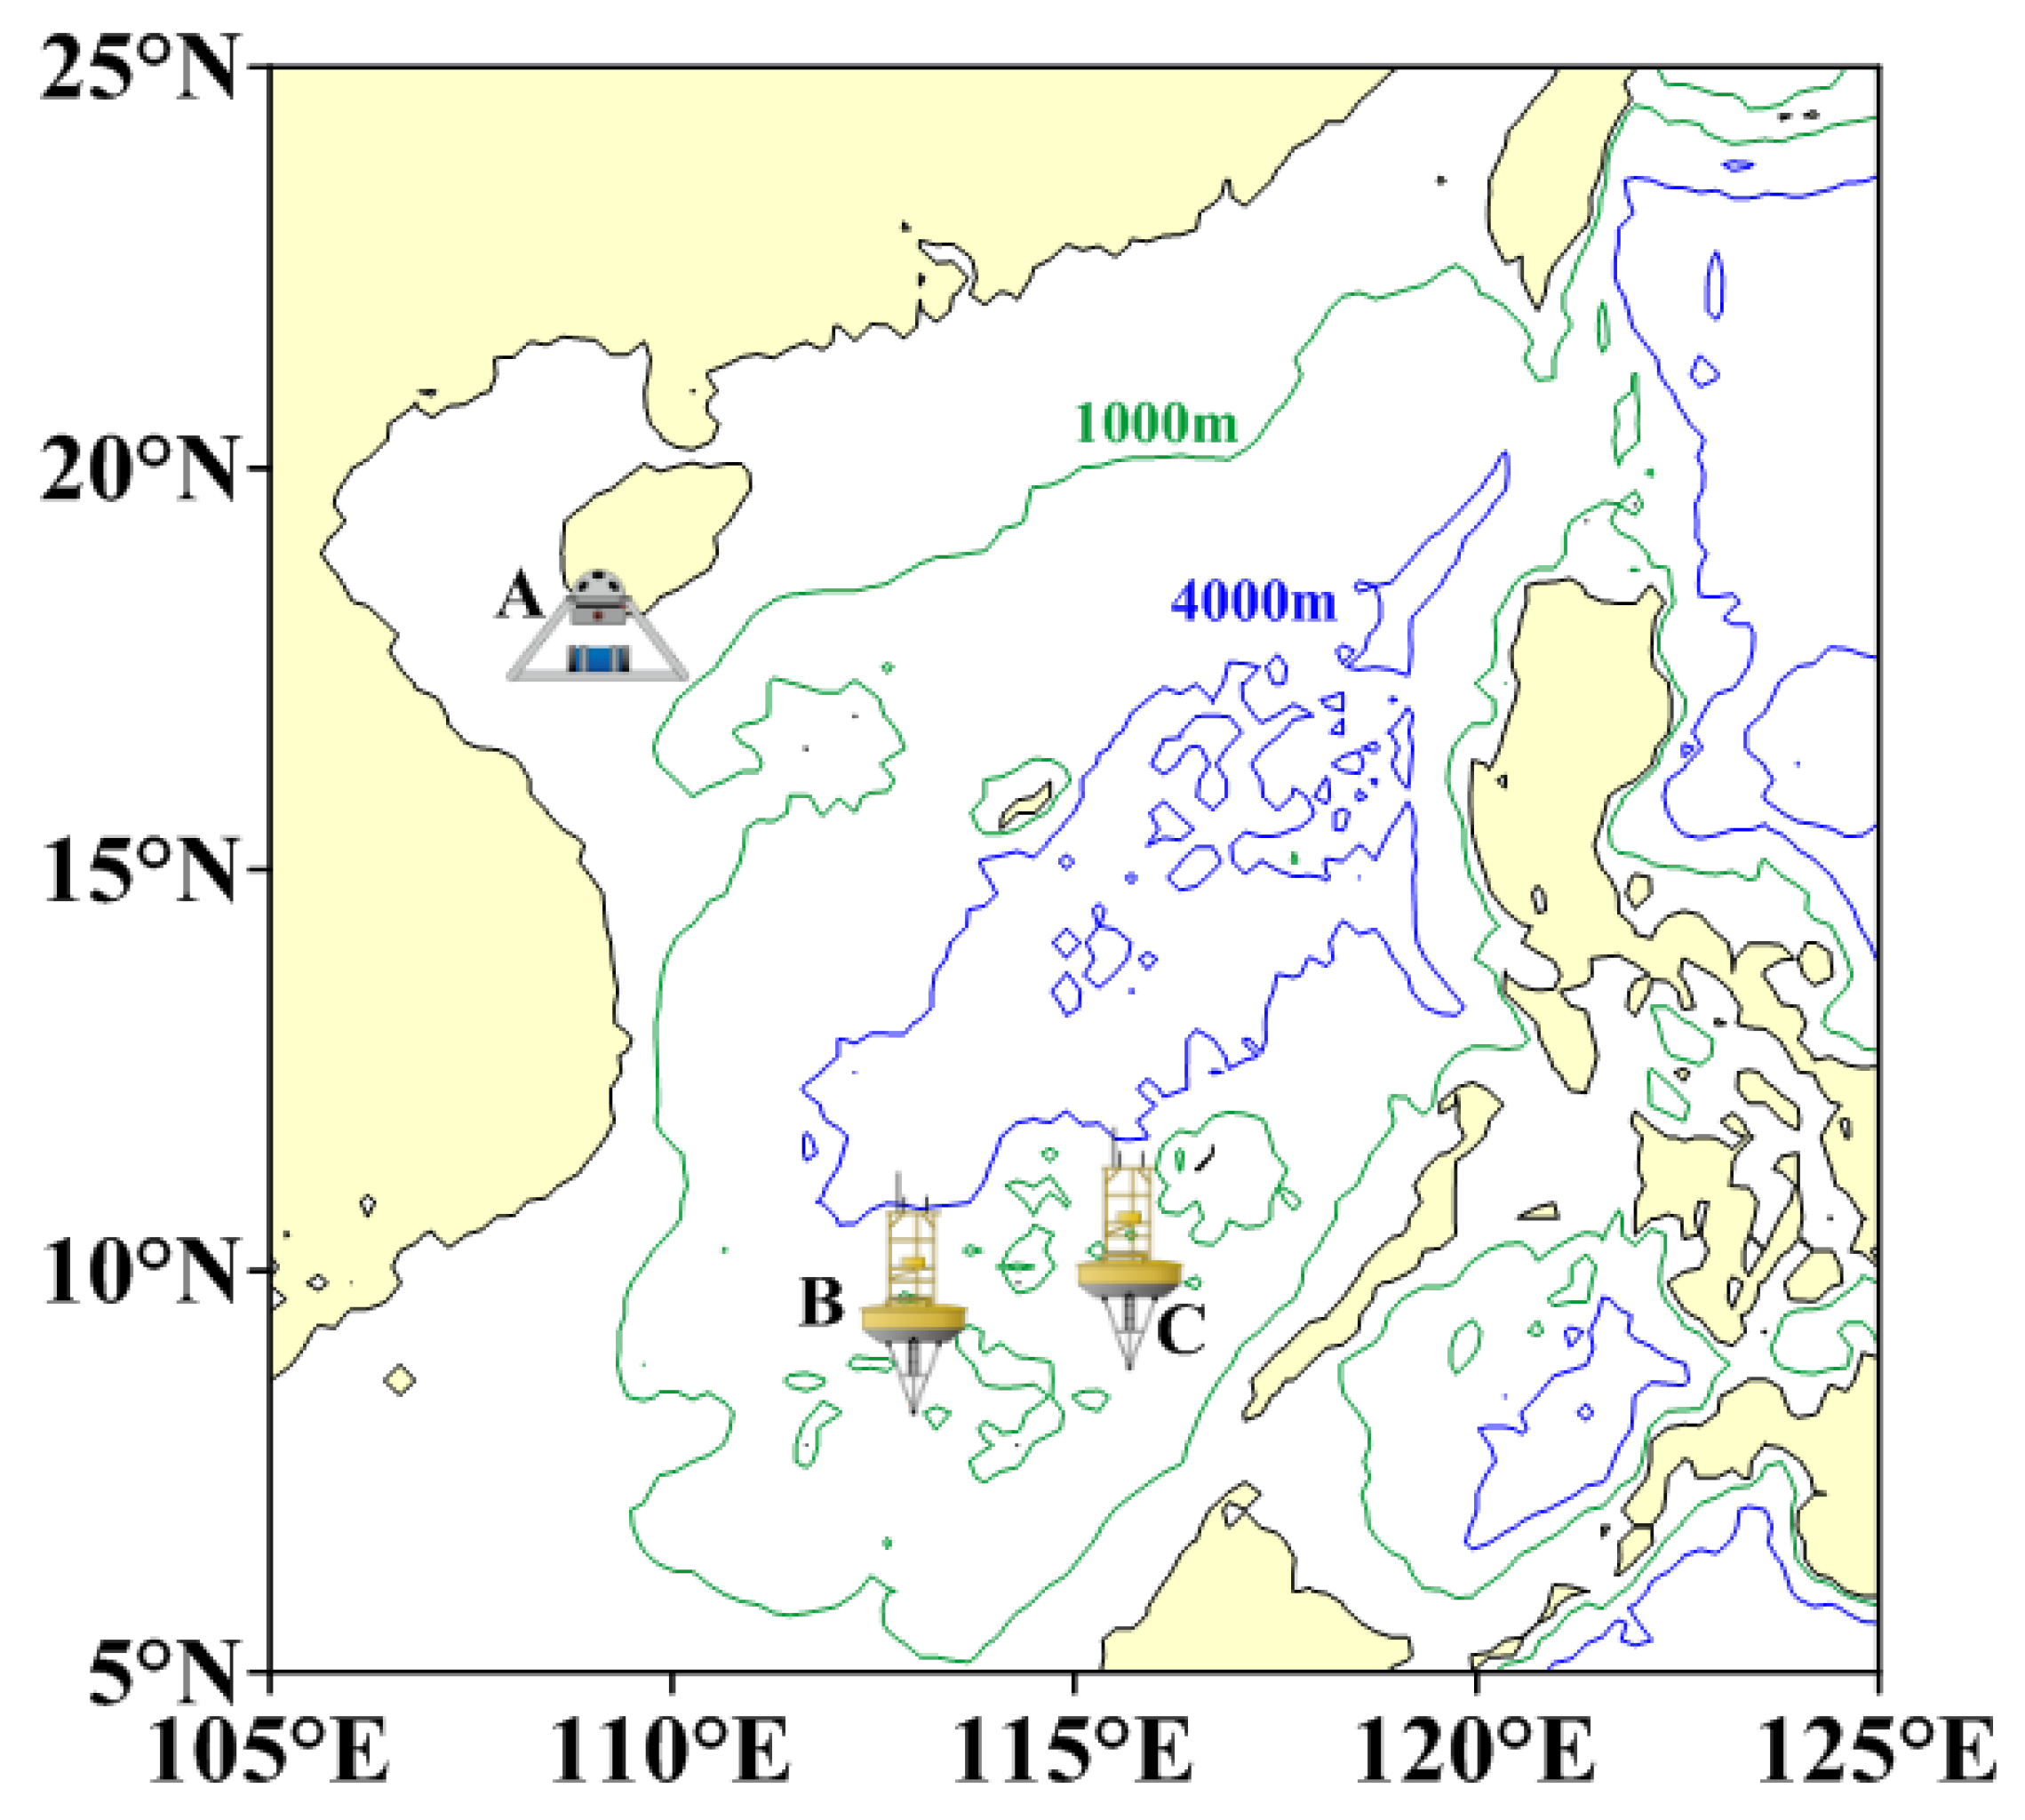
2.2. In Situ Wave Measurements

Two sets of buoys and one set of the subsea-based platform are used to assess the quality of ERA5 main wave parameters in the SCS. The distribution of the observational sites is shown in Figure 1. The selection of the sites is mainly based on the formation and development of waves in the SCS. The waves in the SCS are mainly dominated by the swell, spreading from the northeast to the southwest [6]. In the northern SCS, the waves are affected by the coastline and the shallow topography of the continental shelf and gradually develop into nearshore waves during propagating shoreward [4,8], which is represented by Site A. In the southern SCS, the waves experience many islands and reefs, which were blocked by shallow water topography, resulting in shallowing and diffraction deformation [5,9]. Sites B and C are located in the west and east of the southern SCS, respectively, which can be used to compare the differences in deformation processes during the wave propagation. All three sites are far from the main ship routes, therefore, the influence of ship activities on the waves is limited.
Acoustic wave and current profiler (AWAC) is fixed on the seafloor through a subsea-based platform at the relatively near-shore site (Site A) and measured by the surface acoustic tracking method. The Triaxys wave sensor is integrated into the anchorage buoy at two offshore sites (Site B and Site C) to measure the waves through gravity acceleration. The location, depth, and observation period of the three sites are listed in Table 1. The observation period of each site location data exceeds one year, and the overall period is close to three years. As the waves caused by the earthquake or tsunami in the Pacific are mostly blocked by the first islands’ chain in the east and rarely enter the SCS, during the observational period, there was no strong earthquake or obvious tsunami that occurred in the SCS. Therefore, this study does not consider the factors such as earthquakes and tsunamis but emphasizes the performance of ERA5 wave parameters in normal conditions. Wave parameters of Hs, Tm, and Dir are, respectively, automatically calculated according to Equations (1)–(3) and output by the observation instruments. Some of the data from these sites have been used for the verification of satellite data and evaluation of wave energy [4,5,24]. The reliability of the data at these sites has been verified.

2.3. Comparison Method

This study matches the field observational data with ERA5 data and evaluates the accuracy of ERA5 data by calculating several indexes such as root mean squared error (RMSE), standard deviation (STD), and correlation coefficient (COR), based on the two sets of data.
In addition, the average duration of waves is an important parameter reflecting wave energy [25,26,27]. It refers to the average duration of each time corresponding to a specific wave height. The average duration (D) of a specific significant wave height (Hs) conforms to the relationship proposed by Lawson and Abnethy [25] as follows,
D = α H s β
where Hs and D are in units of meter and day, respectively; α and β are dimensionless coefficients fitted based on the Hs series. In this study, the observed Hs and ERA5 Hs of the three sites, a total of six Hs series, will be fitted against the equation by the least square method, respectively. Six pairs of coefficients (α, β) will be obtained from the fitting results.

3. Results and Discussion

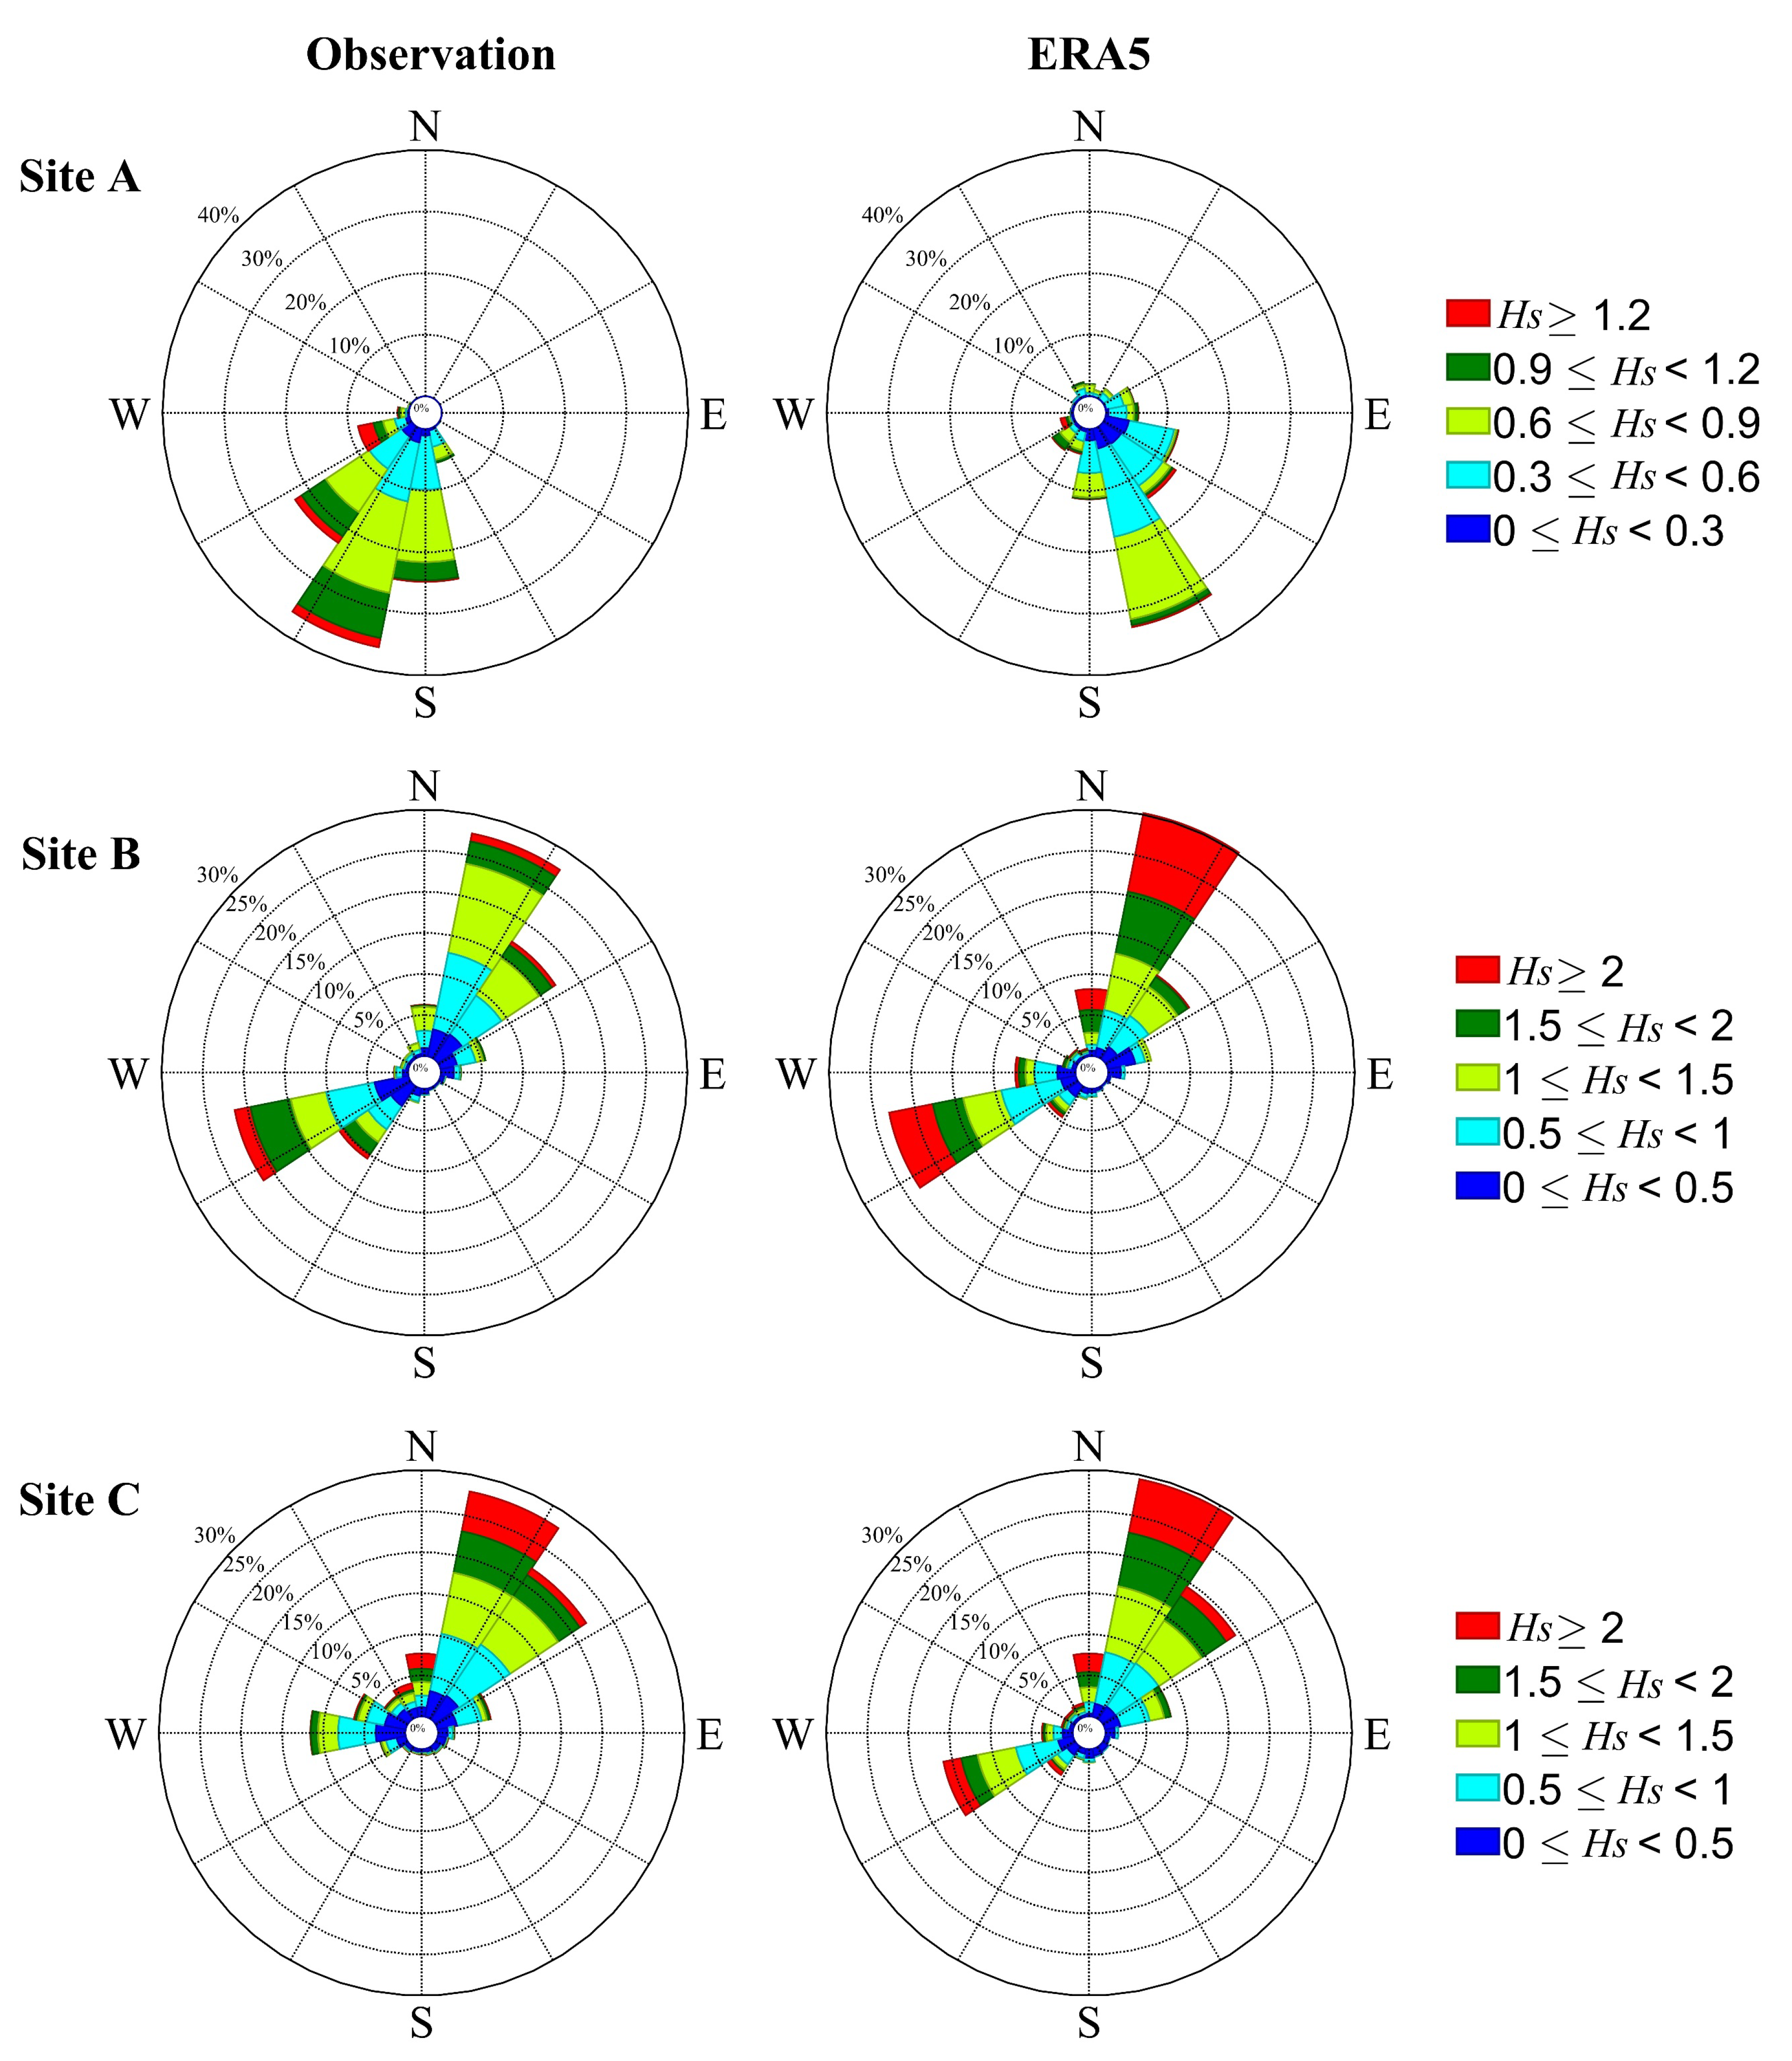
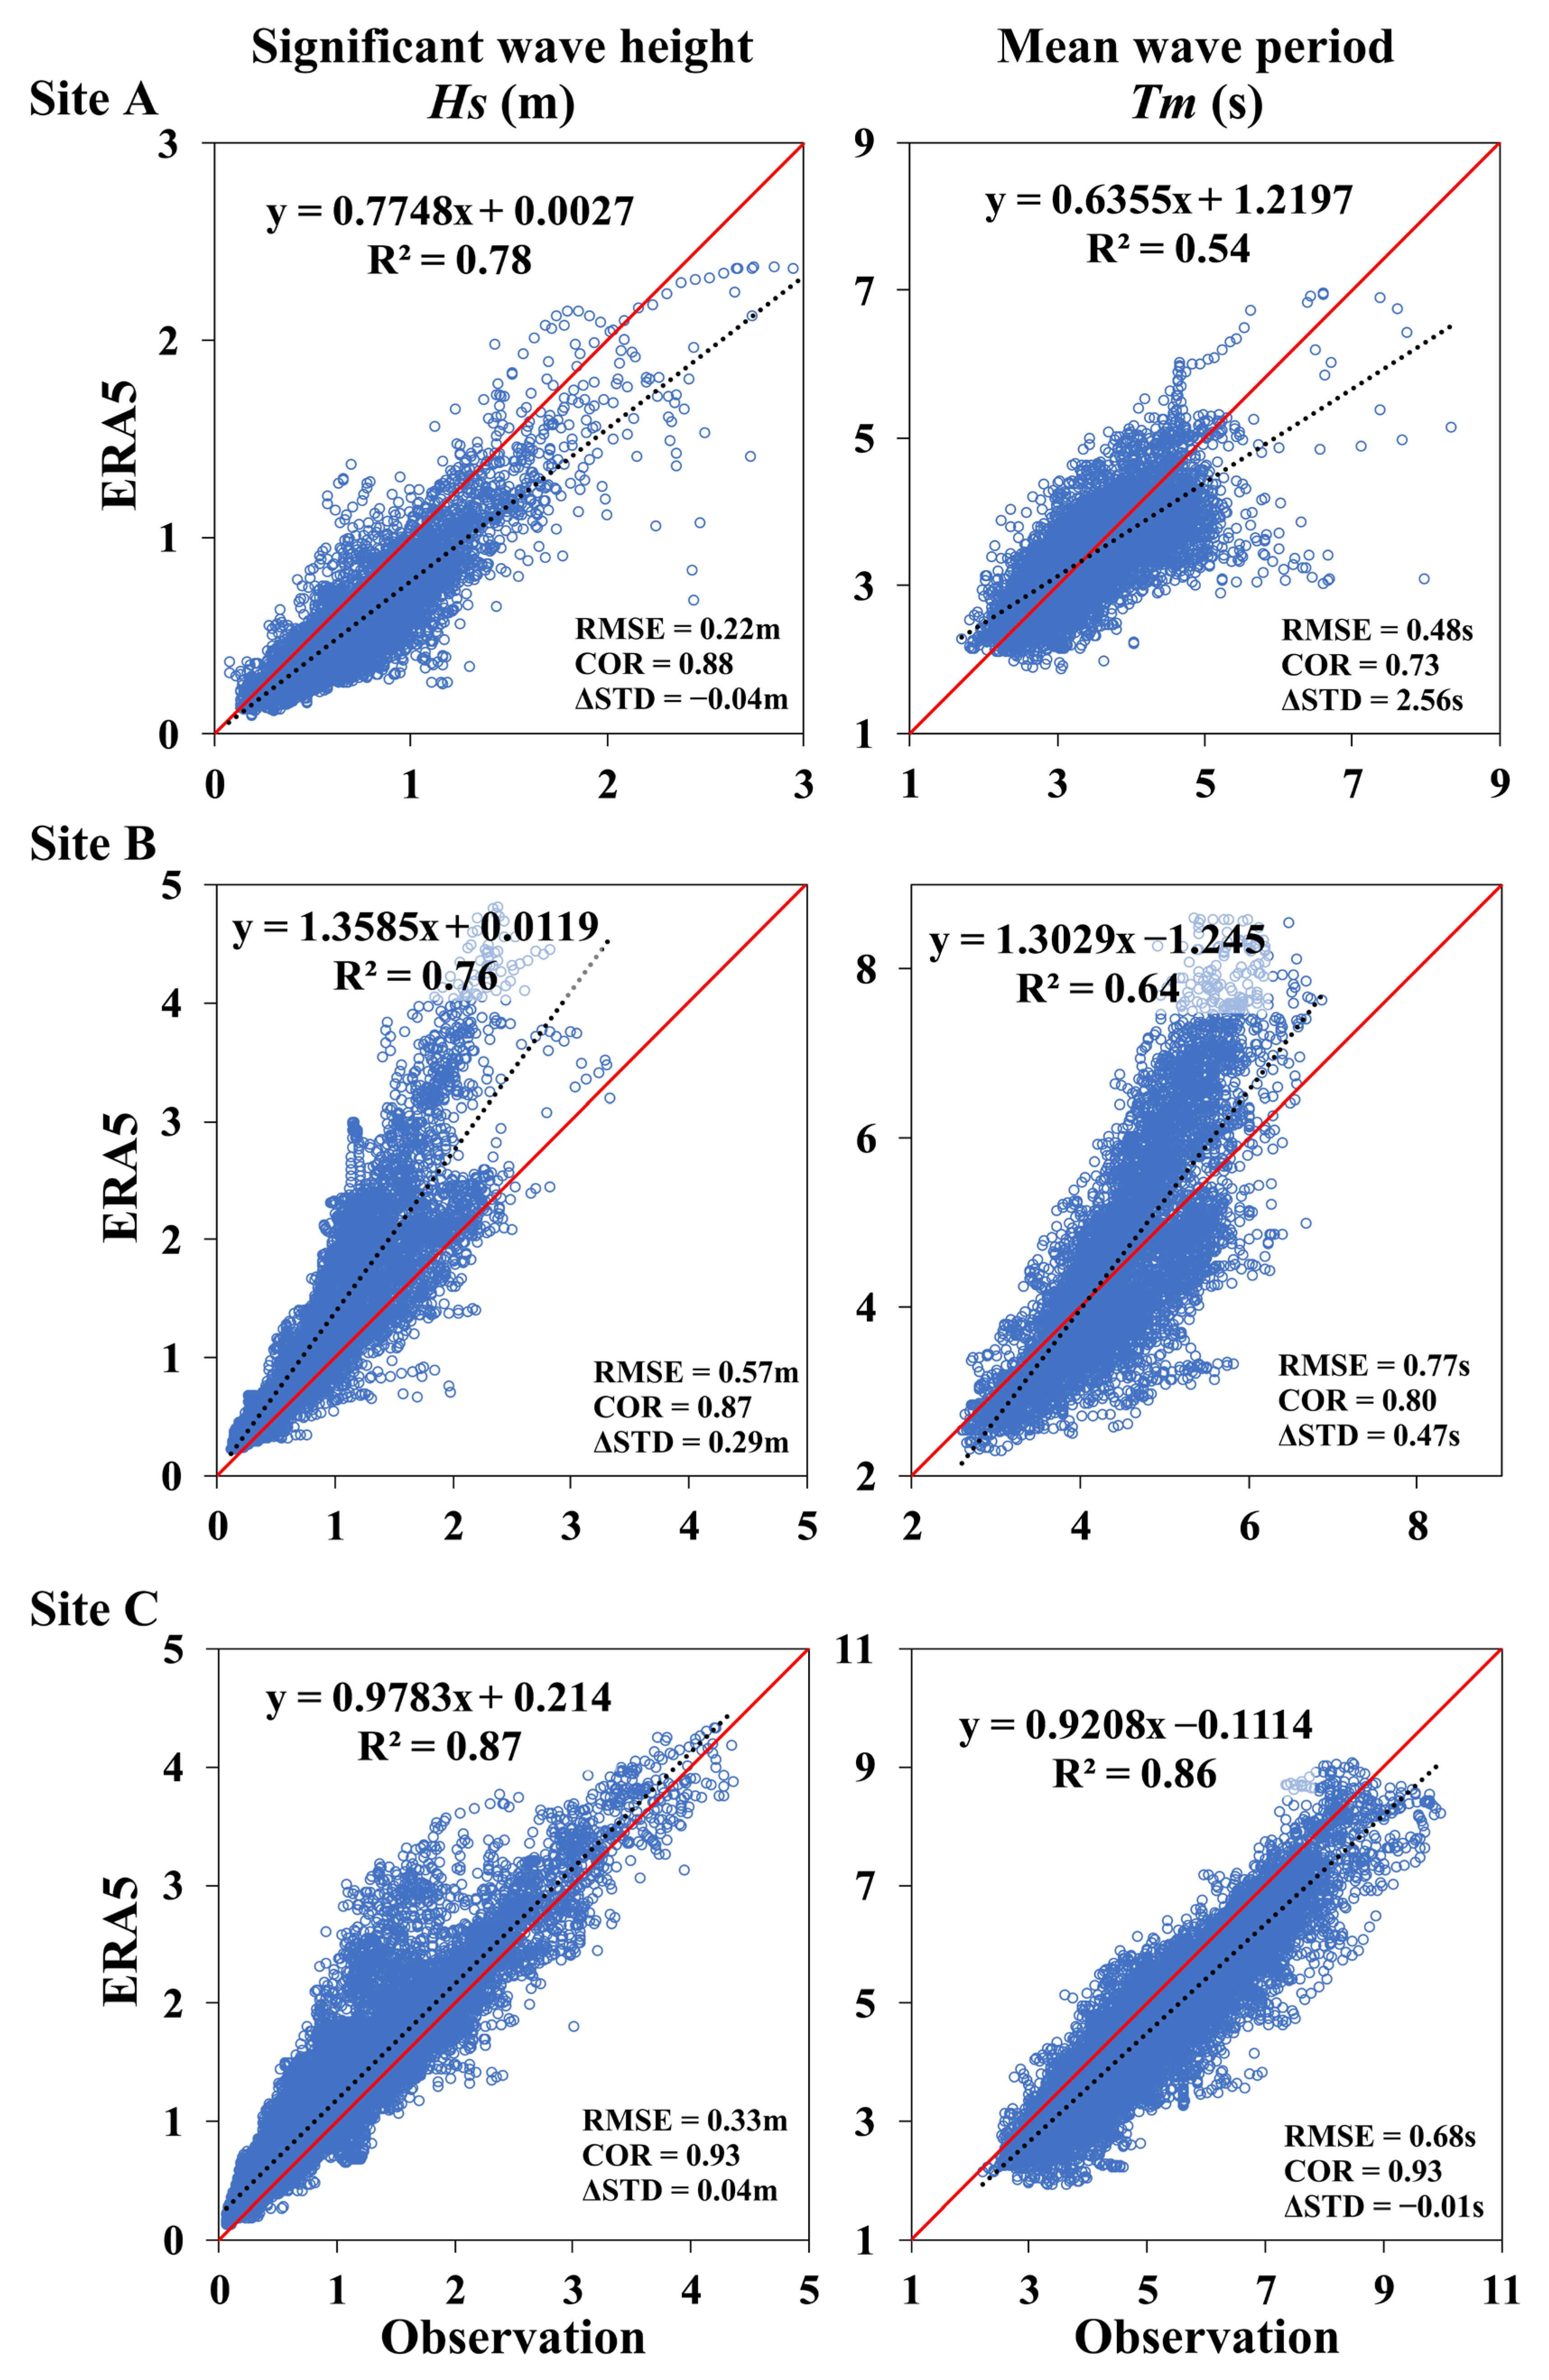
3.1. Comparison of Basic Wave Parameters

ERA5 data are matched and compared with field observation data at the three sites. Generally, the results show that the wave parameters of ERA5 have good quality in the SCS. As shown in Figure 2, at the three sites, Hs and Tm obtained from ERA5 are in good agreement with the field observational data. For example, the RMSEs of Hs at A, B, and C sites are only 0.22 m, 0.57 m, and 0.33 m, respectively, while the CORs are as high as 0.88, 0.87, and 0.93, respectively. The longest observational period of Site C is 31 months. Either for Hs or Tm, the COR between ERA5 and observational data is as high as 0.93, and the deviation in STD is close to zero, which indicates that ERA5 data and observational data are highly consistent at the site. This consistency with the long-term continuity of the observations demonstrates the accuracy and reliability of ERA5 data.
In addition, by comparing the corresponding indexes of Hs and Tm, the Tm performance of ERA5 data is slightly worse than that of Hs. Especially for Site A, the output of Tm is worse than that of Site C, which may be affected by offshore topography and boundary. For example, COR is 0.2 lower than that of Site C, and the deviation in STD from the measured value is 2.56 s, which is much higher than that of Site C.
The wave rose diagrams of the three sites are illustrated based on ERA5 data and in situ data, respectively (Figure 3). It can be seen from the diagrams that ERA5 data can well describe the general characteristics of wave propagation in the SCS. At the offshore Sites B and C in particular, the wave propagation directions of ERA5 data are nearly the same as that of the observational data. However, for the nearshore Site A, the deviation in wave propagation direction is relatively obvious. The true waves are mainly from SSW, whilst in ERA5 they are mainly from SSE. This deviation may be due to the wave propagation direction being controlled by the shoreline [4,28], however, the spatial resolution of the numerical model is not sufficient to accurately characterize the complex changes of the shoreline.

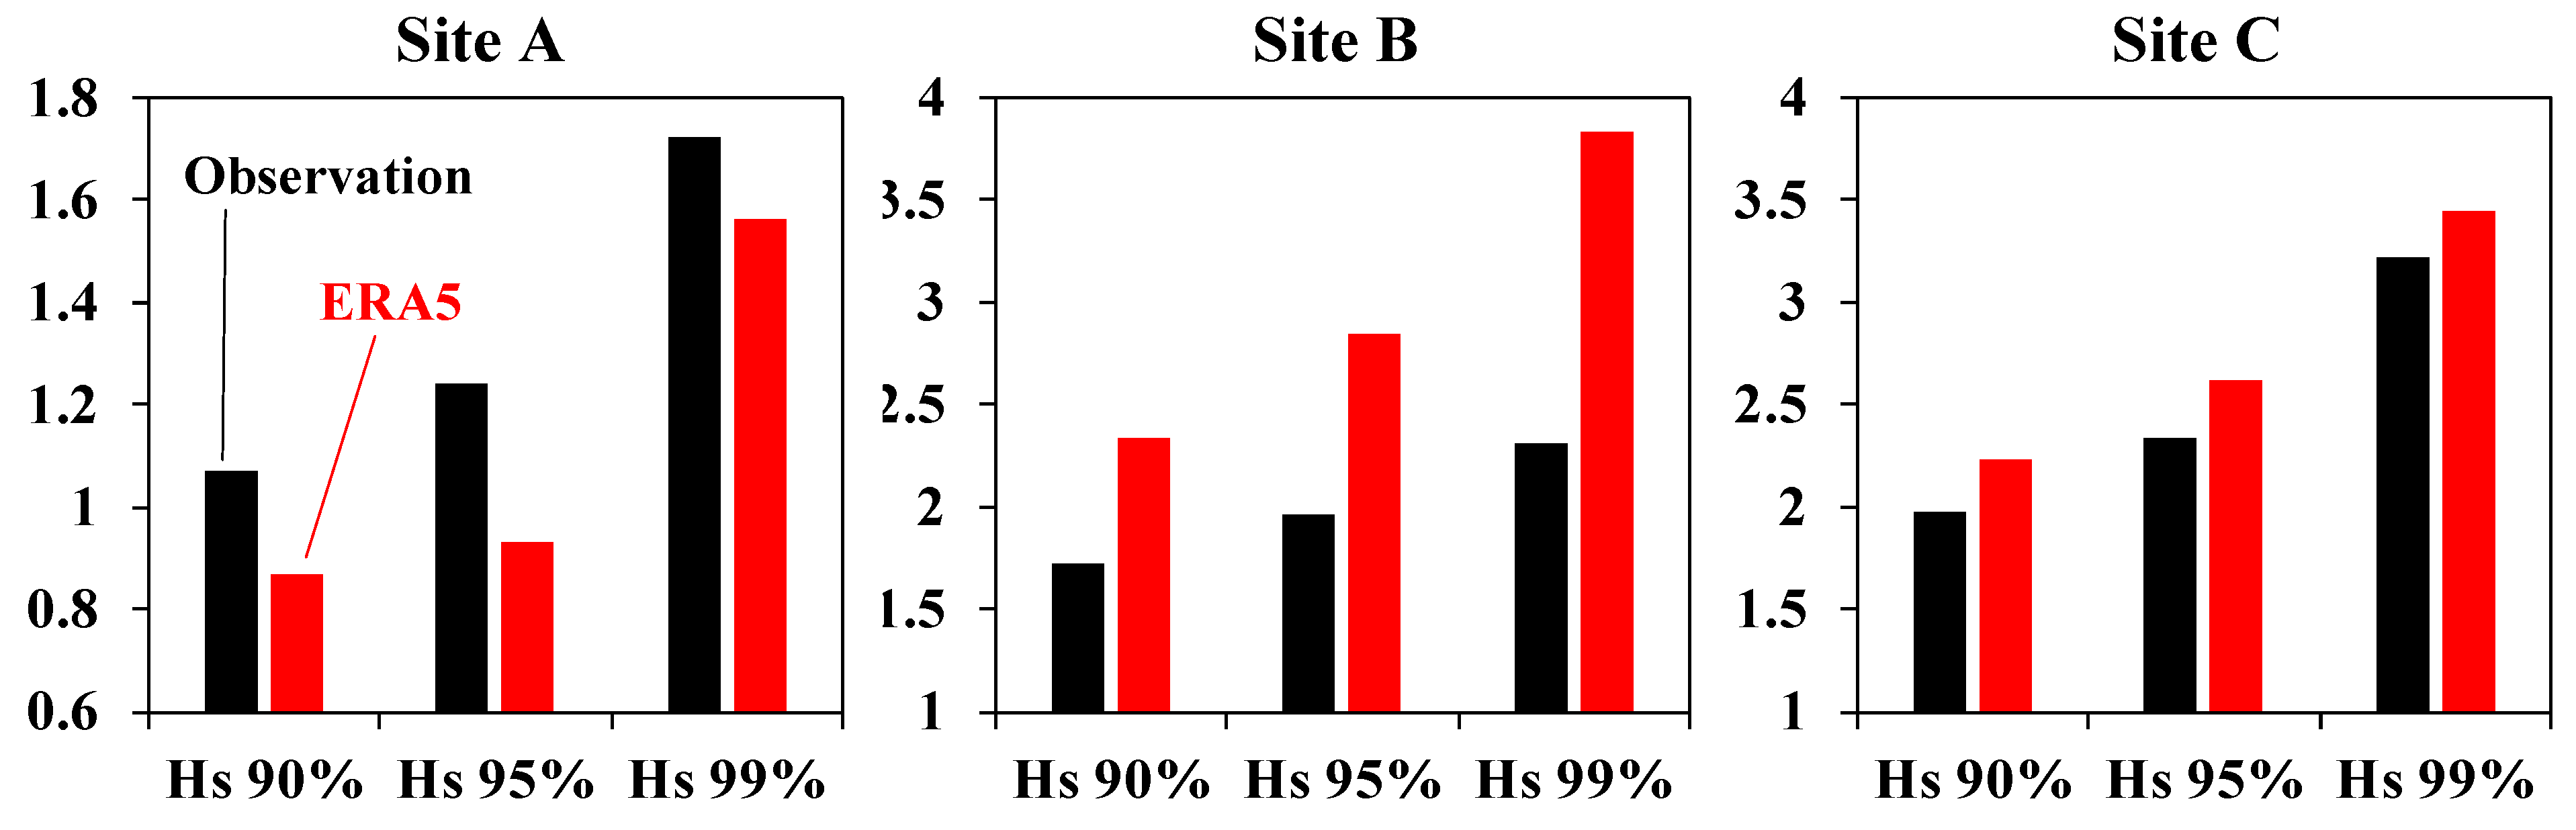
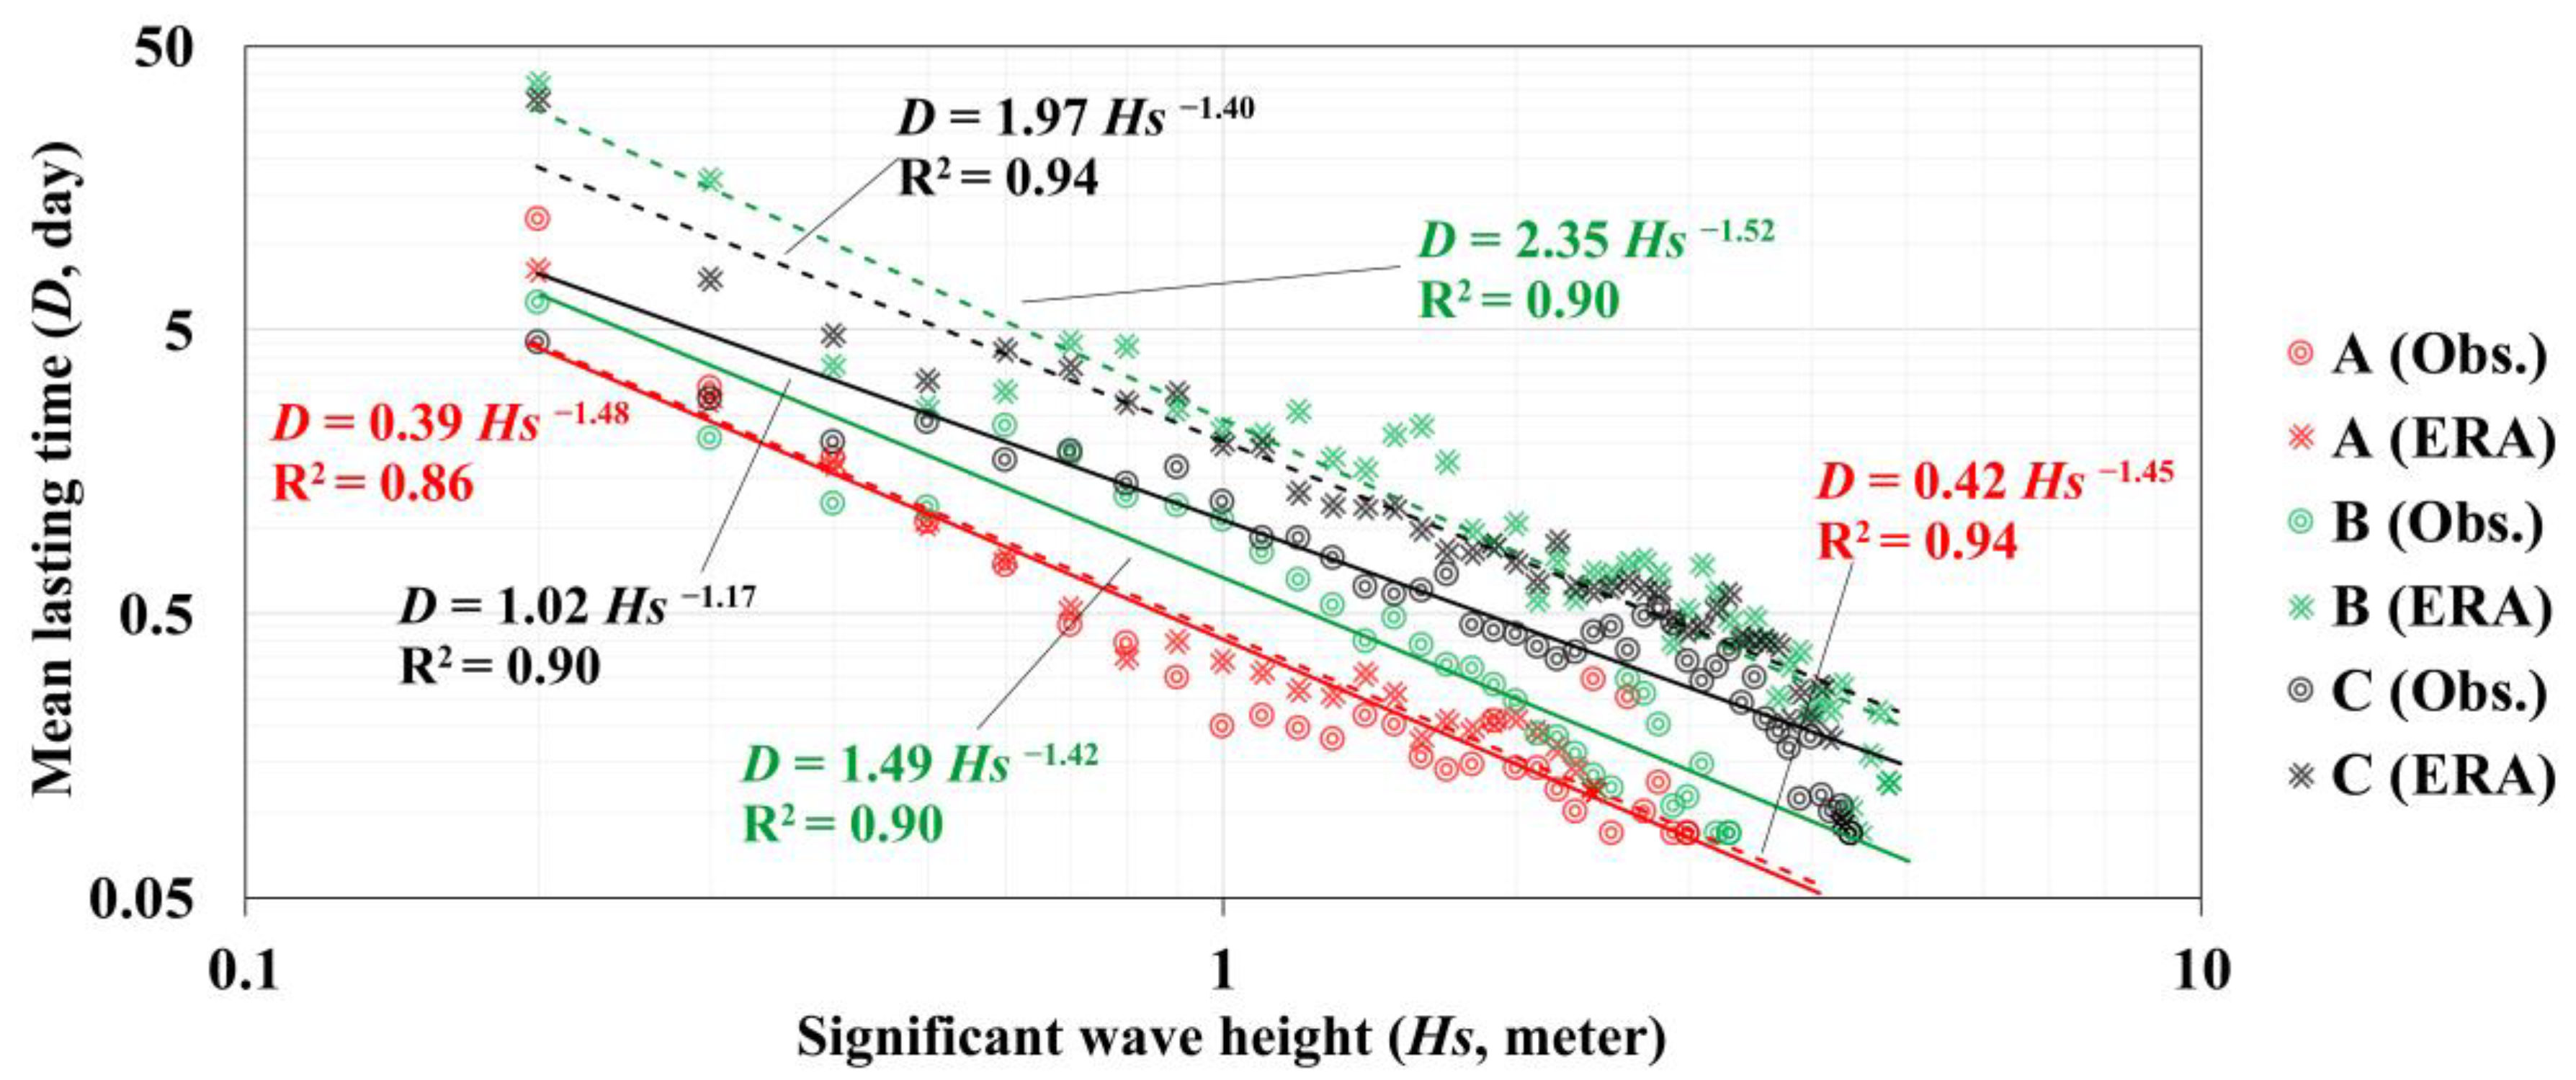
3.2. Comparison of Wave Parameters for Engineering Application

In practical engineering applications, it is usually necessary to extract some typical indexes based on wave data, to provide a reference for the engineering design. In order to verify the performance of ERA5 wave data in engineering applications, several commonly characteristic wave parameters are calculated by ERA5 data and observational data, respectively, and the calculated results of two sets of data are also compared. It is found that the 90%, 95%, and 99% large Hs calculated by ERA5 data are quite different from the corresponding measured results in the same period (Figure 4). For nearshore areas, ERA5 data underestimates the 90%, 95%, and 99% large Hs, whilst for the offshore areas, ERA5 data is overestimated. For example, at Sites A and B, the 95% large Hs are 1.24 m and 1.96 m, while the 95% large Hs based on ERA5 are 0.93 m and 2.85 m, with remarkably relative errors of 25% and 45%, respectively.
The relations of specific Hs and their average duration time were fitted by Equation (4) for the three sites, based on the ERA5 data and the observational data, respectively (Figure 5). The results show that both datasets are in accord with the empirical relationship. However, there is a significant difference in the average duration time when using different dataset fitting relationships. Especially for Sites A and B, the duration of Hs based on ERA5 data is significantly longer than that based on observational data. For example, for Hs greater than one meter, based on the fitted equations, the average durations at Site B based on ERA5 data and measured data are 1.49 days and 2.35 days, respectively, and those at Site C based on ERA5 data and measured data are 1.02 days and 1.97 days, respectively. The relative errors are as high as 58% and 93%, respectively.
The results in this section indicate that the wave engineering parameters deduced from the ERA5 dataset may not be as reliable as those deduced from in situ observations. For wave information serving engineering construction, we can not rely too much on numerical models and reanalysis data. It is necessary to calibrate and revise the data through adequate in situ observations.
It should be noted that due to the relatively limited period of observation data, this study does not involve the comparison of extreme wave parameters. The calculation of extreme wave height distribution usually needs to be based on over 50 years’ worth of data [1], which is difficult to provide using the current observation data.

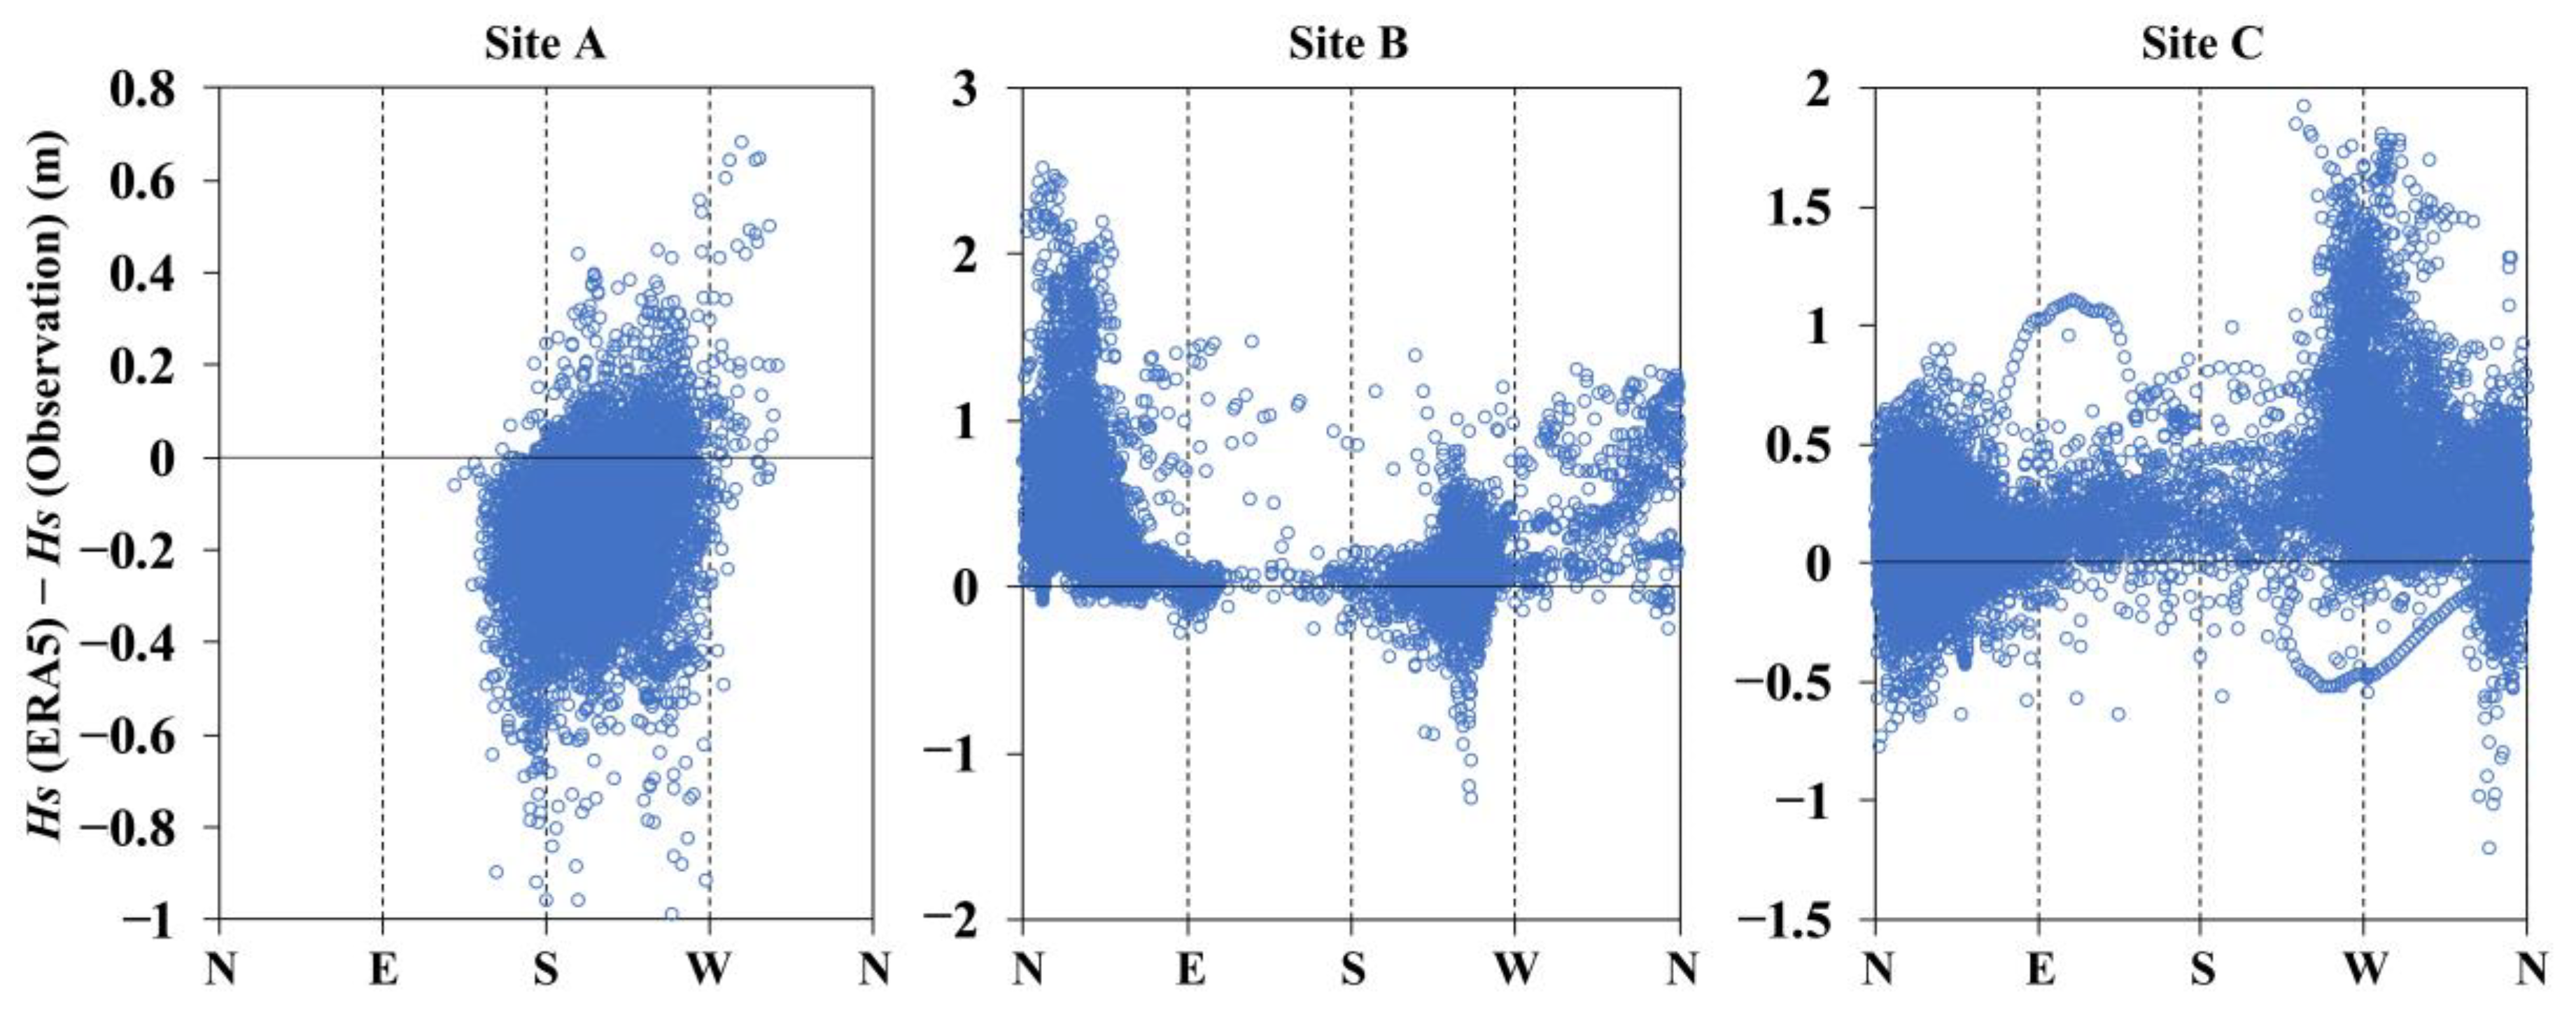
3.3. Analysis of Factors Causing Wave Parameter Error

As mentioned above, although ERA5 wave data agree well with the observational data, there are still some errors in some conditions. In particular, the wave period information is not as accurate as the wave height information (Figure 2), similar to the results of the previous analysis [16,24]. Moreover, engineering wave parameters extracted from ERA5 are also quite different from the results based on observational data (Figure 4 and Figure 5). These errors may be due to insufficient representation of the effects of coastal topography and shoreline on wave propagation in the numerical models. Wave dynamic processes, including surface waves, internal waves [29], and abyssal Rossby waves [30,31], are generally very sensitive to the effects of topographic boundary conditions. In this study, influenced by shallow water topography and shoreline in the continental shelf area, waves will refract and become shoreward propagation [4,28]. However, the capability of offshore boundary characterization directly limits the accuracy of the model calculation of coastal waves. For example, the shoreline to the north of Site A shows an SW–NE trend on the regional scale (Figure 1), but the shoreline is NW–SE trending locally. The resolution of the model cannot reflect this subtle change in the shoreline precisely, which results in a difference in the propagation direction between the simulated results and the in situ measurements (Figure 3).
Such influence also exists in the deep waters of the SCS with many islands and reefs. The wave process in the SCS is dominated by swell components [6,24]. Waves enter the SCS through the Luzon Strait from the western Pacific Ocean and mainly travel from the northeast to the southwest in the SCS. Meanwhile, during the summer, driven by the southwest wind, waves mainly travel northeastward in the southern SCS [5,6,24]. During these propagations, the waves frequently experience shoreline boundaries and the shallow water terrain of a large number of islands and reefs. These local factors inevitably lead to changes in the wave parameters [10,17,18]. This effect is difficult to effectively describe in conventional numerical models [9,10]. For example, the spatial scale of an island reef is generally hundreds of meters [19], while the horizontal spatial resolution of ERA5 data in the SCS is about 27 km, i.e., its spatial resolution is usually limited, regardless of the impact on the island reef or continental shoreline changes. The results of the wind–wave coupling model also show that the lack of ability to depict swell is often the main reason for the error of the wave model under the large wave conditions, such as typhoons [2].
Such influence of complex terrain factors on ERA5 data can be supported by further analyzing the distribution of ERA5 error with wave direction (Figure 6). It is found that the error of ERA5 Hs is related to the wave direction. For example, due to the seasonally reversed wind fields [7], the waves at Sites B and C mainly come from the northeast or southwest (Figure 3), however, the Hs error from the northeast wave at Site B is greater than that from the southwest wave. At Site C, on the contrary, the error of Hs from the northeast wave is smaller than that from the western wave. This difference may be due to the topographic differences experienced before the waves reach the sites. As seen in Figure 1, the waves from the northeast will experience more reefs and shallow topography than the waves from the southwest to Site B, the waves will thus be more distorted by topography and shoreline factors. The error of Hs calculated will be larger, probably due to the numerical model being too difficult to fully consider the influence of the terrain and coastline [4,8]. Contrary to Site C, the southwest incoming wave has more reefs to go through than the northeast one, and thus, the error of ERA5 Hs is greater for waves from the southwest.

4. Conclusions

In this study, two sets of buoys in a deep-sea and a subsea-based platform in the nearshore area of the South China Sea (SCS) are used to systematically verify the wave parameters of the European Centre for Medium-Range Weather Forecasting Reanalysis v5 (ERA5) dataset. The results show that the wave parameters, such as significant wave height (Hs) and mean wave period provided by ERA5, have high accuracy in the SCS. Compared to the observational data, the correlation coefficient of Hs is in the range of 0.87–0.93, the root mean square error is in the range of 0.22–0.57 m, and the difference in the standard deviation is very close to zero. However, if the ERA5 data is applied to the engineering field, for example, and the design parameters such as 90%, 95%, and 99% large Hs and the duration time for certain Hs are calculated, it is found that the results are easy to deviate from the actual observational values, which may mislead the engineering design.
Further analysis indicates that the differences in the wave parameters of ERA5 reanalysis compared to the in situ measurements could be attributed to the fact that numerical models are difficult to fully characterize the influence of terrain and coastline on the wave dynamics. For the nearshore site A, due to the limitation of the model resolution, it can not accurately consider the local subtle changes of the shoreline trend, resulting in the difference in the wave propagation direction. For offshore sites B and C, the wave propagation to the sites needs to go through numerous reefs, and such abrupt local topographic changes are difficult to depict in the model. There are more reefs in the northeast (west) for Site B (C), thus the simulation error of Hs from the northeast (west) is larger. As most waves in the SCS come from the northeast, the error of Site B is generally larger than that of other sites.
Our results show that the ERA5 data is more effective if it is applied to scientific research, monitoring, business, or other conventional applications. However, for the acquisition of wave information serving the engineering construction, to ensure the reliability of the data, it is still necessary to calibrate and verify the model data with the in situ observations.

Author Contributions

Conceptualization, J.L. (Junmin Li) and J.Y.; methodology, B.L.; software, W.C.; validation, W.C.; formal analysis, J.L. (Junliang Liu); investigation, B.L.; resources, J.L. (Junliang Liu); data curation, B.L.; writing—original draft preparation, J.L. (Junliang Liu) and B.L.; writing—review and editing, J.L. (Junmin Li); visualization, J.L. (Junliang Liu); supervision, J.L. (Junmin Li) and J.Y.; project administration, J.L. (Junmin Li) and J.Y.; funding acquisition, J.L. (Junmin Li) and J.Y. All authors have read and agreed to the published version of the manuscript.

Funding

This study is supported by the National Key Research and Development Program of China (2021YFC3100501), the Key Special Project for Introduced Talents Team of Southern Marine Science and Engineering Guangdong Laboratory (Guangzhou) (GML2019ZD0303), the Hainan Provincial Natural Science Foundation of China (422MS160), the Science and Technology Planning Project of Guangdong Province of China (2021B1212050023), CAS Key Laboratory of Science and Technology on Operational Oceanography (OOST2021-02), Guangzhou Science and Technology Project (202102020464), and the Strategic Priority Research Program of the Chinese Academy of Sciences (XDA13030304).

Data Availability Statement

The data are available from the corresponding author by request.

Acknowledgments

The analysis in this study is supported by the High-Performance Computing Division at the South China Sea Institute of Oceanology.

Conflicts of Interest

The authors declare no conflict of interest.

References

  1. Wu, Z.; Chen, J.; Jiang, C.; Deng, B. Simulation of extreme waves using coupled atmosphere-wave modeling system over the South China Sea. Ocean Eng. 2021, 221, 108531. [Google Scholar] [CrossRef]
  2. Niu, Q.; Feng, Y. Relationships between the typhoon-induced wind and waves in the northern South China Sea. Geophys. Res. Lett. 2021, 48, e2020GL091665. [Google Scholar] [CrossRef]
  3. Li, B.; Chen, W.; Liu, J.; Li, J.; Wang, S.; Xing, H. Construction and application of nearshore hydrodynamic monitoring system for uninhabited islands. J. Coast. Res. 2020, 99, 131–136. [Google Scholar] [CrossRef]
  4. Chen, W.; Liu, J.; Li, J.; Sun, L.; Li, B.; Xing, H.; Shi, P. Wave energy assessment for the nearshore region of the northern South China Sea based on in situ observations. Energy Rep. 2022, 8, 149–158. [Google Scholar] [CrossRef]
  5. Li, B.; Li, J.; Liu, J.; Tang, S.; Chen, W.; Shi, P.; Liu, Y. Calibration experiments of CFOSAT wavelength in the Southern South China Sea by artificial neural networks. Remote Sens. 2022, 14, 773. [Google Scholar] [CrossRef]
  6. Su, H.; Wei, C.; Jiang, S.; Li, P.; Zhai, F. Revisiting the seasonal wave height variability in the South China Sea with merged satellite altimetry observations. Acta Oceanol. Sin. 2017, 36, 38–50. [Google Scholar] [CrossRef]
  7. Chu, P.C.; Qi, Y.; Chen, Y.; Shi, P.; Mao, Q. South China Sea wind-wave characteristics. Part I: Validation of Wavewatch-III using TOPEX/Poseidon data. J. Atmos. Ocean. Technol. 2004, 21, 1718–1733. [Google Scholar] [CrossRef] [Green Version]
  8. Li, B.; Li, J.; Li, Y.; Zhang, Z.; Shi, P.; Liu, J.; Chen, W. Application of artificial neural network to numerical wave simulation in the coastal region of island. J. Xiamen Univ. 2020, 59, 420–427. (In Chinese) [Google Scholar] [CrossRef]
  9. Sun, Z.; Zhang, H.; Xu, D.; Liu, X.; Ding, J. Assessment of wave power in the South China Sea based on 26-year high-resolution hindcast data. Energy 2020, 197, 117218. [Google Scholar] [CrossRef]
  10. Sun, Z.; Zhang, H.; Liu, X.; Ding, J.; Cai, Z. Wave energy assessment of the Xisha Group Islands zone for the period 2010–2019. Energy 2021, 220, 119721. [Google Scholar] [CrossRef]
  11. Cousineau, J.; Murphy, E. Numerical investigation of climate change effects on storm surges and extreme waves on Canada’s Pacific coast. Atmosphere 2022, 13, 311. [Google Scholar] [CrossRef]
  12. Jeong, S.-H.; Heo, K.-Y.; Son, J.-H.; Jo, Y.-H.; Choi, J.-Y.; Kwon, J.-I. Characteristics of swell-like waves in the east coast of Korea using atmospheric and wave hindcast data. Atmosphere 2022, 13, 286. [Google Scholar] [CrossRef]
  13. Hersbach, H.; Bell, B.; Berrisford, P.; Biavati, G.; Horányi, A.; Muñoz Sabater, J.; Nicolas, J.; Peubey, C.; Radu, R.; Rozum, I.; et al. ERA5 Hourly Data on Single Levels from 1979 to Present; Copernicus Climate Change Service (C3S) Climate Data Store (CDS): Reading, UK, 2018. [Google Scholar] [CrossRef]
  14. ECMWF IFS Documentation CY47R3—Part VII: ECMWF Wave Model. 2021. Available online: https://www.ecmwf.int/node/20201 (accessed on 31 December 2021).
  15. Wang, J.; Liu, J.; Wang, Y.; Liao, Z.; Sun, P. Spatiotemporal variations and extreme value analysis of significant wave height in the South China Sea based on 71-year long ERA5 wave reanalysis. Appl. Ocean Res. 2021, 113, 102750. [Google Scholar] [CrossRef]
  16. Shi, H.; Cao, X.; Li, Q.; Li, D.; Sun, J.; You, Z.; Sun, Q. Evaluating the accuracy of ERA5 wave reanalysis in the water around China. J. Ocean Univ. China 2021, 20, 1–9. [Google Scholar] [CrossRef]
  17. Tolman, H. Treatment of unresolved islands and ice in wind wave models. Ocean Model. 2003, 5, 219–231. [Google Scholar] [CrossRef]
  18. Mao, K.; Chen, X.; Wang, L. Research progress of spectral wave mode of archipelago or reef ocean region. Acta Oceanol. Sin. 2014, 36, 161–169. (In Chinese) [Google Scholar] [CrossRef]
  19. Jiang, H.; Su, F.; Zhou, C.; Yang, X.; Wang, Q.; Cheng, F. The geographical characteristics of Nansha Islands in the South China Sea. J. Geogr. Sci. 2018, 28, 957–972. [Google Scholar] [CrossRef] [Green Version]
  20. Bruno, M.F.; Molfetta, M.G.; Totaro, V.; Mossa, M. Performance assessment of ERA5 wave data in a swell dominated region. J. Mar. Sci. Eng. 2020, 8, 214. [Google Scholar] [CrossRef] [Green Version]
  21. Tarek, M.; Brissette, F.P.; Arsenault, R. Evaluation of the ERA5 reanalysis as a potential reference dataset for hydrological modelling over North America. Hydrol. Earth Syst. Sci. 2020, 24, 2527–2544. [Google Scholar] [CrossRef]
  22. Molina, M.O.; Gutiérrez, C.; Sánchez, E. Comparison of ERA5 surface wind speed climatologies over Europe with observations from the HadISD dataset. Int. J. Climatol. 2021, 41, 4864–4878. [Google Scholar] [CrossRef]
  23. Shikhovtsev, A.Y.; Kovadlo, P.G.; Khaikin, V.B.; Nosov, V.V.; Lukin, V.P.; Nosov, E.V.; Torgaev, A.V.; Kiselev, A.V.; Shikhovtsev, M.Y. Atmospheric conditions within big telescope alt-azimuthal region and possibilities of astronomical observations. Remote Sens. 2022, 14, 1833. [Google Scholar] [CrossRef]
  24. Li, B.; Chen, W.; Li, J.; Liu, J.; Shi, P.; Xing, H. Wave energy assessment based on reanalysis data calibrated by buoy observations in the southern South China Sea. Energy Rep. 2022, 8, 5067–5079. [Google Scholar] [CrossRef]
  25. Lawson, N.V.; Abernethy, C.L. Long term wave statistics off Botany Bay. In Second Australian Conference on Coastal and Ocean Engineering, 1975: The Engineer, the Coast and the Ocean; The Institution of Engineers: Sydney, Australia, 1975; pp. 169–178. Available online: https://search.informit.org/doi/10.3316/informit.914127290484662 (accessed on 31 December 2021).
  26. Graham, C. The parameterisation and prediction of wave height and wind speed persistence statistics for oil industry operational planning purposes. Coast. Eng. 1982, 6, 303–329. [Google Scholar] [CrossRef]
  27. Feng, X.; Li, J.; Yin, B.; Yang, D.; Chen, H.; Gao, G. Characteristics of ocean waves in coastal area of Dongfang, Hainan Island based on observations. J. Trop. Oceanogr. 2018, 37, 1–8. (In Chinese) [Google Scholar] [CrossRef]
  28. Wang, H.; Fu, D.; Liu, D.; Xiao, X.; Liu, B. Analysis and prediction of significant wave height in the Beibu Gulf, South China Sea. J. Geophys. Res. Oceans 2021, 126, e2020JC017144. [Google Scholar] [CrossRef]
  29. Chang, M.-H.; Lien, R.-C.; Lamb, K.G.; Diamessis, P.J. Long-term observations of shoaling internal solitary waves in the northern South China Sea. J. Geophys. Res. Ocean. 2021, 126, e2020JC017129. [Google Scholar] [CrossRef]
  30. Quan, Q.; Cai, Z.; Jin, G.; Liu, Z. Topographic rossby waves in the abyssal South China Sea. J. Phys. Oceanogr. 2021, 51, 1795–1812. [Google Scholar] [CrossRef]
  31. Zheng, H.; Zhu, X.-H.; Zhang, C.; Zhao, R.; Zhu, Z.-N.; Liu, Z.-J. Propagation of topographic rossby waves in the deep basin of the South China Sea based on abyssal current observations. J. Phys. Oceanogr. 2021, 51, 2783–2791. [Google Scholar] [CrossRef]
Figure 1. Topography of the South China Sea and the locations of three observation sites (A, B, and C) in this study.
Atmosphere 13 00935 g001
Figure 2. Comparison of significant wave height and mean wave period output by ERA5 model with measured data. The upper, middle, and lower panels display the results of Sites A, B, and C, respectively. The blue circles are scattered plots of observations compared with ERA5, and black dotted lines are corresponding fitting lines, whose formulas are shown in the upper left corner. The red lines are the 1:1 lines.
Atmosphere 13 00935 g002
Figure 3. Comparison of wave roses between ERA5 model output and in situ measured data. The upper, middle, and lower panels display the results of Sites A, B, and C, respectively.
Atmosphere 13 00935 g003
Figure 4. Comparison of ERA5 model output (red) with in situ measured data (black) in statistical 90%, 95%, and 99% significant wave heights (Hs, m). The left, middle, and right panels display the results of Sites A, B, and C, respectively.
Atmosphere 13 00935 g004
Figure 5. Variation in mean lasting duration (D) of different significant wave heights (Hs) calculated from ERA5 model output and in situ observations.
Atmosphere 13 00935 g005
Figure 6. The error of ERA5 significant wave height compared with in situ observations in functions of wave direction for the three sites. The left, middle, and right panels display the results of Sites A, B, and C, respectively.
Atmosphere 13 00935 g006
Table 1. Information on observation sites.
SiteLongitude and LatitudeDepthObservation Period
A18.3° N, 109.0° E12 mJune 2020 to September 2021
B9.5° N, 113.0° E1240 mOctober 2020 to October 2021
C10.0° N, 115.5° E1200 mNovember 2018 to June 2021
Publisher’s Note: MDPI stays neutral with regard to jurisdictional claims in published maps and institutional affiliations.

