1. Introduction
Heavy diesel vehicles have become one of the focuses of vehicle emission control in Beijing, which is a key objective in the battle to protect the blue skies of Beijing. It is estimated that heavy diesel vehicles accounted for about 4% of the number of vehicles registered in Beijing. However, its emissions of nitrogen oxide and particulate matter accounted for 50% and 90% of the total emissions of motor vehicles, respectively [
1]. However, emissions from vehicles registered in other cities but traveling in Beijing have not been included in this estimation, implying that the actual levels of emission pollution could be even more serious.
In addition, the National Blue Sky Protection Act has put forward the elimination of 3 million diesel trucks, which are only satisfactory for the China Stage III emission standards or below, and strengthened the monitoring and management of heavy diesel vehicles. With the elimination of vehicles due to the China III limits, the proportion of heavy diesel vehicles, despite China IV’s limits and above, have continuously increased [
2]. The OBD system and the emission reduction device, such as selective catalytic reduction (SCR), diesel oxidation catalyst (DOC), diesel particulate filter (DPF), etc., [
3,
4,
5] should be installed in the heavy diesel vehicles outlined by China IV and above, according to the emission regulation requirements. The OBD system has recently been deployed in a number of vehicles to monitor the emissions in a real-time fashion, as the OBD system is normally equipped with a set of hardwares, such as an electronic control unit (ECU), a fault indicator, and various sensors (e.g., throttle position, fuel injection system, speed, coolant temperature, oxygen sensor, etc.) [
6,
7,
8], and softwares, including troubleshooting codes and calibration-related files.
Due to the so-called “trade-off” relationship between the production of NO
x and PM in the exhaust pollutants produced by combustion in engine cylinders, additional after-treatment emission reduction devices must be added to filter the pollutants before emitting exhaustive gas. After-treatment devices convert toxic exhaust pollutants into CO
2, N
2 and water via a series of catalyzed reactions. Current devices commonly used to reduce emissions include DOC, DPF and SCR [
1,
9,
10]. Enterprises can choose one or more emission reduction devices according to the initial emission level of the engine and the difference in the limit value required by the standard regulations in different emission stages.
However, due to a lack of scientific, accurate and effective measurement data collection and analysis methods, it has been frequently found that pollutants are still emitted, even though the after-treatment device is properly installed. This issue can result from various reasons, such as a low urea level or the malfunction of filters, etc., and such problems cannot promptly be perceived if the OBD system functions improperly or data are missing due to vibrations or a weak signal transmission. Therefore, the excessive emissions of heavy diesel vehicles is still a serious problem.
To facilitate a rapid identification of excessive emissions, this study attempts to develop a general and systematic framework for the determination of excessive emissions based on the OBD data with different data quality. When all variables contain missing or abnormal values, the approach proposed will conduct a data repairing process. Two strategies have been developed for the situation where only the NOx data is problematic. One is to improve the data quality by using the other variables before identifying excessive emissions and the other is to directly predict whether the emission exceeds recommendations by using other variables without the data quality problem. To reduce the impact of noise and extreme values, three methods, based on the moving average principle, have been developed to generate an aggregated emission level, which is used as a basis for excessive emission identification. In the experimental study, we employed a number of machine learning algorithms to achieve data repairing and prediction. The experimental results indicate that the repair accuracy can be achieved with R2 in a range from 0.95 to 1 by the test algorithms.
The rest of this paper is organized as follows. The next section briefly reviews the current status of the relevant research.
Section 3 outlines the framework for the method proposed to identify the possibility of excessive emissions based on the OBD data. Before introducing the methods proposed to improve the quality of the OBD data in
Section 5, the method to assess data quality is presented in
Section 4.
Section 6 presents the methods developed to identify excessive emissions. The paper is concluded after presenting the experimental study in
Section 7.
2. Research Status
2.1. On-Board Diagnostic System
In April 2005, the technical requirements of the OBD system were clarified in the national vehicle emission regulations in China, and the experimental conditions of the ignition engine OBD system for engine misfire and oxygen sensor deterioration were clearly stipulated, along with some unique sensors, such as NO
x, urea quality and level sensors. In December 2005, Beijing took the lead in implementing China III, and in July 2007, China began to implement China III, requiring that the OBD system shall be equipped to newly registered light-duty vehicles. In July 2008, China required compression ignition engines and gas fuel ignition engine vehicles to be equipped with the OBD system when they reached China IV emission levels [
11,
12,
13].
2.2. Monitoring Status
With the release of the national China VII standards for heavy diesel vehicles, NO
x and particulate emission requirements are more stringent than before. In order to meet the requirements of the standard, vehicle emission control technology has become more mature, including the after-treatment and OBD technology. China VII standards include stricter OBD restrictions and more comprehensive monitoring items, as well as increased in-use performance monitoring rate (IUPR) requirements for in-use monitoring frequency. On 24 June 2008, the Ministry of Environmental Protection issued the “Technical Requirements for Compression Ignition and Gaseous Fuel Ignition Engines and Vehicle On-board Diagnostic (OBD) System”, which has been effective since 1 July 2008. According to the requirements of the regulations, the OBD system shall be employed as a requirement of China IV and China V certification. The NO
x controls are implemented in the China IV and VI emission stages. On 1 December 2017, Beijing issued the “Exhaust Pollutant Emission Limits and Measurement Methods of Heavy Duty Vehicles (OBD Law IV, Stage IV)”, in which the technical requirements, including the test methods, diagnostic signal techniques, the terminal of the online monitoring system and the communication data format for heavy vehicle emissions, are clearly specified [
14,
15].
2.3. Data Status
The OBD data have been mainly used for purposes including enterprise supervision by the government, as well as energy consumption and emissions management for enterprises [
16,
17,
18]. For example, one of the data sources for the online monitoring platform of the Ministry of Transport and Communications for operating vehicles comes from the OBD data. The main data items that can be collected based on the OBD technique are as follows: speed, atmospheric pressure, net benchmark engine maximum torque and engine output torque, friction torque, engine speed sensor output, engine fuel flow, inlet temperature and outlet temperature of the SCR, pressure difference in DPF, the inflow gas volume, liquid level, the engine coolant temperature, latitude and longitude, NO
x concentration, MIL light condition, fault code, fault code information list, diagnosis support status, diagnosis ready status, vehicle identification code, standard identifier, calibration verification code, and other data [
19,
20].
However, the quality of the data collected is generally not good enough to accurately identify the possible excessive emissions in many situations. There are phenomena of partial or total missing fields in different degrees, which affect the determination of the vehicles’ emissions in the monitoring stage.
3. The Overview of the Process to Determine Excessive Emission
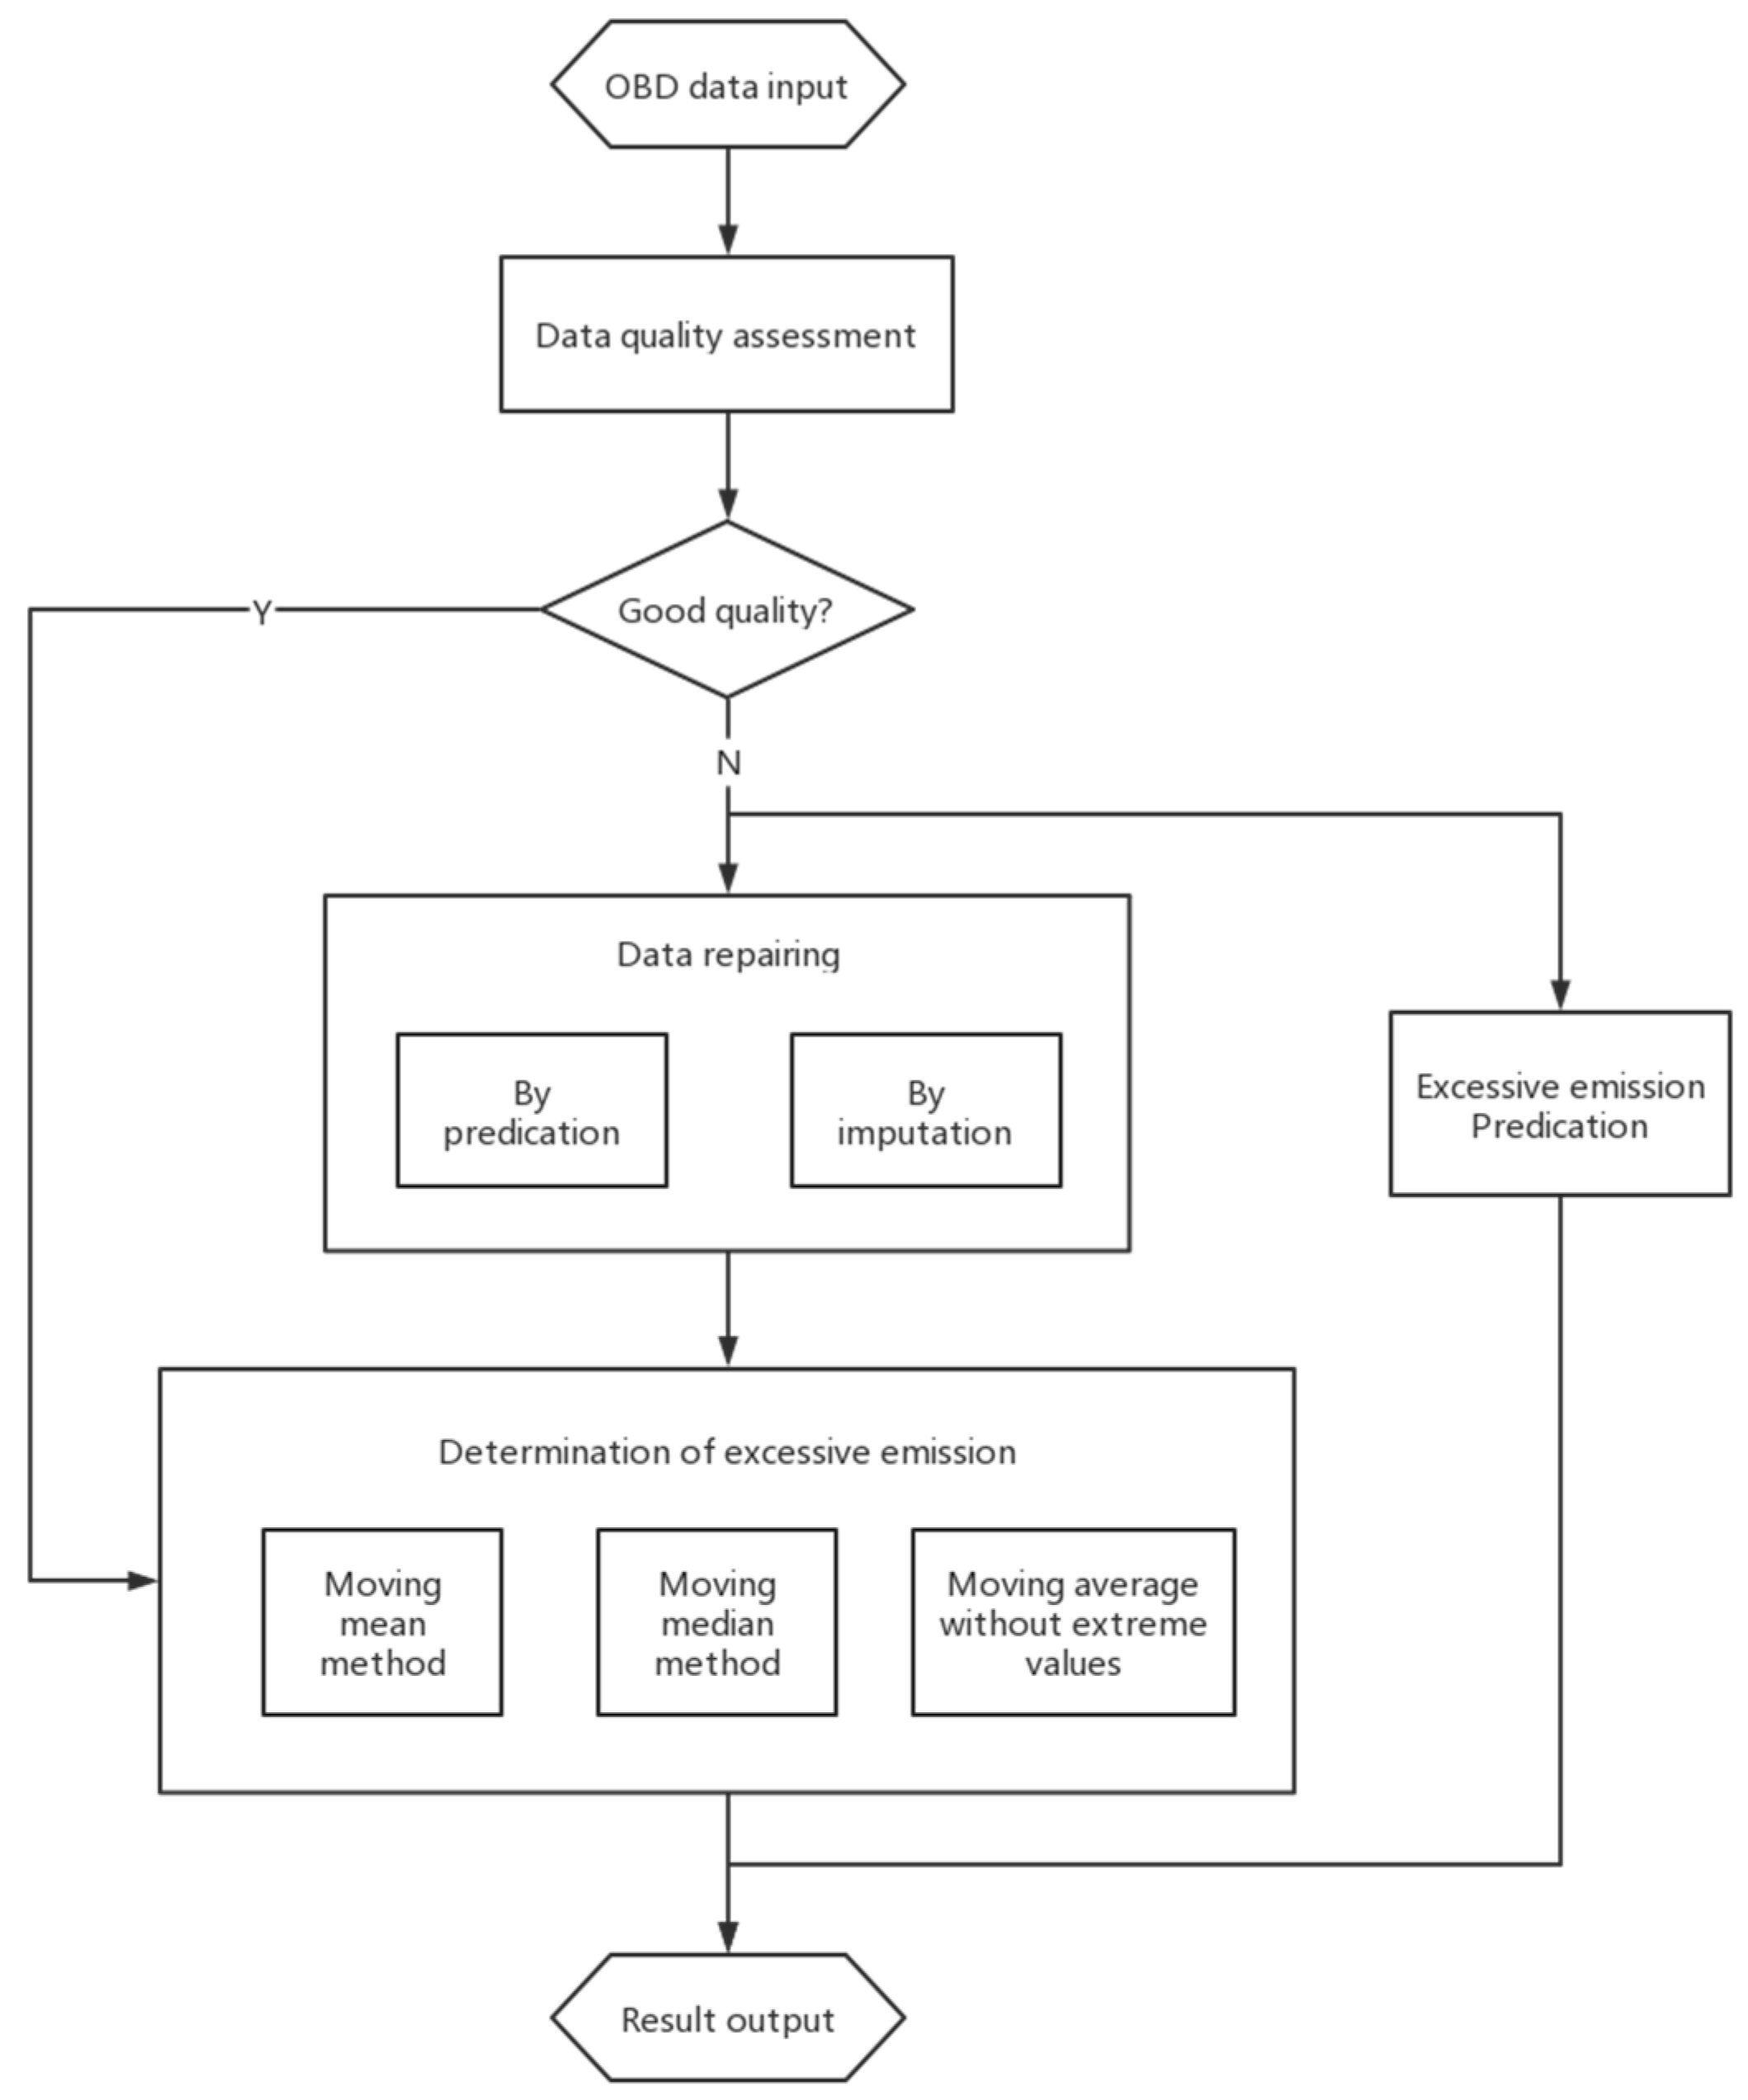
As shown in
Figure 1, the framework of the approach proposed for determining excessive emissions mainly consist of two parts, namely data repairing and excessive emission determination. The raw data from the OBD system is firstly accessed in terms of data quality. If there is a serious problem with the raw data, such as missing values or abnormal values, a repairing process will be performed to screen the possible abnormal values and impute missing data. Although it is also desired to filter the possible noise during the data repairing process, determining and filtering noise is often time-consuming and there is a risk that useful information embedded may be filtered out. Therefore, we removed this operation during the data repairing stage and integrated it into the process of excessive emission determination. To identify the possible excess in the emission, we have developed three methods with different de-noising characteristics, which will be introduced in detail in
Section 6. Although the OBD data is normally generated on a second basis, it is meaningless to directly use the instant value to determine the possibility of excessive emissions. Therefore, the so-called moving window technique is adopted in this study and a set of instant data over a predefined period (i.e., an observation window) is used to generate an aggregated result to estimate the emission level. This process continues by moving to the next set of data, including newly obtained data and excluding the most out-of-date data.
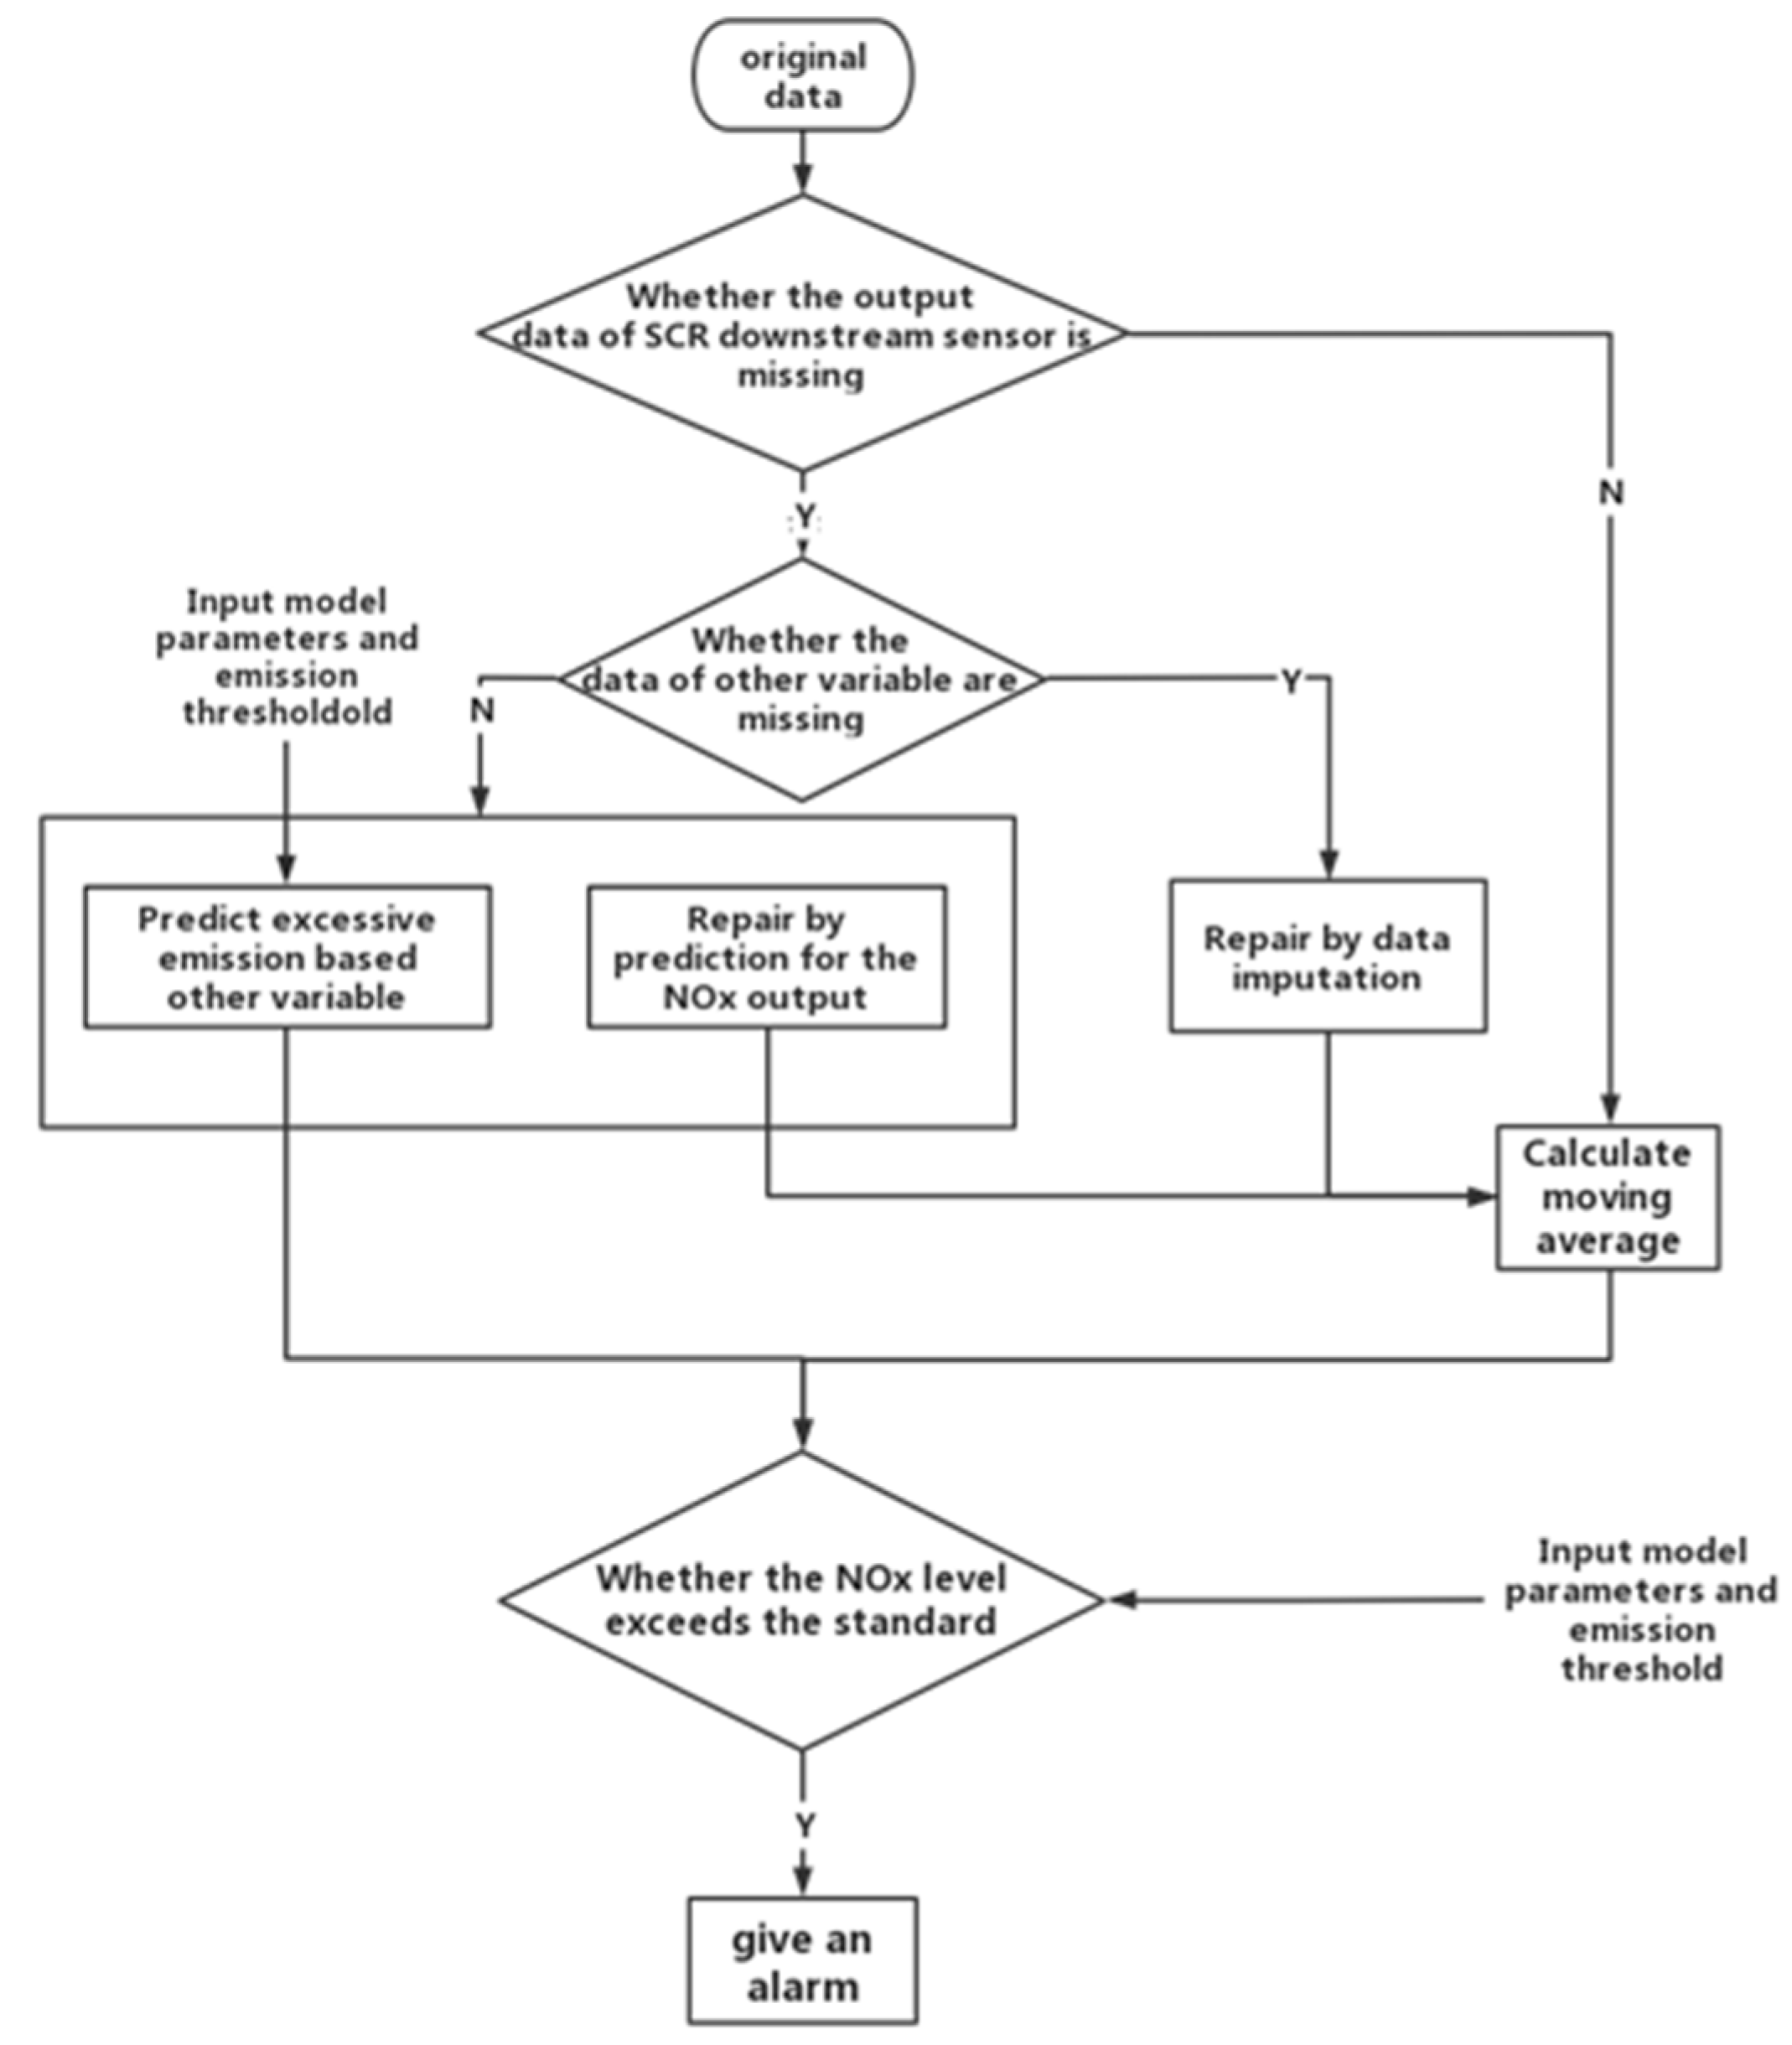
Figure 2 shows the procedure flow to determine the possibility of excessive emissions in more detail. As the raw data are frequently polluted due to various reasons, abnormal values (e.g., negative values of speed) and missing data can significantly bias the result of the excessive emission identification. Therefore, we propose a method to determine excessive emissions based on the data with different quality issues involved. To better describe the process, we classified the situations with a different quality of data. Note that the same process to impute the missing data is adopted to correct the abnormal values of the raw data. That is to say, the abnormal values identified are removed and then imputed as a missing value.
Situation 1: If there is no quality problem in the set of NOx data from the SCR downstream sensor, the determination of excessive emissions will be directly performed by averaging the data over the test period. If the averaged value exceeds a user-specific threshold, an alarm will be raised.
Situation 2: For the situations where the NO
x data and other data (e.g., urea level, friction torque, speed, atmospheric pressure, the engine output torque, etc.) all contain missing data, a matrix-based imputation method will be used to generate values for the missing data. The imputation methods used for the comparative study in this paper will be presented in
Section 5. After imputing missing data, the identification of excessive emissions will be carried out.
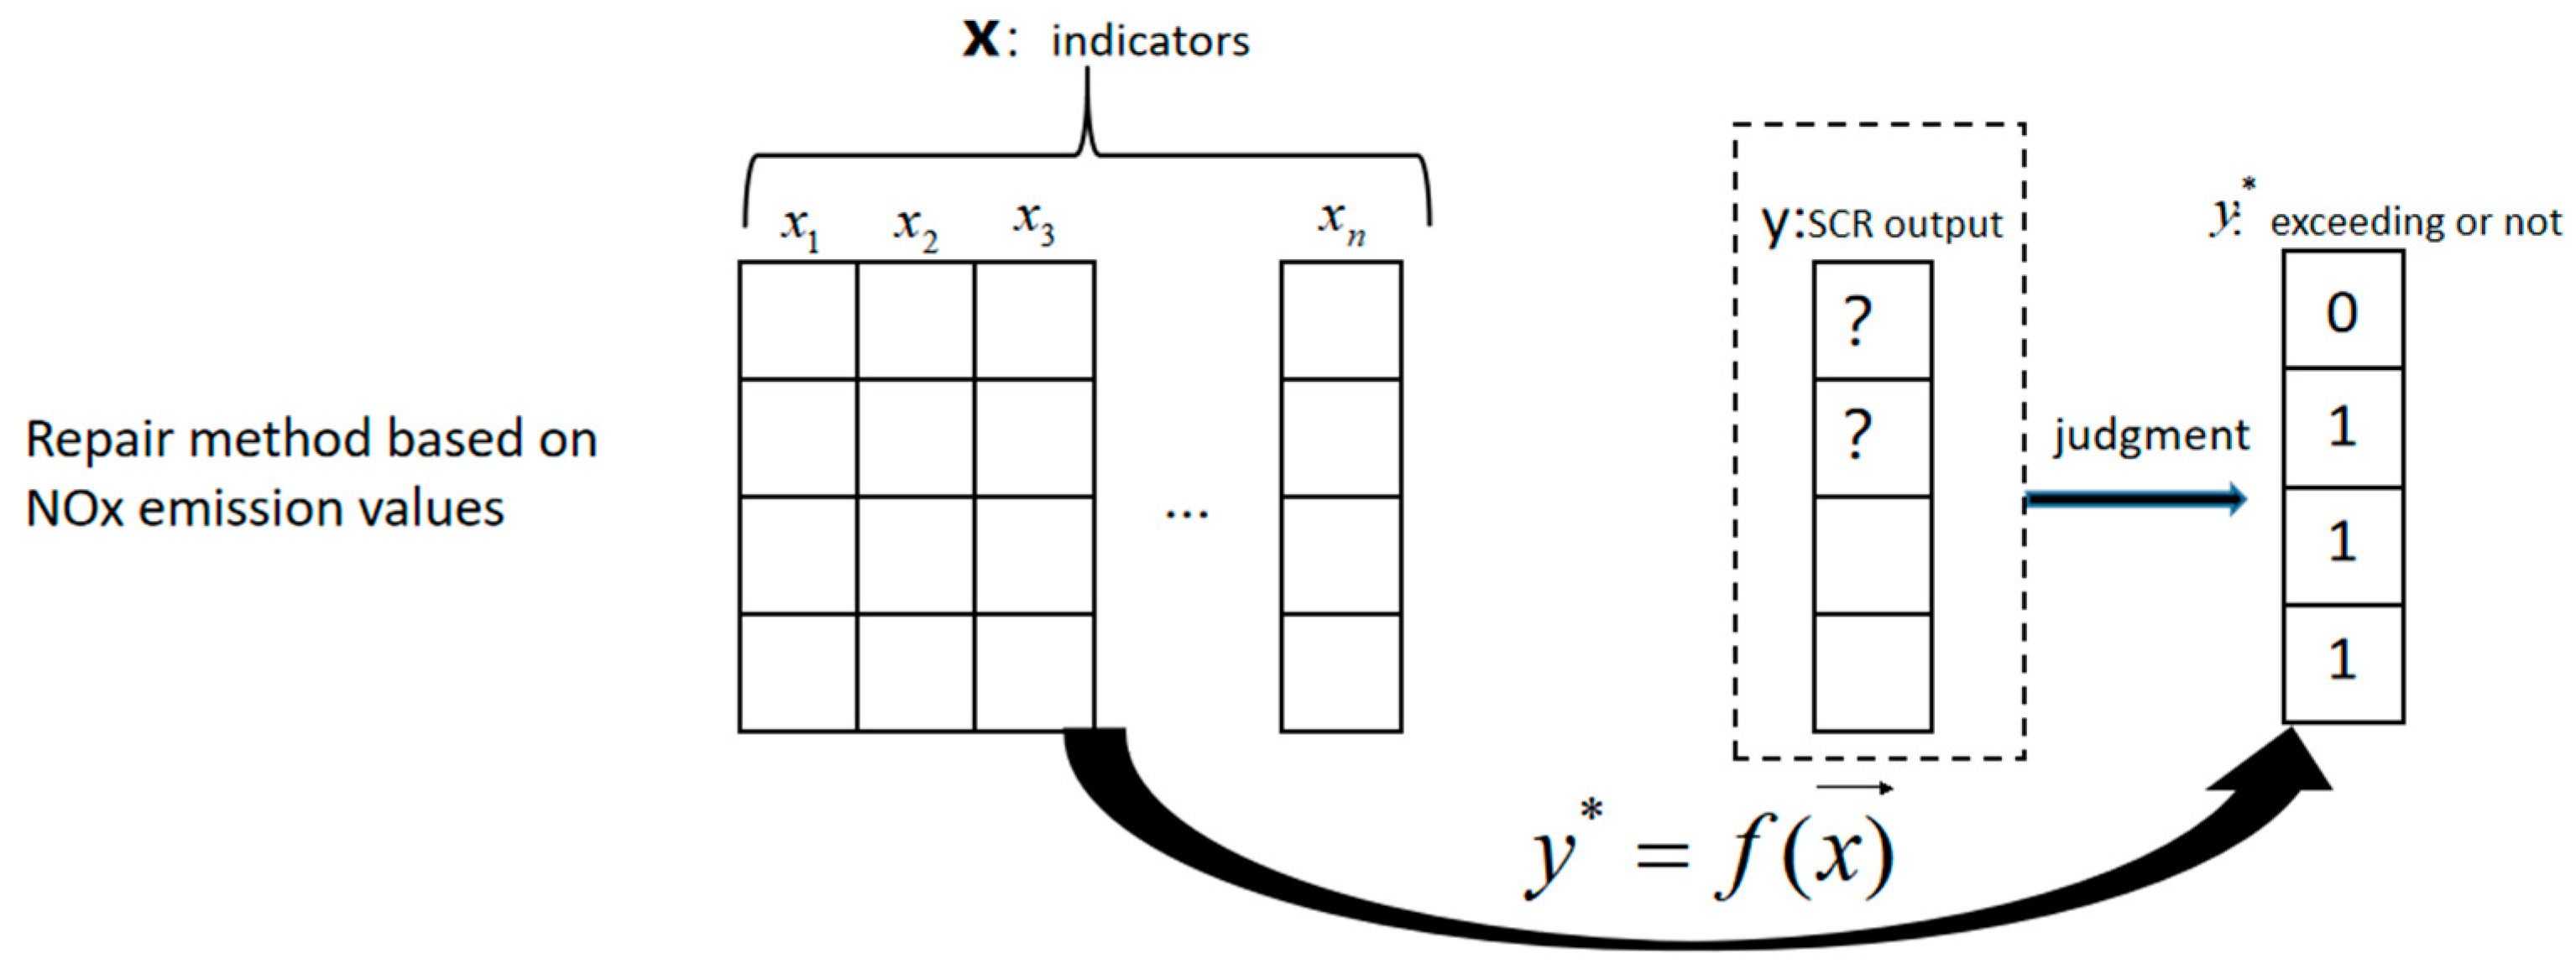
Situation 3: More repairing options are available for the situations where the NO
x data and other data include missing values. One is to estimate the aggregated emission level by using the prediction methods based on other data (e.g., urea level, friction torque, speed, atmospheric pressure, the engine output torque, etc.) without repairing the NO
x data from the SCR downstream sensor. The schematic diagram for this approach is shown in
Figure 3. For convenience, this approach is referred to as the prediction-based approach hereafter.
Section 5 presents the specific algorithms used for this purpose in this research work.
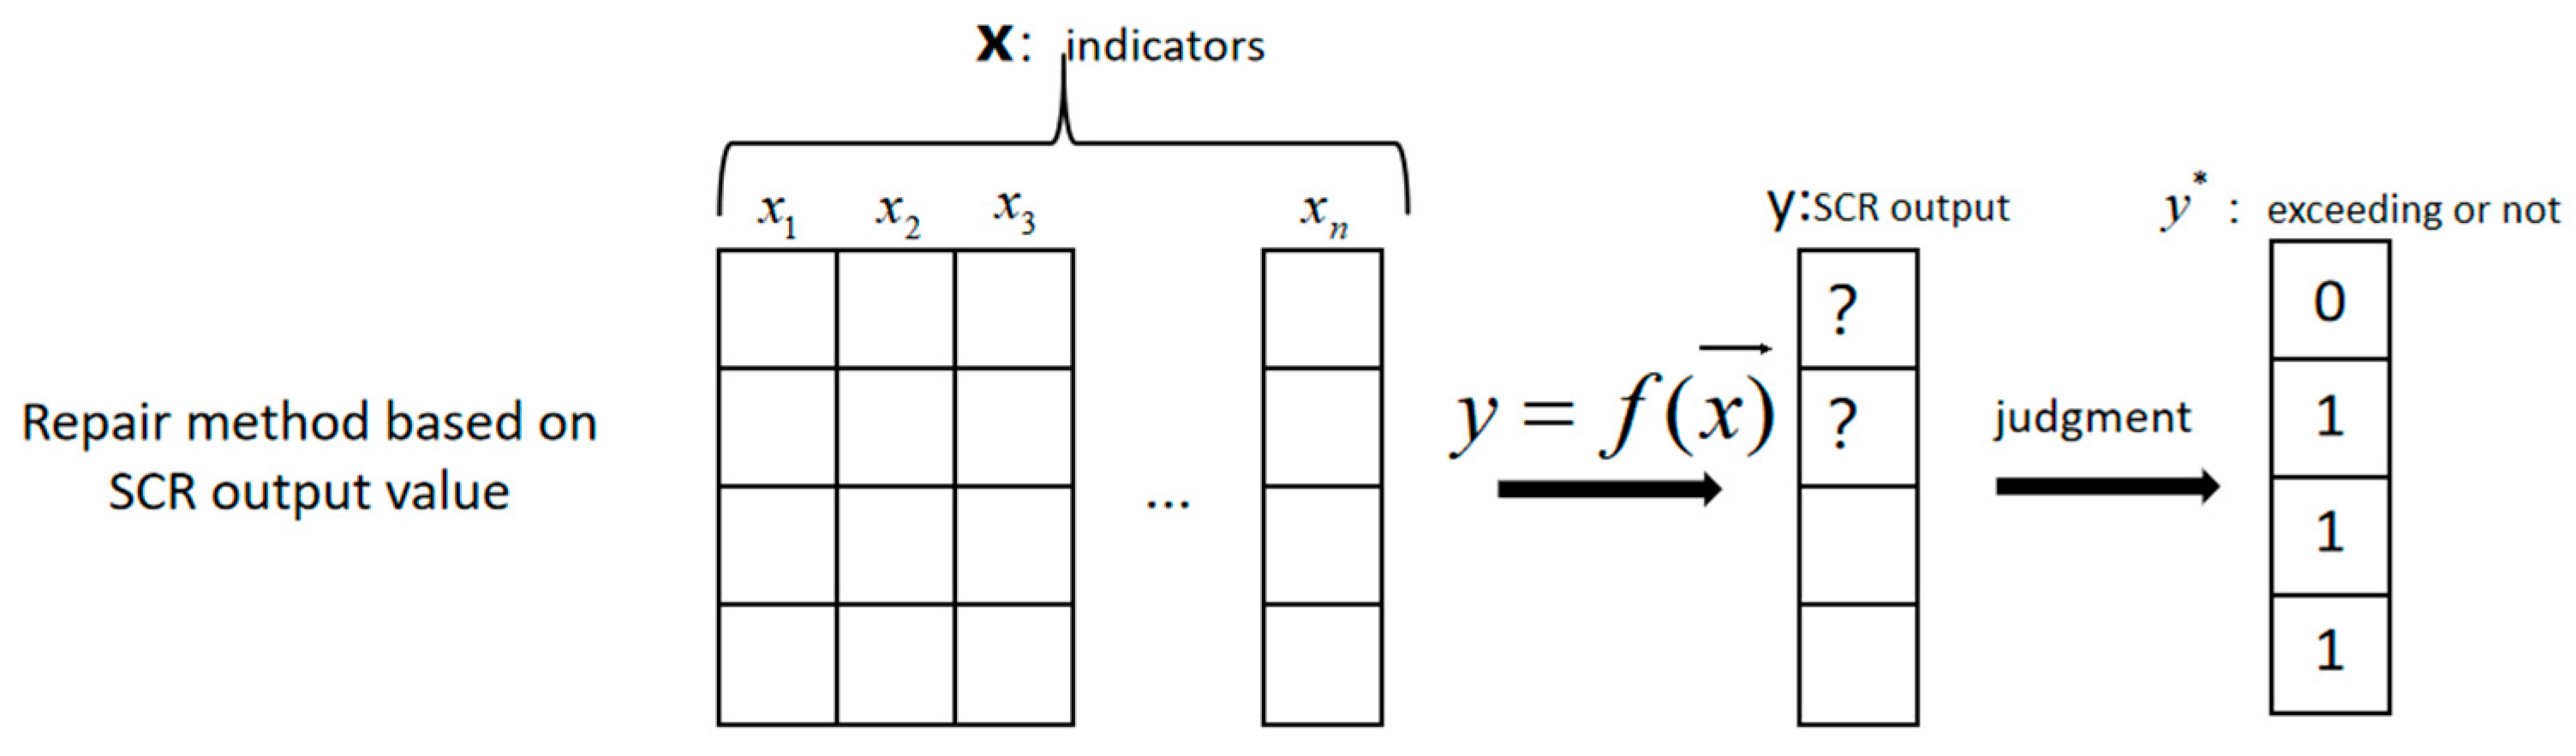
The second approach is to repair the instant NO
x output from the SCR downstream sensor by using prediction techniques; then, the emission level is averaged over the test period before comparing the averaged value with the specified threshold, as shown in
Figure 4. Again, we call the second approach a repair-based approach in this paper, in order to distinguish it from the first one. To improve the data quality, a number of possible algorithms are examined in this study and a brief introduction to these algorithms will be provided in
Section 5.
4. Data Quality Assessment
The data used to determine whether the emission exceeds the required standard is the output value per second of the engine-related parameters, such as speed, net output torque and speed collected in a continuous period of time. The output values of the SCR downstream NO
x sensor, urea level, friction torque and other parameters are also an important basis for determining whether the engine emissions exceed the standard. The absence of data and numerical anomalies will lead to a failure to identify the excessive emissions. Therefore, the quality of the raw data should be first assessed before conducting the subsequent process. The main assessment content is to count the missing and abnormal situation of each parameter over each time period, in which the missing rate is used to reflect the missing state of the raw data and the negative number rate is used to reflect the abnormal state. The specific calculations for these two parameters are as follows:
where,
represents the missing rate;
represents the number of missing data;
represents the total number of data which should be recorded over the test period;
represents the negative number rate;
represents the number of negative values.
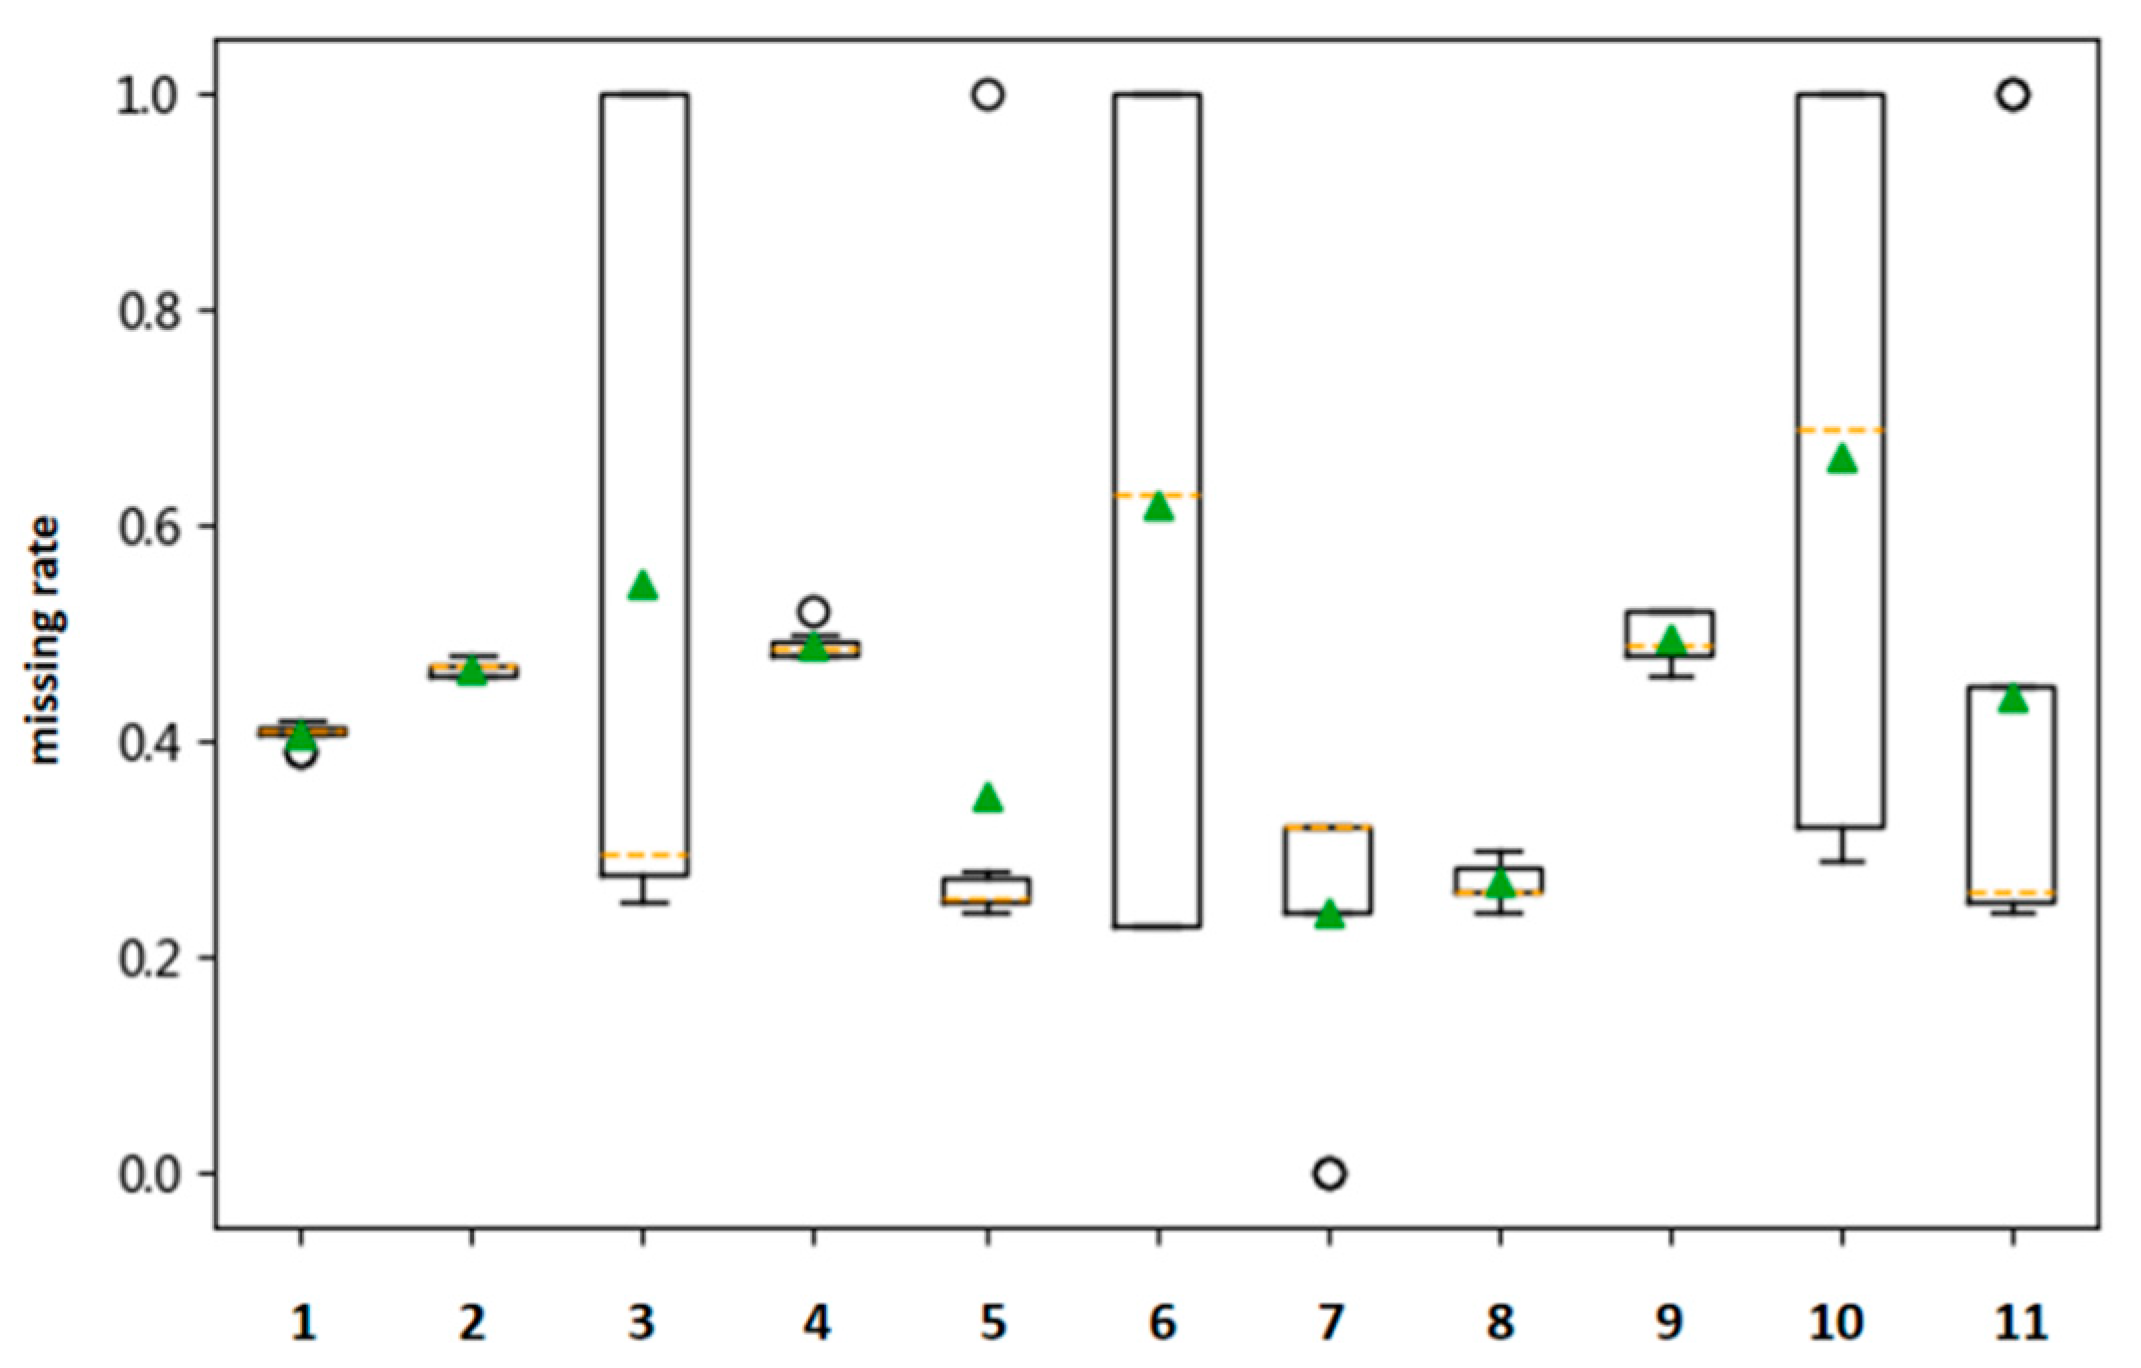
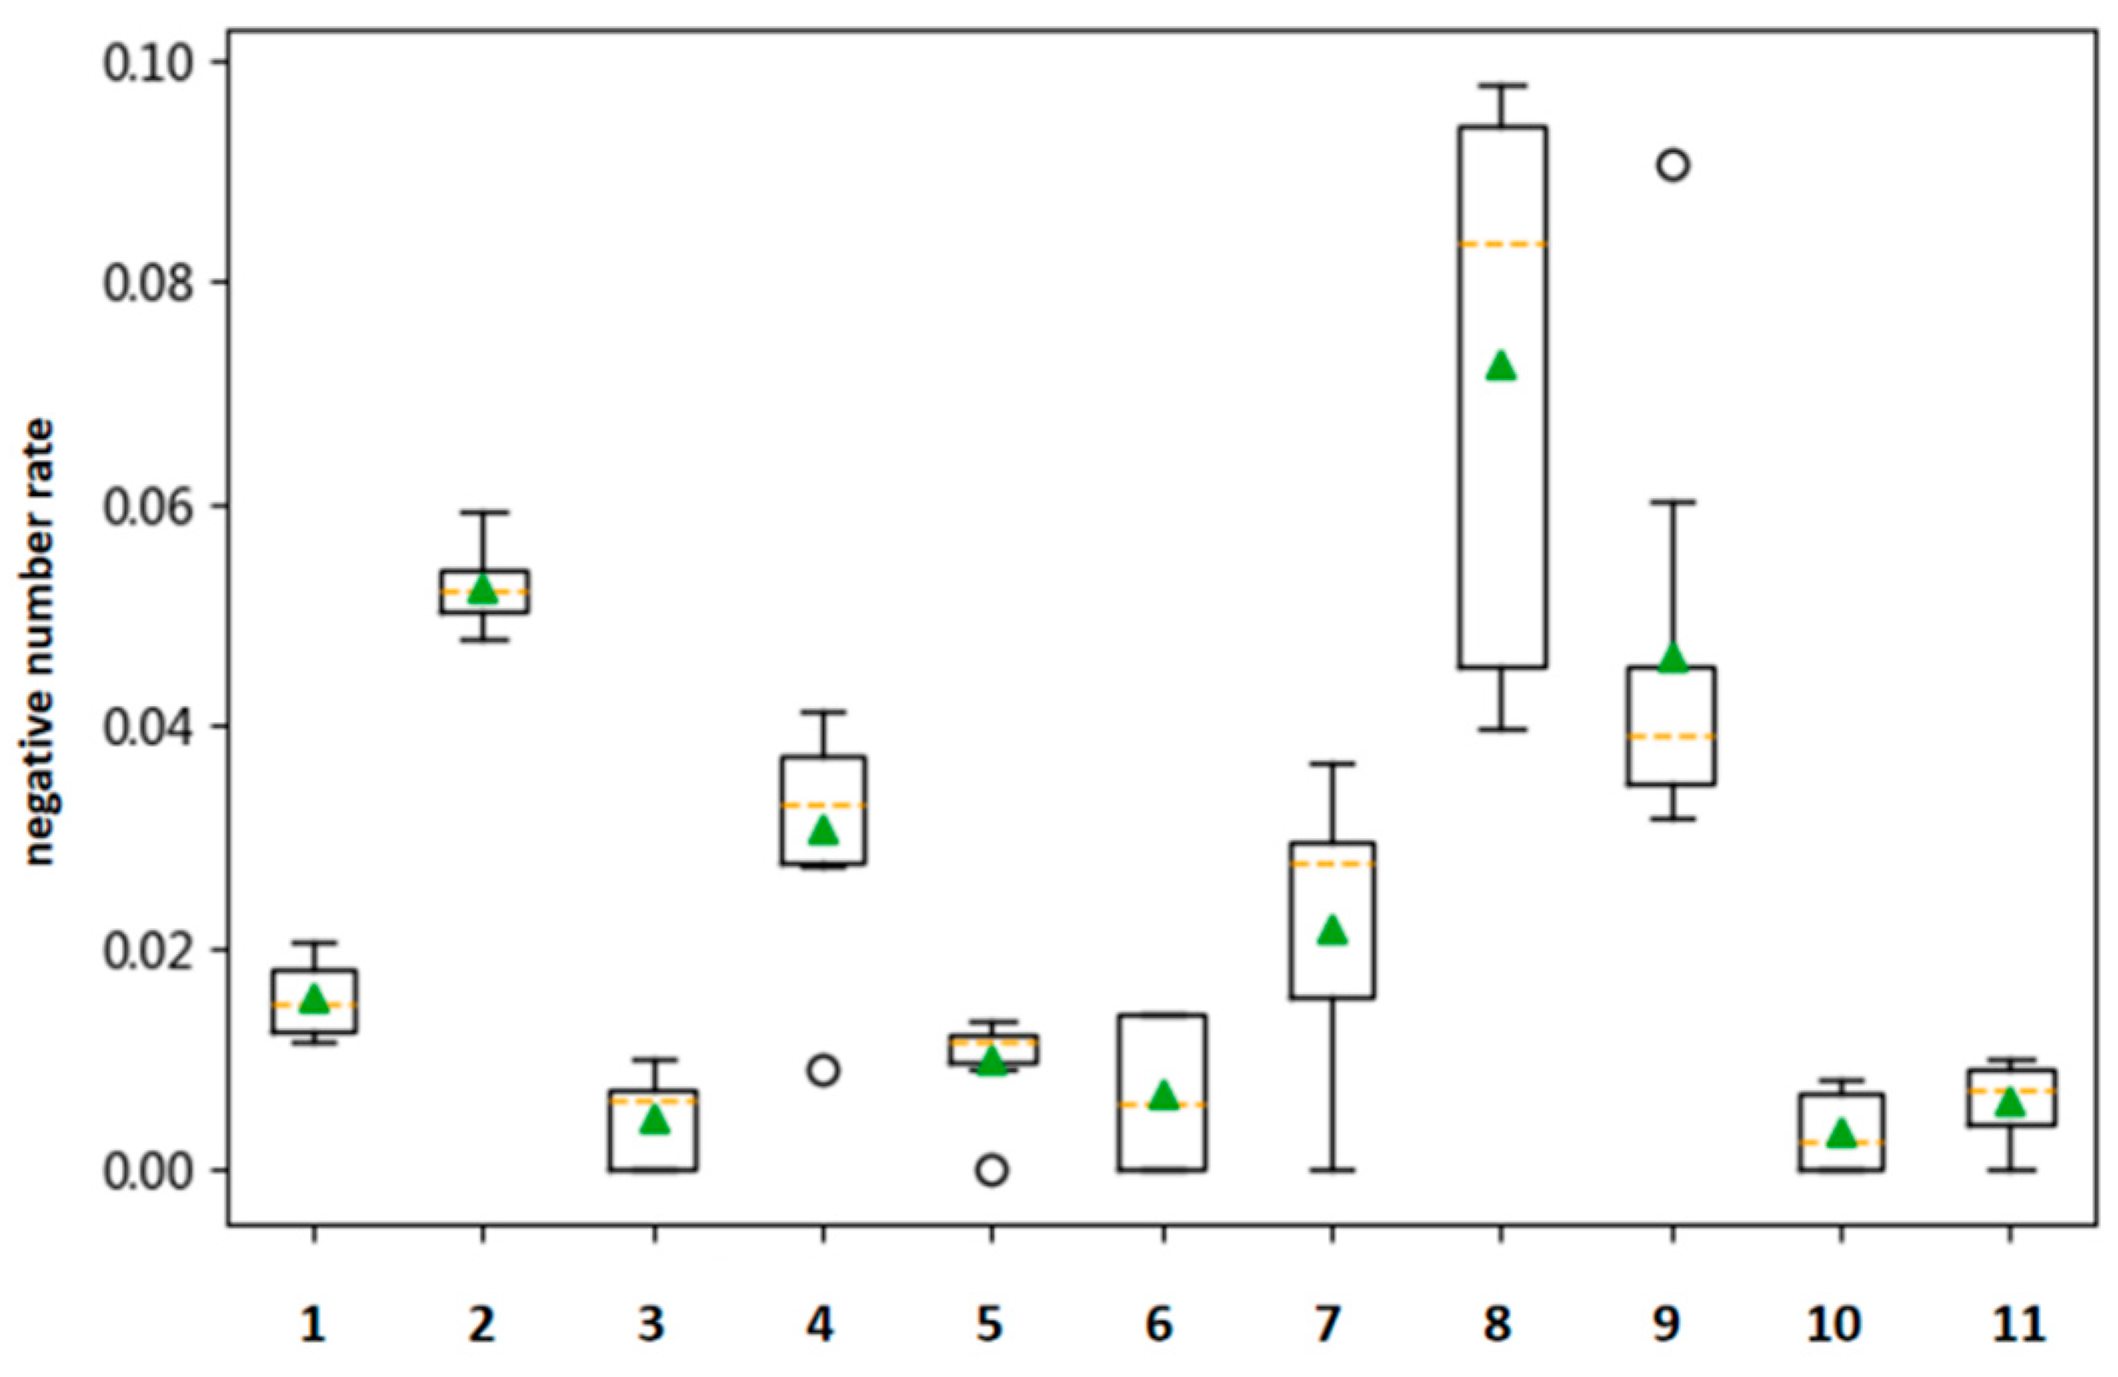
Based on the statistics of the original engine data collected from January to August for some vehicles of the 11 companies in 2019, the boxplots of the missing data and abnormal distribution obtained, according to the classification of the companies, are shown in
Figure 5 and
Figure 6, respectively.
As can be seen from the boxplots above, the current situation of missing data is serious. Data of all companies are missing to a certain extent, and the data quality of each company is different to some extent. Among them, companies 3, 6 and 10 have the most serious missing data situation, with a mean and median of about 0.6; the negative data rates of companies 2 and 8 is the most serious. A large number of such missing data will directly affect the subsequent process to identify whether vehicle emissions exceed the standard. Therefore, it can be concluded that the missing data is one of the important reasons for current inadequate vehicle emissions monitoring. Accordingly, a series of data repairing methods are proposed in this study to avoid, as much as possible, the bias resulting from these issues.
5. Data Repairing and Prediction Techniques
This section is devoted to introducing a number of algorithms that are required to achieve either the data imputation or prediction, as presented in
Section 3. For convenience, the algorithms are grouped into two categories, namely prediction- and imputation-based algorithms, in this paper. However, it should be made aware that these algorithms can be used for both data imputation and prediction in different application scenarios.
In this study, three typical machine learning algorithms, namely random forests (RF), the support vector machine (SVM), and gradient boosting decision tree (GBDT), are chosen for the prediction, as these algorithms are frequently reported for their high performance in prediction. However, there are no other restrictions that prevent other algorithms from being used to achieve the same purpose.
RF: the RF algorithm is one of the mainstream machine learning algorithms, which can be used for the problems of both classification and prediction methods. The basic principle of the RF algorithm is to conduct random sampling in the sample data, generate a large number of trees, and obtain a final result based on the voting mechanism [
21,
22,
23]. To be specific, RF is a set composed of multiple fully grown decision trees, and the data from the multiple decision trees are randomly generated [
24]. The core idea is to use the voting mechanism of multiple decision trees to solve the problems of either classification or prediction. For the classification problem, the voting results of multiple trees are used as the final result and the types of samples are finally determined according to the principle of majority. For the prediction problem, the regression results of multiple trees are averaged and finally used for the predicted value of the sample. A large number of theoretical and empirical studies have proved that the RF algorithm has a high prediction accuracy and good tolerance to outliers and noise [
25].
SVM: SVM is one of the typical supervisor machine learning algorithms, with the aim of minimizing the so-called structural risk [
26]. Its basic model is to find a linear classifier for separating hyperplanes with maximized spacing in the feature space. The learning strategy of SVM is to maximize the interval, which can be formalized into a problem of solving convex quadratic programming, which is equivalent to the minimization problem of the regularized hinge loss function [
27,
28]. When the training sample is linearly separable, a linear classifier, namely a linearly separable support vector machine, is learned through hard interval maximization. When the training data is nearly linearly separable, the relaxed variable is introduced, and a linear classifier, namely a linear support vector machine, is learned through soft interval maximization. When the training data is linearly inseparable, the kernel technique and soft interval maximization are used to learn nonlinear support vector machines.
GBDT: the GBDT algorithm is a machine learning algorithm proposed by Freidman [
29] that integrates various models learned. In this method, the residual between the calculated value and the target value is firstly analyzed by the gradient lifting algorithm, and then the residual is analyzed as the new dependent variable in the classification and regression tree (CART). Therefore, the residual with different properties will be treated differently, making the training process more efficient [
30].
- 2.
Imputation-based algorithms
To impute the missing values for the SCR output data, three matrix-based algorithms, namely non-negative matrix factorization (NNMF), probabilistic principal component analysis (PPCA), and k-nearest neighbor (KNN), are examined for the imputation performance under different situations in this study.
NNMF: This is an important matrix factorization model widely used in data mining and machine learning. It can extract low-dimensional, sparse and meaningful features from a group of high-dimensional non-negative vectors [
29]. The basic idea of NMF is as follows: for any given non-negative matrix A, the NMF algorithm can find a non-negative matrix U and a non-negative matrix V, so that A is decomposed into the product of two non-negative matrices (i.e., A = U × V). Since it is impossible for the NO
x concentration to have negative numbers, the non-negative vector expression and the non-negative matrix factorization are obviously more practical.
PPCA: PPCA is a signal analysis method that first establishes an appropriate probability model, and then regenerates a new sample data based on this model. Finally, the signal principal component can be obtained by means of orthogonal projection [
31].
KNN: the KNN algorithm is the prediction of searching the nearest k known samples for the unknown samples. The “nearest” measure is the distance or similarity between application points. The smaller the distance, the higher the similarity, which means they are closer to each other. “Prediction”, for discrete dependent variables, is the category with the highest frequency selected from the k recent samples of the known category for the judgment of the unknown sample. For the continuous dependent variable, the mean of the k-nearest known samples is used as the prediction of the unknown sample.
6. Determination of Excessive Nitrogen Oxide Emission
According to the online detection method mentioned in Rapid Detection Method and Emission Limits of Heavy Duty Vehicles (DB 11/1476-2017), the recommended calculation method is to conduct moving average processing on the output value of the NOx sensor in the downstream of SCR over a period of time (e.g., 30 s) to generate an aggregated result of the NOx concentration value. When the calculated NOx concentration value exceeds a predefined limit value, it is regarded as excessive emission.
Consideration needs to be given to the possibility that there may be a large difference between the output values of the NOx sensor downstream of the SCR for a period of time (e.g., 30 s) in the data, that is, the values at some moments are significantly higher than others. In this case, using the mean value as the calculation result can not accurately reflect the overall NOx emission level over the test period. To overcome this bias, we propose three methods for the data with different characteristics of noise embedded.
Method 1: Calculate the moving mean over a specific period;
Method 2: Calculate the moving median over a specific period;
Method 3: Calculate the moving average (i.e., either mean or median), after removing the maximum and minimum values.
When the noise embedded in the data follows Gaussian distribution, it will not cause any bias if method 1 is employed. Method 2 can be applied if extremely large or small values exist in the data set for the test period. Method 3 is more resistant to noise and outliers, since an extra process is performed to remove the maximum and minimum values, which can weaken or even eliminate the influences of the extreme values on the aggregated result. It should be aware that it requires more computational effort if method 3 is used. However, although we use the term noise to describe the temporary extreme values here, not all instant extreme values are real noises, and some just reflect a temporary state in the engine or other parts.
7. Experiments
To evaluate the approach proposed to determine the excessive emission, a set of experiments were conducted based on the OBD data collected. The experiments begin with the examination of the moving average method to estimate the NOx concentration level. Following that, a number of algorithms to predict whether emissions exceed the threshold are examined in terms of prediction accuracy without the data repairing process. Finally, the algorithms chosen for the data repairing are evaluated through a series of experiments under different data quality levels.
Before presenting the experimental results, the data used for the following experiments are introduced here. We selected the original data of four vehicles with different vehicles from different companies for the tests, and the basic information of each vehicle is shown in
Table 1. Note that some of the information is omitted or replaced by “*” to prevent, as much as possible, any inconvenience that may raise for the manufacturers.
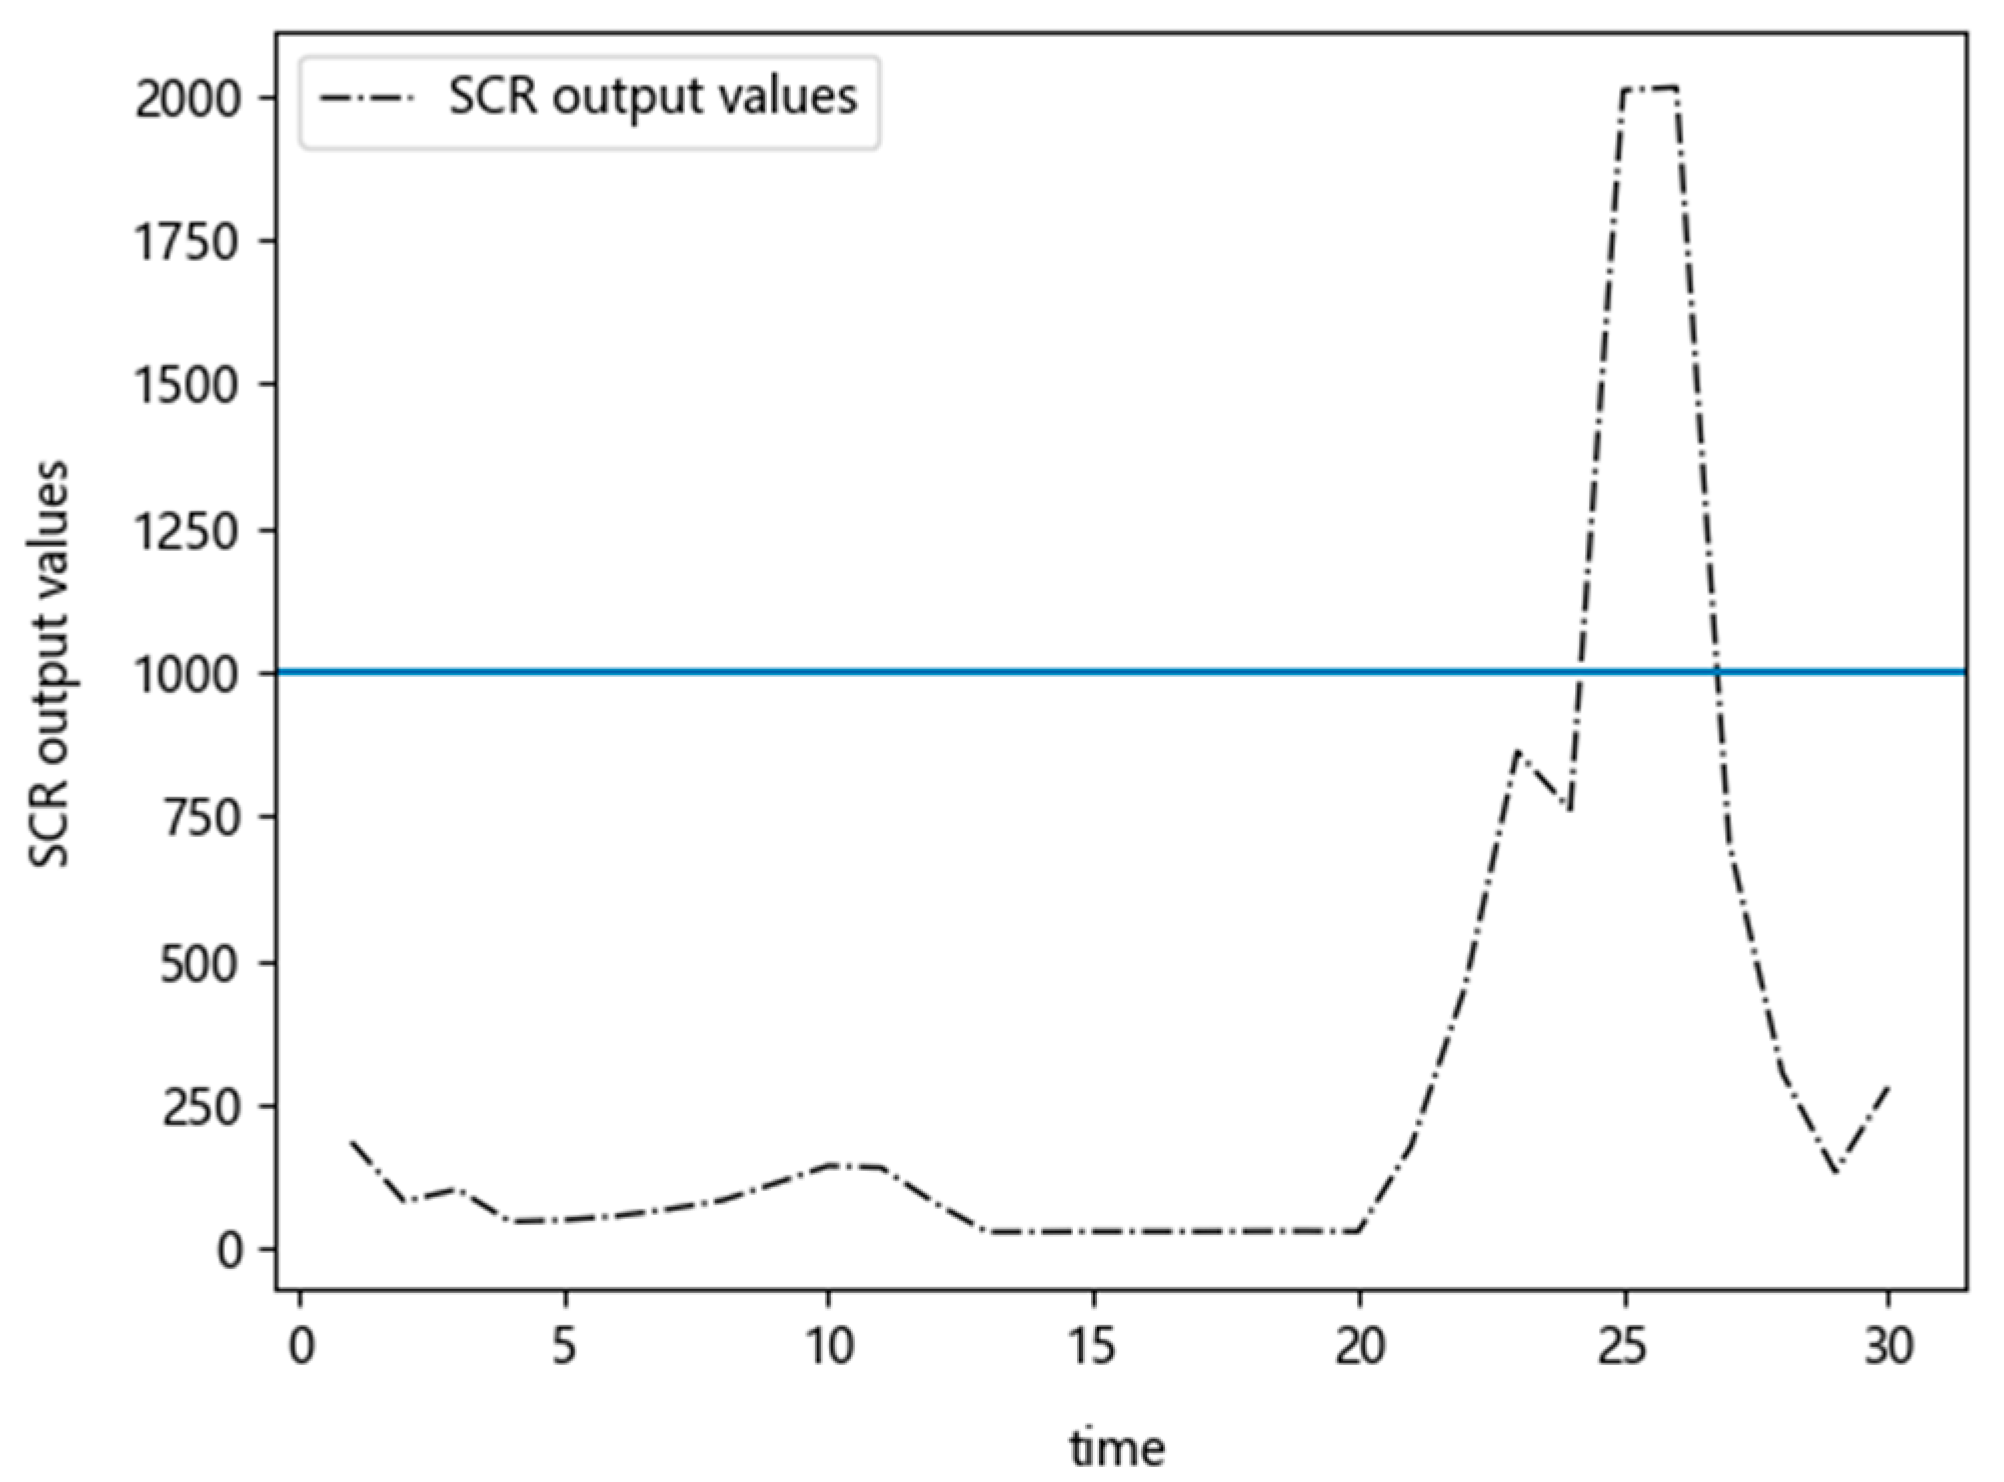
7.1. Examination of the Methods of Excessive Emission Determination Based on the NOx Data
Figure 7 shows the raw data of the NO
x sensor output values downstream of the SCR selected for a period of 30 s. It can be seen from
Figure 4 that the NO
x output values within 30 s are all below the exceeded threshold except for a period within 25–30 s. The results obtained by using the three methods (introduced in
Section 6) are shown in
Table 1.
It can be found from the results in
Table 2 that the NO
x emission values calculated by Methods 2 and 3 are slightly different, while the calculated value of Method 1 is significantly higher than that of the other two methods. As a result, this bias leads to the wrong identification of the excessive emission, as Method 1 gives more weight to the extreme values, which occur at low frequency. This indicates that the other two methods proposed in this paper are more applicable when extreme values exist in the data.
7.2. Examination of the Methods of Excessive Emission Determination Based on Other Parameters
As discussed in
Section 3, the prediction-based approach attempts to identify the excess emission by direct prediction with the input of the other data, including the speed, atmospheric pressure, engine output torque, engine speed and other data, when the NO
x data from the SCR downstream sensor contains missing values and the data from other parameters are available. That is, the output from the prediction model is an indication of whether the aggregated emission level exceeds the specified threshold (i.e., 1000 ppm in this study). This is to say, the prediction is in fact a binary classification problem. The evaluation results obtained by RF, SVM and GBDT, for the prediction in terms of precision, recall and F1-scores are summarized in
Table 3. Note that we use “*” to replace letters or digits to prevent any inconvenience that may raise for the manufacturers. To examine the prediction accuracy, a set of data without missing values was selected and split into the training and test data sets containing 2000 and 500 instances, respectively.
From the prediction results presented in
Table 3, it can be seen that there is no significant difference in the prediction performance of the three algorithms under test. However, it can be found that the SVM algorithm slightly outperforms the other two in terms of precision and recall. Therefore, the SVM algorithm can be employed in the first place, as the other two are more complex. On the other hand, fusing the results obtained from the three algorithms can improve the robustness of the identification of excessive emissions.
7.3. Examination of the Repairing Methods
7.3.1. Repairing Performance of the Prediction-Based Repairing Method
This method takes the variables, such as the speed, atmospheric pressure, engine output torque, engine speed and others as inputs and predicts the NO
x values by a regression model. In such a way, the missing values of the NO
x data can be imputed by the predicted values. In this set of experiments, RF and GBDT were selected as the prediction algorithms. The prediction performance, in terms of R
2, the mean absolute percentage error (MAPE) and the root square mean error (RSME), are summarized in
Table 4. Note that we use “*” to replace letters or digits to prevent any inconvenience that may raise for the manufacturers. The data set selected is the same as that used in the previous subsection.
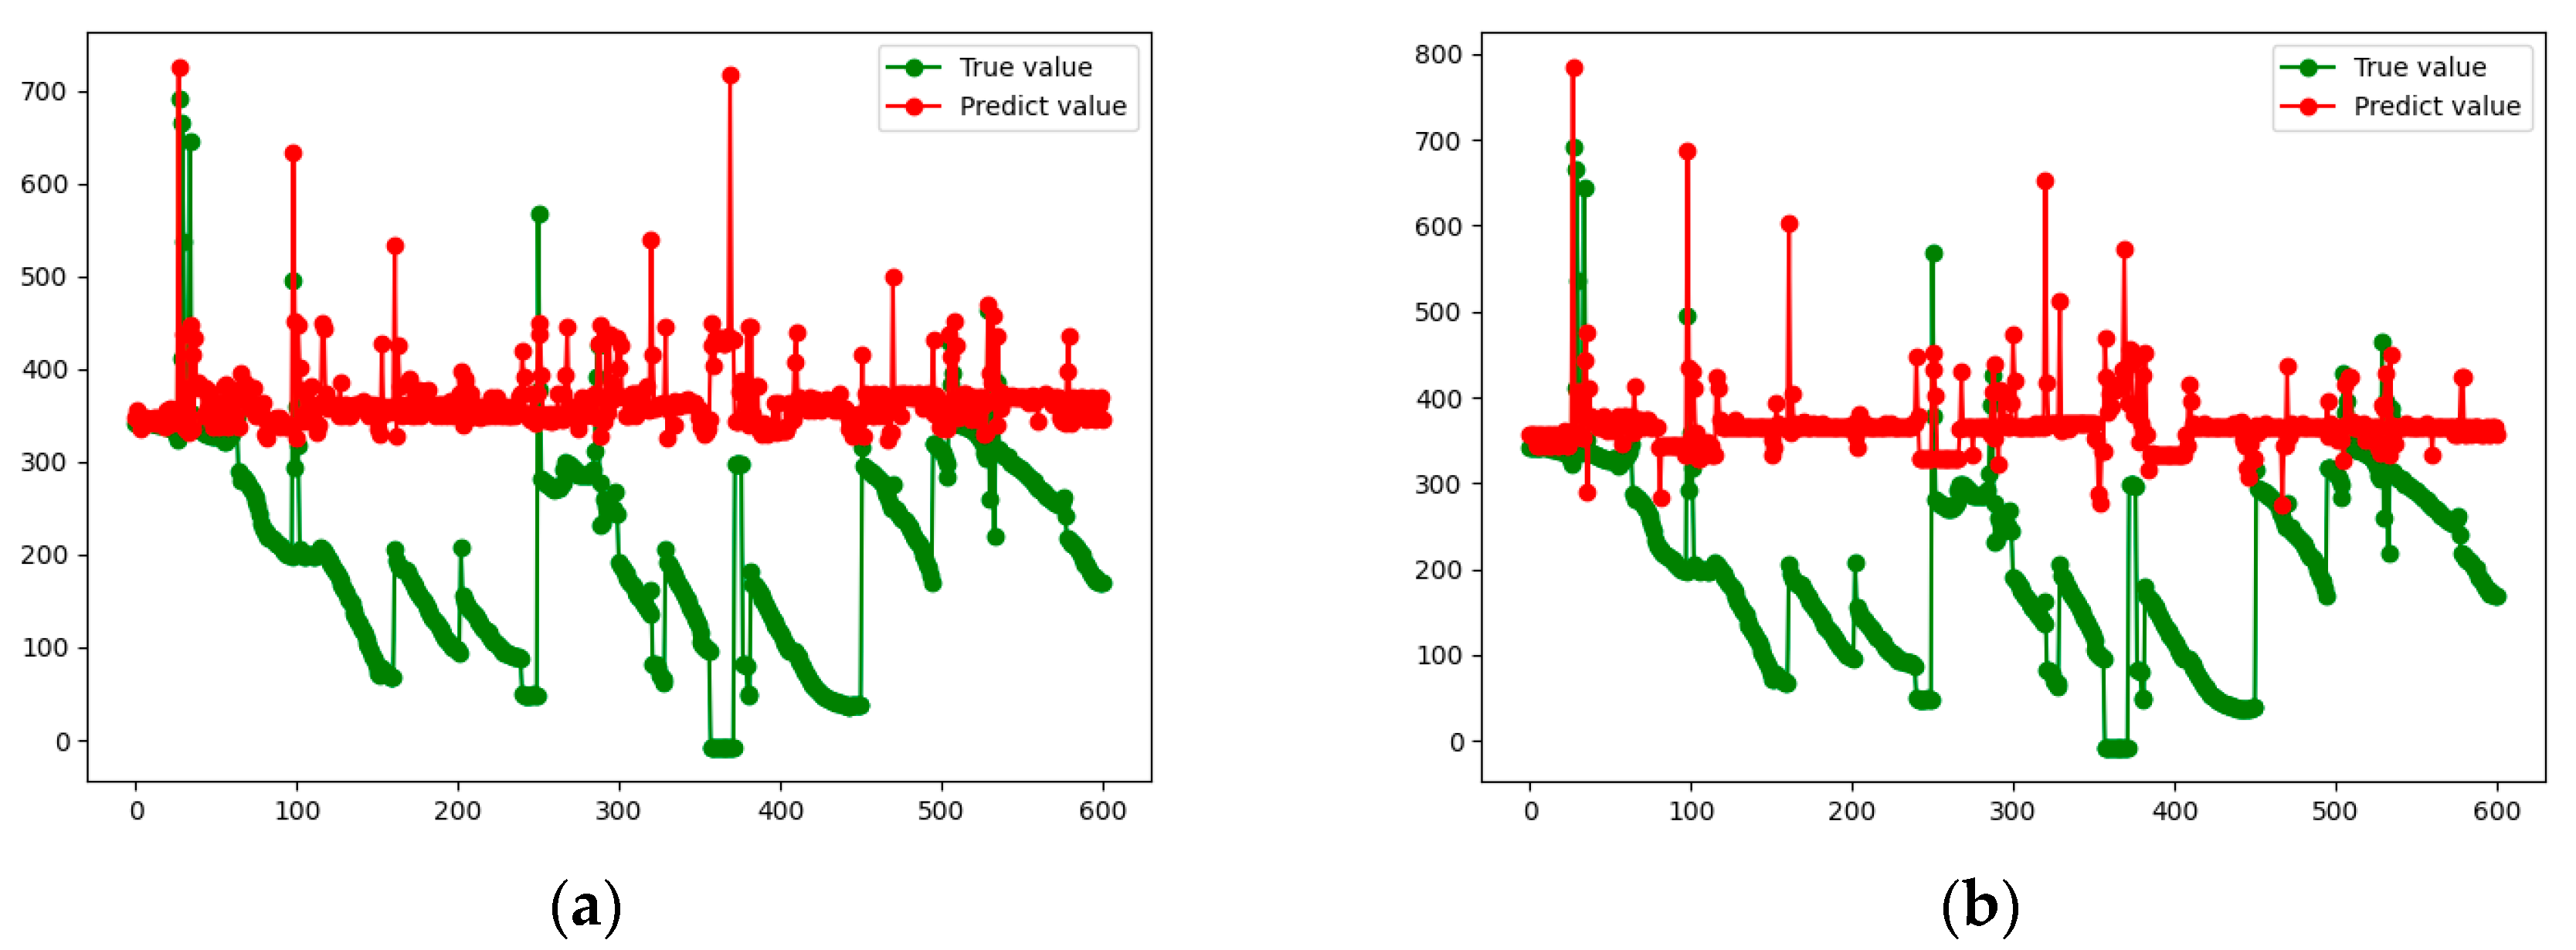
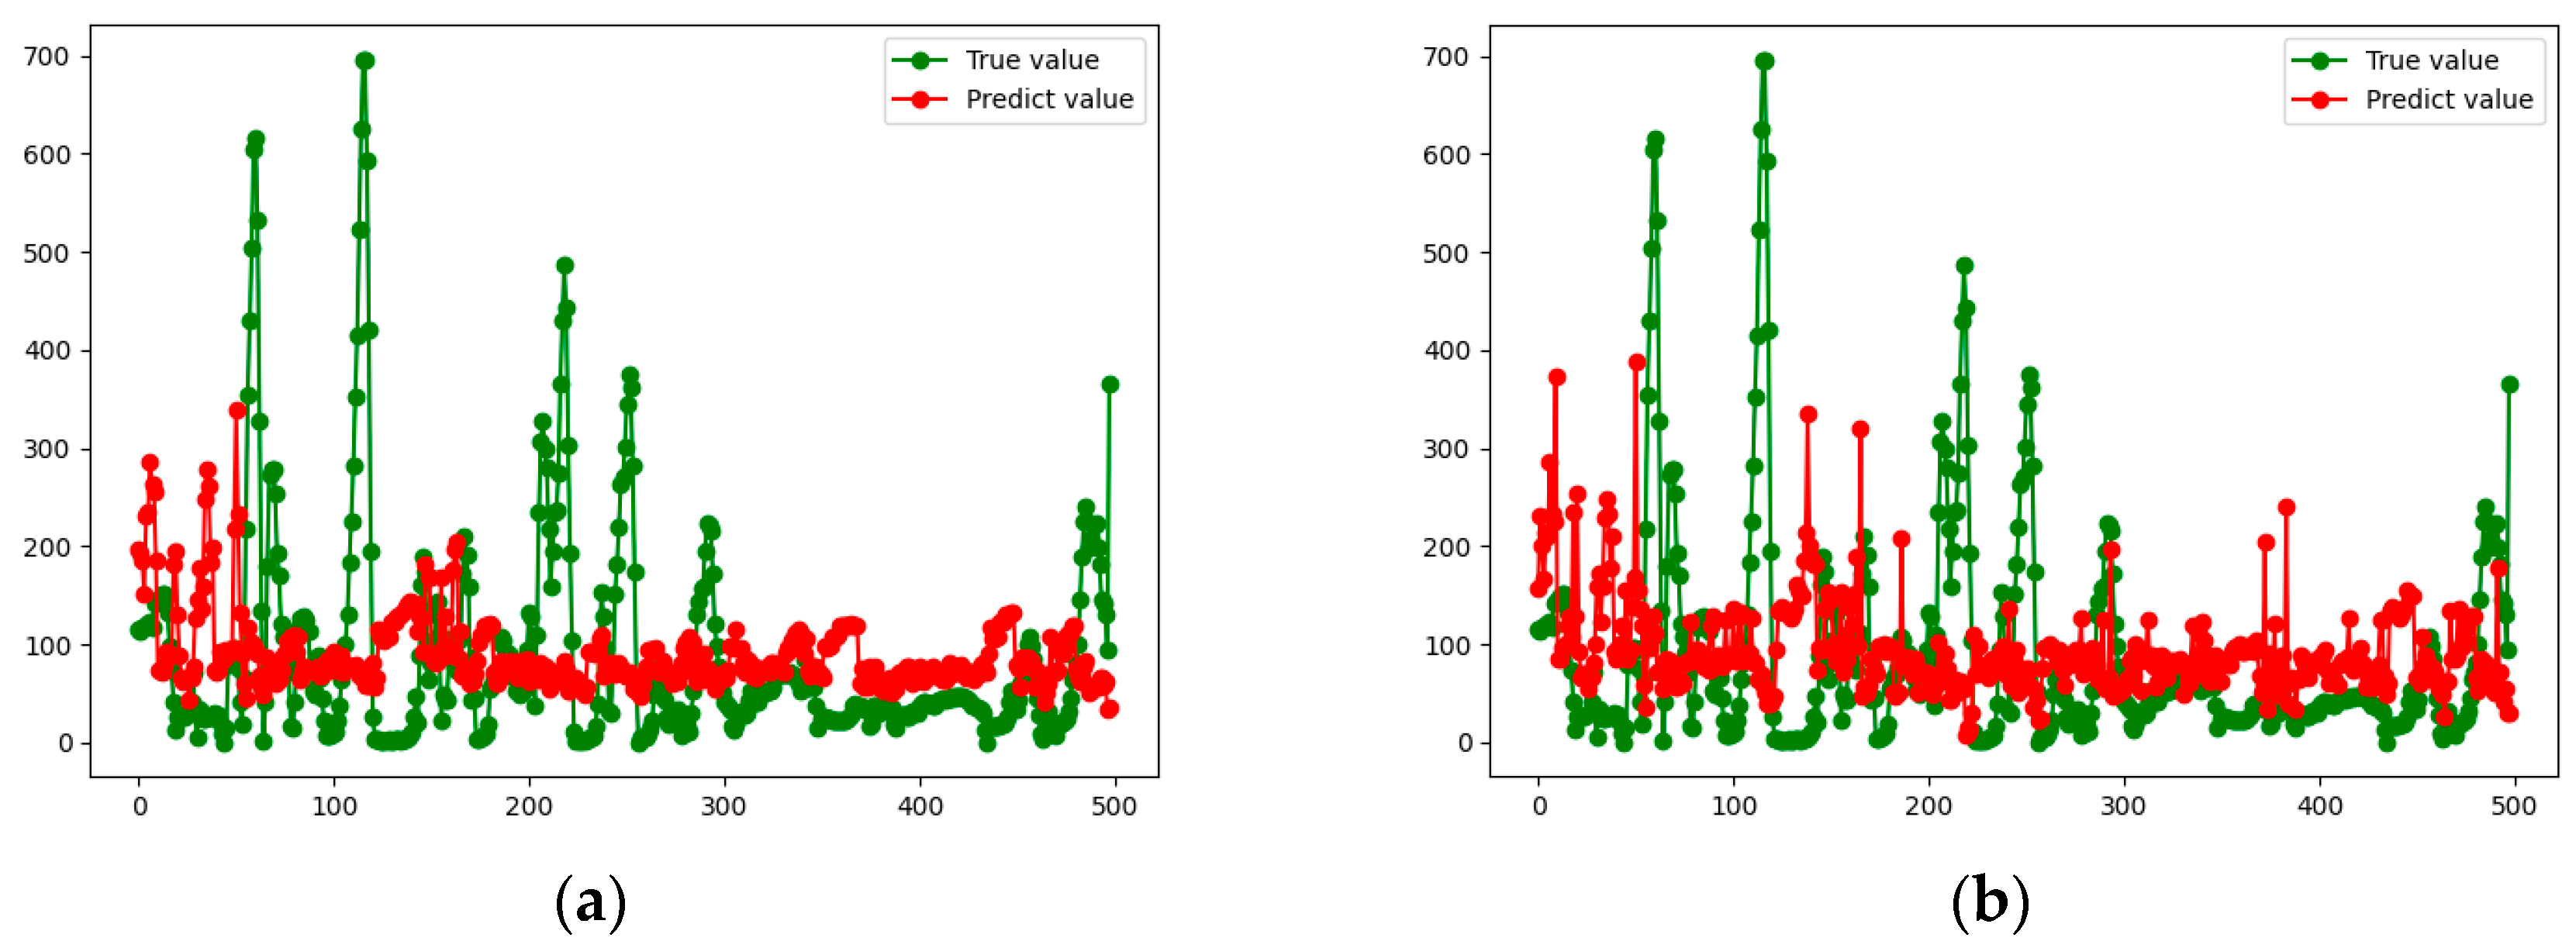
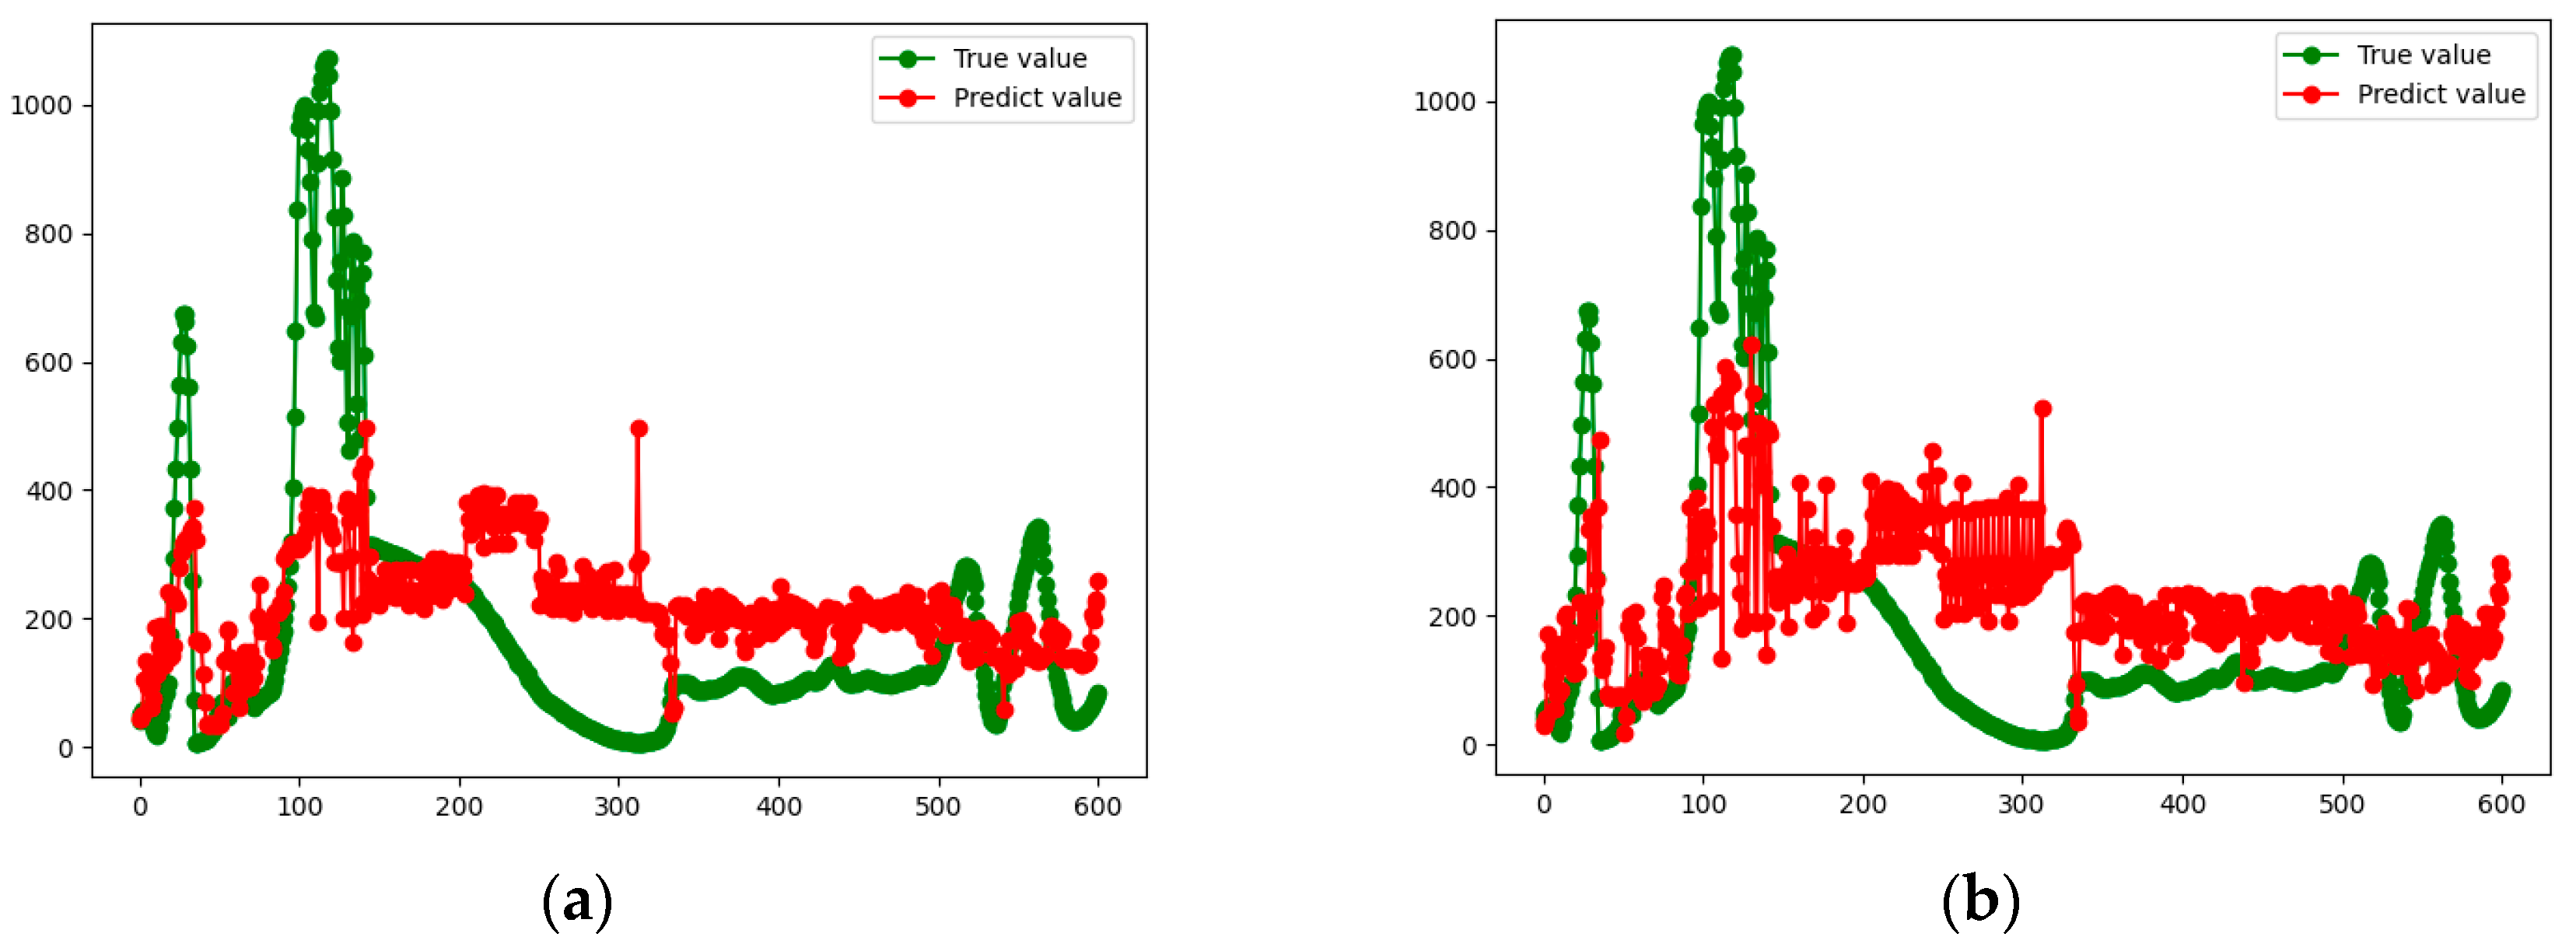
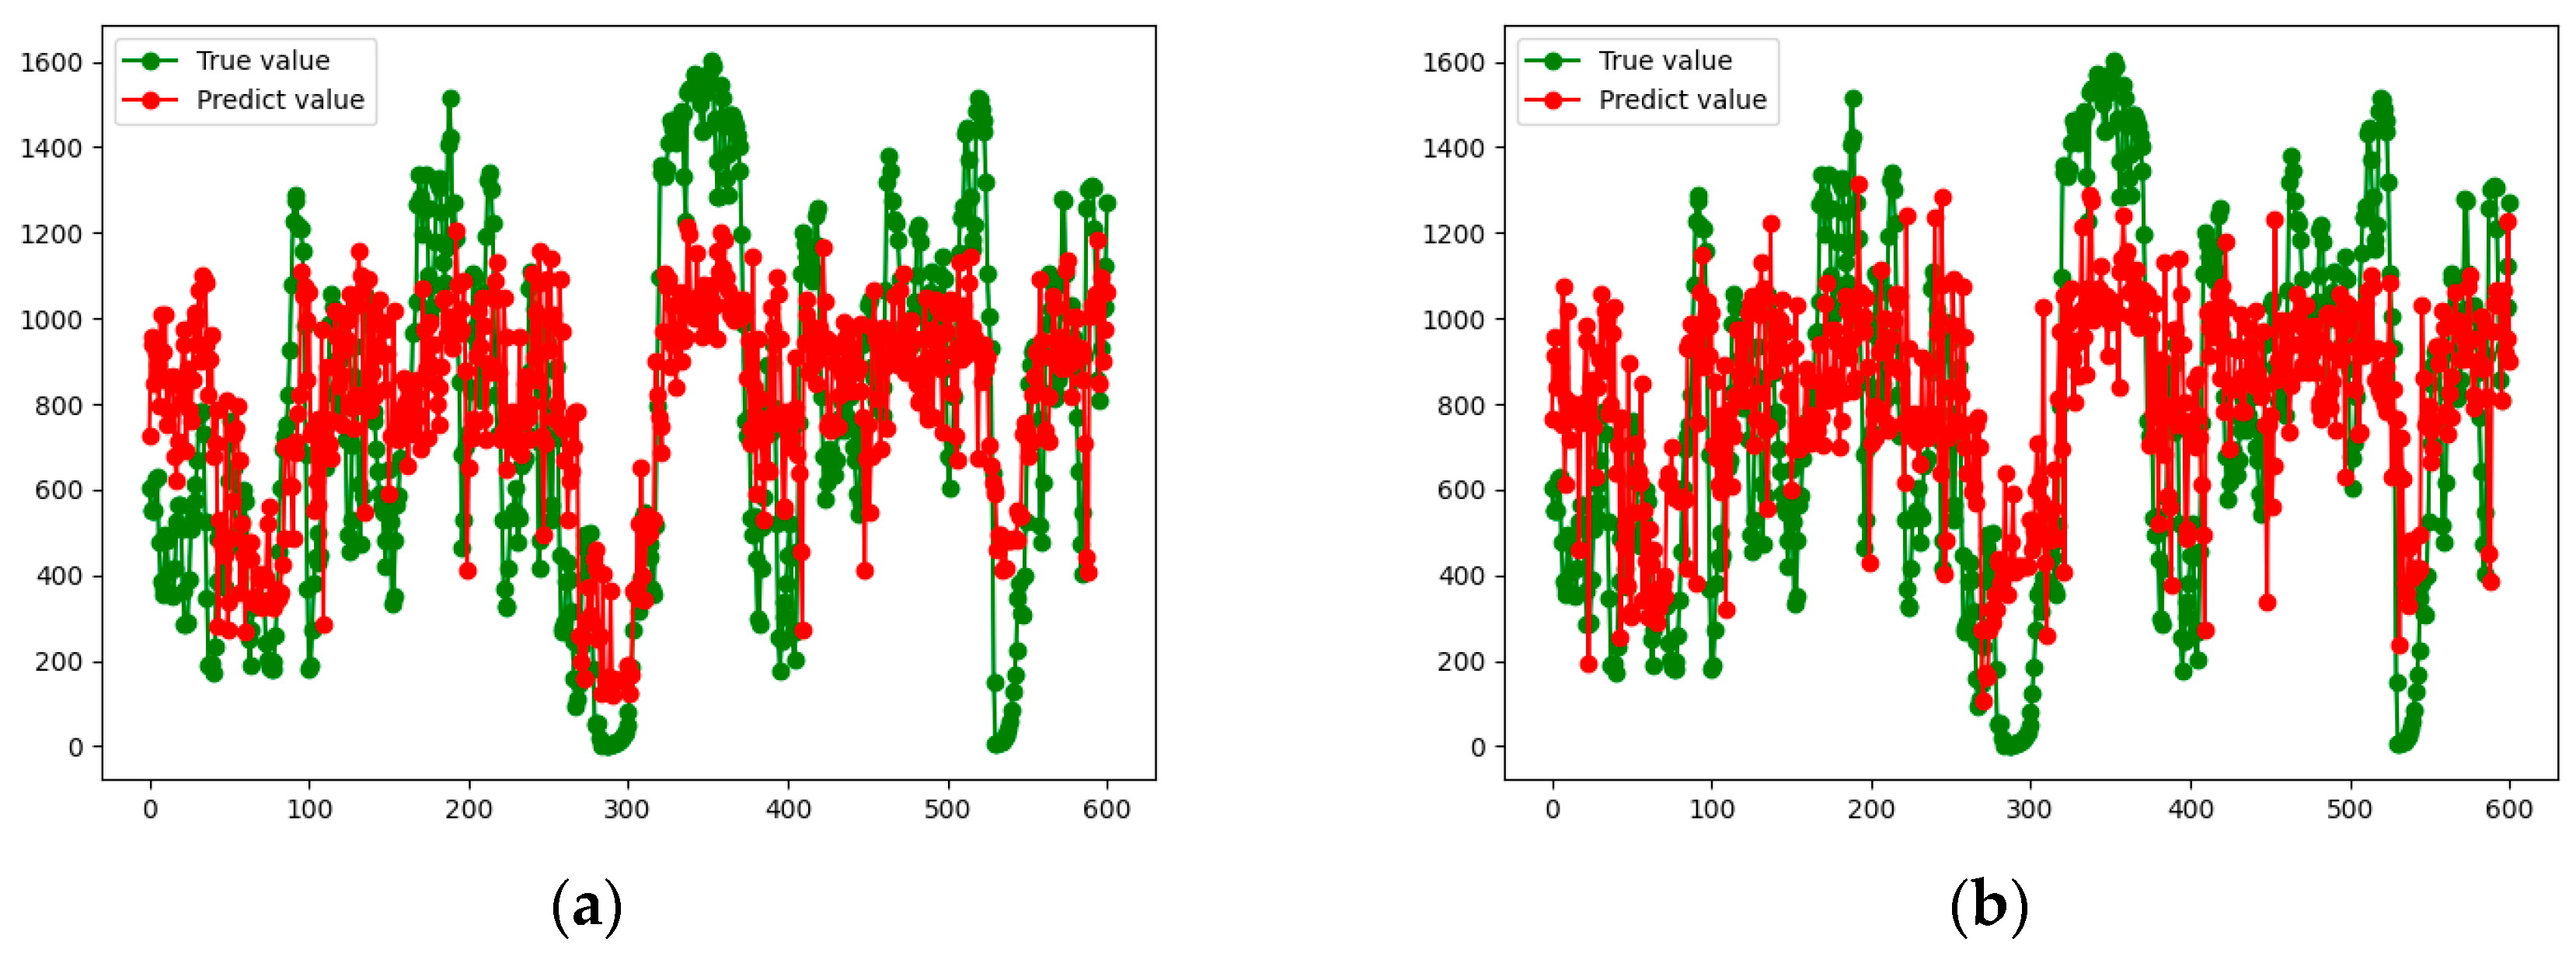
Figure 8,
Figure 9,
Figure 10 and
Figure 11 show the true and predicted values obtained by each algorithm for each vehicle.
From the results presented in
Figure 8,
Figure 9,
Figure 10 and
Figure 11, it can be concluded that the prediction accuracy of the RF algorithm is better than that of the GBDT model. However, in general, the prediction accuracies of the two algorithms are low, and the results differ greatly from the actual situation, so they are not suitable for practical application. This also motivates us to develop a new approach, which is presented in the next subsection.
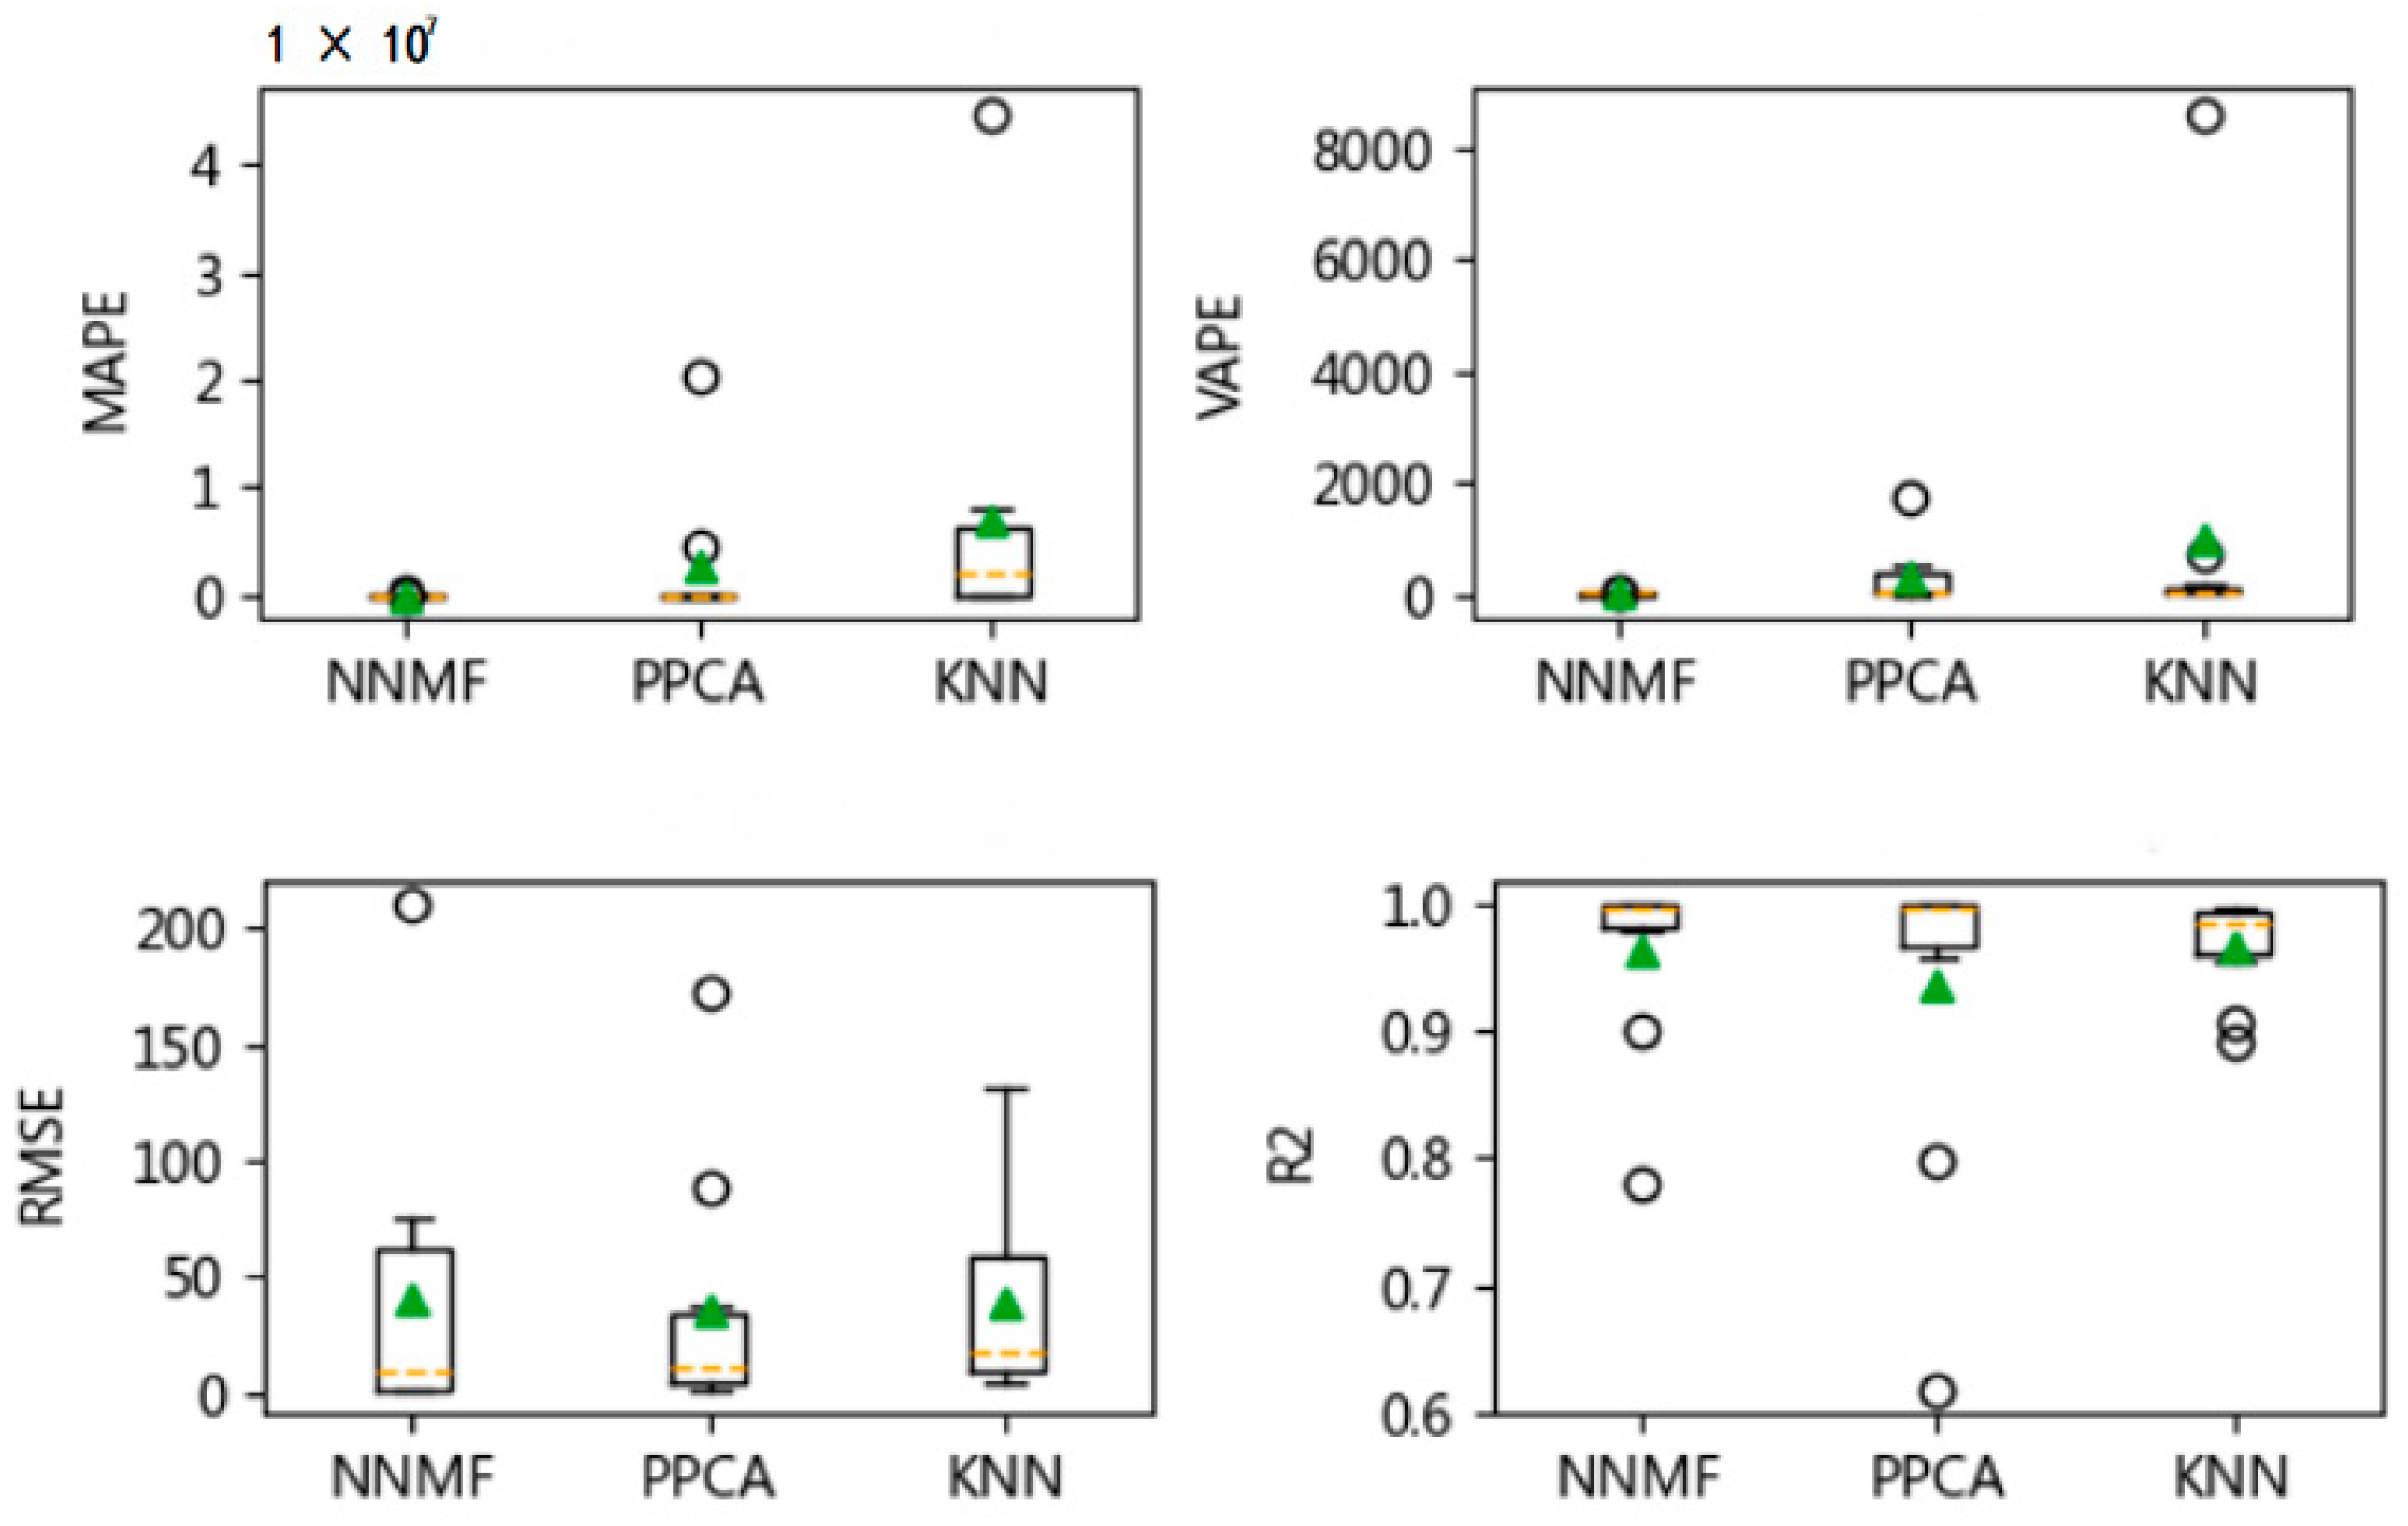
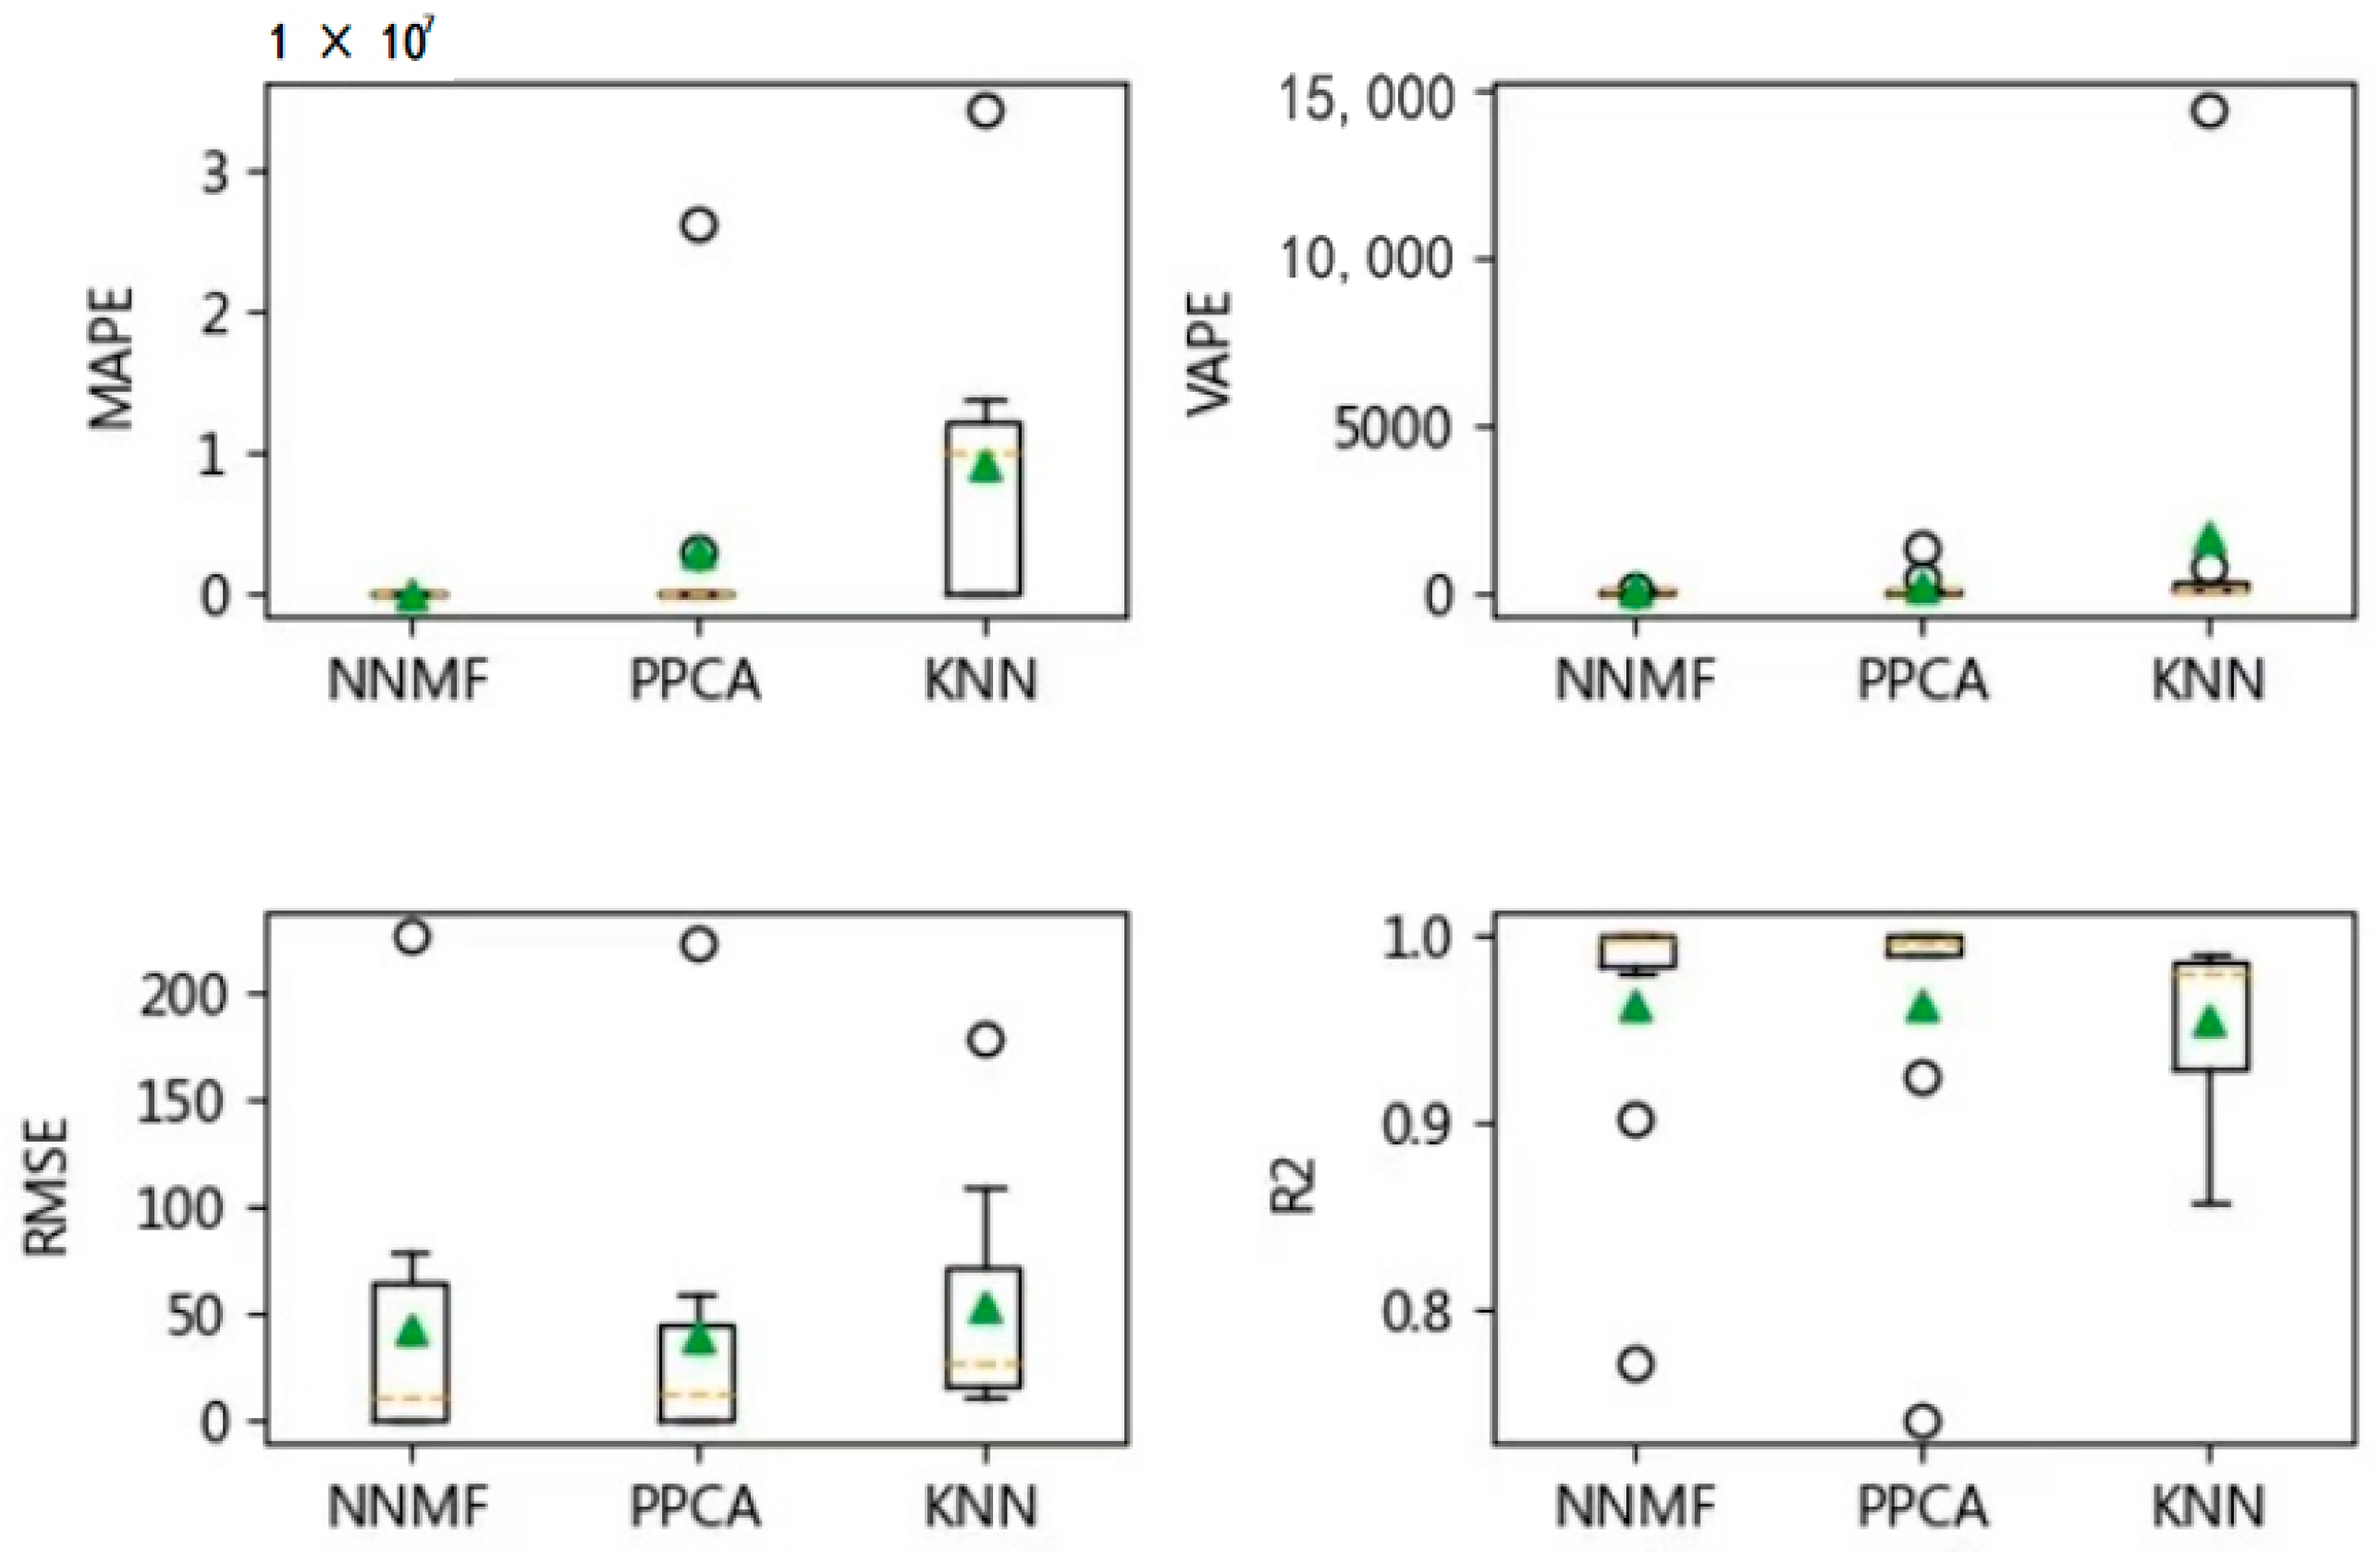
7.3.2. Repairing Performance of the Matrix-Based Repairing Method
Three algorithms, NNMF, PPCA and KNN, used for the data repairing in this approach, have types of matrix characteristics in one or more aspects, such as a matrix containing multiple parameters (e.g., atmospheric pressure, engine output torque, engine speed and NO
x, etc.), which is involved in the data imputation process. In the experiments presented here, the missing rates of the data of the four vehicles were set as 0.1, 0.3, and 0.6.
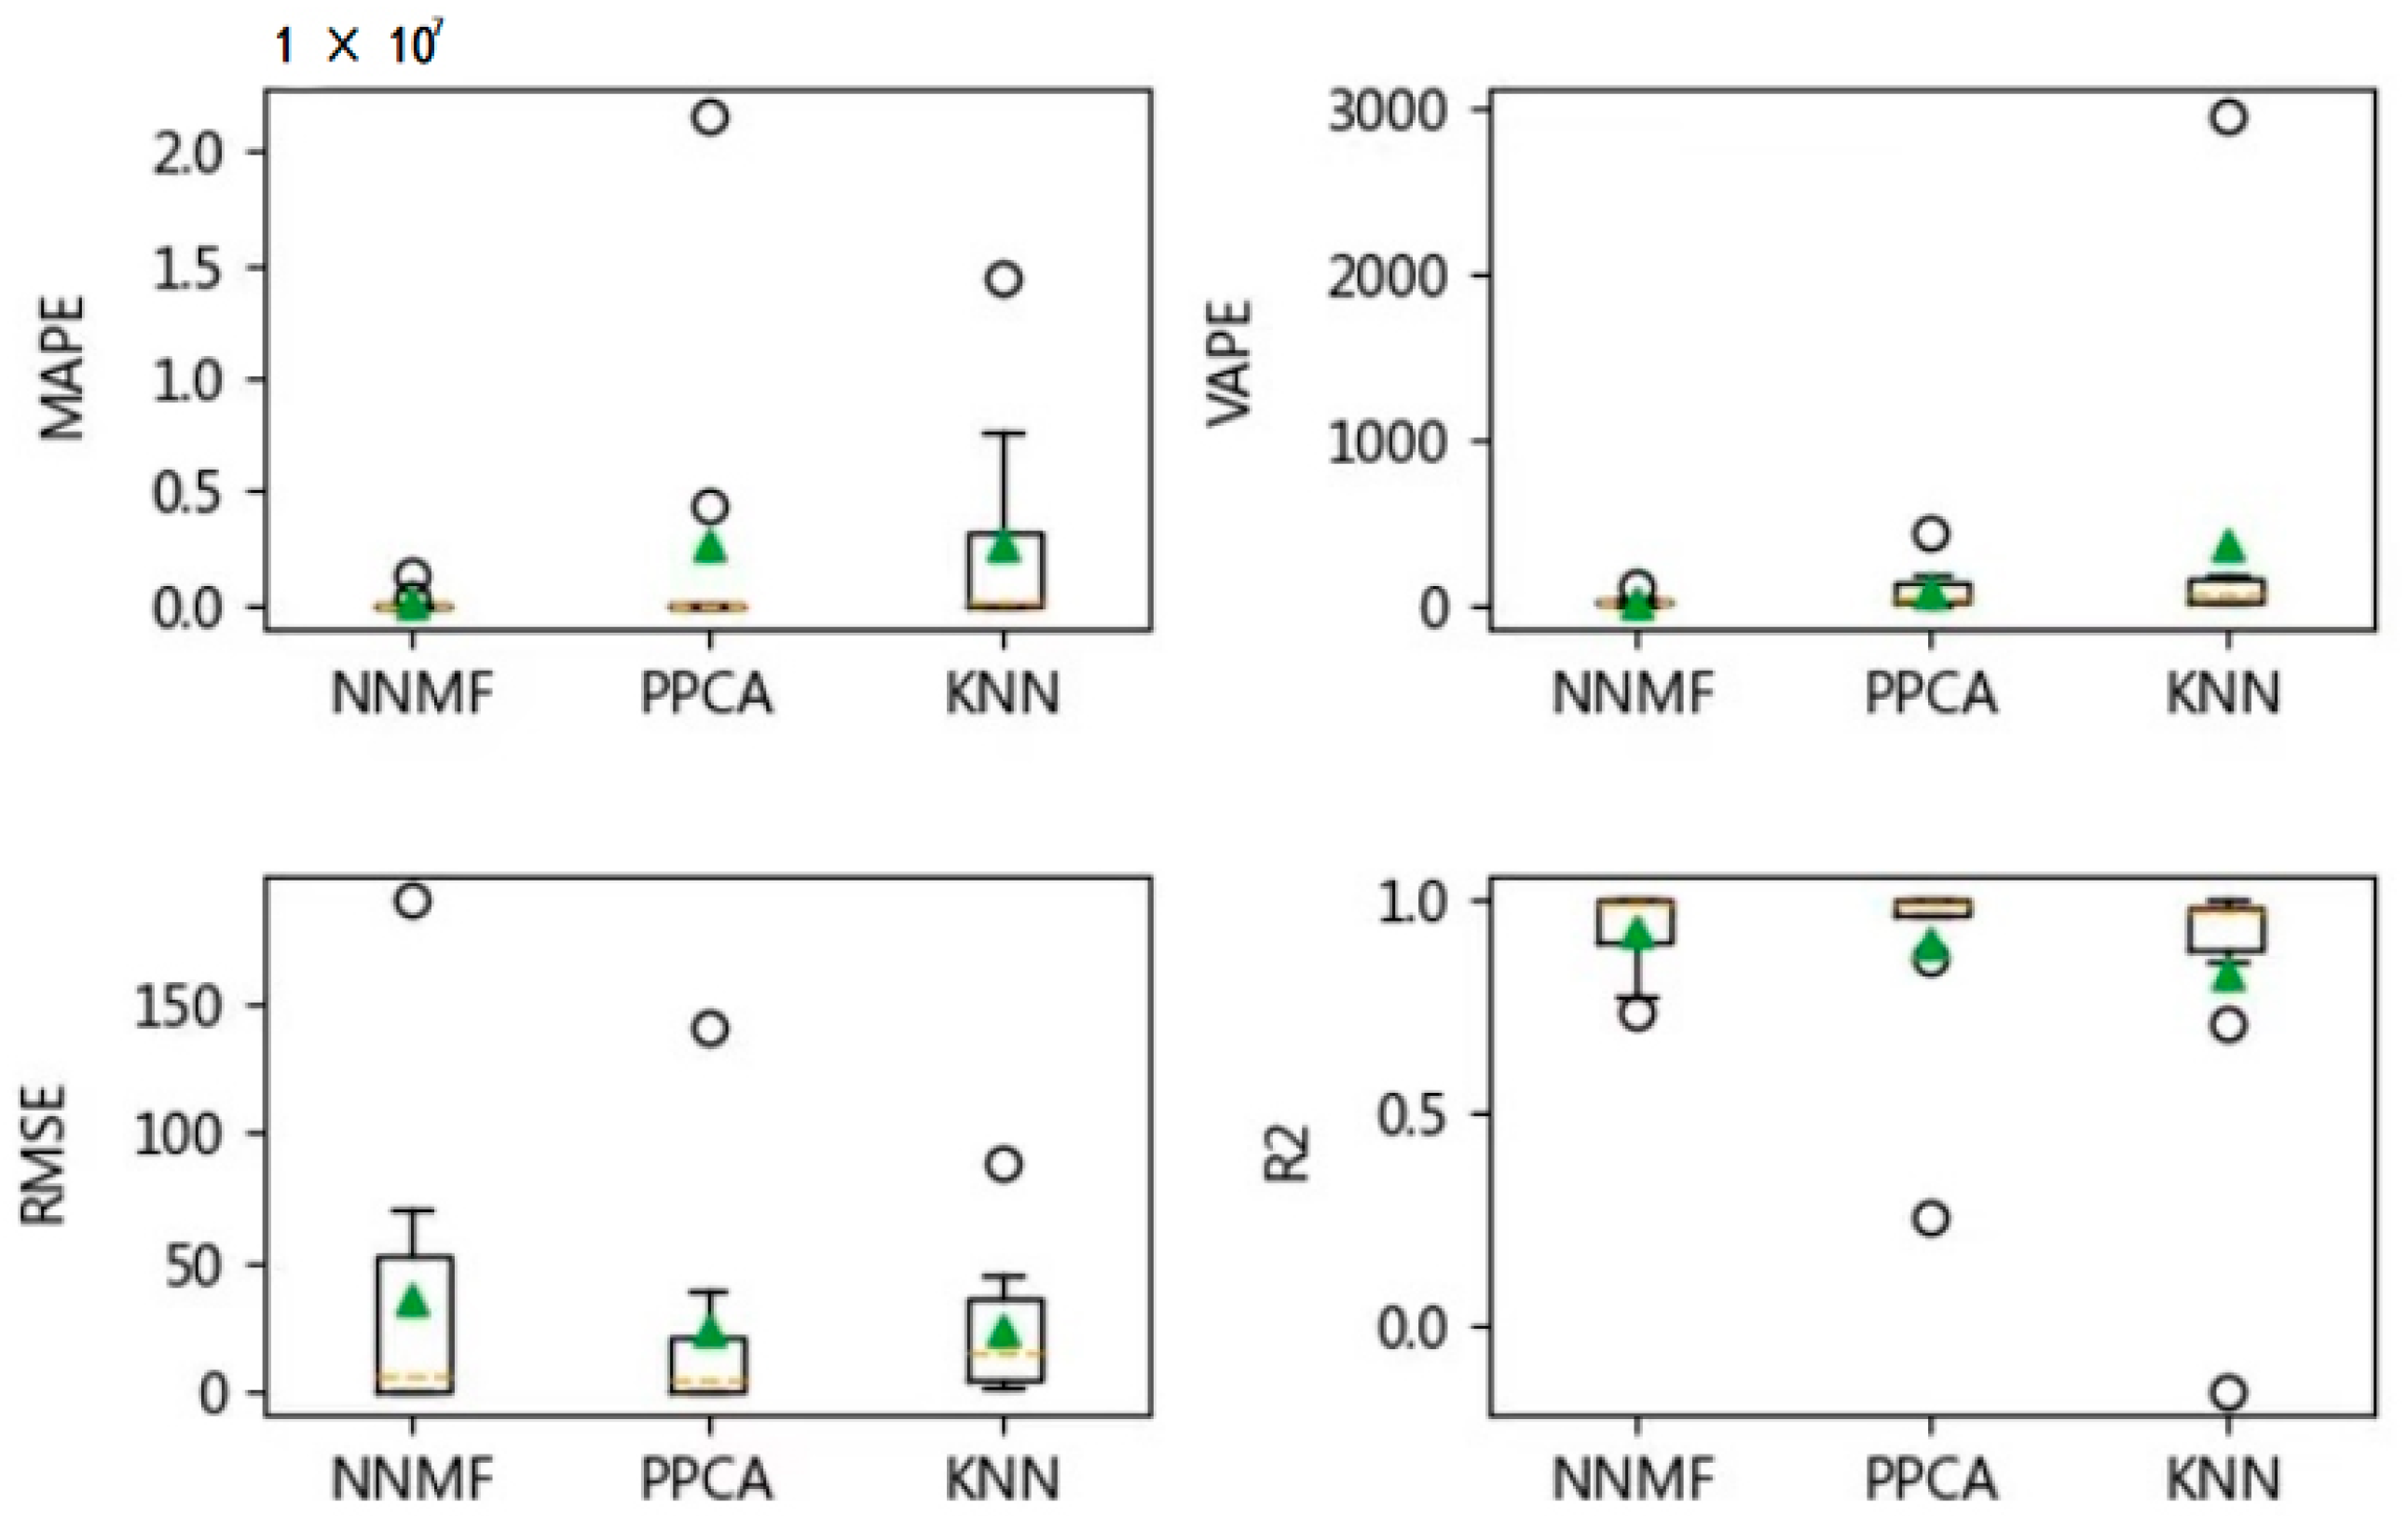
Figure 12,
Figure 13 and
Figure 14 show the MAPE, VAPE, RMSE, and R
2 values for the imputation results obtained by three algorithms for the vehicle of ***Y278 under different missing rates, respectively. As the evaluation results obtained for the other three vehicles are very similar to those for the vehicle of ***Y278, we omitted the results to avoid unnecessary repetition here.
The three algorithms are ineffective when the missing rate is higher than 0.6 or when a variable is completely missing. Therefore, the results obtained under the missing rate up to 0.6 are presented. There is no significant difference in the prediction performance of each algorithm under the different missing rates, and the evaluation results indicate that the NNMF and PPCA algorithms outperform the KNN algorithm, in general. Although a more accurate prediction (indicated by MAPE, RMSE and R2) can be achieved by PPCA as compared to NNMF, the prediction performance of NNMF seems more stable than PPCA. Therefore, it is recommended that NNMF and PPCA can be applied for the data imputation with multiple variables.
8. Conclusions
The detection of excessive emissions is an important part of vehicle emission pollution control and also plays a key role in pollution prevention. On the basis of the current OBD monitoring system, this paper proposes a method for the determination of excessive nitrogen oxide emission. In light of the poor quality of the raw NOx data from the SCR downstream sensor, a process to assess the data quality is first performed. Subsequently, a data repairing process is conducted for the data containing missing or abnormal values. To avoid the side effect of instant extreme values, the moving average strategy is adopted to develop three methods to generate the aggregated NOx concentration level, which is used to identify the possibility of excessive emission. Two strategies are applied to the data with low quality. One is to avoid direct data repairing and predict whether the emissions exceed thresholds based on the other variables, and the other uses the data imputation algorithm to estimate the values for the NOx missing data before determining excessive emissions.
In this study, we examined three algorithms, namely RF, GBDT and SVM, in the prediction for the possibility of excessive emissions. Although the SVM algorithm slightly outperforms the other two for the test vehicles, there is no significant difference between the three algorithms in terms of prediction accuracy. From the model complexity, the SVM algorithm is recommended first. Furthermore, to impute the missing values for the NOx data, we investigated NNMF, PPCA and KNN for the data with multiple variables under different missing rates. The experimental results indicate that the most accurate data imputation can be achieved by PPCA, however, the imputation performance of NNMF is more stable. However, when missing data are imputed by the values predicted by either RF or GBDT, the accuracy is low and this problem should be investigated further in future studies. Although a general framework for an approach to determine excessive emissions is proposed and allows to embed various algorithms for data repairing or prediction, further research is required to examine more algorithms for data repairing and prediction as new data becomes available.


