Article

Bioaerosol Seasonal Variation and Contribution to Airborne Particulate Matter in Huangshi City of Central China

1
Hubei Key Laboratory of Mine Environmental Pollution Control and Remediation, School of Environmental Science & Engineering, Hubei Polytechnic University, Huangshi 435003, China
2
Research Centre for Complex Air Pollution of Hubei Province, Wuhan 430079, China
3
Ecoenvironmental Monitoring Centre of Hubei Province, Wuhan 430079, China
4
School of Computer Science and Technology, Wuhan University of Technology, Wuhan 430063, China
*
Author to whom correspondence should be addressed.
Atmosphere 2022, 13(6), 909; https://doi.org/10.3390/atmos13060909
Submission received: 11 May 2022 / Revised: 27 May 2022 / Accepted: 30 May 2022 / Published: 3 June 2022
(This article belongs to the Section Aerosols)

Abstract

:
Ambient bioaerosols affect ecosystems and public health, but their seasonal variations and their contributions to aerosol particles are limitedly understood. Ambient bioaerosols in PM2.5 and PM10 samples were measured in Huangshi City, Hubei Province of China from April 2018 to December 2018. Bioaerosols were measured using a fluorescence microscope after staining with 4′, 6-diamino-2-phenylindole dihydrochloride (DAPI) following a direct staining technique. The bioaerosol number concentrations ranged from 0.12 to 15.69 # cm−3 for PM2.5 and 0.22 to 18.20 # cm−3 for PM10, with averages of 2.79 # cm−3 and 4.66 # cm−3, respectively. The bioaerosol concentrations of PM2.5 and PM10 varied significantly by seasons and were arranged in the following descending order: spring > fall > winter > summer. Bioaerosol numbers were dominated by fine particles of 0.37–2.5 μm diameter, while the spring bioaerosol particles were detected at the peak concentration of 0.56–1 μm diameter. Bioaerosol fractions accounted for 18.3 ± 10.6% PM10 mass and 13.7 ± 12.5% PM2.5 mass. Bioaerosol concentrations were increased during the haze event, but the increased amounts were not as large as those of the dust event, and higher bioaerosol contributions to PM were observed in the dust event than in the haze event. As enhanced emission controls have reduced PM concentrations in China, bioaerosols can be important contributors to PM mass.

1. Introduction

Bioaerosols, including fur fibers, dandruff, skin fragments, plant fragments, pollen, spores, bacteria, algae, fungi, and viruses [1], have been significantly addressed by quantitative studies about airborne particulate matter (PM) in the last decade, with recognized increasing importance of their mass contribution and of their role in health, climate and atmospheric pollution issues [2]. Bioaerosols are recognized as one of the main transmission routes for infectious diseases and are responsible for various other types of health effects through inhalation and potential ingestion [3,4,5,6,7,8,9,10]. Endotoxin is a bioaerosol component that is known to pose a significant threat to the natural environment and all forms of life [11,12]. Biological particles in the atmosphere are a distinctive category of ice nucleating particles due to their capability to facilitate ice crystal formation in clouds at relatively warm temperatures [13]. Bioaerosols can serve as nuclei for cloud droplets, ice crystals, and precipitation, thus influencing the hydrological cycle and climate [14,15,16,17,18]. Microbes of PM, such as bacteria and fungi, as well as metals, could strongly influence the PM oxidative potential [19].
Some studies suggest that bioaerosols can significantly contribute to PM; however, the results vary substantially. Elbert et al. [20] found that fungal spores attributed an average of 35% of the aerosol (1–10 μm) mass in the Amazon during dry season. Based on measurements in Vienna, the contribution of fungal spores to PM10 in spring and summer was reported to be 3–7% in suburban areas and 1–4% in urban areas, respectively [21]. However, the contribution of fungal spores to PM10 mass ranged from 1.6 to 18.2% in the spring of Jianfengling Mountain, a tropical rainforest on Hainan Island, China [22]. In Corcoran, an agricultural town in California, during fall corresponding to the cotton harvest season, the sum of fungal spores, pollen grains, and plant detritus was estimated to account for averages of 11.2–14.8% PM10 mass [23]. The contribution of bioaerosol (>0.4 μm) to the total mass concentration of PM10 in Rome was reported to be in the range 0.3–18% over one year [24]. Bioaerosol contributed approximately 47% of the in situ PM2.5–10 mass in the Lesser Khingan Mountain boreal forest of China [25]. Chen et al. [26] demonstrated the practicality of using a direct staining (DS) technique, coupled with epifluorescence microscopy (FM), to quantify bioaerosols collected on filters. The DS-FM method measured the bioaerosol number concentration and size distribution, from which the bioaerosol mass can be estimated. The DS-FM method had been applied to PM2.5 and PM10 filter samples collected in Las Vegas, NV USA [26], and Huangshi, China [27], where the PM10 bioaerosol fractions were 17% and 4.8%, respectively.
Studies using the DS-FM method to estimate bioaerosol mass have mainly been conducted in one season, with little information on all four seasons throughout a year. Meteorological conditions vary significantly in different seasons. This paper reports the bioaerosol concentration, size distribution and estimated bioaerosol contributions to PM mass at an urban site in Huangshi, China, during all four seasons. The results of this work will help improve our understanding of bioaerosol contributions to PM and provide insights into the seasonal variation of bioaerosols.

2. Materials and Methods

The sampling site (30°12′35.71″ N, 115°01′30.75″ E) was located on the rooftop of a five-story building (about 15 m AGL) on the campus of Hubei Polytechnic University (HBPU) in Huangshi City (Figure 1).
Ambient PM2.5 and PM10 samples were collected during four periods representing different seasons to evaluate bioaerosol concentrations and size distribution under different environmental conditions: April 2018 (spring), June 2018 (summer), October 2018 (fall) and December 2018 (winter). Excluding the days of instrumental malfunction, consecutive days of 15 to 30 days were selected in every sampling month. The sampling date of each month is shown in Table S1. Daily samples were collected at 01:00 p.m. and lasted for 5–8 h, on 47 mm diameter black polycarbonate filters (PCTE, 0.2 μm pore size, Whatman, Little Chalfont, UK) by using a pair of MiniVol samplers (Airmetrics, Springfield, OR, USA) equipped with size-selective inlet sampling at ~5 L min−1. A total of 90 pairs of PM2.5/PM10 samples were collected in 2018. All collected filters were stored at −20 °C until further processing.
Hourly PM2.5 and PM10 mass concentrations were measured using a tapered element oscillating microbalance (1405 TEOM™, Thermal Fisher Scientific, Waltham, MA, USA) located at ~100 m from the HBPU site, as part of the Ministry of Ecology and Environment compliance network to determine Air Quality Index (AQI).
The environment indices (SO2, NO2, CO, and O3) were obtained from the Huangshi Ecology and Environment Bureau (http://sthjj.huangshi.gov.cn/ accessed on 1 January 2019). Local meteorological parameters such as wind speed and precipitation were obtained from the China Weather Network (http://www.weather.com.cn/weather/101200601.shtml accessed on 1 January 2019).
Bioaerosols were measured using a fluorescence microscope after staining with 4′, 6-diamino-2-phenylindole dihydrochloride (DAPI) following the DS-FM protocol as described in the literature [26,27]. Flowchart of bioaerosol analysis method is shown in Figure 2. Briefly, a 13 mm diameter disc, which punched out from the PM2.5 or PM10 sample filter, was put on a drop of DAPI working solution (20 μg/mL), stained at room temperature in the dark for 20 min. The stained sample filter was placed on a glass slide, a drop of water-soluble, antifading, adhesive was added (Mounting Medium, Solarbio, Beijing, China), then the filter was covered with a coverslip. The prepared sample slides were examined under a fluorescence microscope (DM2500, Leica, Germany) equipped with a CCD camera (DFC450 C, Leica, Germany) and a filter cube containing a 350/50 BP excitation filter, a 400 nm dichromatic mirror and a 460/50 BP emission filter, specific for DAPI bound to DNA. About 30 images of view (0.218 × 0.163 mm2) were captured for each sample at 400× magnification to represent the entire 13 mm diameter deposit area. ImageJ® then quantified the particle number in the image and the projected area of each particle, yielding the equivalent projected area diameter. Particles smaller than 15 pixels, for which the cut-off diameter was 0.37 µm, were excluded to suppress false positives. Bioaerosol number concentration of a particular sample was calculated from the average particle counts for all fluorescence images taken for the sample. The first-order approximation assumes spherical particles; the particle volume was estimated by the area diameter. An assumption of 1 g cm−3 [23,28] was used as particle density in this study for all bioaerosol particles. All number and mass concentrations were reported in # cm−3 and µg m−3, using recorded MiniVol sampling time and flow rate. Daily bioaerosol results are expressed by bioaerosol concentration, size distribution and bioaerosol mass. Errors from the bioaerosol count and flow rate were propagated to yield the measurement uncertainty.
Normal distribution of data was tested using Kruskal–Wallis tests; since daily data of different seasons did not follow normal distribution using both statistical tests, Spearman correlation coefficient was used. Excel 2013 and SPSS 19.0 software were used to statistically analyze the experimental data.

3. Results and Discussion

3.1. Seasonal Variation in Bioaerosol Concentrations and Size Distribution

The seasonal variations in bioaerosol number concentration in Huangshi in 2018 are shown in Table 1 and Table S1. The bioaerosol number concentrations ranged from 0.12 to 15.69 # cm−3 for PM2.5 and 0.22 to 18.20 # cm−3 for PM10, with averages of 2.79 # cm−3 and 4.66 # cm−3, respectively. The bioaerosol concentrations of PM2.5 and PM10 varied significantly with seasons (Kruskal–Wallis, p < 0.05, respectively), which could be arranged in the following descending order: spring > fall > winter > summer (Table 1). This result might be attributed to seasonal climate characteristics of Huangshi, which had a mild rainy spring, hot rainy summer, warm dry fall and cold humid winter in 2018.
The higher bioaerosol levels in spring and fall might be attributed to warm seasons, which favor bacterial growth, and, thus, more microbes bred in and were released from local sources [29,30], such as soils, water bodies, and vegetation [31]. With suitable rain in spring, microbes grow and reproduce, which increases the sources of bioaerosols. Further, rain can disperse soil microbes into the air [32]. Among the 18 spring samples, 5 samples were collected during the rainfall, and 4 samples were collected after the rainfall. Furthermore, the bioaerosol concentrations were high in spring due to a dust event from 15 April 2018 to 17 April 2018, where the maximal bioaerosol concentrations were detected. Dust is a substantial source of airborne bacteria [33], and bioaerosol concentrations increased remarkably during dust events [33,34]. During the dust event on 15 April 2018, compared to the non-dust day, bioaerosols in PM2.5 and PM10 were enriched by 3.4 and 4.8 times, respectively.
Excessively high or low temperatures are not conducive to the growth and propagation of microbes, and may lead to a decrease in the number of microbes from some sources [35,36]. This may be the reason for the lower bioaerosol concentrations in summer and winter. A study by Tang [37] suggested that temperatures above 24 °C appear to universally decrease airborne bacterial survival. The average summer temperature was 29 ± 4 °C, which may be unfavorable for airborne microbes.
The current seasonal variation results were similar to those obtained by Bowers et al. [38] and Zhen et al. [30], who observed higher total bacterial concentrations in spring and fall seasons and lower concentrations in summer and winter seasons. However, Dong et al. [39] and Xie et al. [40] observed the highest bioaerosol concentrations in winter and the lowest in summer in Xi’an and Qingdao, China. The discrepancies with our current study might be due to variable seasonal climate characteristics in different geographic regions and pollution events.
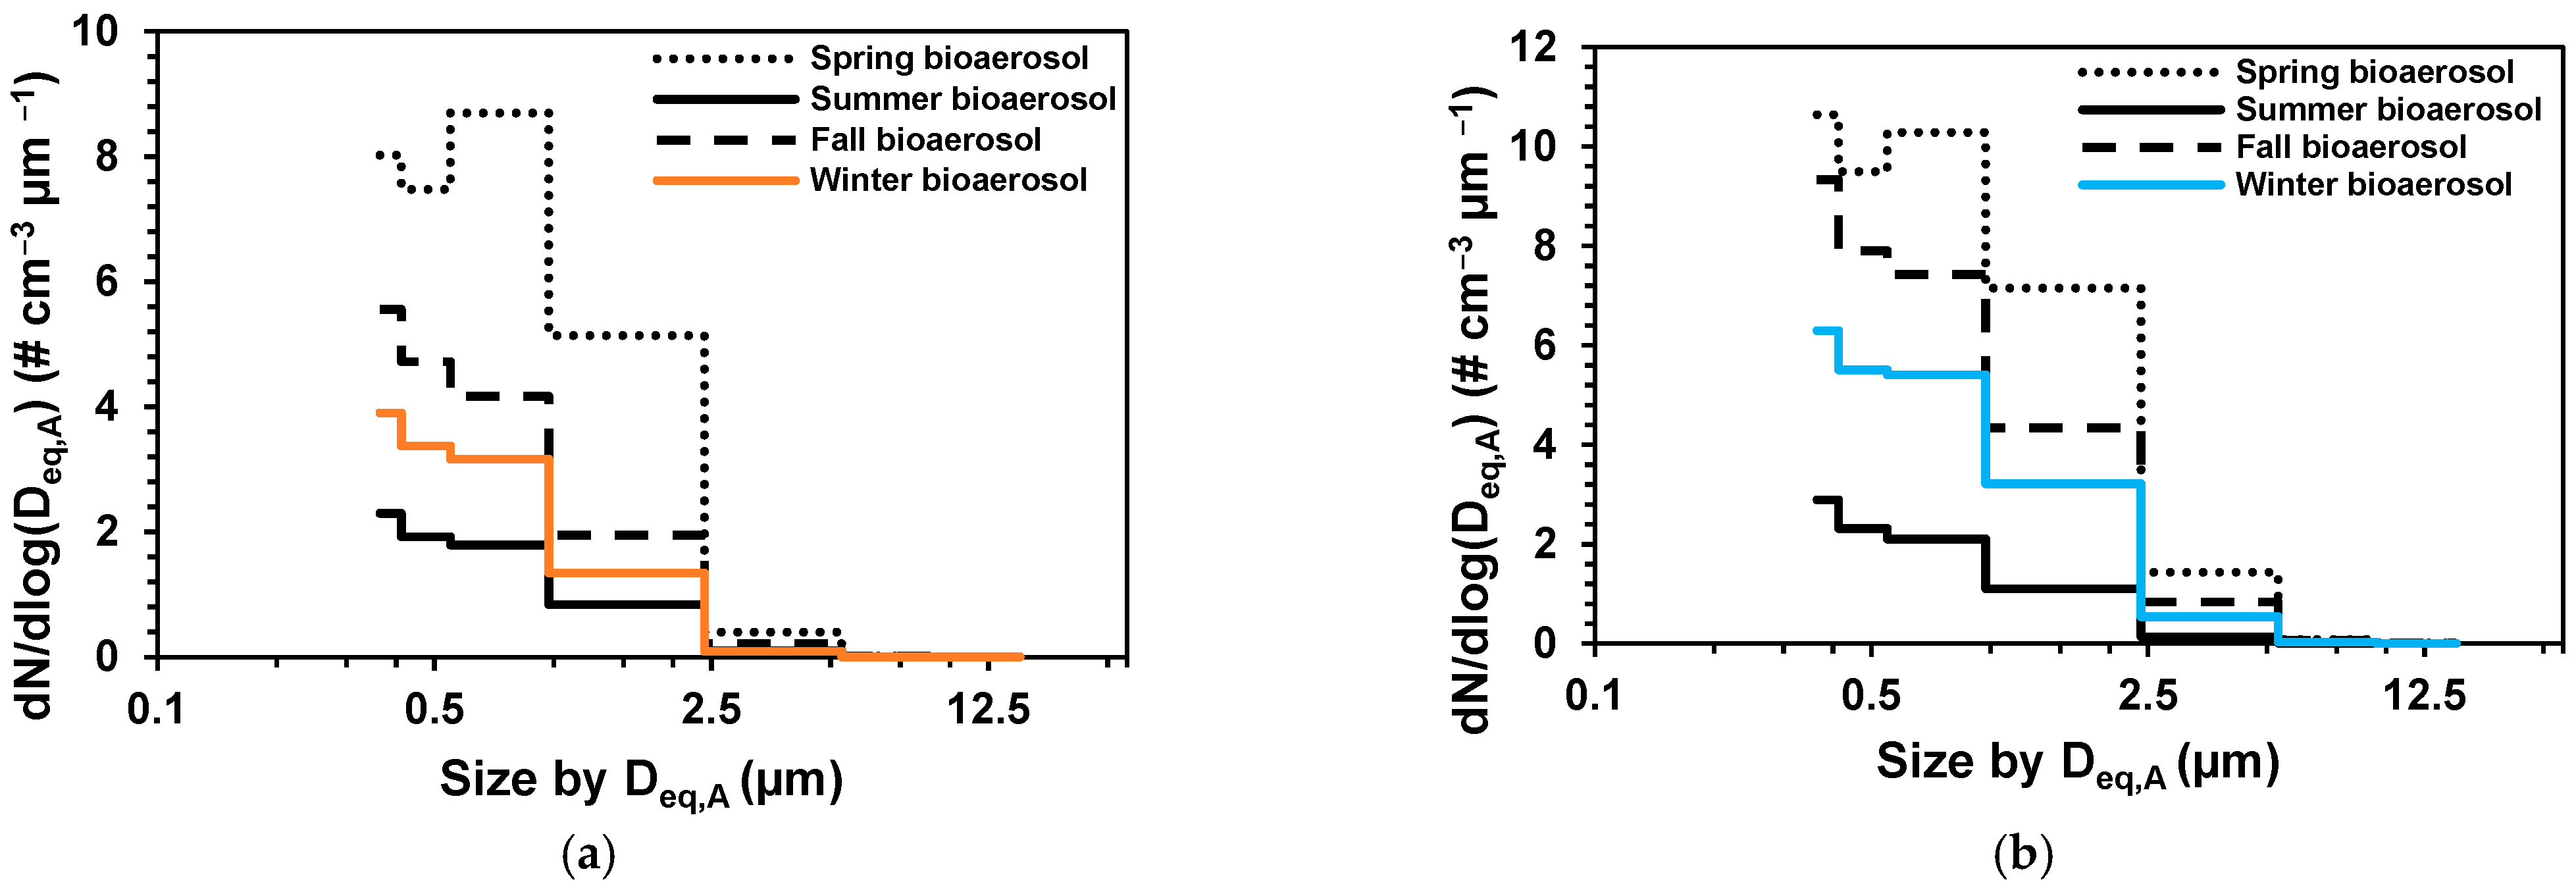
With respect to the particle size–number distribution, the bioaerosols of four seasons were dominated by fine particles of 0.37–2.5 μm diameter (Figure 3). Unlike the other three seasons, the spring bioaerosol particles were detected at the peak concentration of 0.56–1 μm diameter. Image analysis showed that coarse particles (Deq,A > 2.5 µm) accounted for an average of 2.6% and 5.7% of bioaerosols in PM2.5 and PM10 samples, respectively. The small fraction of coarse particles in PM2.5 samples, which may be large particles with low density, reflects the imperfect Mini-Vol size-selective inlet that passes some coarse particles [26].

3.2. Contribution of Bioaerosol to PM Mass

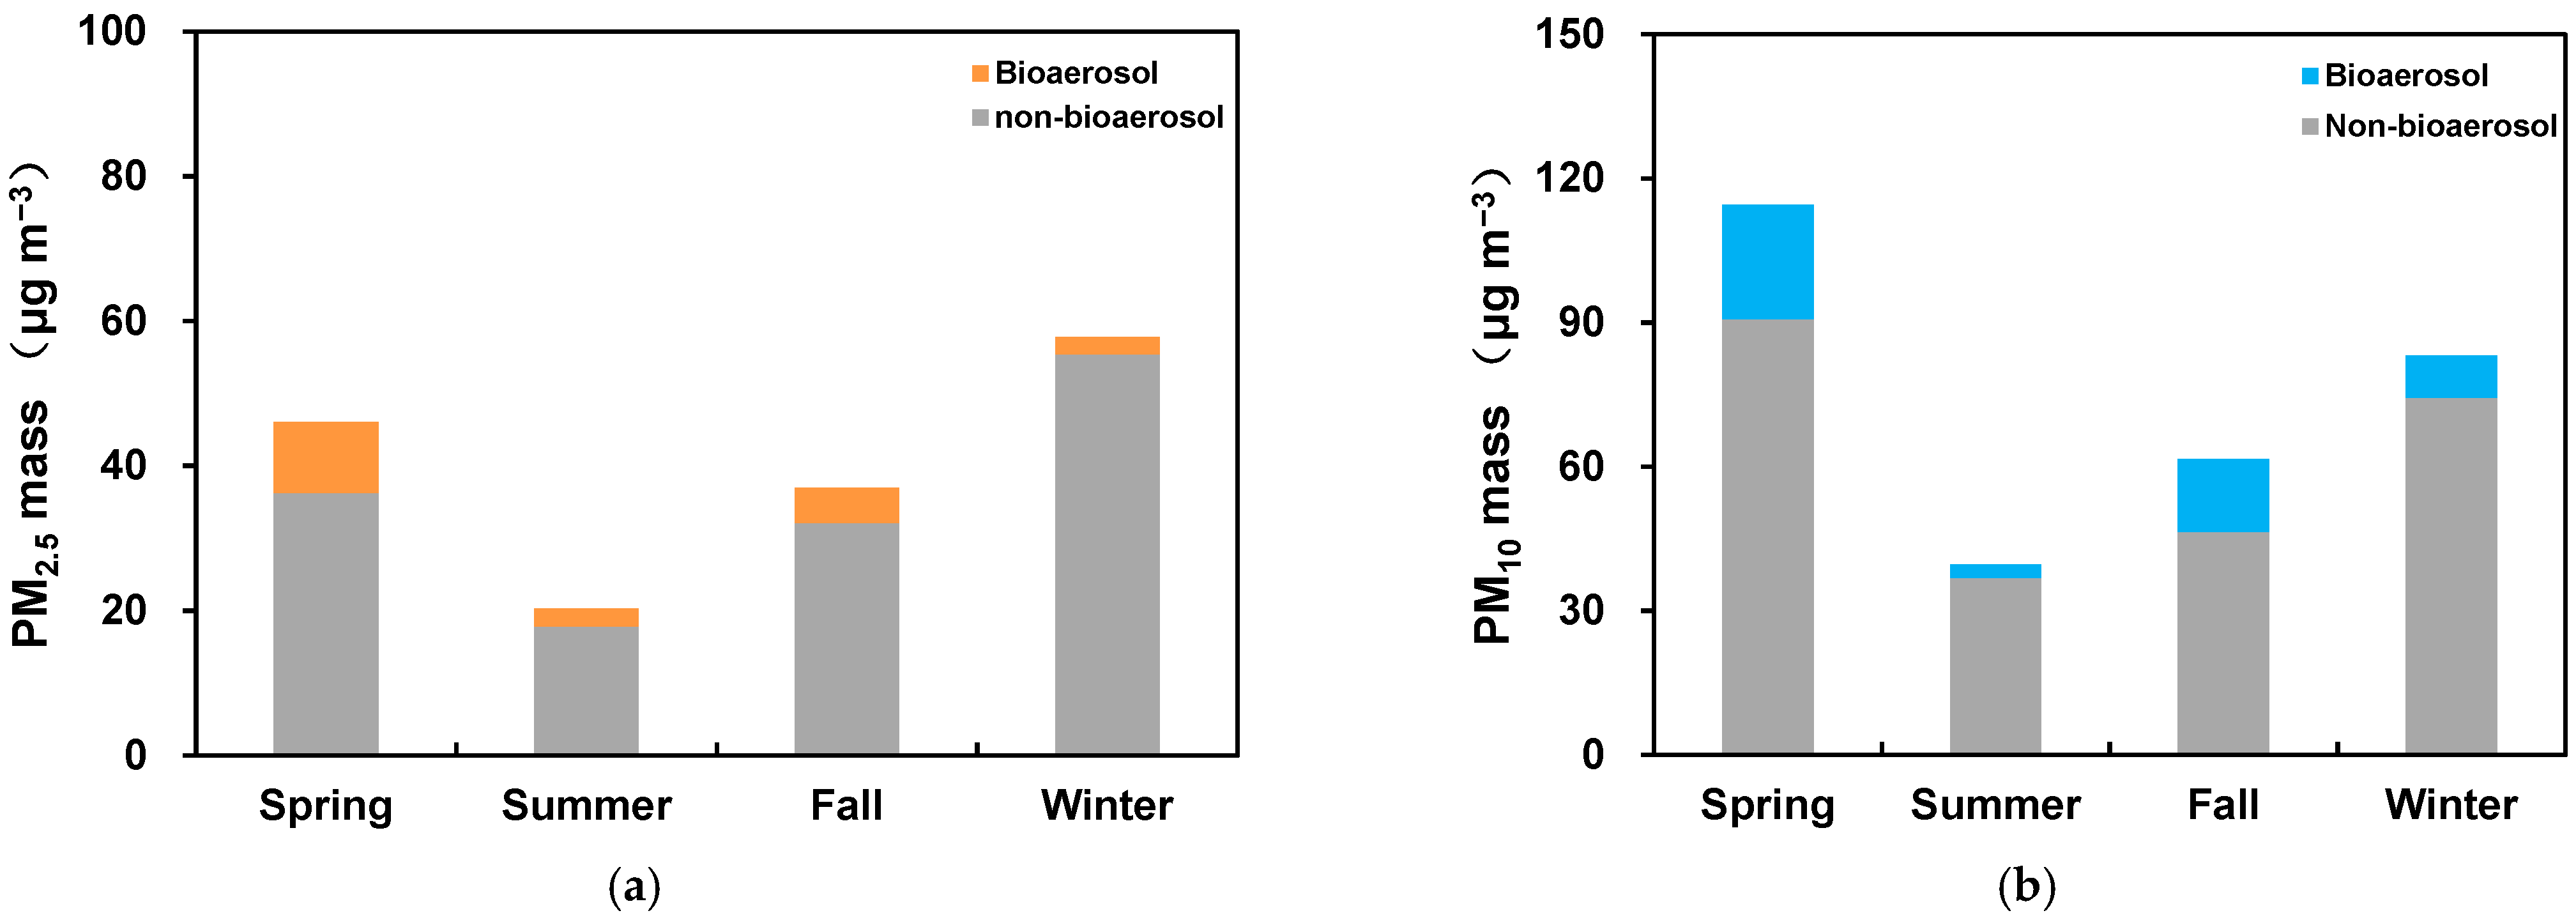
The seasonal variations in PM mass and bioaerosol mass in Huangshi in 2018 are shown in Figure 4. The PM2.5 mass ranged from 4 to 141 µg m−3, with an average of 43 µg m−3, while the PM10 mass ranged from 11 to 361 µg m−3, with an average of 75 µg m−3. The bioaerosol component, therefore, accounted for 13.7 ± 12.5% (4.7 µg m−3) of PM2.5 mass and 18.3 ± 10.6% (13 µg m−3) of PM10 mass. The contributions of bioaerosol to PM2.5 were higher in spring and summer, with average values of 22% and 19.8%, and lower in fall and winter, with average values of 14.6% and 4.5%. In terms of the contribution to the mass concentration of PM10, bioaerosol accounted for 23.7%, 9.1%, 25.8% and 11.3% during the spring, summer, fall and winter, respectively. This is consistent with the average bioaerosol fractions of 0.3–35% in PM10, reported in previous studies (Table 2). Along with enhanced emission controls, which have lowered the PM concentrations from combustion and dust sources, bioaerosol contributions to PM will become more important in China.

3.3. Correlation between Bioaerosol and Environment Indices and Meteorological Conditions

Temperature, relative humidity, wind speed, O3, NO2, SO2, CO and ambient PM may influence bioaerosol number concentrations. Correlation coefficients (r) indicate the extent to which different concentrations vary with each other, either because they are in the same particles, in different particles deriving from the same source, or affected by the same meteorology [41]. Table 3 demonstrates that correlations are low between bioaerosol concentrations, air pollutants and meteorological conditions. A low positive correlation was established between bioaerosol numbers and O3 concentrations (r = 0.38 and 0.31, to PM2.5 bioaerosol and PM10 bioaerosol, respectively), which is contrary to some previous results [40,42,43,44]. Except SO2, gas pollutants (O3, NO2 and CO) had low correlation with the bioaerosol numbers, which is consistent with previous results [30]. The reason for the weak correlations of gas pollutants may be gas pollutant concentrations, as they did not reach a toxicity threshold [30]. Furthermore, low correlations (r < 0.5) are not useful for predictive purposes, even though statistical tests might show that the relationships are significant [23]. PM2.5 and PM10 masses were significantly positively correlated with bioaerosol number concentrations, and relative humidity was negatively correlated with bioaerosol concentrations, which is consistent with previous research in Huangshi [27].

3.4. Bioaerosol Concentrations and Size Distribution during a Dust Event

During the sampling period, a dust event occurred on 15 April 2018, with a PM10 concentration of 361 μg m−3 and a PM2.5 concentration of 56 μg m−3, indicating characteristics of coarse aerosol particle pollution. Back trajectory analysis reveals the possible transport of dust masses from Northern China (Supplementary Figure S1). Increased bioaerosol concentration was detected on a dust day (Table 4).
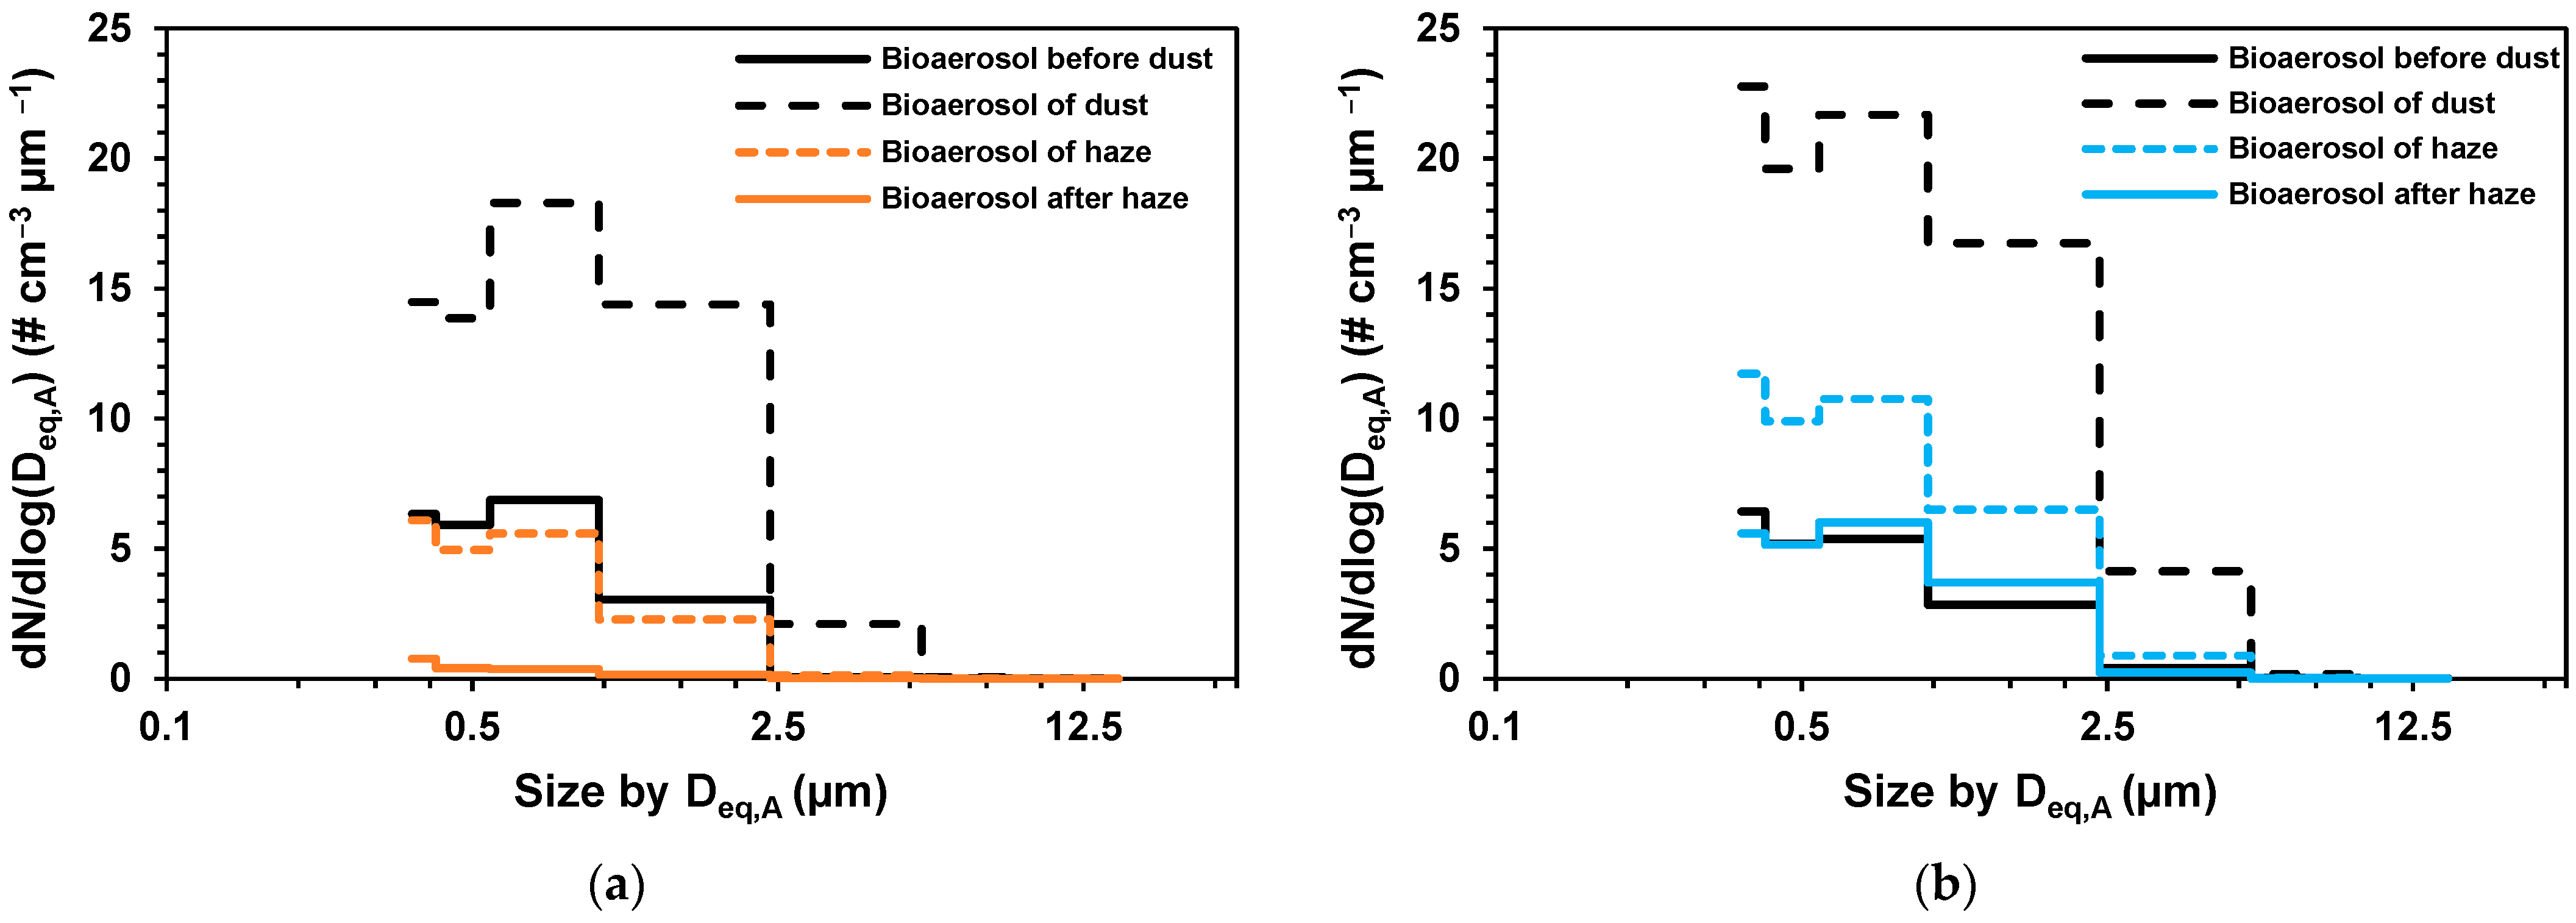
Several prior studies found that airborne bacterial concentrations during a dust event were one to two orders of magnitude higher than those in non-dusty air during dust events [33,34,45]. This study is consistent with their findings that the bioaerosol concentrations in dust air were one order of magnitude higher than those in non-dust air, and reached 17.29 # cm−3 and 13.6 # cm−3 in PM10 and PM2.5, respectively. According to the size distribution (Figure 5), sharp rises were detected in coarse bioaerosol particles on a dust day. In the PM2.5 sample, 0.37–1 µm particles increased by 1.4 times, 1–2.5 µm particles increased by 3.7 times, and 2.5–5.6 µm particles increased by 30.6 times. In the PM10 sample, 0.37–1 µm particles increased by 2.8 times, 1–2.5 µm particles increased by 4.9 times, and 2.5–5.6 µm particles increased by 9.3 times. The bioaerosol component accounted for 16–28% of PM10 mass during the dust period, which was not significantly different (Kruskal–Wallis, p > 0.05) from that of the non-dust days in spring. Bioaerosol contributed 58–65% of the PM2.5 mass during the dust period, which was higher than on non-dust days, due to the increase in large bioaerosol particles in PM2.5 during dust days.

3.5. Bioaerosol Concentrations and Size Distribution during a Haze Event

During the sampling period, one haze event occurred on 1 December 2018, with a PM10 concentration of 208 μg m−3 and a PM2.5 concentration of 141 μg m−3, indicating the characteristics of fine aerosol particle pollution. Back trajectory analysis reveals the possible transport of polluted air masses from Southern China (Supplementary Figure S2). Bioaerosol variation and PM data during and after the haze event are presented in Table 4. Increased bioaerosol concentrations were detected on the haze day and reached 7.3 # cm−3 and 3.12 # cm−3 in PM10 and PM2.5, respectively. The size distribution of bioaerosol displayed a rapid increase in fine particles on the haze day (Figure 5). In the PM2.5 sample, 0.42–2.5 µm particles increased by 12.7 times. The bioaerosol component accounted for 4% of PM2.5 mass and 7% of PM10 mass, and the bioaerosol contribution to PM10 mass was lower than that of non-haze days in winter.
In general, the bioaerosol level increases during dust and haze events, while few comparisons have been made between them. Elevated bioaerosol concentrations were reported during haze events in China [27,39,40,44], but the increased amounts were not as large as those during dust events. Similarly, we found that the bioaerosol concentrations during a haze event were lower than those during a dust event. The size distribution of bioaerosol also showed obvious differences between dust air and haze air. The variation between bioaerosol fraction on dust and haze days may be due to the difference in particle components. Dust particles mainly include mineral particles and bioaerosols, which originate from arid and semiarid areas [46], and haze particles often include black carbon, organic and inorganic pollutants, and bioaerosols, which are attributed to extensive coal combustion, fossil fuel combustion and biomass burning [47,48]. The composition and source of haze particles are complex, and secondary aerosol contributions to haze particles are high [48].

4. Conclusions

In this study, bioaerosol concentration, size distribution and bioaerosol contributions to PM mass during four seasons at an urban site in Huangshi, China, were investigated. It was observed that the bioaerosol concentrations in spring and fall were higher than those in summer and winter. PM mass was significantly positively correlated with bioaerosol number concentrations, and relative humidity was negatively correlated with bioaerosol concentrations. The bioaerosol concentration showed obvious increases during dust and haze events, with coarse particle increase on a dust day and fine particle increase on a haze day. Bioaerosols substantially contribute to the mass of airborne particles, with 18.3 ± 10.6% in PM10 mass and 13.7 ± 12.5% in PM2.5 mass. These results suggest that organic components of the atmospheric aerosol contain important contributions from bioaerosols, and investigations of bioaerosol contributions to climate and air quality should be continued and extended to other regions of China. The results of this work will help improve our understanding of bioaerosol contributions to PM and provide insights into the seasonal variation of bioaerosols, influencing factors in urban environment milieu for the community.

Supplementary Materials

The following supporting information can be downloaded at https://www.mdpi.com/article/10.3390/atmos13060909/s1, Figure S1: HYSPLIT 48 h back air mass trajectories of the dust event on 14 April 2018, originating from the sampling site in Huangshi (30°12′35.71″ N, 115°01′30.75″ E) at 100, 500, and 1000 m above ground level every 6 h; Figure S2: HYSPLIT 48 h back air mass trajectories of the haze event on 1 December 2018, originating from the sampling site in Huangshi (30°12′35.71″ N, 115°01′30.75″ E) at 100, 500, and 1000 m above ground level every 6 h; Table S1. Seasonal variations of bioaerosol number concentration in Huangshi, China.

Author Contributions

L.Z., T.L. and J.Z.; were responsible for the sampling, L.Z., T.L. and X.Z.; performed the experimental work, L.Z., T.L., B.Z. and D.X.; performed the data analysis, L.Z.; drafted the original manuscript, T.L.; made the review of the original draft, X.L.; contributed to the review and editing. All authors have read and agreed to the published version of the manuscript.

Funding

This research was funded by the Open Fund of Hubei Key Laboratory of Mine Environmental Pollution Control and Remediation (2014104), the introduction of talent project of Hubei Polytechnic University (11yjz07R), and the Hubei Universities of Outstanding Young Scientific and Technological Innovation Team Plans (T201729).

Institutional Review Board Statement

Not applicable.

Informed Consent Statement

Not applicable.

Data Availability Statement

The datasets generated and analyzed during the current study are not publicly available, but are available from the corresponding author on reasonable request.

Acknowledgments

The authors appreciate financial support from the Open Fund of Hubei Key Laboratory of Mine Environmental Pollution Control and Remediation (2014104), the introduction of talent project of Hubei Polytechnic University (11yjz07R), and the Hubei Universities of Outstanding Young Scientific and Technological Innovation Team Plans (T201729).

Conflicts of Interest

The authors declare no conflict of interest.

References

  1. Jaenicke, R. Abundance of Cellular Material and Proteins in the Atmosphere. Science 2005, 308, 73. [Google Scholar] [CrossRef] [PubMed]
  2. Després, V.; Huffman, J.A.; Burrows, S.M.; Hoose, C.; Safatov, A.; Buryak, G.; Fröhlich-Nowoisky, J.; Elbert, W.; Andreae, M.; Poeschl, U.; et al. Primary biological aerosol particles in the atmosphere: A review. Tellus B Chem. Phys. Meteorol. 2012, 64, 15598. [Google Scholar] [CrossRef] [Green Version]
  3. Douwes, J.; Thorne, P.; Pearce, N.; Heederik, D. Bioaerosol Health Effects and Exposure Assessment: Progress and Prospects. Ann. Occup. Hyg. 2003, 47, 187–200. [Google Scholar] [PubMed] [Green Version]
  4. Griffin, D.W. Atmospheric movement of microorganisms in clouds of desert dust and implications for human health. Clin. Microbiol. Rev. 2007, 20, 459–477. [Google Scholar] [CrossRef] [Green Version]
  5. Mbareche, H.; Morawska, L.; Duchaine, C. On the interpretation of bioaerosol exposure measurements and impacts on health. J. Air Waste Manag. Assoc. 2019, 69, 789–804. [Google Scholar] [CrossRef] [PubMed] [Green Version]
  6. Guzman, M.I. An overview of the effect of bioaerosol size in coronavirus disease 2019 transmission. Int. J. Health Plan. Manag. 2021, 36, 257–266. [Google Scholar] [CrossRef] [PubMed]
  7. Ilieș, D.C.; Marcu, F.; Caciora, T.; Indrie, L.; Ilieș, A.; Albu, A.; Costea, M.; Burtă, L.; Baias, Ș.; Ilieș, M.; et al. Investigations of Museum Indoor Microclimate and Air Quality. Case Study from Romania. Atmosphere 2021, 12, 286. [Google Scholar] [CrossRef]
  8. Caciora, T.; Herman, G.V.; Ilieș, A.; Baias, Ș.; Ilieș, D.C.; Josan, I.; Hodor, N. The Use of Virtual Reality to Promote Sustainable Tourism: A Case Study of Wooden Churches Historical Monuments from Romania. Remote Sens. 2021, 13, 1758. [Google Scholar] [CrossRef]
  9. Wang, C.T.; Fu, S.C.; Chao, C.Y.H. Short-range bioaerosol deposition and recovery of viable viruses and bacteria on surfaces from a cough and implications for respiratory disease transmission. Aerosol Sci. Technol. 2021, 55, 215–230. [Google Scholar] [CrossRef]
  10. Zhang, Y.; Shen, F.X.; Yang, Y.; Niu, M.T.; Chen, D.; Chen, L.F.; Wang, S.Q.; Zheng, Y.H.; Sun, Y.; Zhou, F.; et al. Insights into the Profile of the Human Expiratory Microbiota and Its Associations with Indoor Microbiotas. Environ. Sci. Technol. 2022, 56, 6282–6293. [Google Scholar] [CrossRef]
  11. Rolph, C.A.; Gwyther, C.L.; Tyrrel, S.F.; Nasir, Z.A.; Drew, G.H.; Jackson, S.K.; Khera, S.; Hayes, E.T.; Williams, B.; Bennett, A.; et al. Sources of Airborne Endotoxins in Ambient Air and Exposure of Nearby Communities—A Review. Atmosphere 2018, 9, 375. [Google Scholar] [CrossRef] [Green Version]
  12. Gollakota, A.R.K.; Gautam, S.; Santosh, M.; Sudan, H.A.; Gandhi, R.; Jebadurai, V.S.; Shu, C.M. Bioaerosols: Characterization, pathways, sampling strategies, and challenges to geo-environment and health. Gondwana Res. 2021, 99, 178–203. [Google Scholar] [CrossRef]
  13. Huang, S.; Hu, W.; Chen, J.; Wu, Z.J.; Zhang, D.Z.; Fu, P.Q. Overview of biological ice nucleating particles in the atmosphere. Environ. Int. 2021, 146, 106197. [Google Scholar] [CrossRef] [PubMed]
  14. Hauspie, R.C.; Pagezy, H. The contribution of bacterial and fungal spores to the organic carbon content of cloud water, precipitation and aerosols. Atmos. Res. 2002, 64, 109–119. [Google Scholar]
  15. Heidi, B.; Heinrich, G.; Regina, H.; Anne, K.; Georg, R.; Franziska, Z.; Hans, P. Airborne bacteria as cloud condensation nuclei. J. Geophys. Res. Atmos. 2003, 108, 1919–1964. [Google Scholar]
  16. Group, A.E. New Directions: The role of bioaerosols in atmospheric chemistry and physics. Atmos. Environ. 2004, 38, 1231–1232. [Google Scholar]
  17. Rosenfeld, D.; Lohmann, U.; Raga, G.B.; O’Dowd, C.D.; Kulmala, M.; Fuzzi, S.; Reissell, A.; Andreae, M.O. Flood or Drought: How Do Aerosols Affect Precipitation? Science 2008, 321, 1309–1313. [Google Scholar] [CrossRef] [Green Version]
  18. Fröhlich-Nowoisky, J.; Kampf, C.J.; Weber, B.; Huffman, J.A.; Pöhlker, C.; Andreae, M.O.; Lang-Yona, N.; Burrows, S.M.; Gunthe, S.S.; Elbert, W.; et al. Bioaerosols in the Earth system: Climate, health, and ecosystem interactions. Atmos. Res. 2016, 182, 346–376. [Google Scholar] [CrossRef] [Green Version]
  19. Li, J.; Chen, H.X.; Li, X.Y.; Wang, M.F.; Zhang, X.Y.; Cao, J.J.; Shen, F.X.; Wu, Y.; Xu, S.Y.; Fan, H.; et al. Differing toxicity of ambient particulate matter (PM) in global cities. Atmos. Environ. 2019, 212, 305–315. [Google Scholar] [CrossRef] [Green Version]
  20. Elbert, W.; Taylor, P.E.; Andreae, M.O.; Pöschl, U. Contribution of fungi to primary biogenic aerosols in the atmosphere: Wet and dry discharged spores, carbohydrates, and inorganic ions. Atmos. Chem. Phys. 2007, 7, 4569–4588. [Google Scholar] [CrossRef] [Green Version]
  21. Bauer, H.; Schueller, E.; Weinke, G.; Berger, A.; Hitzenberger, R.; Marr, I.L.; Puxbaum, H. Significant contributions of fungal spores to the organic carbon and to the aerosol mass balance of the urban atmospheric aerosol. Atmos. Environ. 2008, 42, 5542–5549. [Google Scholar] [CrossRef]
  22. Zhang, T.; Engling, G.; Chan, C.Y.; Zhang, Y.N.; Zhang, Z.S.; Lin, M.; Sang, X.F.; Li, Y.D.; Li, Y.S. Contribution of fungal spores to particulate matter in a tropical rainforest. Environ. Res. Lett. 2010, 5, 1–9. [Google Scholar] [CrossRef]
  23. Chow, J.C.; Yang, X.F.; Wang, X.L.; Kohl, S.D.; Hurbain, P.R.; Chen, L.-W.A.; Watson, J.G. Characterization of Ambient PM10 Bioaerosols in a California Agricultural Town. Aerosol Air Qual. Res. 2015, 15, 1433–1447. [Google Scholar] [CrossRef]
  24. Perrino, C.; Marcovecchio, F. A new method for assessing the contribution of primary biological atmospheric particles to the mass concentration of the atmospheric aerosol. Environ. Int. 2016, 87, 108–115. [Google Scholar] [CrossRef] [PubMed]
  25. Li, W.J.; Liu, L.; Xu, L.; Zhang, J.; Yuan, Q.; Ding, X.K.; Hu, W.; Fu, P.Q.; Zhang, D.Z. Overview of primary biological aerosol particles from a Chinese boreal forest: Insight into morphology, size, and mixing state at microscopic scale. Sci. Total Environ. 2020, 719, 137520. [Google Scholar] [CrossRef] [PubMed]
  26. Chen, L.-W.A.; Zhang, M.; Liu, T.; Fortier, K.; Chow, J.C.; Kolberg, R.; Cao, J.J.; Lin, G.; Patel, T.Y.; Cruz, P.; et al. Evaluation of Epifluorescence Methods for Quantifying Bioaerosols in Fine and Coarse Particulate Air Pollution. Atmos. Environ. 2019, 213, 620–628. [Google Scholar] [CrossRef]
  27. Liu, T.; Chen, L.-W.A.; Zhang, M.; Watson, J.G.; Chow, J.C.; Cao, J.J.; Chen, H.Y.; Wang, W.; Zhang, J.Q.; Zhan, C.L.; et al. Bioaerosol Concentrations and Size Distributions during the Autumn and Winter Seasons in an Industrial City of Central China. Aerosol Air Qual. Res. 2019, 19, 1095–1104. [Google Scholar] [CrossRef]
  28. Matthias-Maser, S.; Jaenicke, R. The size distribution of primary biological aerosol particles in the multiphase atmosphere. Aerobiologia. 2000, 16, 207–210. [Google Scholar] [CrossRef]
  29. Bertolini, V.; Gandolfi, I.; Ambrosini, R.; Bestetti, G.; Innocente, E.; Rampazzo, G.; Franzetti, A. Temporal variability and effect of environmental variables on airborne bacterial communities in an urban area of northern Italy. Appl. Microbiol. Biotechnol. 2013, 97, 6561–6570. [Google Scholar] [CrossRef] [Green Version]
  30. Zhen, Q.; Deng, Y.; Wang, Y.Q.; Wang, X.K.; Zhang, H.X.; Sun, X.; Ouyang, Z.Y. Meteorological factors had more impact on airborne bacterial communities than air pollutants. Sci. Total Environ. 2017, 601–602, 703–712. [Google Scholar] [CrossRef]
  31. Smets, W.; Moretti, S.; Denys, S.; Lebeer, S. Airborne bacteria in the atmosphere: Presence, purpose, and potential. Atmos. Environ. 2016, 139, 214–221. [Google Scholar] [CrossRef]
  32. Joung, Y.S.; Ge, Z.; Buie, C.R. Bioaerosol generation by raindrops on soil. Nature 2017, 8, 14668. [Google Scholar] [CrossRef] [PubMed]
  33. Hara, K.; Zhang, D.Z. Bacterial abundance and viability in long-range transported dust. Atmos. Environ. 2012, 47, 20–25. [Google Scholar] [CrossRef]
  34. Tang, K.; Huang, Z.W.; Huang, J.P.; Maki, T.; Zhang, S.; Shimizu, A.; Ma, X.J.; Shi, J.S.; Bi, J.R.; Zhou, T.; et al. Characterization of atmospheric bioaerosols along the transport pathway of Asian dust during the Dust-Bioaerosol 2016 Campaign. Atmos. Chem. Phys. 2018, 8, 7131–7148. [Google Scholar] [CrossRef] [Green Version]
  35. Xu, X.Y.; Liu, X.R.; Li, Y.; Ran, Y.; Liu, Y.P.; Zhang, Q.C.; Li, Z.; He, Y.; Xu, J.M.; Di, H.J. High temperatures inhibited the growth of soil bacteria and archaea but not that of fungi and altered nitrous oxide production mechanisms from different nitrogen sources in an acidic soil. Soil Boil. Biochem. 2017, 107, 168–179. [Google Scholar] [CrossRef]
  36. Casanova, C.F.; de Souza, M.A.; Fisher, B.; Colet, R.; Marchesi, C.M.; Zeni, J.; Cansian, R.L.; Backes, G.T.; Steffens, C. Bacterial growth in chicken breast fillet submitted to temperature abuse conditions. Food Sci. Technol. 2022, 42. [Google Scholar] [CrossRef]
  37. Tang, J.W. The effect of environmental parameters on the survival of airborne infectious agents. J. R. Soc. Interface 2009, 6, 737–746. [Google Scholar] [CrossRef] [PubMed] [Green Version]
  38. Bowers, R.M.; McCubbin, I.B.; Hallar, A.G.; Fierer, N. Seasonal variability in airborne bacterial communities at a high-elevation site. Atmos. Environ. 2012, 50, 41–49. [Google Scholar] [CrossRef]
  39. Dong, L.J.; Qi, J.H.; Shao, C.C.; Zhong, X.; Gao, D.M.; Cao, W.W.; Gao, J.W.; Bai, R.; Long, G.Y.; Chu, C.C. Concentration and size distribution of total airborne microbes in hazy and foggy weather. Sci. Total Environ. 2016, 541, 1011–1018. [Google Scholar] [CrossRef] [PubMed]
  40. Xie, Z.S.; Li, Y.P.; Lu, R.; Li, W.X.; Fan, C.L.; Liu, P.X.; Wang, J.L.; Wang, W.K. Characteristics of total airborne microbes at various air quality levels. J. Aerosol Sci. 2018, 116, 57–65. [Google Scholar] [CrossRef]
  41. Watson, J.G.; Chow, J.C. Receptor Models and Measurements for Identifying and Quantifying Air Pollution Sources. In Introduction to Environmental Forensics, 3rd ed.; Murphy, B.L., Morrison, R.D., Eds.; Elsevier: Amsterdam, The Netherlands, 2015; pp. 677–706. [Google Scholar]
  42. Lin, W.H.; Li, C. Associations of fungal aerosols, air pollutants, and meteorological factors. Aerosol. Sci. Technol. 2000, 32, 359–368. [Google Scholar] [CrossRef]
  43. Ho, H.M.; Rao, C.Y.; Hsu, H.H.; Chiu, Y.H.; Liu, C.M.; Chao, H.J. Characteristics and determinants of ambient fungal spores in Hualien, Taiwan. Atmos. Environ. 2005, 39, 5839–5850. [Google Scholar] [CrossRef]
  44. Wei, K.; Zou, Z.L.; Zheng, Y.H.; Li, J.; Shen, F.X.; Wu, C.Y.; Wu, Y.S.; Hu, M.; Yao, M.S. Ambient bioaerosol particle dynamics observed during haze and sunny days in Beijing. Sci. Total Environ. 2016, 550, 751–759. [Google Scholar] [CrossRef]
  45. Yuan, H.L.; Zhang, D.Z.; Shi, Y.N.; Li, B.Z.; Yang, J.S.; Yu, X.J.; Chen, N.; Kakikawa, M. Cell concentration, viability and culture composition of airborne bacteria during a dust event in Beijing. J. Environ. Sci. 2017, 5, 33–40. [Google Scholar] [CrossRef]
  46. Zhang, D.Z.; Iwasaka, Y.; Shi, G.; Zang, J.; Hu, M.; Li, C. Separated status of the natural dust plume and polluted air masses in an Asian dust storm event at coastal areas of China. J. Geophys. Res. Atmos. 2005, 110, D06302. [Google Scholar] [CrossRef] [Green Version]
  47. Cao, J.J.; Shen, Z.X.; Chow, J.C.; Watson, J.G.; Lee, S.C.; Tie, X.X.; Han, Y.M. Winter and summer PM2.5 chemical compositions in fourteen Chinese Cities. J. Air. Waste Manag. 2012, 62, 1214–1226. [Google Scholar] [CrossRef] [PubMed]
  48. Huang, R.J.; Zhang, Y.L.; Bozzetti, C.; Ho, K.F.; Cao, J.J.; Han, Y.M.; Daellenbach, K.R.; Slowik, J.G.; Platt, S.M.; Canonaco, F.; et al. High secondary aerosol contribution to particulate pollution during haze events in China. Nature 2014, 514, 218–222. [Google Scholar] [CrossRef] [PubMed] [Green Version]
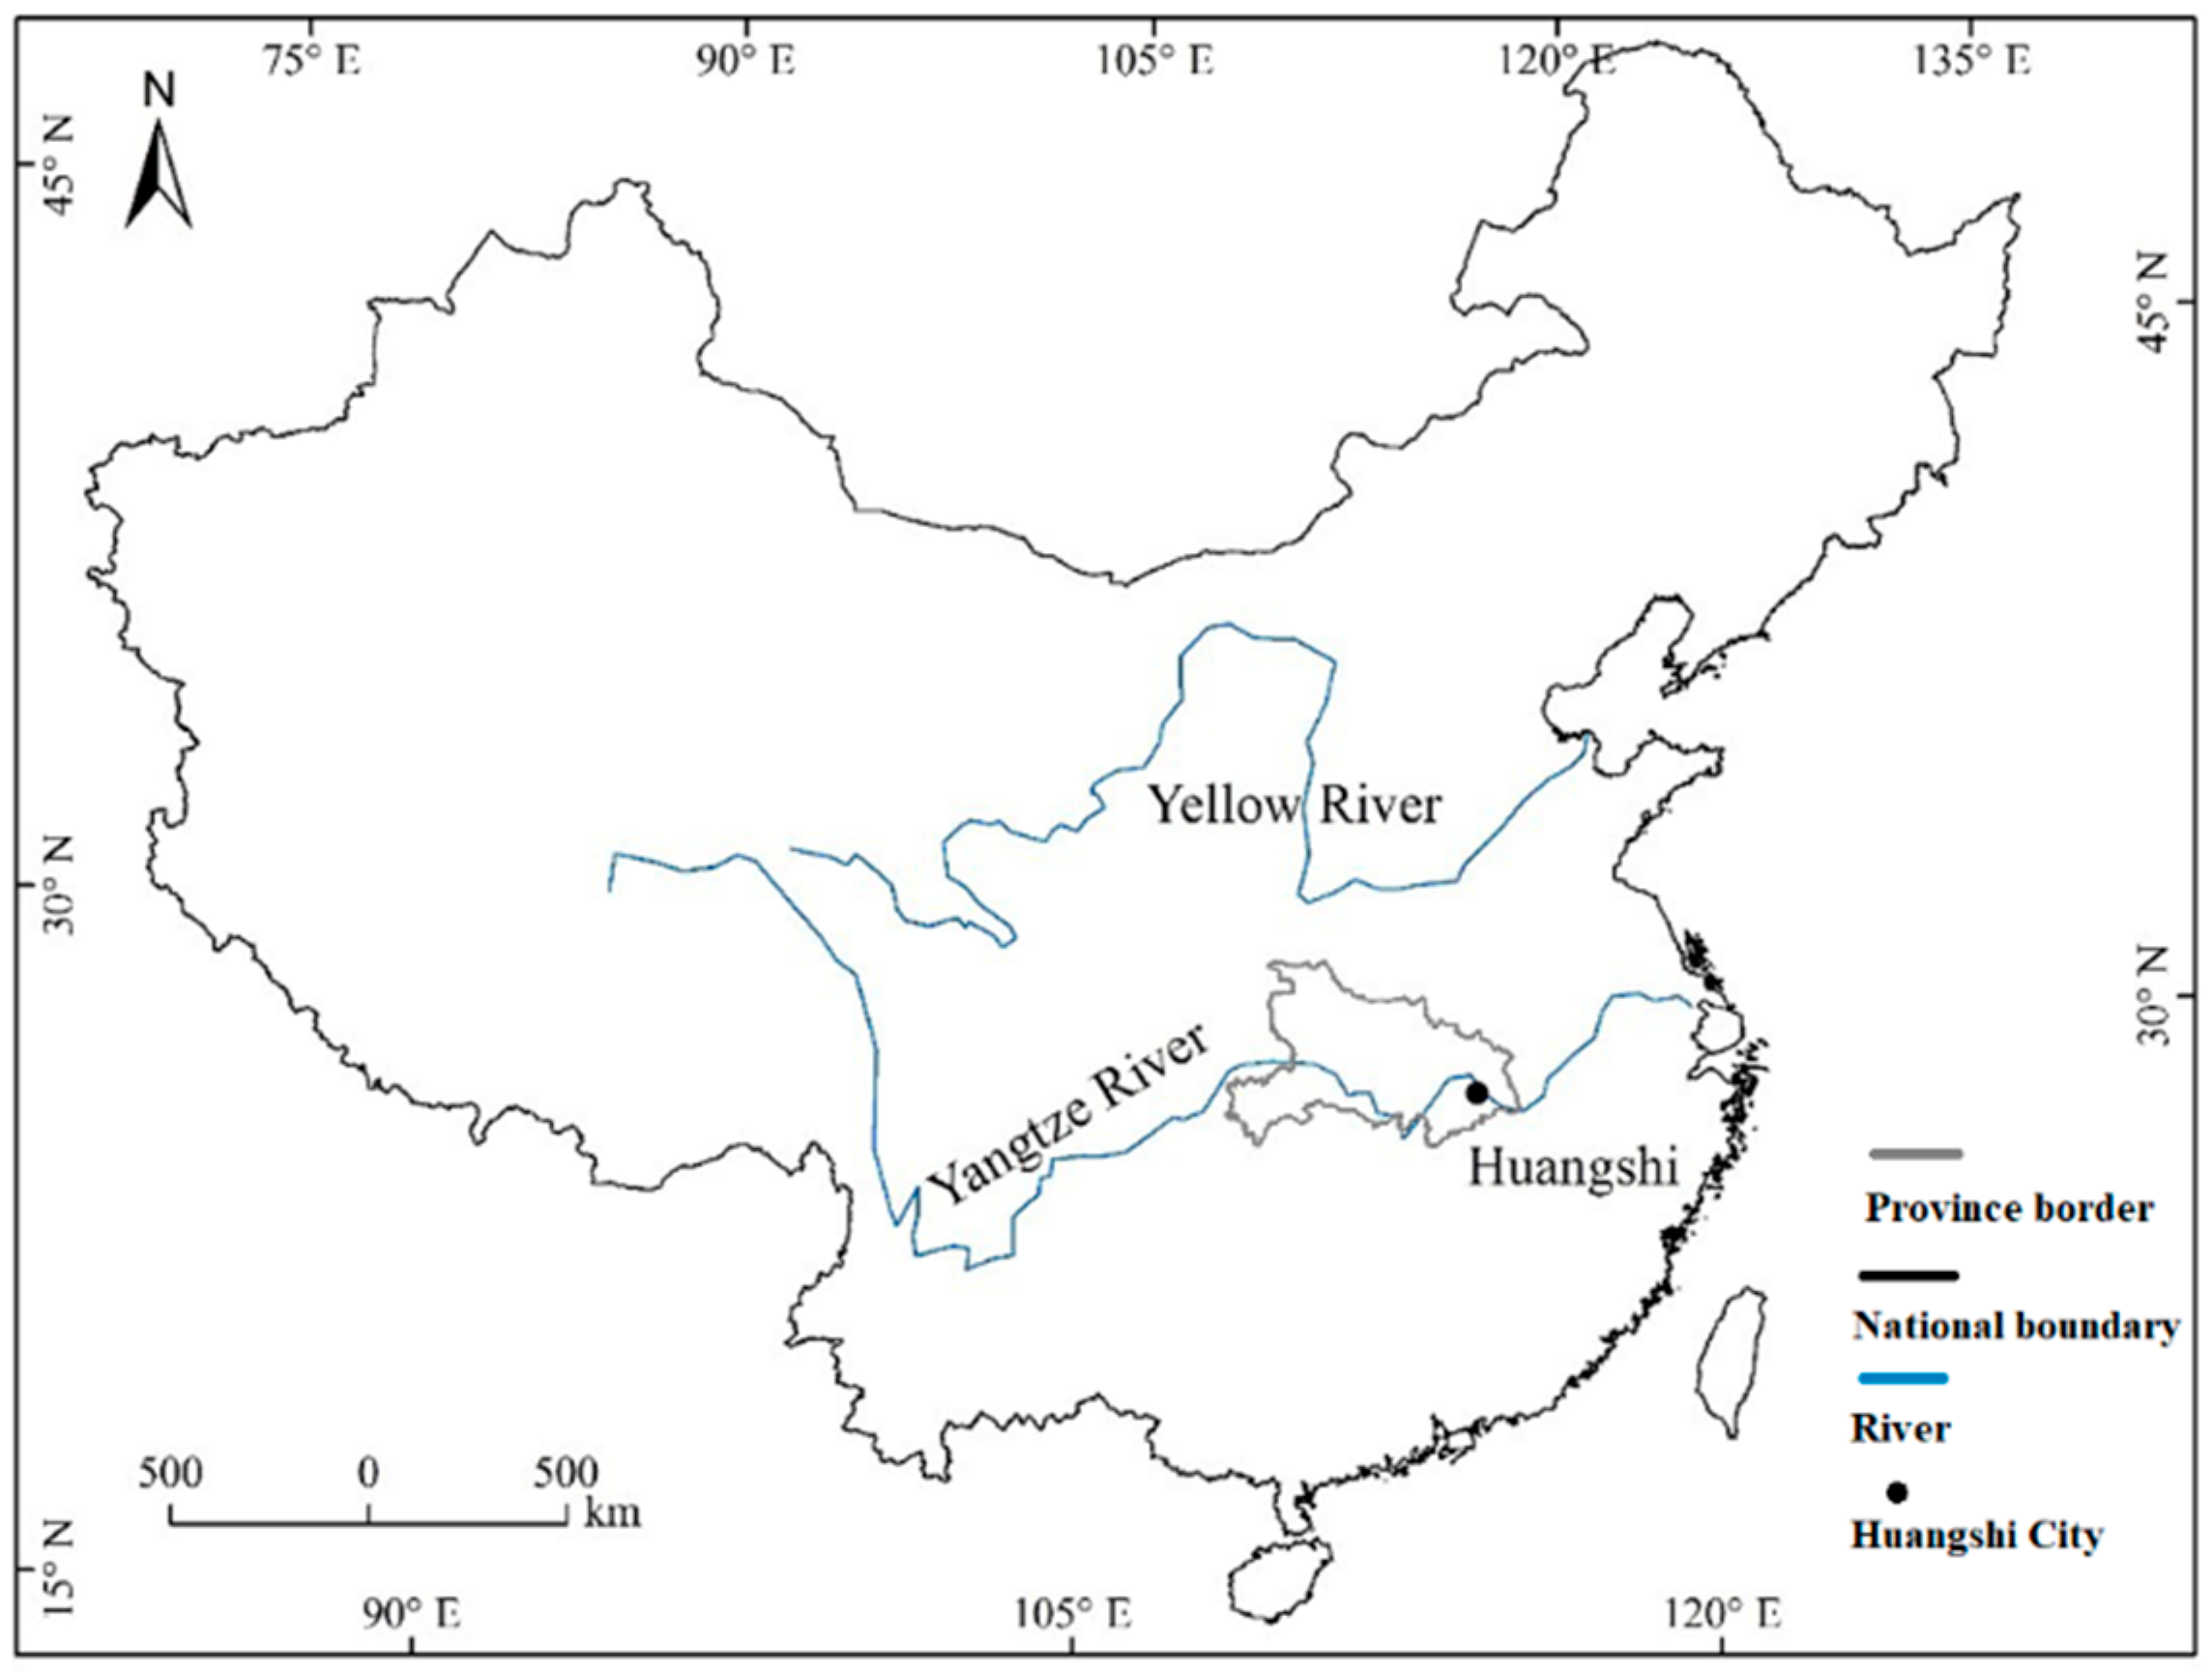
Figure 1. Bioaerosol monitoring site, Huangshi, China.
Atmosphere 13 00909 g001
Figure 2. Flowchart of bioaerosol analysis method.
Atmosphere 13 00909 g002
Figure 3. (a) Average number–size distribution of PM2.5 samples measured in four seasons. (b) Average number–size distribution of PM10 samples measured in four seasons. Particles were counted by bins of 7 different sizes (0.37–0.42; 0.42–0.56; 0.56–1; 1–2.5; 2.5–5.6; 5.6–10; and 10–16 µm) and averaged over all samples during the season.
Atmosphere 13 00909 g003
Figure 4. (a) Season variability in bioaerosol mass and non-bioaerosol mass in PM2.5 in Huangshi, China. (b) Season variability in bioaerosol mass and non-bioaerosol mass in PM10 in Huangshi, China.
Atmosphere 13 00909 g004
Figure 5. (a) Average number–size distribution of PM2.5 samples measured on 14 April 2018 (before dust), 15 April 2018 (during dust), 1 December 2018 (during haze), and 3 December 2018 (after haze). (b) Average number–size distribution of PM10 samples measured on 14 April 2018, 15 April 2018, 1 December 2018, and 3 December 2018. Particles were counted by bins of 7 different sizes (0.37–0.42; 0.42–0.56; 0.56–1; 1–2.5; 2.5–5.6; 5.6–10; and 10–16 µm).
Atmosphere 13 00909 g005
Table 1. Seasonal variations in PM mass and bioaerosol number concentration in Huangshi, China.
SeasonPM2.5
(µg m−3)
PM10
(µg m−3)
PM2.5 Bioaerosol
(# cm−3)
PM10 Bioaerosol
(# cm−3)
Spring461155.727.68
Summer20401.151.37
Fall37622.665.23
Winter58831.883.74
Table 2. Contributions of bioaerosol to PM mass reported in recent studies by location, site type, season, bioaerosol type, and PM size.
LocationSite TypeSeasonBioaerosol TypePM SizeContribution (%) to PM Mass 1Reference
Balbina, Amazonia, BrazilTropical rainforestDry seasonFungal spores1–10 µm35[20]
Schafberg, Vienna, AustriaSuburbanSpringFungal sporesPM103[21]
Summer 7
Rinnböckstrasse, Vienna, AustriaUrbanSpringFungal sporesPM101[21]
Summer 4
Jianfengling Mountain, Hainan, ChinaTropical rainforestSpringFungal sporesPM107.9[22]
Corcoran, CA, USARuralFallFungal spores, pollen grains and plant detritusPM1011.2–14.8 2[23]
Montelibretti, Rome, ItalyPeri urbanSummerBioaerosol > 0.4 μmPM106–18[24]
Winter 0.3–3.2
Las Vegas, NV, USAUrbanSpringBioaerosol 0.37–10 μm 3PM1017[26]
Huangshi, Hubei, ChinaUrbanFall and winterBioaerosol 0.37–10 μm 3PM104.8[27]
Huangshi, Hubei, ChinaUrbanSpringBioaerosol 0.37–10 μm 3PM1023.7This study
Summer 9.1
Fall 25.8
Winter 11.3
1 Average concentration unless otherwise noted. 2 Concentration range. 3 Particles were collected after a PM10 size-cut inlet, though large particles up to ~16 μm were observed on the filter.
Table 3. Spearman correlation coefficients between the bioaerosol number concentrations and environmental factors for all sampling days.
PM2.5 BioaerosolsPM10 Bioaerosols
PM2.50.53 **0.51 **
PM100.71 **0.7 **
Temperature0.120.02
RH−0.49 **−0.53 **
WindSpeed−0.13−0.07
O30.38 **0.31 **
NO20.29 **0.33 **
SO20.71 **0.63 **
CO0.36 **0.38 **
** p < 0.01 (2-tailed).
Table 4. Mean concentration of PM mass and bioaerosol mass concentrations during dust event and haze event in Huangshi.
Weather ConditionDatePM2.5
(µg m−3)
PM10
(µg m−3)
PM2.5 Bioaerosol
(µg m−3)
PM10 Bioaerosol
(µg m−3)
Before dust day14 April 201833444.3910.41
Dust day15 April 20185636132.256.29
Dust day16 April 20184321328.1459.70
Haze day1 December 20181412085.4515.49
After haze day3 December 201834430.255.61
Publisher’s Note: MDPI stays neutral with regard to jurisdictional claims in published maps and institutional affiliations.