1. Introduction
The rapid development of urbanization has generated economic prosperity and various air pollution problems. From 2016 to 2018, China’s air environmental quality ranked second to last in the Global Environmental Performance Index (EPI) report [
1]. Urban air quality as an evaluation indicator has a profound impact on the comfort, physical and mental health of people in their living environment. Air pollution is composed of numerous particulate pollutants. The variation of the emission source and strengths can also affect the distribution of the air pollutants. The distribution of contaminants in China shows that a high pollutant concentration is caused by the discharge of developed industrial areas, not the population density [
2]. Residents who migrate from rural to urban areas in China often take generations to settle down in highly urbanized, modern cities [
3]. In addition, the urbanization process is accompanied by the construction of many roads and buildings. Urban morphological parameters are urban design elements that include many indicators such as road density, building density, and greening rate. They are constantly changing in the process of urbanization and have an essential impact on the distribution of functions of the city and residents’ production and life in various regions. Improving the urban air quality through urban planning is necessary to prevent the concentration of various particulate air pollutants from exceeding the standard for a long time. Hence, it is vital to analyze the variation of individual components of contaminants and their distribution, from urban pollutant composition to urban parameters.
At present, research on urban pollutants mainly focuses on contaminants’ concentration changes and spatial distribution. The air pollutants in Hangzhou, China were significantly reduced on weekends [
4]. In terms of the air pollution characteristics, high concentrations of PM
10 and ozone coexist in the same region of the Sichuan Basin and surrounding cities [
5]. As an indicator for evaluating air quality, the air quality index (AQI) includes six pollutant components: PM
10, SO
2, O
3, PM
2.5, NO
2, and CO. Comparing the topography of cities and regions, the AQI value in North China has always been at a high level, which indicates that changes in urban topography and meteorological conditions influence pollutant concentrations [
6]. China’s national policy has made Dalian a key coastal tourism megacity in Northeast China. Affected by the terrain, Dalian has a well-developed transportation network, and the preservation of buildings in different periods makes Dalian rich in architectural samples [
7]. The air quality can be affected by changes in the concentration of individual pollutant components. Independent analysis of each emission pollutant can accurately reflect the spatiotemporal distribution of urban pollutants, and optimize or control the urban air quality from the source.
The urban tourism policies make the air quality requirements extremely high, and reducing air pollution is remarkably beneficial to economic development. However, the proportions of PM
10 and NO
2 in the AQI of Dalian are significantly higher than in other cities [
8]. The two pollutants threaten human respiratory health and interfere with atmospheric visibility in coastal cities, and have a bidirectional causal relationship with the number of tourists [
9]. This study focused on the concentrations of PM
10 and NO
2 in Dalian due to the two pollutants failing to meet the annual average standards of the “Global Air Quality Guidelines” (AQG2021) issued by the World Health Organization (WHO) [
10] and far exceeding China’s ambient air quality standards (GB3095-2012) [
11]. The PM
10 and NO
2 distribution can accurately reflect the spatiotemporal distribution of urban pollutants and be used to optimize urban air quality.
Many scholars pay attention to the regional variation and method detection of PM
10 and NO
2 pollutants. PM
10 has a strong interaction between cities in the plain area [
12]. Among them, the NO
2 in the plains of China is mainly caused by activities such as human industrial development pollution, and the PM
10 in the west of Shanghai is mostly caused by vehicle exhaust emissions [
13]. From west to east, NO
2 and PM
10 in Hebei Province showed a gradual decline in concentration [
14]. The variation range of NO
2 in the winter of Shijiazhuang is higher than in other seasons [
15], consistent with the results obtained by analyzing NO
2 concentration data [
16].
Regarding detecting pollutant concentration, the NO
2 variation model predicted by the data-network method confirmed that the areas with high pollutant concentrations were concentrated in large urban agglomerations from 2014 to 2019 [
17]. This result is consistent with the conclusion drawn by deep learning to establish the calculation model of mass air distribution [
18]. Sofia also verified and analyzed the air quality and bioclimatic indices through computer simulation [
19].
The pollutant components have essential impacts on residents’ health. The outdoor space morphological data parameters will affect the AQI [
20]. The coupling relationship between temperature, humidity, wind speed, and PM
10 concentration is substantial [
21]. The geographic environment of the urban area of Beijing is correlated with carbon dioxide, and the wind speed is negatively correlated with tree height [
22]. High wind speeds generate new levels of fugitive dust pollution [
23], combined with pollutants in the airstream, which may lead to a significant increase in the number of COVD-19 cases [
24]. In addition, changes in the location of urban blocks can lead to changes in pollutant concentrations [
25]. Outdoor morphology indicators such as proximity, circularity, and vegetation coverage are closely related to pollutants [
26], and the diverse land attributes affect urban air quality directly in Lanzhou [
27]. In the urban center, areas with higher PM
10 and NO
2 concentrations had higher site coverage, building height and enclosure. Compared with the sparse road network, the compact road network has a higher concentration of PM
10 particles [
28]. Cities with a single center and sparse buildings have a low particle concentration [
29], and the air quality in a low-population density city is better [
30]. These studies are significant for coupling urban morphological parameters and pollutants in Dalian.
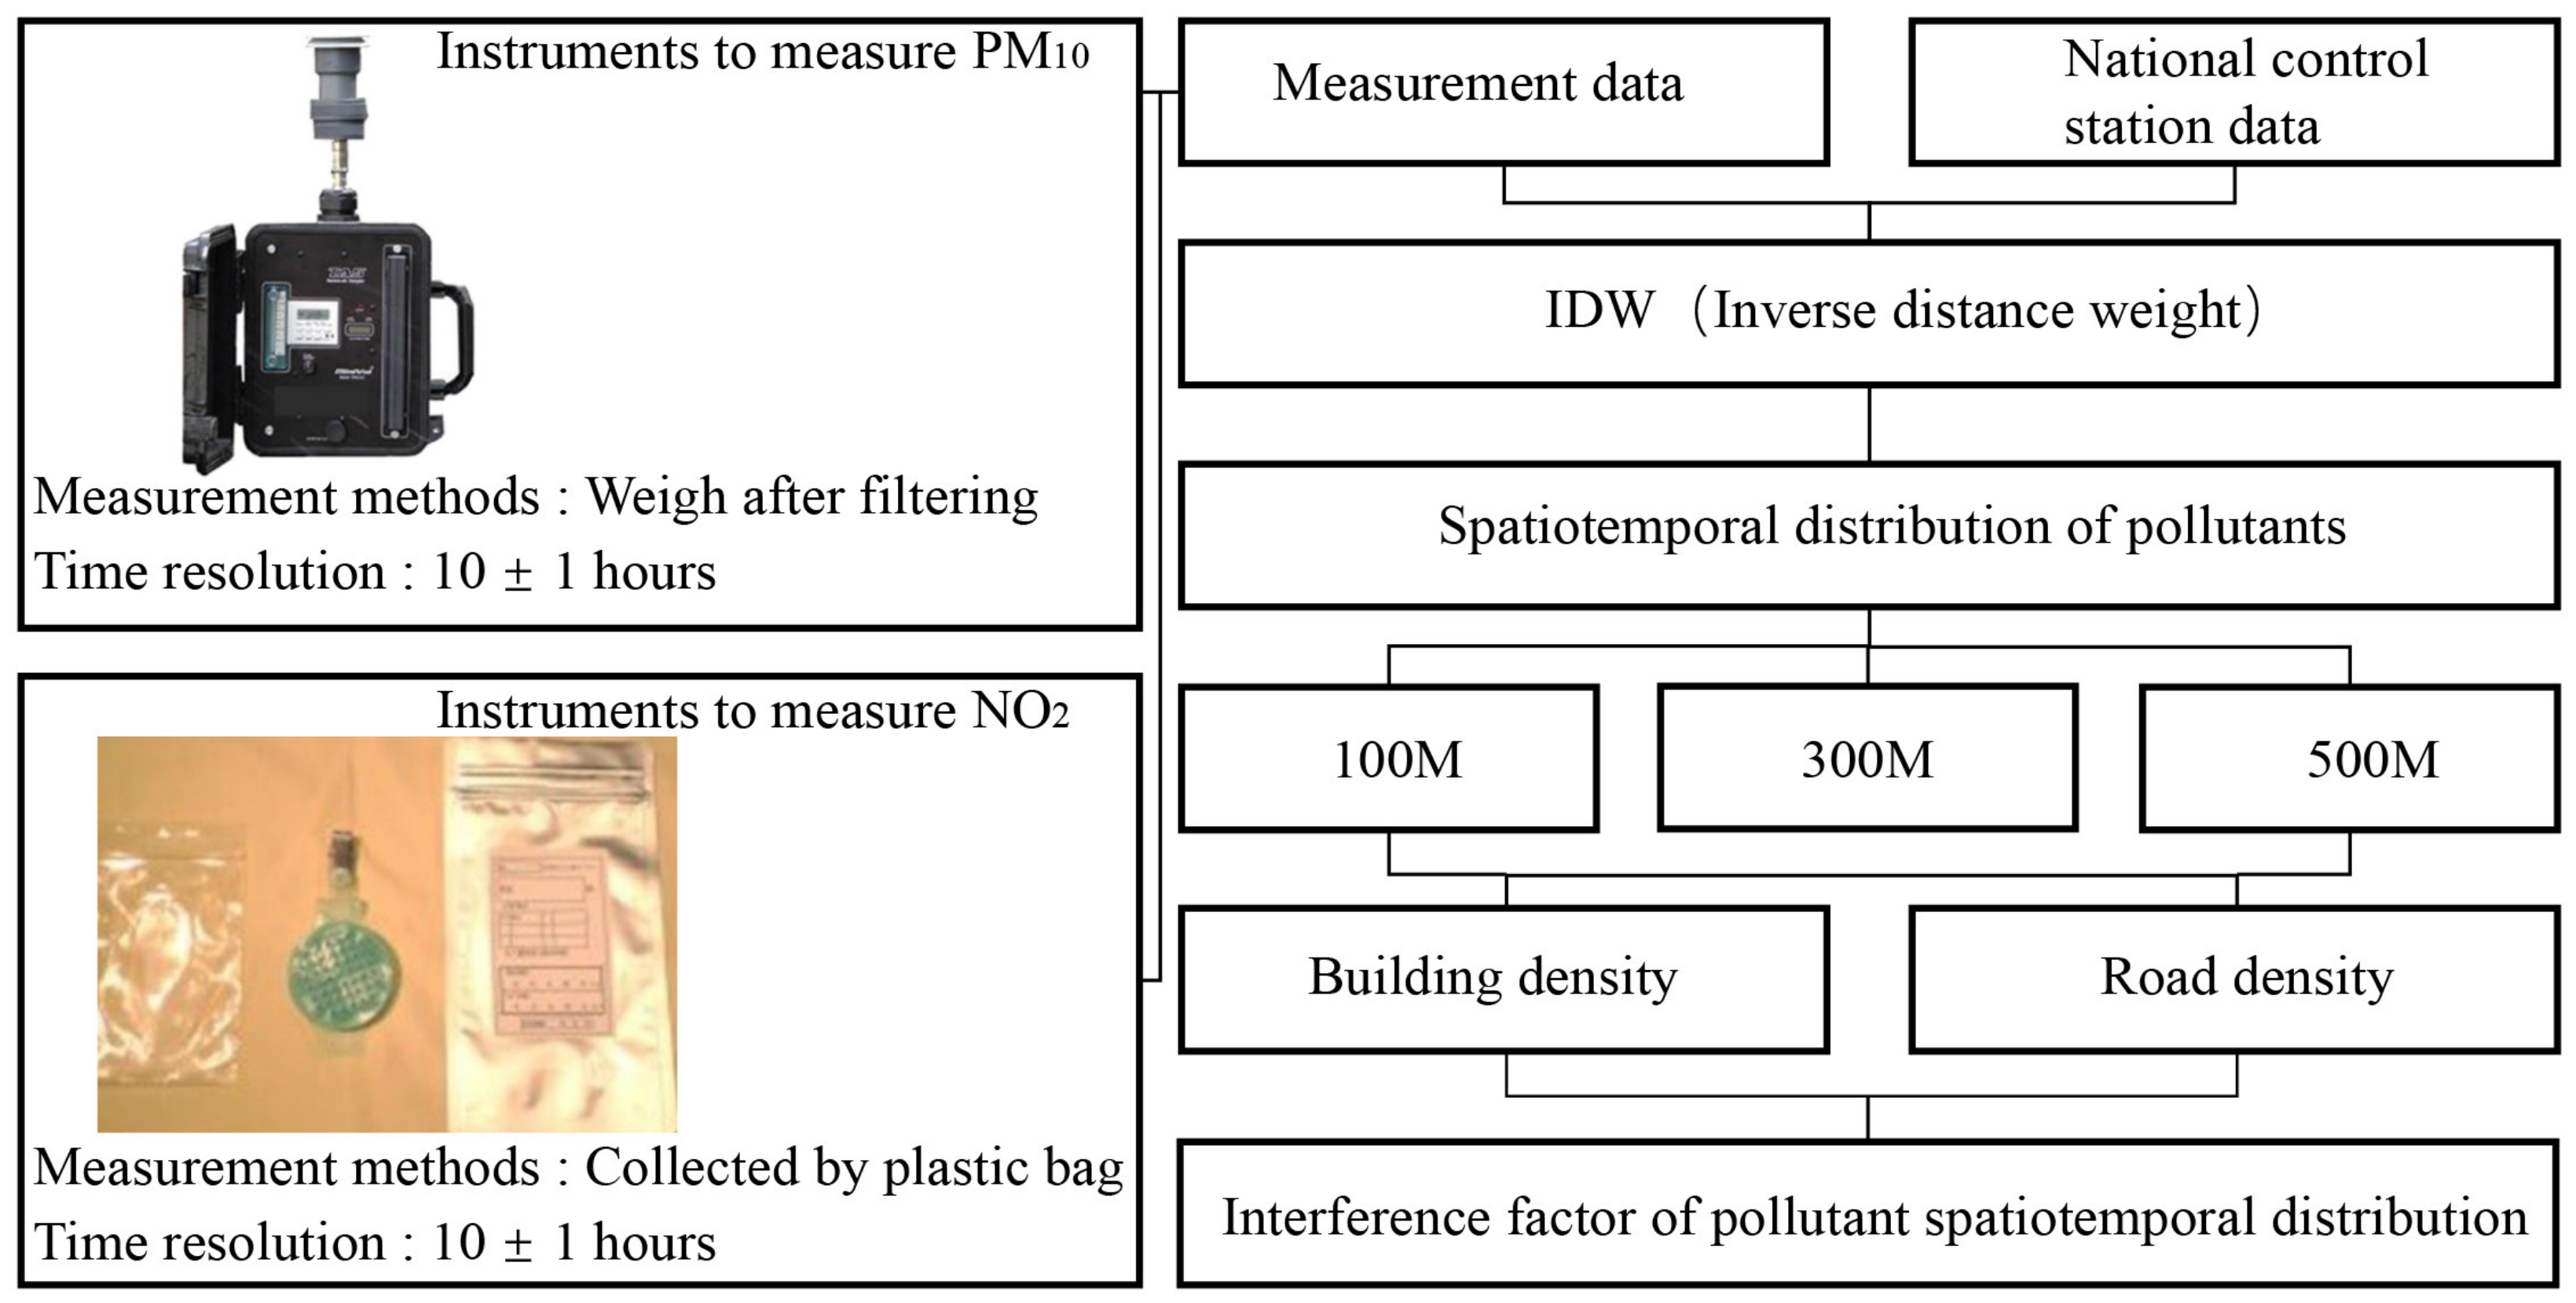
In this paper, the concentrations of NO2 and PM10 in Dalian were studied, and the two pollutants’ temporal and spatial distribution rules were explored. Building and road density was coupled with two pollutants in areas with various radii. The results were substituted into the block scale for verification and analysis, and the linear relationship of PM10 concentration was compared according to additional land attributes. This paper aims to study the impact of urban spatial parameters in Dalian on air pollutants in urbanization and discuss the relationship between PM10 and NO2 pollutants and road density and building density.
3. Spatial and Temporal Distribution of PM10 and NO2
3.1. Analysis of PM10 and NO2 Concentration Data
The pollutant concentrations at each site in order from highest to lowest are summer 2017, summer 2016, and winter 2016. The PM
10 concentrations in the summer of 2017 and 2016 far exceeded the “China Air Environmental Quality Standard”. The highest and lowest PM
10 concentrations in winter were half of those in summer. The increase in PM
10 concentration in the summer of 2017 was more significant than that in 2016, and the peak and trough value was three times that of the winter of 2016.
Figure 3a–c show the PM
10 concentration distribution in the measured data. The summer of 2017 was the season with the highest concentration. The highest PM
10 measurement concentration was 339 μg/m³ for 17S-12, and the lowest was 69 μg/m³ for 16S-24.
Comparing the land properties, the industrial land measurement points have reduced pollution emissions due to the shutdown of industries in winter. Emissions from other categories of pollutants were lower when the cold outdoor environment interfered with people’s activities. The significant difference between winter and summer air pollution in the green garden is the airflow formed by the vegetation growth cycle, which weakens the dilution effect of pollutants. The abnormality of 308 μg/m³ in the summer of 2016 shows the weak airflow in the enclosed form of residential buildings. When the site is located below the airflow opening, the poor circulation will cause a severe accumulation of pollutants. Various location attributes strongly interfere with pollutant concentration, and the PM10 variation law of additional land is worthy of in-depth study.
Figure 3e is a comparison chart of NO
2 concentration in the four seasons of 2017 and 2018. The NO
2 concentrations from high to low in winter, autumn, spring, and summer. The NO
2 concentration changes in a U-shape.
Figure 3f shows the comparison of the measured concentrations of NO
2. The pollution concentration data in the spring of 2017 were similar to those of the national control station. However, the data gap for 2018 remains wide. The measured sites in spring 2018 were located in areas with a high density of buildings and roads, suggesting that these two parameters profoundly affect pollutant concentrations. In addition, burning fuel for heating in winter can lead to more associated nitrogen dioxide emissions. The outdoor thermal environment is relatively poor in summer, and NO
2 emissions are lower. NO
2 emissions are greatly affected by seasons. As shown in
Figure 3d,f, the PM
10 data between the national control station and the actual measurement were different in the summer of 2017. The inconsistency suggests that normalization of the data is necessary.
3.2. Normalized Data
Given the limited number of experimental instruments and the number of participants, the data of multiple points are not completed in the same period and cannot be directly analyzed. It is necessary to revise the measurement times to the same sampling period. Using the normalized processing method normalizes the actual sampling point data. For analysis, June, July and August represent summer, and December, January and February represent winter.
3.3. PM10 Spatial Distribution Map
As shown in
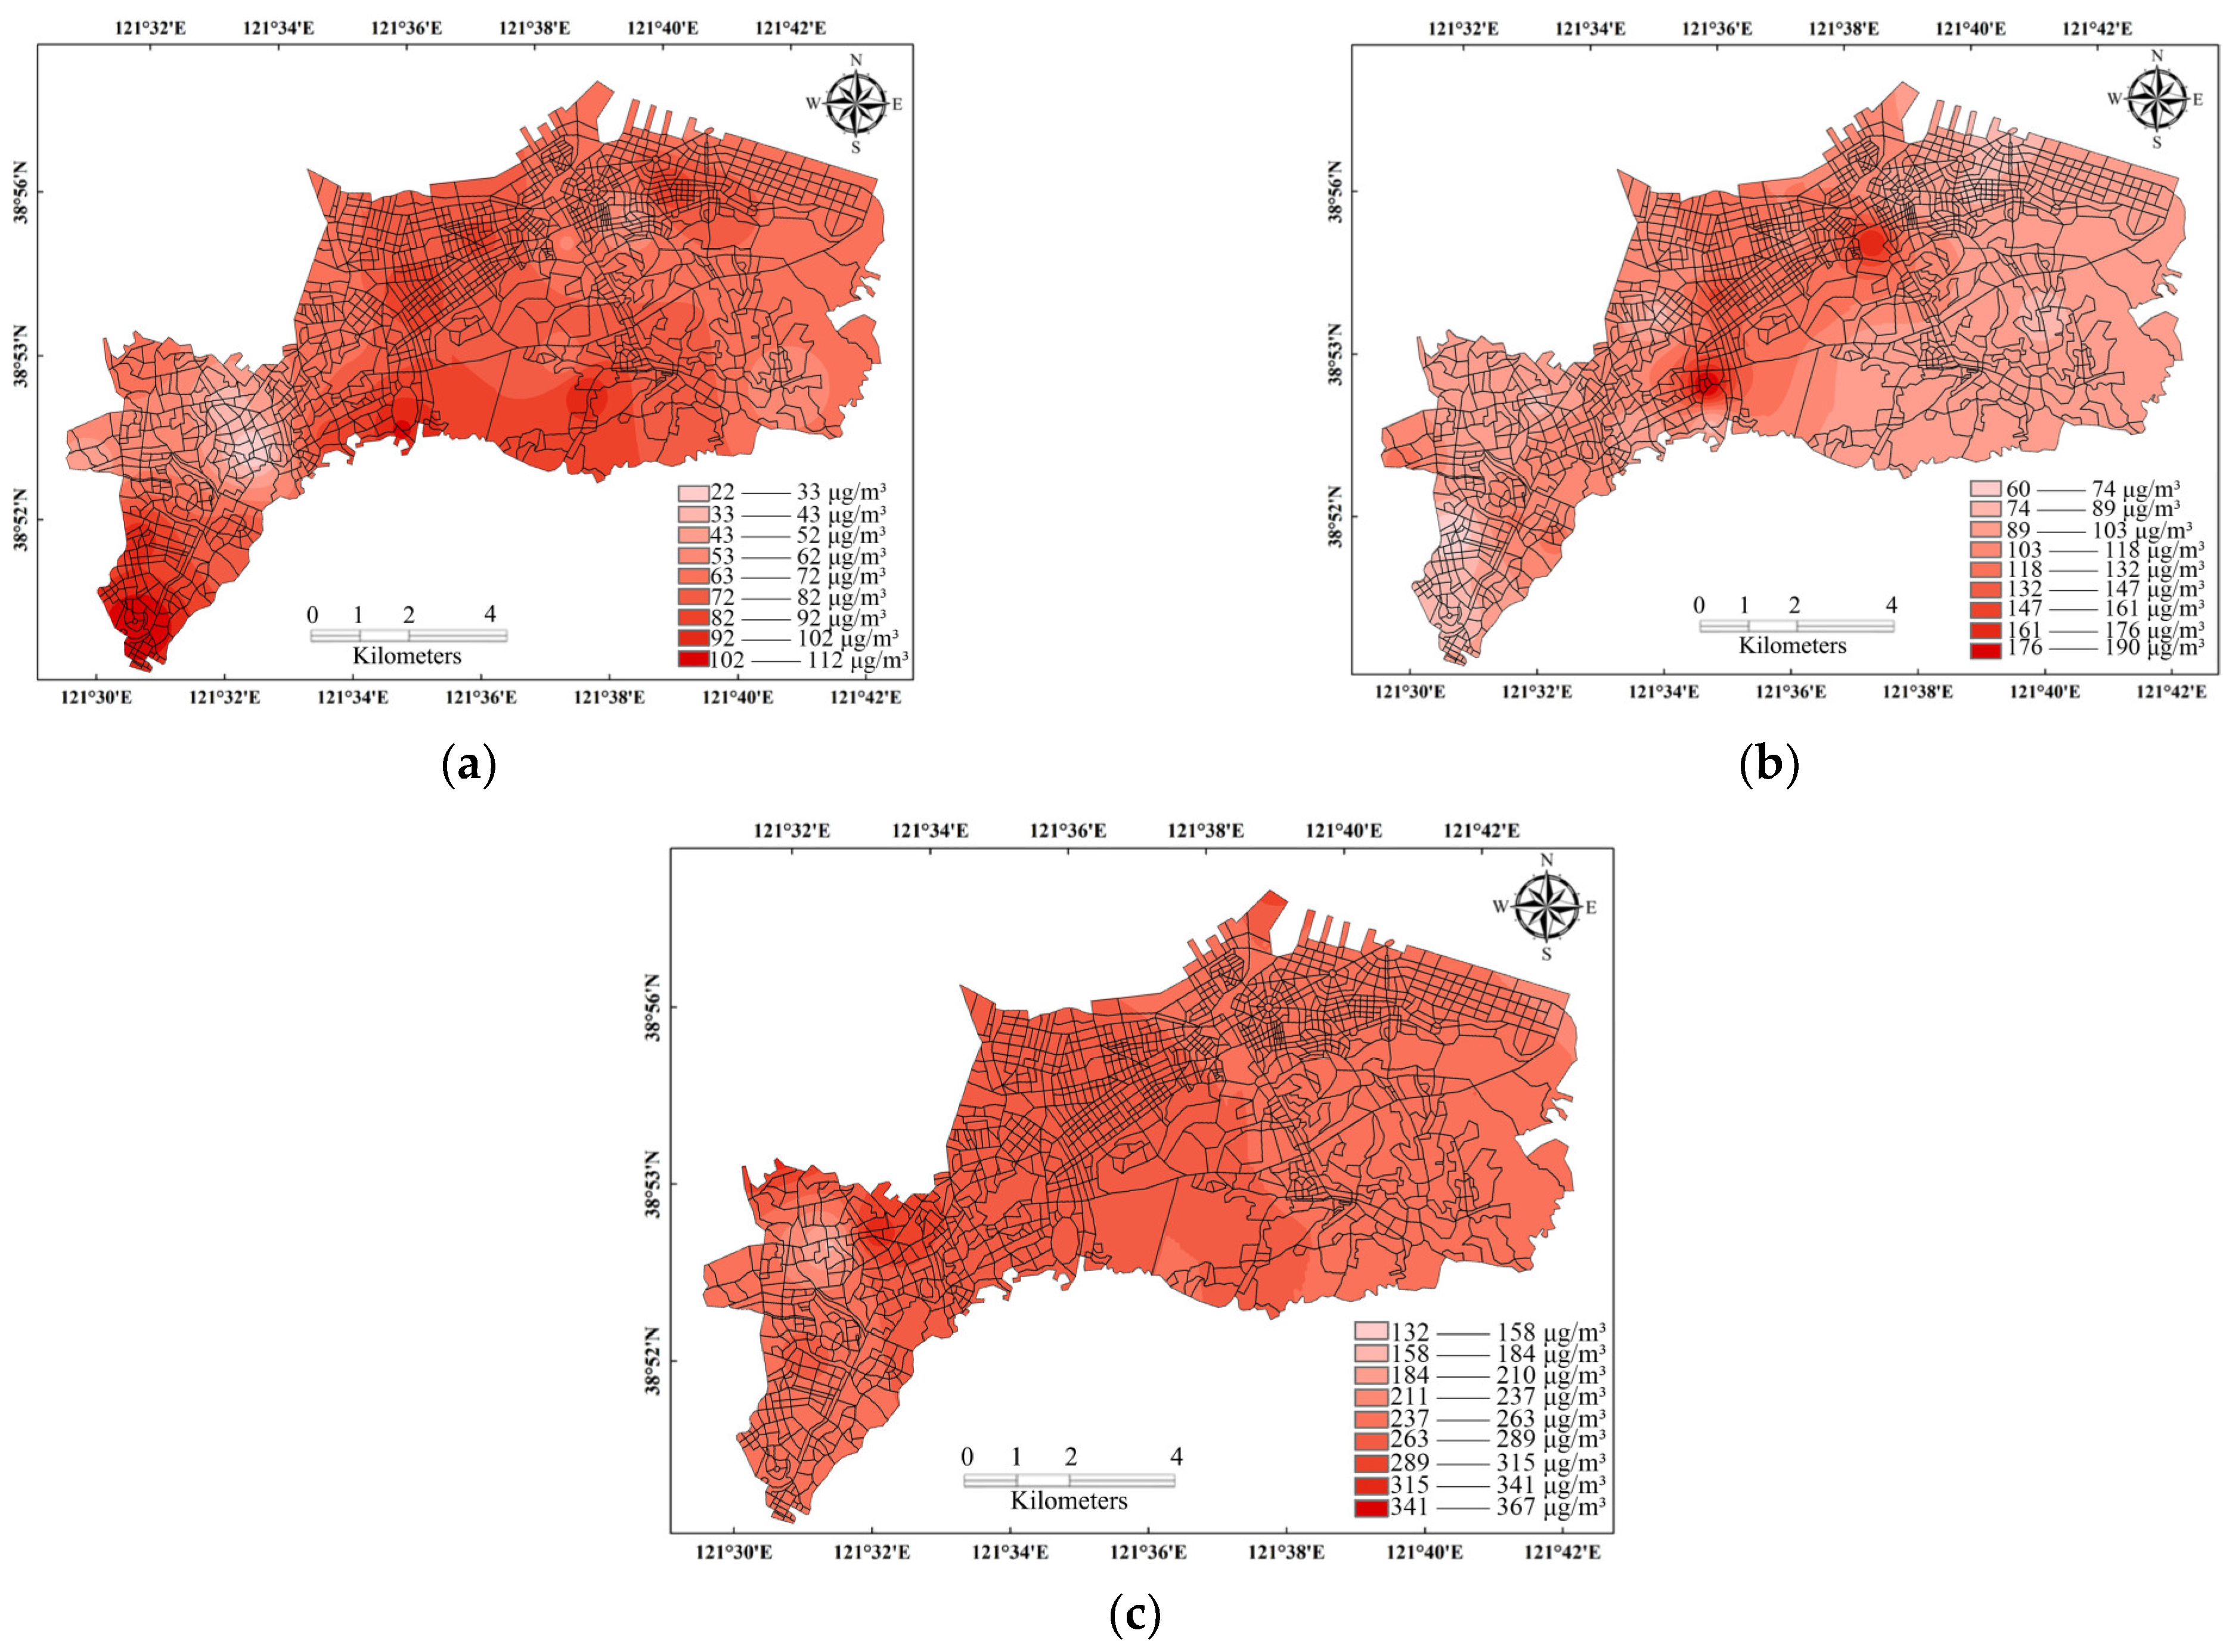
Figure 4, the measured data were used to simulate the spatiotemporal distribution of PM
10 in the central area of Dalian through the inverse distance weighting method.
Figure 4 shows the spatiotemporal distribution of PM
10 in Dalian. The high-concentration area is located south of the main urban area. The air pollution concentration in the summer of 2017 was higher than in 2016. In the summer of 2016, the high-value areas of PM
10 concentration in Dalian were concentrated in the central region. There are two areas with high concentration values in summer, and the overall concentration of PM
10 in winter is low. The high concentration areas in the summer of 2016 and 2017 coincided. The highest part of the concentration in 2017 reached 356 μg/m³, which was five times the highest value in the winter of 2016. Taking the three seasons in
Figure 4 as an example, in 2016, the PM
10 concentration in summer increased by 40% compared with winter, and the PM
10 concentration in summer in 2017 increased by nearly 150% compared with the summer in 2016.
The analysis results show that the large hilly areas on the west and north sides of the main urban area of Dalian affect the flow of wind, making the conditions for pollutant diffusion in the southwestern metropolitan area poor. In addition to the impact of terrain, the exhaust emissions from vehicles in Dalian also increase the concentration of pollutants. The inconvenience of travel in winter reduces the flow of people, and the PM10 concentration is lower than that in summer. Under the interference of urban climate, the diffusion direction of PM10 changes with the urban wind direction.
3.4. NO2 Spatial Distribution Map
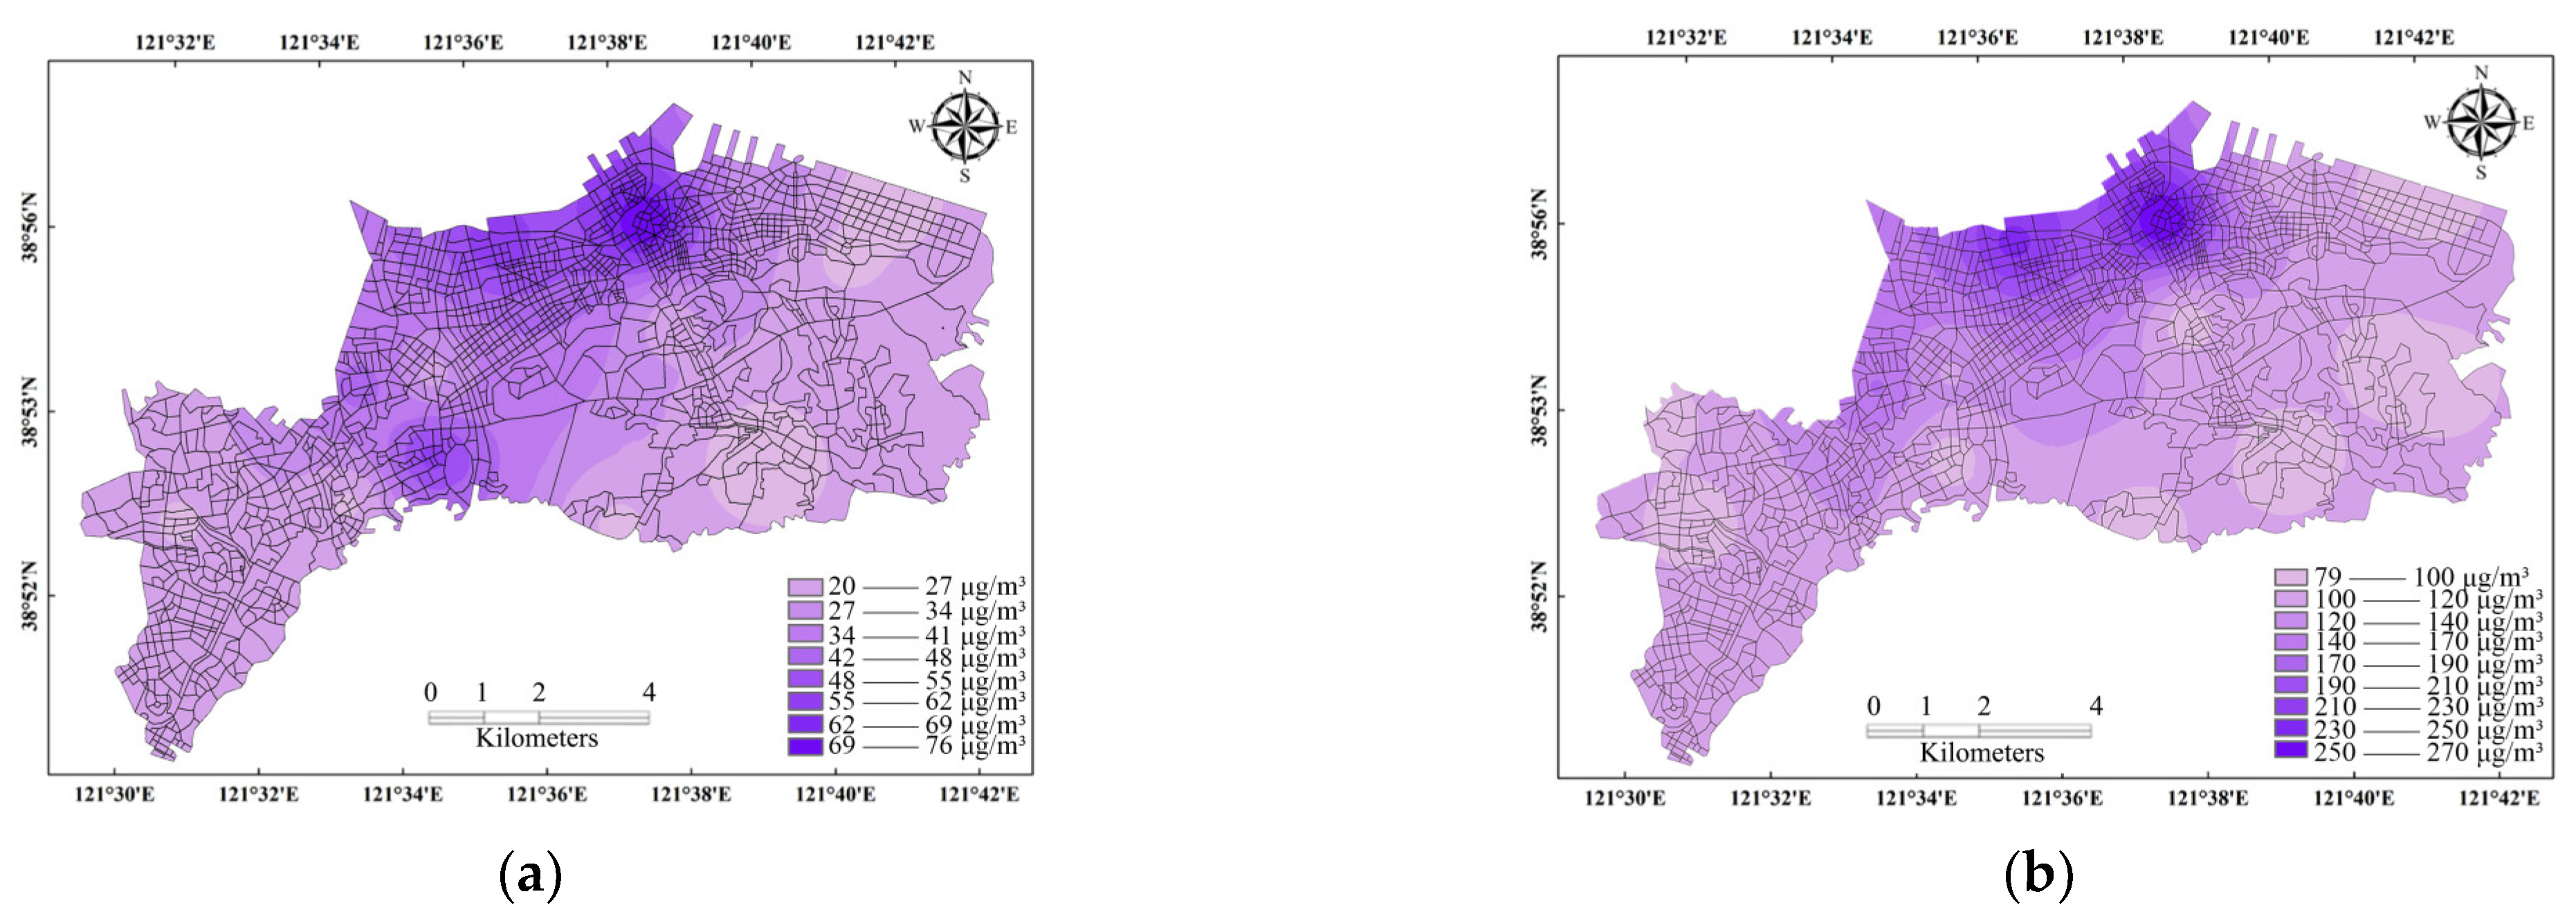
Figure 5 shows the spatiotemporal distribution of NO
2 in the Dalian area. The NO
2 concentration in 2018 was higher than in 2017. The areas with high NO
2 concentrations are concentrated in the northern part of the city. Diffusion conditions of NO
2 are poor on the northeast coastline, and the highest concentration of NO
2 is 280 μg/m³. Analysis shows that the north side is a transportation hub with high road density. The wind direction affects the diffusion direction of NO
2, with atmospheric turbulence taking away pollutants in the air. In the areas with the highest concentrations in the city, NO
2 concentrations in 2018 were more than three times higher than in 2017.
The analysis showed that temperature stratification and high building density resulted in slower diffusion of pollutants on the city’s north side, creating high concentrations of contaminants. At the same time, the combination of high density and enclosed building complexes brings about a local urban heat island effect, which leads to higher heat capacity and minor heat consumption in the air. Therefore, the high-temperature air weakens the diffusivity of the pollutant concentration. Considering the low temperature of the sea breeze, the concentration of pollutants on the southeast coast is lower than that in the central area. Combined with the topography, the situations are diverse, such as airflow climbing, airflow sliding, and airflow backflow in the measurement area, which seriously interferes with the diffusion of pollutants. The spatial-temporal distribution results show that the city’s economic center, with high population density and compact buildings, has become a high-value area of urban pollutants.
4. Linear Correlation Analysis of Pollutant Distribution
In the spatial-temporal distribution of the two pollutants in Dalian, PM10 and NO2 are concentrated in the city’s central area, which is economically developed with a high population density. The topography, air temperature, pressure, and pollution emissions will also affect urban pollutants. Whether the population density or the increase of pollution sources brought by urban industrialization, both are caused by urbanization. Accompanied by urbanization, building density and road density increase, the regional population congregates in the city center, and the air pollution emission increases. Economic development and industrial belts also followed, bringing vast sources of pollution. In addition, the intensification of the urban heat island effect has also increased the carrying capacity of pollutants in the air. Therefore, exploring air pollutants in Dalian is to find the relationship between urbanization and pollutants. This paper establishes the linear correlation between contaminants and the two parameters from road density and building density indicators.
4.1. Linear Correlation of Pollutant Concentration and Road Density
Figure 6 is a linear correlation diagram of pollutant concentration and road density in radius areas. According to the determination coefficient, the interference degree of road density on pollutant concentration is 100 m, 300 m and 500 m. Under the condition of 100 m, the determination coefficient of PM
10 in the summer of 2016 was the highest, which was 0.48. In the summer of 2017, the determination coefficient of 500 m was the lowest at 0.01.
Traffic exhaust pollutants are high in areas with high road density because of residents’ increased production and living density. In addition, there are many green belts in Dalian city center with high road density, a wind field inside the site surrounded by vegetation on the street, and a clockwise wind eddy in the positive pressure area on the windward side. With the disturbance of wind flow and vortex motion, the diffusion and dilution conditions of pollutants within the street becomes weaker, so the density of the road increases and pollutants spread further. The canyon effect makes dilution conditions of air pollutant concentrations harsh.
4.2. Linear Correlation of Pollutant Concentration and Building Density
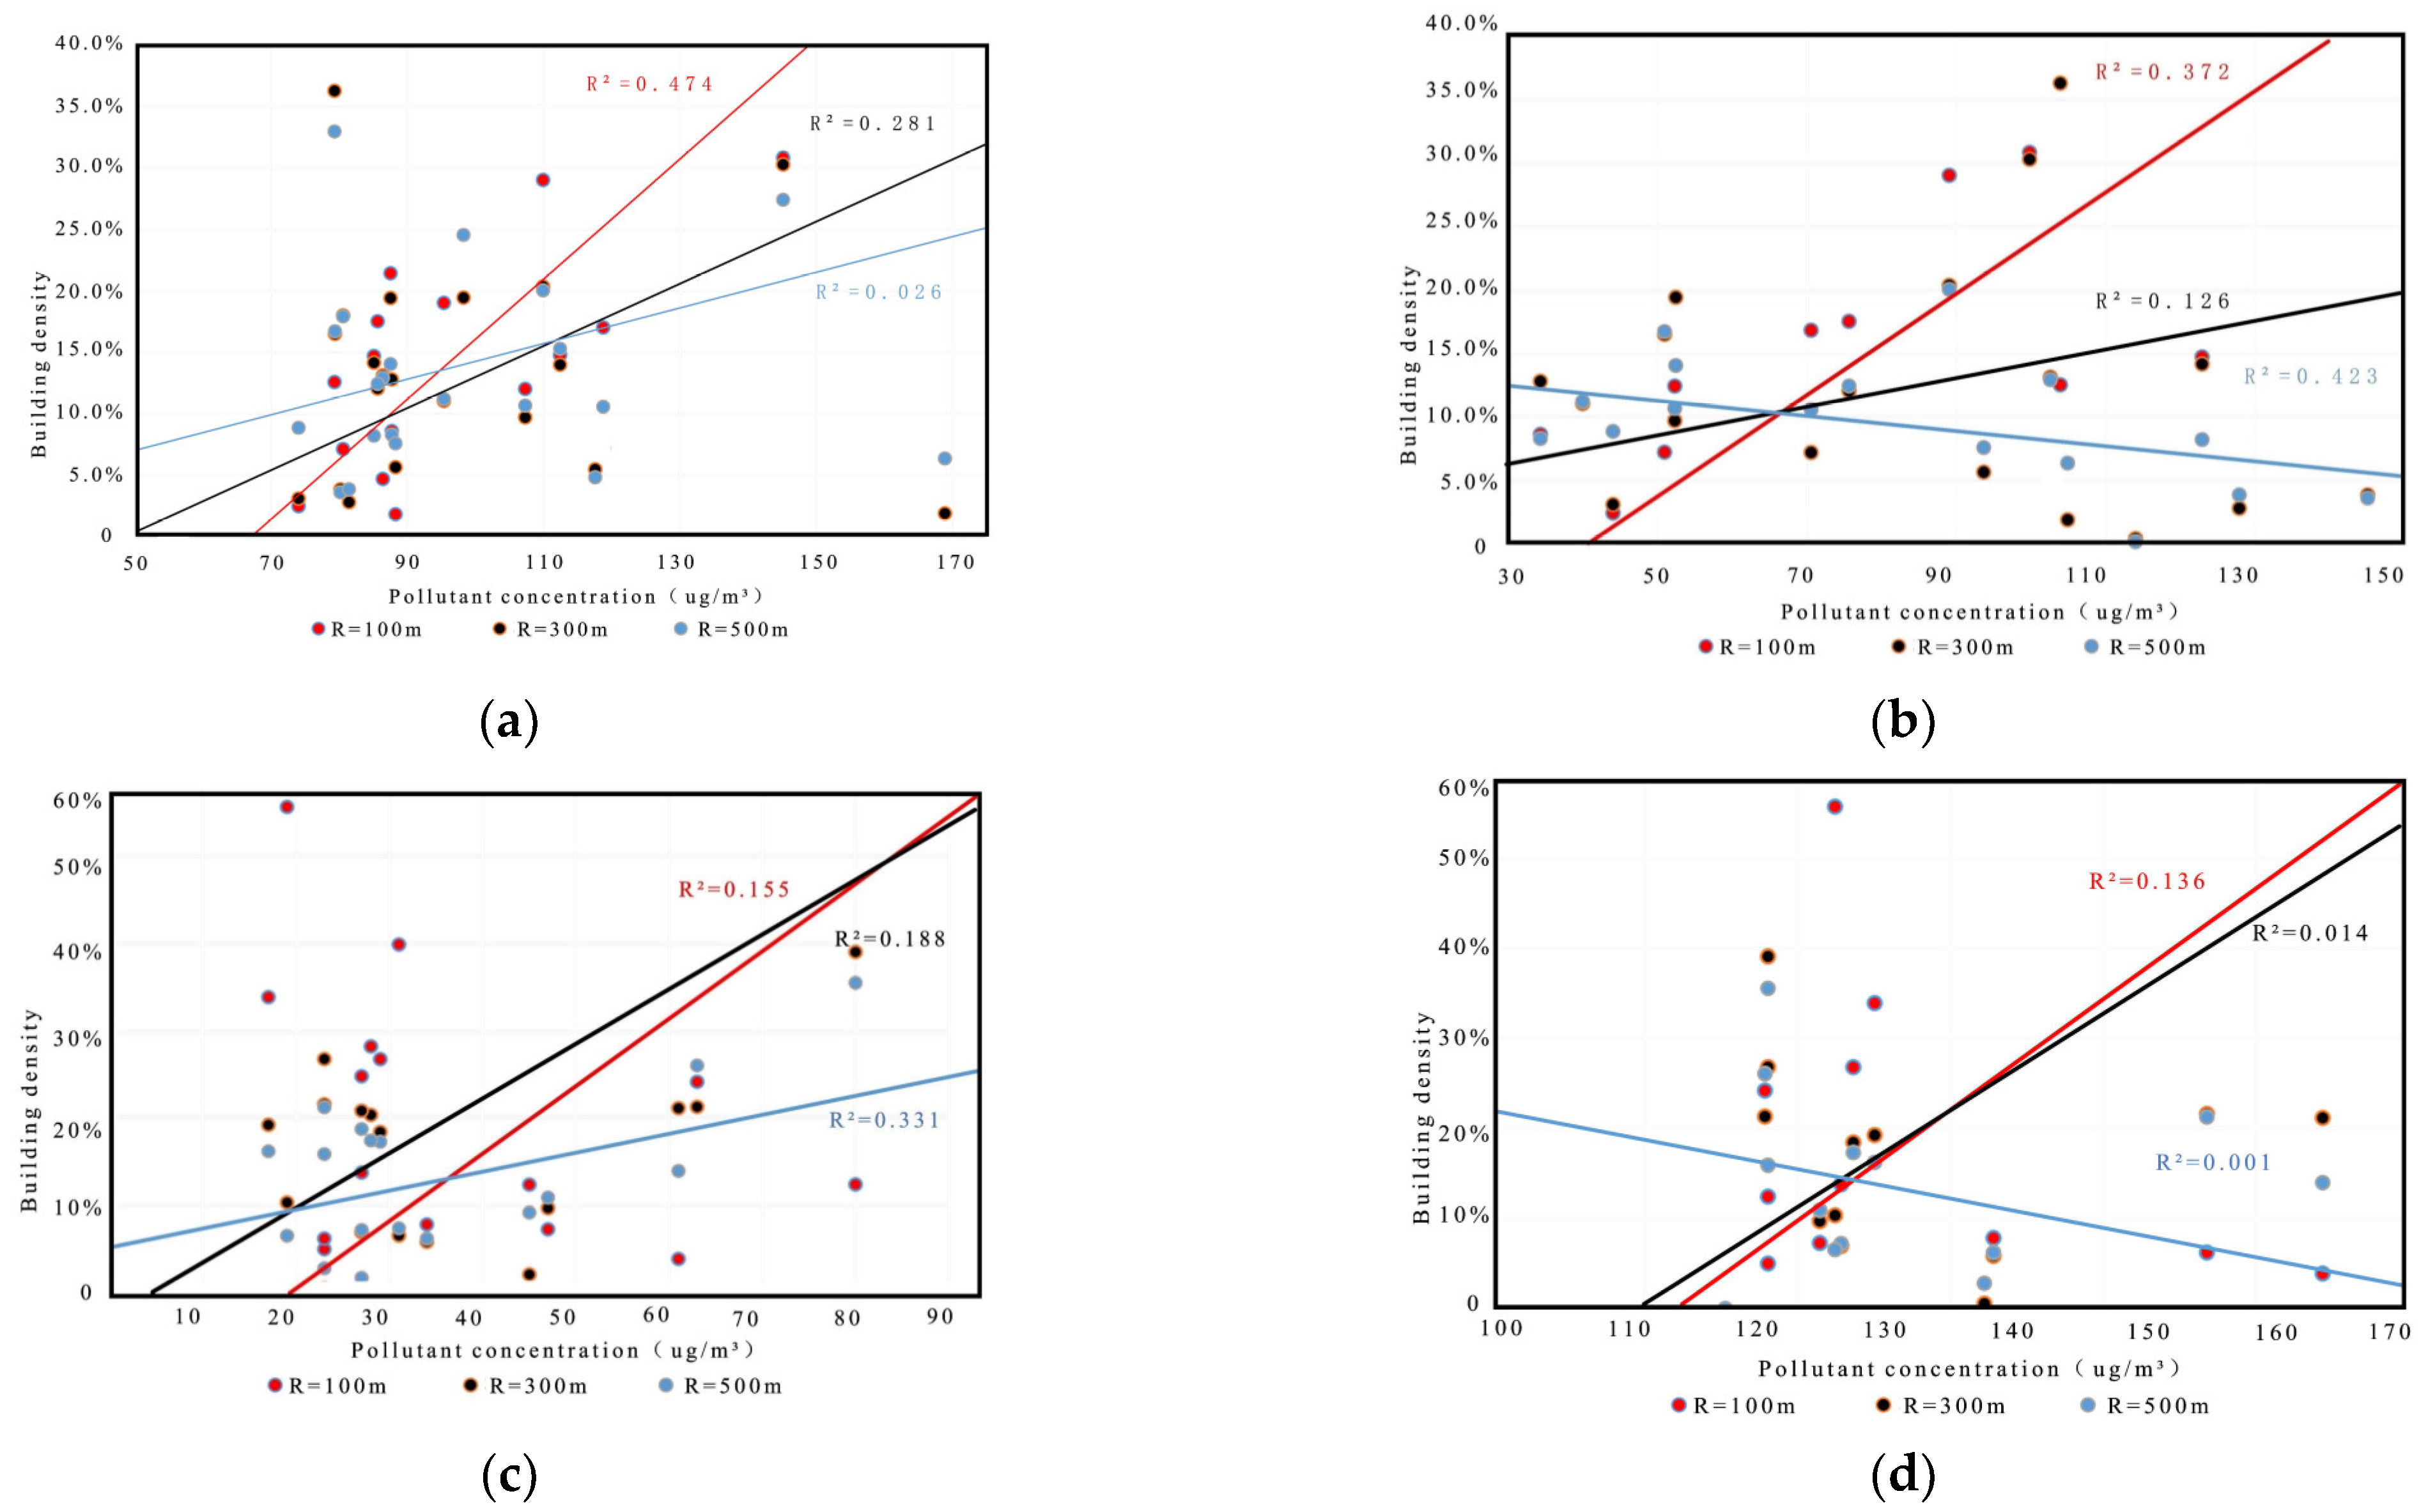
Figure 7 shows the linear relationship between pollutant concentration and building density. There is a coupling relationship between PM
10 and building density, while the coupling relationship between NO
2 and building density is very low. In the summer of 2016, the determination coefficient of building density on PM
10 concentrations peaked within 100 m. The 300 m and 500 m scales show an attenuation trend. The highest R² was 0.47, and the lowest was 0.02.
The change in the wind-heat environment is caused by the building density and the wind energy blocking of the envelope structure under the condition of different radii, and is also caused by the change in the pollutant diffusion conditions. The thicker the wall, the lower the wind speed on the leeward side. The pollutants in the leeward side area are not quickly diffused, resulting in a highly polluted area in a turbulent flow. Due to the thermal effect of the air in the block, the carrying capacity of pollutants in the air in summer is higher than that in winter, and the content of air pollutants in the block in summer is increased. The linear correlation is stronger under the same diffusion conditions in a small radius area.
From
Figure 7a,b, the linear correlation of PM
10 concentration in winter at a radius of 500m is more significant than that at 100 m. The linear correlation between building density and PM
10 concentration is the lowest within 300 m.
Figure 7c,d shows a low linear correlation between NO
2 and building density, proving that NO
2 production is not closely related to building density. The measurement coefficient of PM
10 under the condition of a radius of 500 m reaches 0.42, which is more than three times that under the condition of radius 100 m.
With the building density being low, the wind flowing in all directions of the city block has a good diffusion effect. When the building density increases, the unique wind corridor formed by the building will enhance the circulation capacity of the wind near the ground and improve the dilution capacity of pollutants. This result proves that regional PM10 concentration can be adjusted by controlling building density, referencing regional air quality.
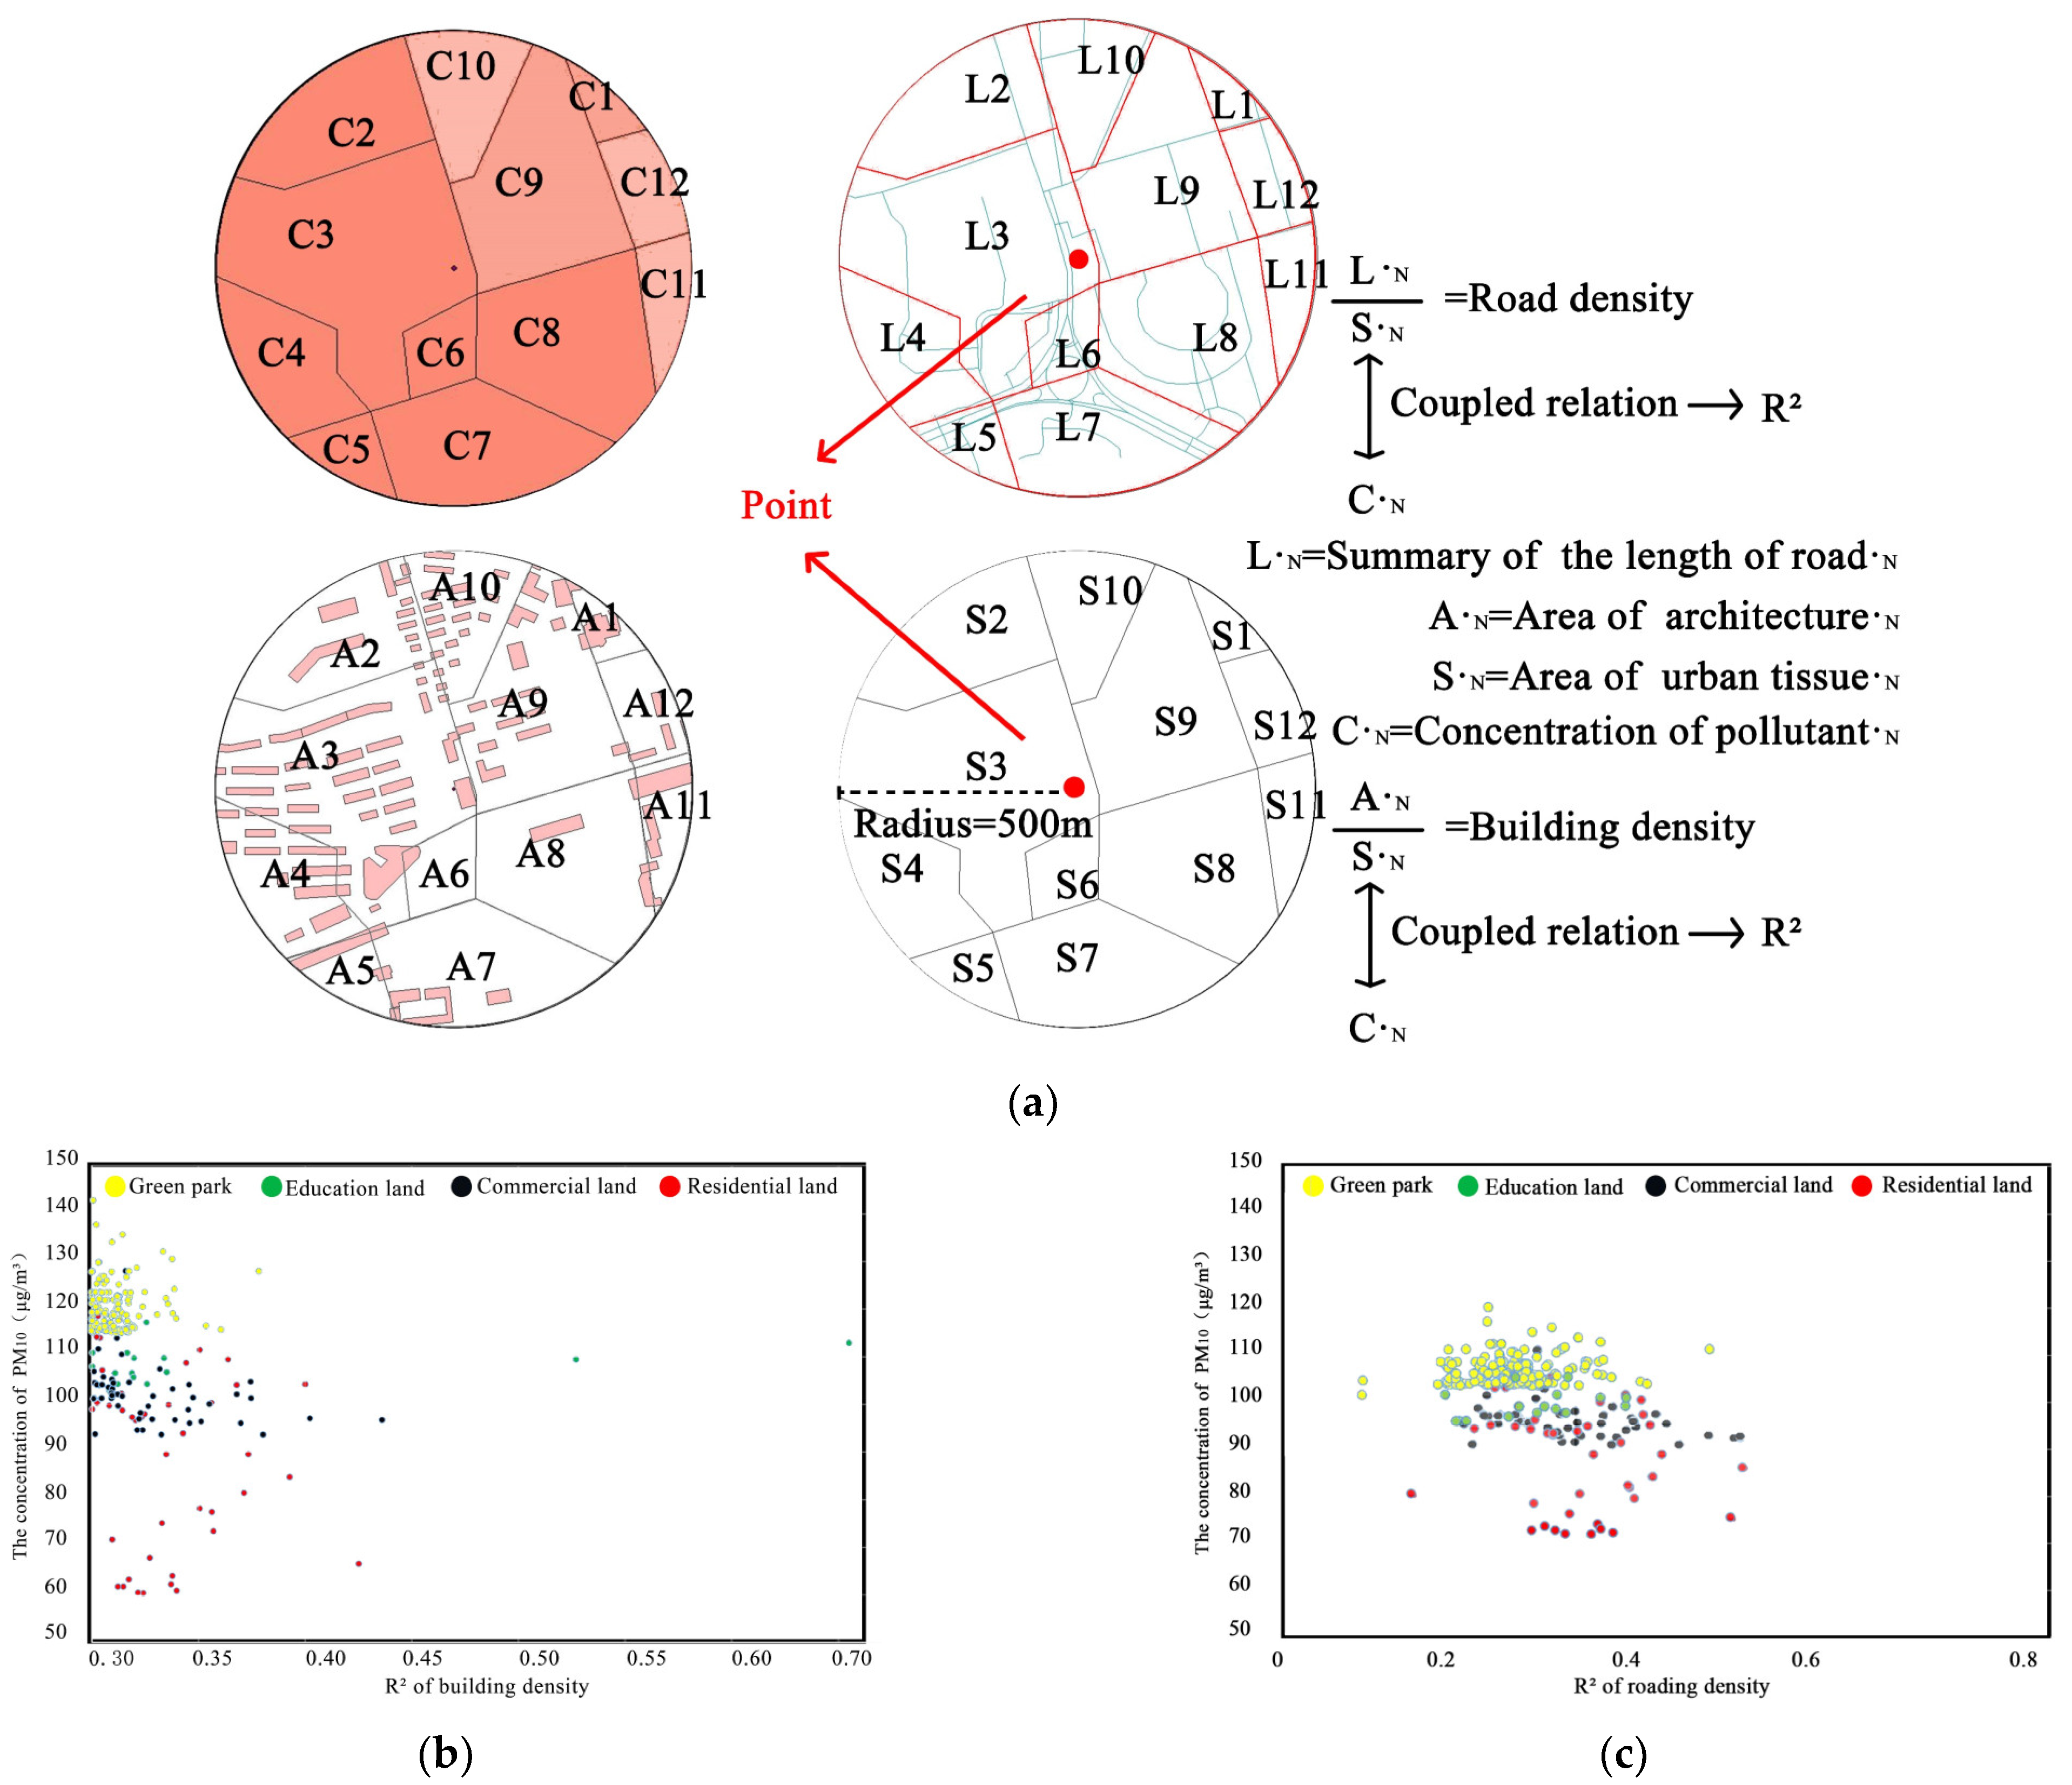
4.3. Coupling Verification of the Pollutant Concentration at the Block Scale by Land Properties
As shown in
Figure 8a, the measurement points were classified to compare the linear correlation of road density and building density with pollutant concentrations for the land properties. Statistical analysis was carried out on the measurement points with a radius of 500 m in the plot. The paper discards points with abnormal data, such as Xinghai Square, which has a very low building density. As a famous tourist attraction, the traffic flow is great and the pollutant concentration is high. The measured PM
10 concentration verified this study in the summer of 2016. The point concentration exceeding 150 μg/m³ was eliminated to increase the accuracy of the data.
Figure 8b,c show the determination coefficients of different attribute points and urban form parameters. According to the strength of the building density determination coefficient, these are residential, commercial, educational and urban parks. The road density determination coefficient value from low to high is in urban parks, education, commercial and residential land. The land with six attributes is divided into blocks according to the urban texture. The linear correlation between building density and PM
10 concentration in the urban street at the measured point is the lowest among the land attributes. As shown in
Figure 8c, with regard to the linear correlation of PM
10 concentration, road density is more vital than building density. The building density in urban parks is low, and the pollutant concentration of each street in the area tends to be the same. The determination coefficient of building density and road density on PM
10 is concentrated at 0.3 in a city park street. The coefficient of determination of each street’s building density and road density in residential land for PM
10 is 0.35. Due to the construction standards of residential areas in Dalian, some sites are located in high-quality economic centers.
In contrast, others are located in sparsely populated areas, and the difference in traffic flow causes differences in pollutant emissions. The final verification results are the same as the coupling discussed above, which proves the above effect of R². Scholars such as Brock believe that increasing population density will worsen the polluted environment [
32].
4.4. Discussion
Under the combined influence of industrial emissions and regional traffic, some areas in the main urban area of Dalian are seriously polluted. This result suggests that the compact urban form and monocentric urban layout can attenuate the concentration of pollutants. The distribution of PM
10 and NO
2 in Dalian conforms to the characteristics of pollution changes in North China. Combined with the attributes of Dalian as a coastal city, a prediction model combined with chemistry can be used for simulation. Since meteorological conditions can control the concentration of pollutants [
33], reducing the damage of pollutants to the human body by controlling the population weight of the main urban area of Dalian is feasible [
34]. As a two-peak planning functional area with a compact layout, the main urban area has a large difference in topography and building density distribution, so the distribution of pollutants is also very different.
Combined with the measured points in the main urban area, the PM
10 concentration is higher in some areas where the heat island effect is not apparent [
35]. At the same time, areas with higher mobility have higher concentrations of pollutants [
36]. In the tourist area of Dalian, the passenger flow in the coastline area is large. Still, the pollutant concentration is low because of the control of pollutant concentration by the sea breeze circulation [
37]. This also explains that the air quality inside the Dalian city block is not as good as in the coastal area.
In addition, investment in top industry services can effectively reduce pollutant emissions [
38]. At the same time, combined with the low-concentration phenomenon near the coastline of Dalian, high-emission industries are concentrated in the areas eliminated by sea wind energy, which can effectively prevent the concentration of air pollutants from exceeding the standard. Collecting satellite remote sensing data can detect areas with high concentrations of pollutants in cities. Adding green service facilities in the blocks of Dalian can also change the flow of contaminants in the blocks [
39].
The concentration of pollutants can also reflect a certain degree of economic development, because contaminants are generated in the production process of enterprises. Urban lockdowns for COVID-19 have significantly reduced nitrogen dioxide emissions from major polluting companies in China [
40]. However, although the NO
2 emission concentration in Korea dropped sharply [
41], and the AQI decreased significantly, the Health Index increased [
42]. In England, rising pollution concentrations can significantly increase infectivity and mortality from COVID-19 [
43].
This also reflects the short-term optimization of air pollution in Chinese cities due to the control of COVID-19 [
44]. With the short-term closure of Dalian during the epidemic period, the traffic flow of people was significantly reduced. Taking the results of the main urban area of Dalian as an example, within 100 m, the road density has an excellent interference effect on the formation of pollutants, and the building density interferes with the concentration of contaminants and wind conditions through flow. In coastal cities such as Dalian, urban planning and construction must implement the regionally balanced development strategy to avoid congested urban centers, prevent large amounts of pollutants, and reduce pollution sources.
5. Conclusions
In previous studies of urban pollutants, separate pollutant components have not been abstracted separately. This study used accurate measurements and simulations to explore urban pollutants’ overall spatial distribution map.
The national control station statistics show that the NO2 concentration is the highest in winter. The reason for this is that Dalian needs heating in winter, and the burning of fuel produces pollutant emissions. The NO2 concentration in 2017 was close to the level in 2018. Still, among the measured concentrations, the measured concentration in spring 2018 was much higher than in 2017, proving the necessity of data normalization. The measured PM10 concentration in summer is much higher than in winter. The analysis shows that the daytime measurement time is the primary time for urban residents to carry out production activities. As the emission source of PM10, traffic exhaust emissions and industrial production emissions are concentrated in this period. In winter, the outdoor weather is cold, and urban residents’ travel activities and work hours are reduced.
In terms of the temporal and spatial distribution of the two pollutants, the concentration of PM10 was significantly higher in summer than in winter, and the concentration of NO2 increased year by year, and was considerably higher in 2018 than in 2017. PM10 is mainly concentrated in the southern and central parts of Dalian, and NO2 is primarily concentrated in the northern part of Dalian. The concentrations of the two pollutants in hilly areas are much higher than those in plain areas. The concentrations in economically developed regions are much higher than those in remote areas. Areas with high road density and building density have high concentrations of pollutants.
The regression analysis of the two pollutants shows that at 100 m, 300 m and 500 m, the determination coefficients of road density and building density on the concentrations of the two pollutants continue to decrease, reaching a maximum of 0.48. Among the influencing factors of PM10 concentration, road density is stronger than building density. NO2 concentration is only related to road density. At the block scale, the ranking of the coupling strength of pollutant concentration with road density and building density, from low to high, is parkland, educational land, commercial land, and residential land.
The innovation of this study lies in revealing the changes in individual pollutant concentrations and exploring the coupling relationship between urban morphological parameters and pollutant concentrations. We should seek ways to reduce the concentration of pollutants from urban morphology, in order to optimize the living environment. Accurate measurements will be combined with real-time outdoor spatial environmental parameters in subsequent studies in the future.

