Article

Discovering Precursors to Tropical Cyclone Rapid Intensification in the Atlantic Basin Using Spatiotemporal Data Mining

1
Department of Geography and GeoInformation Science, George Mason University, Fairfax, VA 22030, USA
2
NSF Spatiotemporal Innovation Center, George Mason University, Fairfax, VA 22030, USA
3
NASA Jet Propulsion Laboratory, California Institute of Technology, Pasadena, CA 91109, USA
*
Author to whom correspondence should be addressed.
Atmosphere 2022, 13(6), 882; https://doi.org/10.3390/atmos13060882
Submission received: 25 April 2022 / Revised: 24 May 2022 / Accepted: 26 May 2022 / Published: 28 May 2022

Abstract

:
Regarded as one of the most dangerous types of natural disaster, tropical cyclones threaten the life and health of human beings and often cause enormous economic loss. However, intensity forecasting of tropical cyclones, especially rapid intensification forecasting, remains a scientific challenge due to limited understanding regarding the intensity change process. We propose an automatic knowledge discovery framework to identify potential spatiotemporal precursors to tropical cyclone rapid intensification from a set of tropical cyclone environmental fields. Specifically, this framework includes (1) formulating RI and non-RI composite environmental fields from historical tropical cyclones using NASA MERRA2 data; (2) utilizing the shared nearest neighbor-based clustering algorithm to detect regions representing relatively homogeneous behavior around tropical cyclone centers; (3) determining candidate precursors from significantly different regions in RI and non-RI groups using a spatiotemporal statistical method; and (4) comparing candidates to existing predictors to select potential precursors. The proposed knowledge discovery framework is applied separately to different factors, including 200 hPa zonal wind, 850–700 hPa relative humidity, and 850–200 hPa vertical shear, to detect potential precursors. Compared to the existing predictors manually labeled, i.e., U200 and U20C, RHLO, and SHRD in the Statistical Hurricane Intensity Prediction Scheme, our automatically discovered precursors have a comparable or better capability for estimating the probability of rapid intensification.

1. Introduction

Tropical Cyclones (TCs) are one of the most dangerous natural disasters as they threaten the life and health of many populations, and often result in enormous economic losses after landfall. For example, Hurricane Harvey made landfall near the Texas Gulf Coast as a Category 4 Hurricane on 25 August 2017. This event triggered catastrophic flooding and claimed the lives of over 100 people [1]. The potential damage of TCs can be significantly reduced given accurate predictions of TC track and intensity. Extensive studies have been conducted to significantly improve TC track forecasting over the past few decades [2,3,4,5]; however, TC intensity forecasting, especially rapid intensification (RI) forecasting, remains a challenge [6,7]. TC intensification processes involve many factors, and our current understanding of the progression of TC is quite limited.
TC intensity is an important component for TC warning and monitoring systems. It is typically measured by the maximum sustained wind speed at a 10 m height [8]. With respect to RI, various studies have proposed different definitions. According to the National Hurricane Center (NHC), a TC undergoes RI if the maximum sustained wind speed increases by at least 30 knots in the subsequent 24 h period. Additionally, wind speed increases of 25, 35, or 40 knots within a certain time period (e.g., 12 h, 24 h, 36 h, 48 h) have also been used as thresholds in RI forecast models and early warning systems [9,10,11,12]. In another definition of RI based on sea level pressure, RI is defined as a decrease in the minimum sea level pressure of 42 hPa in 24 h [13]. Although these definitions are different, they are related to each other, since the eyewall of a tropical cyclone is usually characterized by the fastest winds and the lowest central pressure [14]. In this study, we adopted the definition of the NHC, which defines TC RI as when the hurricane’s maximum sustained surface wind increases by at least 30 knots in the next 24 h.
According to historical records, RI has occurred in 31% of all TCs, 60% of all hurricanes, 83% of all major hurricanes, and all of the category 4 and 5 hurricanes observed in the Atlantic basin from 1989 to 2000 [9,14,15]. However, the understanding of RI is limited. Through a review of the current literature, three main types of approach were found to have been employed in the discovery of favorable meteorological covariates to RI, including a case study approach, statistical analysis, and data mining.
In the case study approach, individual TCs are examined to reveal the physical mechanisms of TCs [16,17]. To understand the whole processes of TC development, including formation, intensification and depression, numerical simulation models have been built and run with different initial conditions and environment parameters. However, numerical simulations usually focus on studying the impact of certain factors on changes in TC intensity by individual TC case; knowledge learned from one case may not be applicable to other cases. Conversely, statistical methods infer the roles of various factors from long-term data. Traditionally, statistical methods identify three categories of factor influencing TC intensity change, including ocean characteristics, inner-core processes, and atmospheric conditions [18]. One study found that a deep layer of warm water, development at night time, and a small eye size were favorable to northwest Pacific RI typhoons [13]. Wang et al. [19] found that for tropical cyclone intensity changes, the commonly used VWS (vertical wind shear) measure between 200 and 850 hPa is less representative of the attenuating deep-layer shear effect than a VWS between 300 and 1000 hPa. Su et al. [20] showed that a stronger inner-core precipitation rate and ice water content and colder outflow temperatures were associated with a greater TC intensification rate. However, statistical models usually test the significance of factors generated by manual area delineation, e.g., 0–2°, 2–4°, or 200 km–800 km around the TC centers [19,21].
An increasing number of studies have adopted data mining technologies to discover which impact factors influence intensity changes, ultimately supporting prediction. Yang et al. [17,18] examined all possible combinations of frequent conditions that may be favorable to RI using an automated approach based on the association rule technique. For all of the Atlantic hurricanes during 1980 to 2003, they discovered a combination of factors related to high RI probability. Specifically, these were the low vertical shear of horizontal wind, high humidity at the 850–700 hPa level, and the TC being in an intensification phase. However, this study utilized the existing predictors contained in SHIPS. Another research analysis identified mid-level vorticity, pressure vertical velocity, 200–850 hPa vertical shear, low-level potential temperature, and specific humidity as the most significant variables in diagnosing RI from NASA MERRA data using spatial statistical techniques [14]; however, they used the total field data within a range from the tropical cyclone center as predictors, but found that not every grid cell in this area was significantly different in the RI/Non-RI groups.
To our knowledge, the three main types of approach discover precursors to RI from two aspects: (1) diagnosing the impact of a certain variable or multiple variables on rapid intensification; and (2) investigating the impact of combinations of existing predictors. However, the spatial locations of these precursors were determined by manual delineation. As the available earth observation and reanalysis data are increasing at an unprecedented rate, a systematic framework is necessary to automatically discover precursors from the high dimensional data. This study is motivated by the challenges of discovering favorable spatiotemporal conditions to RI from high dimensional Earth reanalysis data. The framework aims to identify synoptic-scale precursors within TC environments represented by high dimensional environmental data. Regions of interests are detected using a machine learning method instead of using environmental factors derived from all grid cells in a certain range around the tropical cyclone center. The framework consists of four key steps:
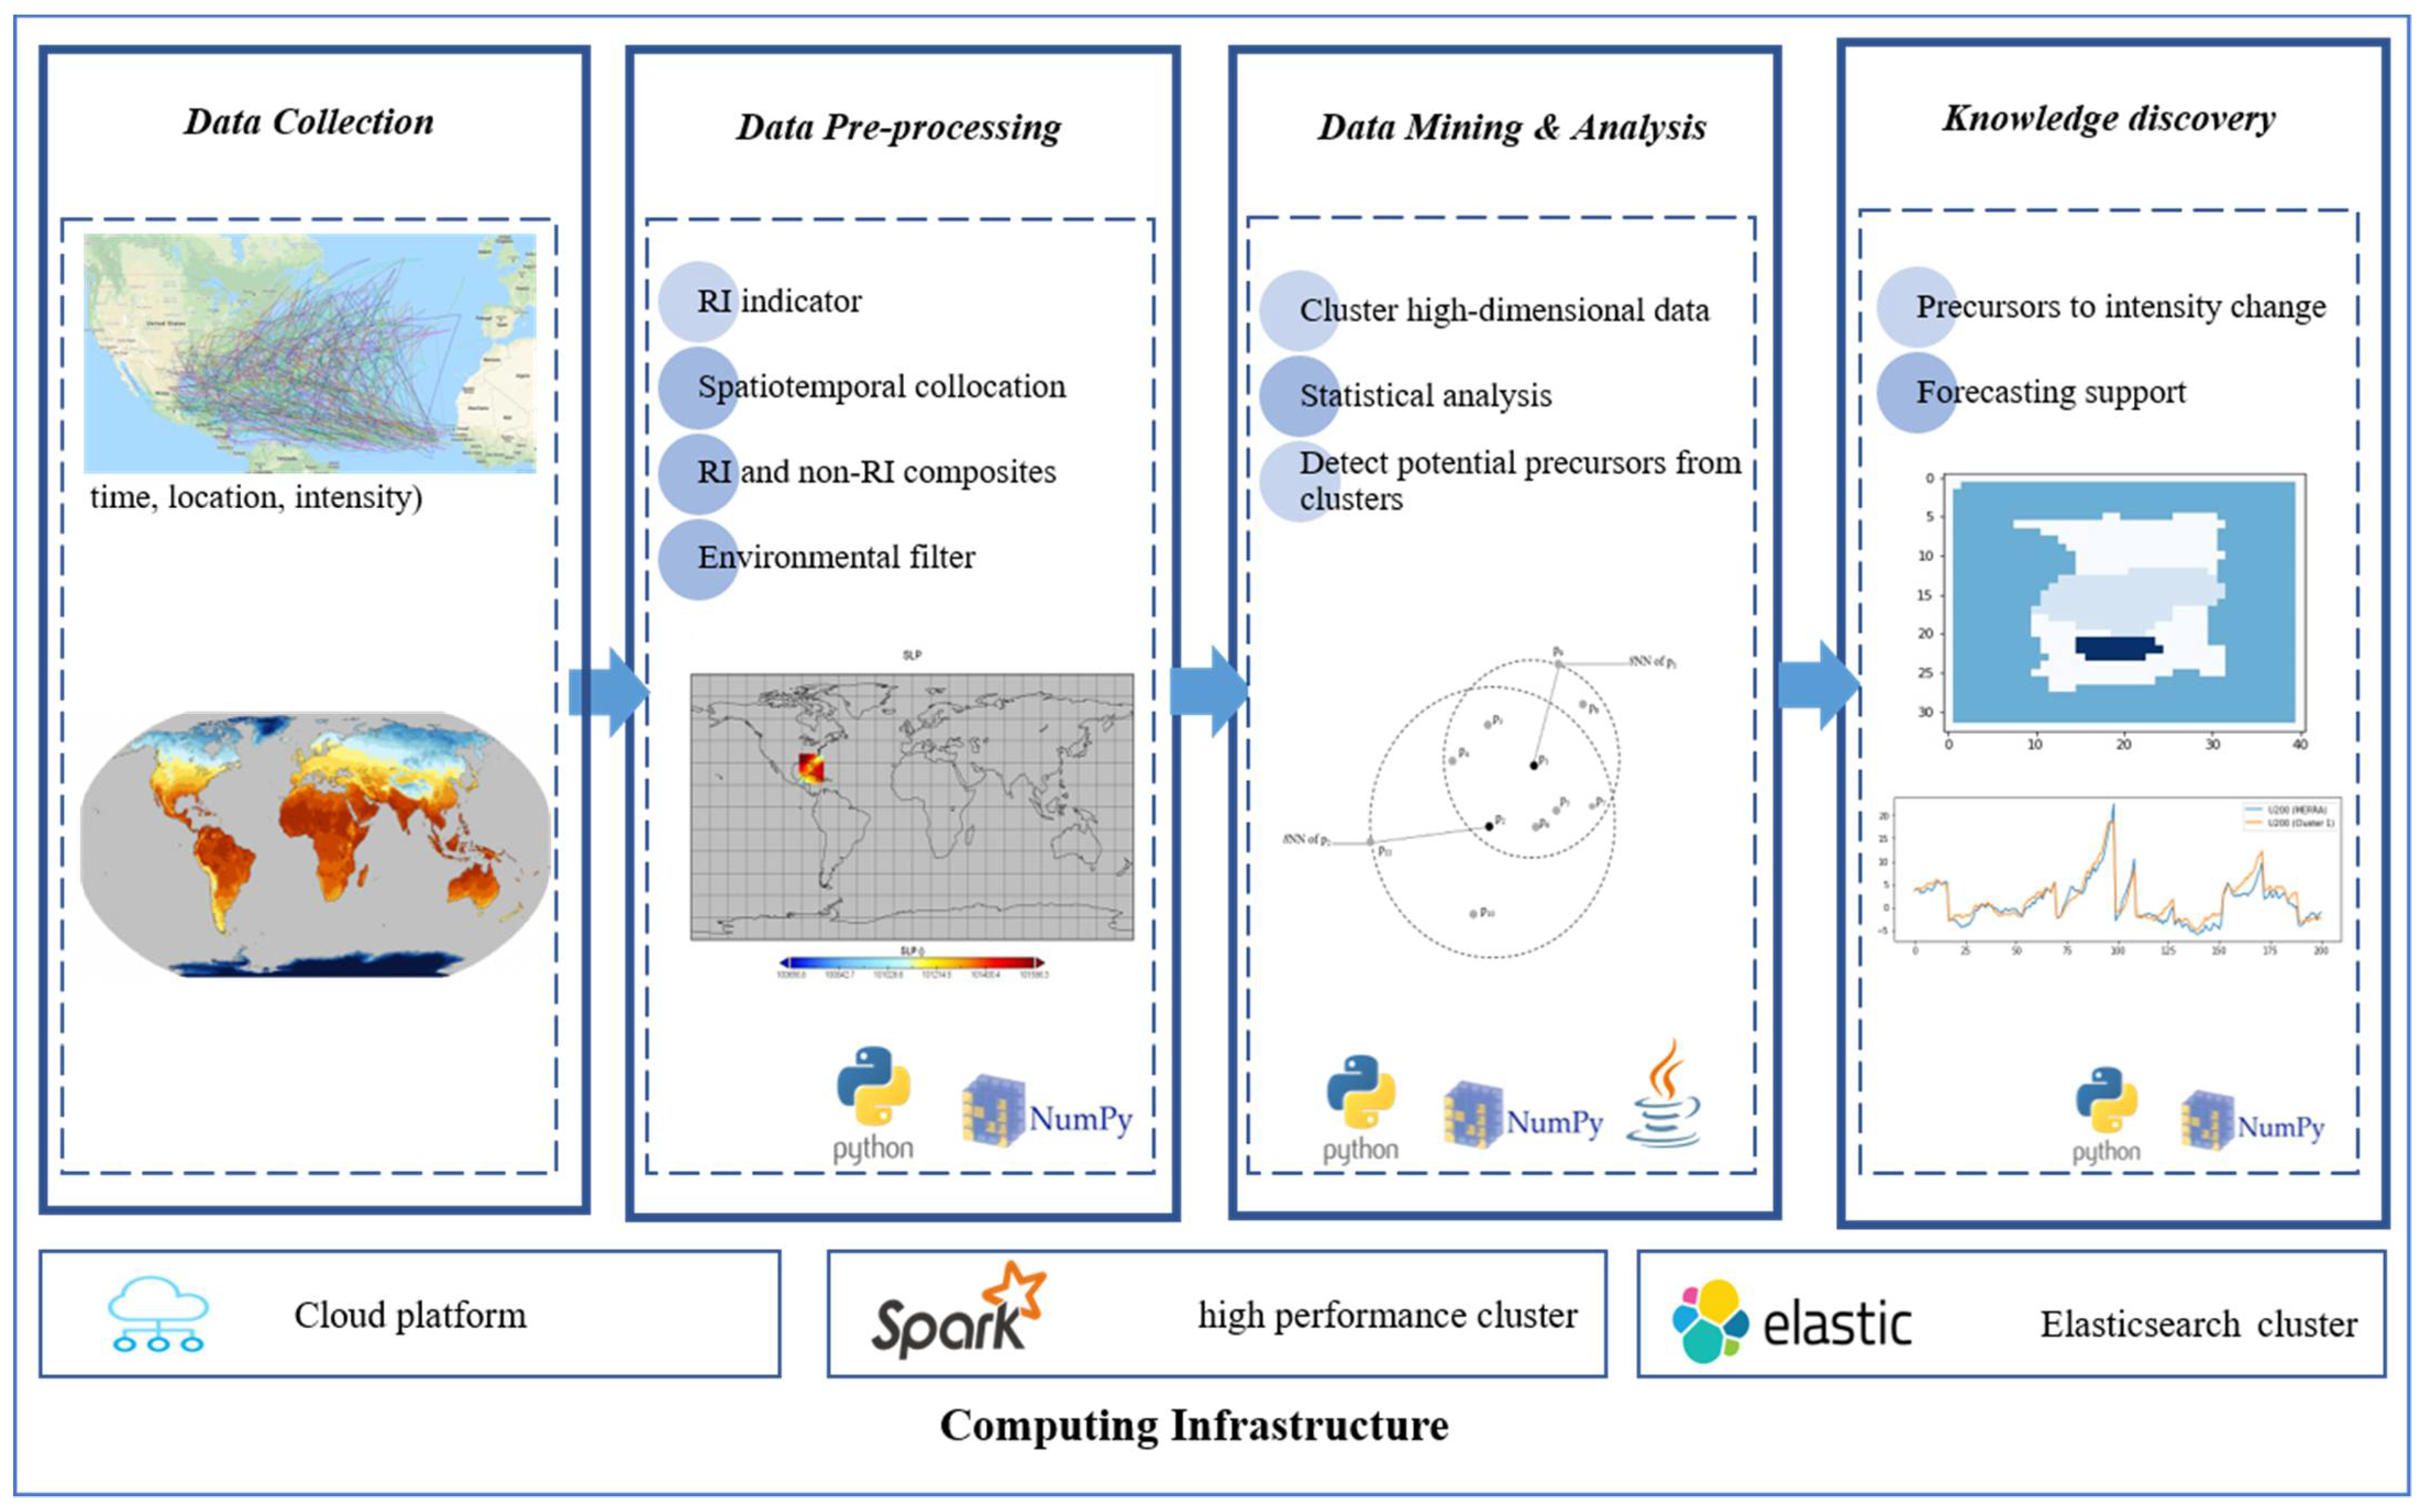
  • Formulate RI and non-RI composite environmental fields from historical TCs. The MERRA2 reanalysis data were collocated with tropical cyclone trajectories in the Atlantic basin, and two RI and non-RI composite groups were built for comparison, in which environmental fields were filtered out from total fields for precursor detection.
  • Use clustering to find regions of the tropical cyclone environment that have relatively homogeneous behavior. A shared nearest neighbor clustering approach was utilized to find high quality clusters from 4D environmental data. Each cluster can be represented by a centroid, that is, the mean value describing the grid cells that belong to the cluster; the centroid is a candidate precursor.
  • Determine candidate precursors from significantly different regions in RI and non-RI tropical cyclone environmental fields using a spatial statistical method. Many clusters (representing regions in a tropical cyclone environment) in the RI and non-RI groups are not significantly different from each other. We need to detect clusters that are highly different in the two tropical cyclone groups; this can be achieved by examining the differences between cluster centroids.
  • Validate potential precursors from candidates by evaluating the impact of candidates on intensity changes. Some precursor candidates may be almost identical to well-known predictors in the SHIPS database, and some candidates may be new potential precursors. If the cluster centroid is comparable to existing predictors in explaining the TC intensity changes, it is one of the potential precursors to the RI events.
The study is detailed as follows: Section 2 introduces the data used in this study and how the data were pre-processed for analyses. Section 3 provides a detailed description of the analytical workflow, including (1) the introduction of the clustering technique; (2) the detection of significantly different regions in RI and non-RI groups; and (3) the evaluation of potential precursors from all candidates. Section 4 investigates the capability of precursor detection using the proposed analytical framework; it shows that the framework can detect potential new RI predictors. Section 5 concludes the key findings and discusses future research.

2. Data

2.1. SHIPS Database

SHIPS [21] is a skillful model provided by NHC as part of the guidance for tropical cyclone intensity prediction. The database records historical tropical cyclone information, such as the storm center, which is determined from the NHC best track data, time, atmospheric predictors (e.g., minimum sea level pressure, Reynolds sea surface temperature) from the National Centers for Environmental Prediction (NCEP) global model analyses (either reanalysis or operational), satellite observations (e.g., GEOS-IR imagery), and storm intensity information (e.g., maximum sustained surface wind) in a 6-h interval. Table 1 shows selected predictors in the SHIPS database.
Although inconsistencies in the definition of RI exist within the literature, this study assumes that a TC undergoes RI if its wind speed increases at least 30 knots in 24 h. An RI indicator is derived from the difference between the current VMAX value and the VMAX value in a 24-h window. If the difference is equal to or larger than 30 knots, then the RI indicator is marked as yes; otherwise, it is marked as no. Atmospheric predictors in the SHIPS databases have been discovered by researchers and organizations in the past decades. They represent well-known environmental factors that affect changes in TC intensity. Since the objective of this research is to discover conditions favorable to rapid intensification directly from 4-dimensional reanalysis data using a machine learning technique, only the storm center (Lat and Lon), time, and intensity information (VMAX) in the SHIPS database are utilized for collocation.
The SHIPS database stores data in a plain text format in which tropical cyclones are listed as temporal sequences. Each line stores values describing a series of parameters during the TC life span. In our study, tropical cyclones occurring in the Atlantic basin from 1982 to 2013 are selected, regardless of landfall. The 1982 to 2013 SHIPS database records 169 TCs with 10,540 6-h instances in total. There are 462 RI events according to the RI definition chosen in this study. The original text file is converted to a csv file in which each row stores the location of the tropical center at a certain time stamp during the TC life cycle (Table 2). Latitude, longitude, and time attributes are used to collect tropical cyclone environmental features from 4-dimensional reanalysis data.

2.2. MERRA2 Reanalysis Data

In our study, NASA Modern Era-Retrospective Analysis for Research and Application Version 2 (MERRA2) data were collected to provide meteorological information for all tropical cyclones in the selected period. The collection of datasets represents meteorological fields over a relatively long time across large geographic regions from reanalysis. Typically, the spatial dimension of climate data consists of latitude, longitude, and altitude, and the temporal dimensions are hourly, daily, monthly, and yearly. In this study, we acquired large-scale tropical cyclone environmental fields from M2I6NVANA, an instantaneous 3-dimensional 6-hourly data collection in MERRA-2. The collection consists of analyzed meteorological fields (e.g., temperature, wind components, specific humidity, layer pressure thickness) in 0.5 × 0.625 (latitude/longitude) global grids every 6 h, at 72 vertical pressure levels, from 1000 hPa up to 15 hPa. Meteorological variables (specific humidity, u and v wind components) were collected for precursor discovery (Table 3).
The M2I6NVANA dataset is stored in a common array-based data format using a multi-dimensional, array-based data model [22,23]. A open-source NetCDF python package (https://github.com/Unidata/netcdf4-python (accessed on 24 April 2022)) was utilized to retrieve time series data from the MERRA2 dataset for any variable given a specified location. Thus, the original array-based data were converted to 3-dimensional data. The space is split into multiple grid cells and each grid cell contained latitude, longitude, altitude, and multivariate time series data.

2.3. Collocation

Since the primary goal of this research is to discover conditions favorable to RI from large-scale meteorological fields, the tropical cyclone center was mapped to the nearest grid cell in the corresponding MERRA2 grid at each time stamp. Meteorological fields around 40 × 33 (latitude × longitude) grid cells (around 2000 km in both the zonal and meridional directions) were extracted from the M2I6NVANA dataset for each storm. Figure 1 shows an example of 40 × 33 grid cells representing the sea level pressure (SLP) field around the tropical cyclone center.
After establishing environmental data from the MERRA2 dataset for each tropical cyclone, the meteorological data were split into RI and non-RI groups. The RI group consists of meteorological fields for the 463 events, representing the environment around the cyclone center when tropical cyclones undergo RI. Relatively, the non-RI group contains meteorological data for 463 non-RI snapshots randomly selected from the 10,078 non-RI instances, in order to have balanced RI/non-RI cases.

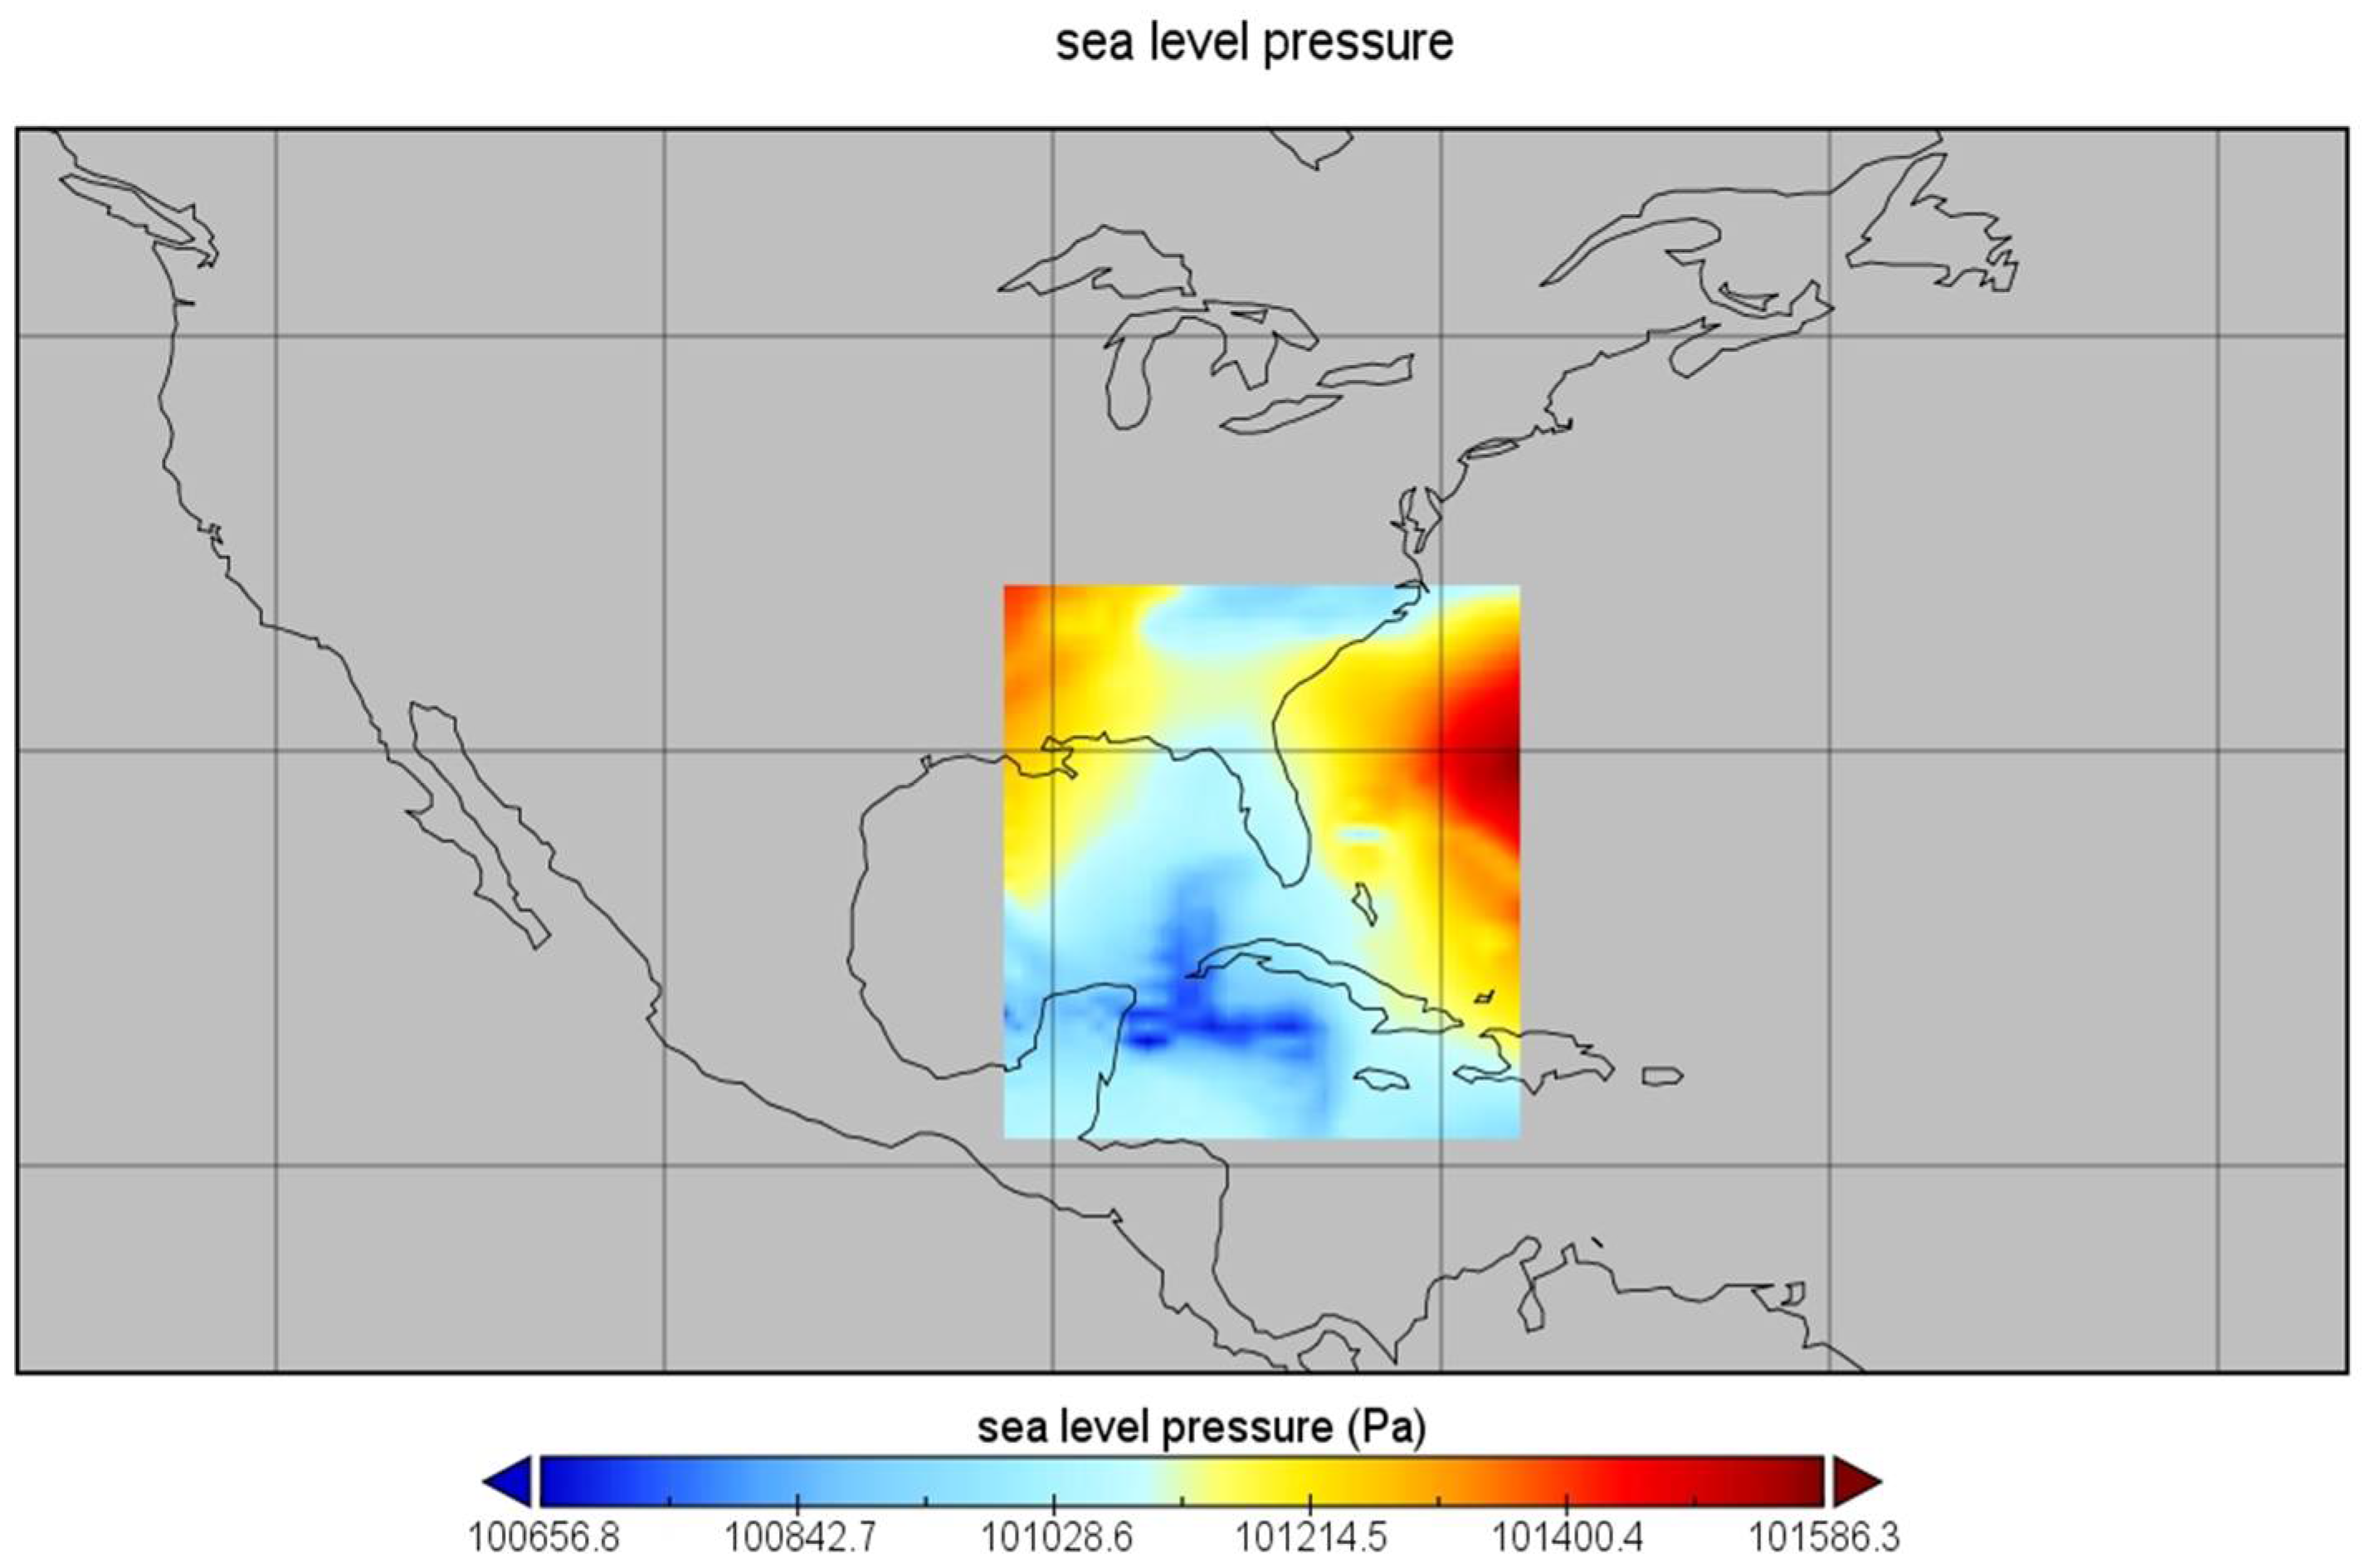
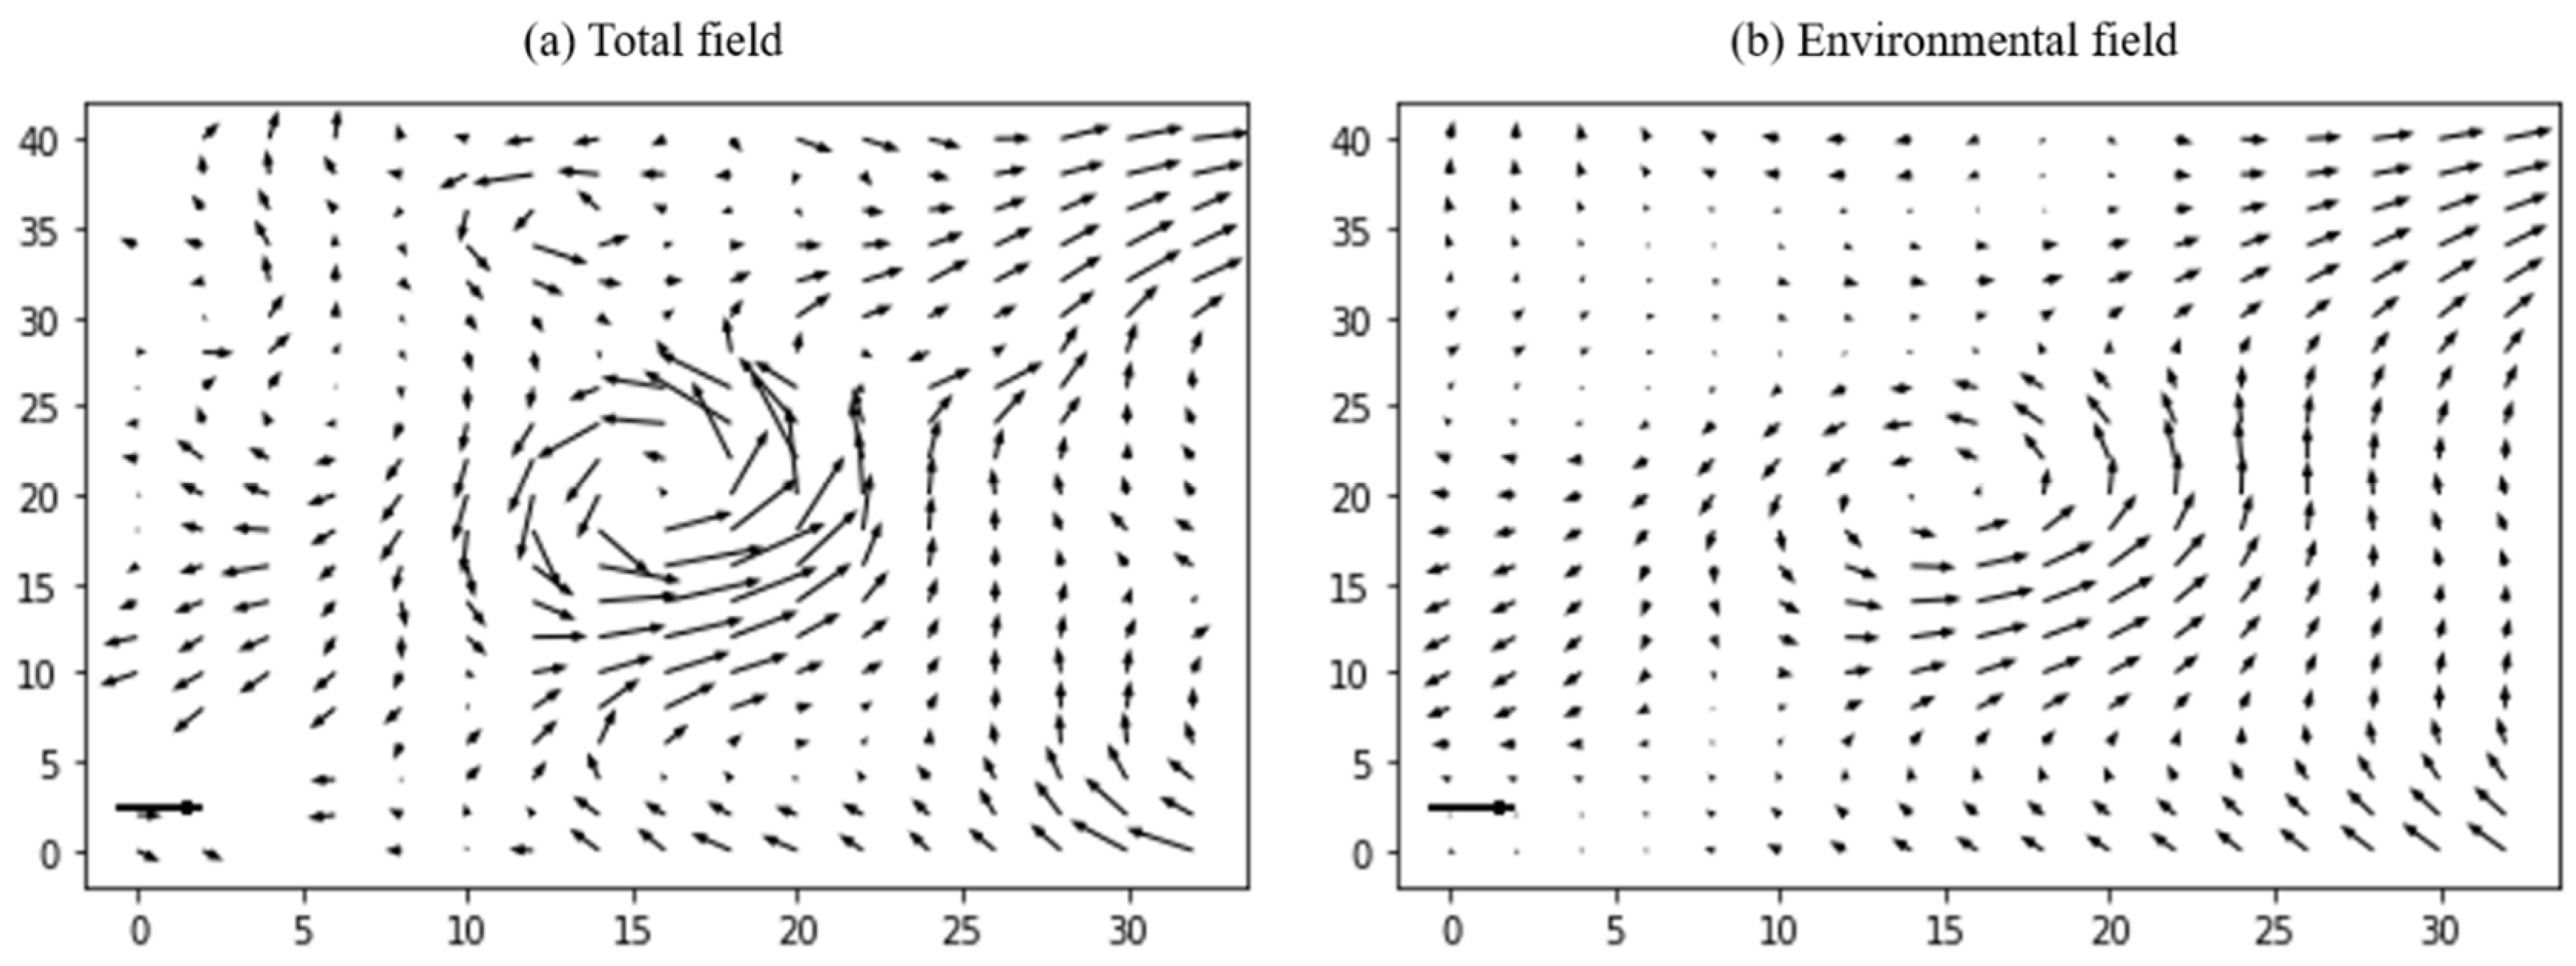
2.4. Environmental Data Filter

Generally, two environmental data extraction methods could be utilized when we perform factor analysis using the reanalysis data. One method is to calculate factor values directly from the reanalysis data, otherwise known as the total field of the reanalysis. The other method calculates factors from the filtered field based on an algorithm proposed by Kurihara [24]. In this study, the environmental data were filtered from the total fields. A filtering algorithm removes vortex from the total field of the reanalysis data by splitting an original scale field f (e.g., sea surface pressure) into the environmental field fE and the disturbance field fD, that is,
f = fE + fD,
The filter operator, a local three-point smoothing operator, is iteratively applied to a reanalysis field in the zonal and meridional directions. The operator is first applied in the zonal direction, as shown in Equation (2), where f is the total field being smoothed, f ¯ is the zonally smoothed value, and lon and lat correspond to longitude and latitude, respectively. lon − Δlon and lon + Δlon are the neighboring longitudes. The filtering parameter defined in Equation (3), K, is computed using m, which varies with several numbers (i.e., 2, 3, 4, 2, 5, 6, 7, 2, 8, 9 and 2) in sequence.
f ¯ l o n , l a t = f l o n , l a t + K ( f l o n Δ l o n , l a t + f l o n + Δ l o n , l a t 2 f l o n , l a t ) ,
K = 0.5 ( 1 c o s 2 π m )   1 ,
After smoothing the total field in the zonal direction, a similar filter operator in the meridional direction defined in Equation (4) is applied to the previously smoothed value. lat − Δlat and lat + Δlat are the neighboring latitudes of lat. The environmental field, fE, is obtained from the described filtering process.
f E l o n , l a t = f ¯ l o n , l a t + K ( f ¯ l o n , l a t Δ l a t + f ¯ l o n , l a t + Δ l a t 2 f ¯ l o n , l a t )
Figure 2 shows an example of the original total wind field and the corresponding filtered environmental wind field for hurricane ALLI at 0600UTC, 3 July 1994. With disturbances removed from the total field, the environmental field can capture the large-scale environmental flow. As suggested by previous studies [19,24], the environmental field makes the calculation of mean environmental flow less dependent on data resolution and more robust compared to the original total field. This is due to the fact that the hurricane center may deviate from the actual hurricane center in the reanalysis field, and this kind of deviation can cause large errors [19].

3. Methods

The knowledge discovery framework utilized data mining techniques to find potential precursors to the RI events. Figure 3 shows the proposed knowledge discovery framework workflow consisting of four main steps: data collection, data pre-processing, spatiotemporal data mining and analysis, and knowledge discovery. The first two components, as introduced in the data section, collect and collocate environmental data for tropical cyclones. In the data mining and analytical step, candidate precursors that yield a statistically significant difference between RI and non-RI storms were identified through data mining and statistical analysis. Specifically, the shared nearest neighbor based DBSCAN clustering algorithm (hereafter referred to as the SNN clustering algorithm) groups environmental fields into clusters for further analysis. In the knowledge discovery step, the potential precursors were compared with existing predictors to evaluate their capability with regard to explaining intensity changes.

3.1. An SNN-Based Clustering Approach

Although environmental fields provide a wealth of meteorological information describing the tropical cyclone, it is hard to directly detect patterns from these kinds of data because several grid cells store the information around the storm center, and each grid cell contains multiple time series. Detecting patterns from a large number of grid cells is a challenging task. According to the first law of geography, nearest grid cells are assumed to be similar to each other. If an algorithm is utilized to cluster time series of environmental variables associated with grid cells around the tropical cyclone center, we can obtain clusters that represent relatively homogeneous large-scale environmental fields around the tropical cyclone center. A cluster centroid, a value that summarizes the behavior of a region at a certain time, is a precursor candidate. Thus, clustering plays a vital role in utilizing data mining for the discovery of RI precursors.
As an unsupervised machine learning method, various clustering algorithms have been proposed to explore clusters in data, e.g., k-means [25] and DBSCAN [26]. Although k-means is simple and efficient, we decided not to use it in this study since k-means clusters all data, and the cluster quality suffers a lot if the data are noisy. DBSCAN is able to cluster data by filtering out noises, but it is not used in our analysis either, since the dimension of RI/non-RI time series is high and the classical distance metrics such as the Euclidean and Manhattan distance become non-discriminating in high dimensional space [27]. Recent work has shown that shared nearest neighbor (SNN) similarity is able to describe the similarity of high dimensional objects in a more meaningful way [28,29,30]. The SNN-based clustering algorithm can discover geographically continuous, high quality clusters from noisy data. Thus, this algorithm was selected to group the environmental fields in our study.
The SNN-based clustering algorithm introduced two concepts called sNN-similarity and sNN-density to detect clusters in high dimensional space [29,30]. A simple introduction to the algorithm is provided below.
  • A similarity graph is built by computing pair-wise similarities for all pairs of points (grid cells in our case) and sparsified by keeping the k most similar neighbors of each point.
  • An SNN graph is constructed from the sparse similarity graph using sNN-similarity, which is defined as the number of points in the intersection of the k nearest neighbor list of two points.
  • Given a parameter eps (eps < k), the sNN-density of each point is computed from the SNN graph. The sNN-density of a point P is defined as the number of points having sNN-similarity to P at least eps. A point whose sNN-density is not less than another parameter MinPts (MinPts < k) is a core point.
  • Two core points are placed in the same cluster if they are within a radius eps of each other (that is, their sNN-similarity is larger than eps). All non-core points that are not within a radius of eps of any core point are discarded as noise. Every non-core, non-noise point is assigned to a cluster to which its nearest core point belongs and is regarded as a border point in the cluster.

3.2. SNN Clustering of Tropical Cyclone Environmental Fields

In our study, the environmental data of 463 RI events were composed to a grid for a selected environmental field, or specifically, the meteorological fields of these events were combined to represent the environmental data around the tropical cyclone center 24 h prior to rapid intensification. Taking surface temperature, for example, a 40 × 33 grid was constructed, and each grid cell recorded the surface temperature value for these RI events using a 463-dimensional array. The grid cells were then clustered into small groups using the SNN-based clustering algorithm, where the sNN-similarity was computed based on cosine similarity. Before clustering, the environmental array data were transformed to standard anomalies, by subtracting the mean value and dividing by the standard deviation in the grid cell.

3.3. Detect Potential Precursors from Clusters

Grid cells in the same cluster detected from the environmental fields of RI tropical cyclones represent relatively homogenous behavior. The cluster centroid, that is, the average value of grid cells in the cluster, could represent the region behavior. A cluster centroid could be a precursor candidate for an RI event if the centroid yields statistically significant differences between the RI and non-RI groups. Consequently, the difference between the environmental values associated with the cluster centroid in the RI and non-RI groups was analyzed.
To test the significance of the difference between each pair of cluster centroids from the RI and non-RI groups, a permutation test [31,32] was performed on the two groups of values to determine the 95% level of statistical significance in the observed difference. Statistically, cluster centroids of an environmental field that are significantly different between the RI and non-RI groups could be good discriminators of RI events. This step yields a series of precursor candidates of RI events by clustering different meteorological fields separately.

3.4. Validation of Potential Precursors

The above steps discovered several precursor candidates of RI events from environmental fields using the SNN clustering algorithm. These candidates may replicate well-known predictors or be potential new precursors. For those candidates, which intersect well-known predictors in a large area, the correlation between cluster centroids and TC intensity changes over 24 h were diagnosed to check if their correlations with intensity change were similar to known precursors. For a cluster centroid that does not correspond to known predictors, the correlations of the cluster centroid with intensity change were also computed to check its capability for explaining the changes in intensity [19]. If the correlation coefficient was comparable to the existing corresponding predictors, the cluster centroid could be a potential precursor to an RI event.
Meanwhile, since the correlation coefficient between predictors and intensity change is always small, because RI rarely happens, we also estimate the probability of RI based on predictor values. The probability was computed by comparing each of the existing/potential predictor values to the corresponding RI threshold, which was defined as the RI sample mean for each predictor [32]. A threshold was satisfied if the predictor value was either no less or no larger than the RI threshold, with the direction dependent on the frequency distribution of predictor values. The RI probability was then computed by dividing the number of RI cases that satisfied the RI threshold by the total number of cases that satisfied the same RI threshold.

4. Analysis

In this section, we applied the proposed method to environmental fields around the tropical cyclone center to discover potential precursors to tropical cyclone rapid intensification. Three environmental fields (i.e., 200 hPa zonal wind, 850–700 hPa relative humidity, and 850–200 hPa vertical shear) were selected as diagnostic inputs to the knowledge discovery framework, and the corresponding predictors (i.e., U200 and U20C, RHLO, and SHRD) in the SHIPS database were chosen for validation in terms of the correlation and probability of rapid intensification.

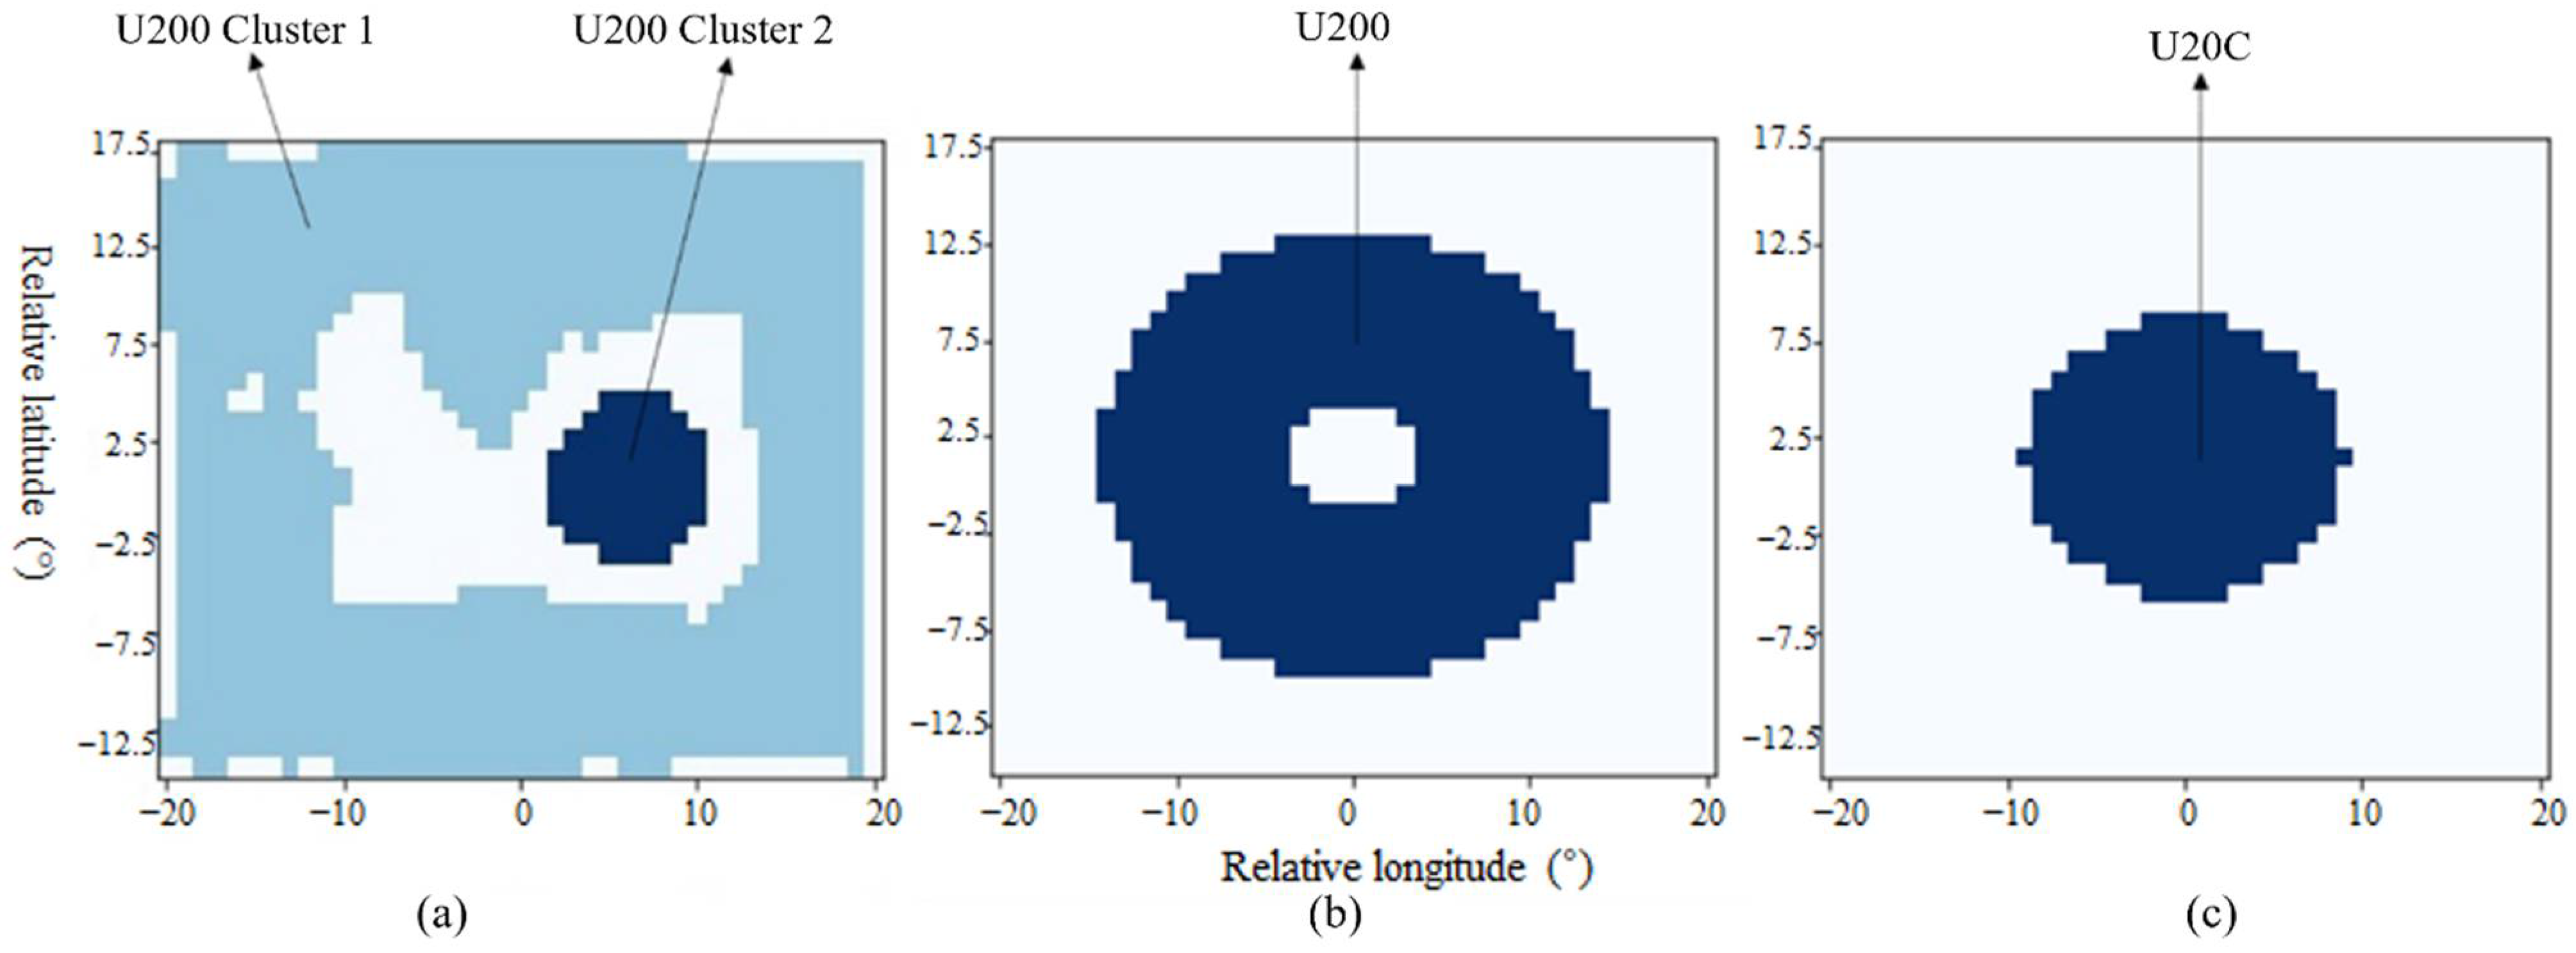
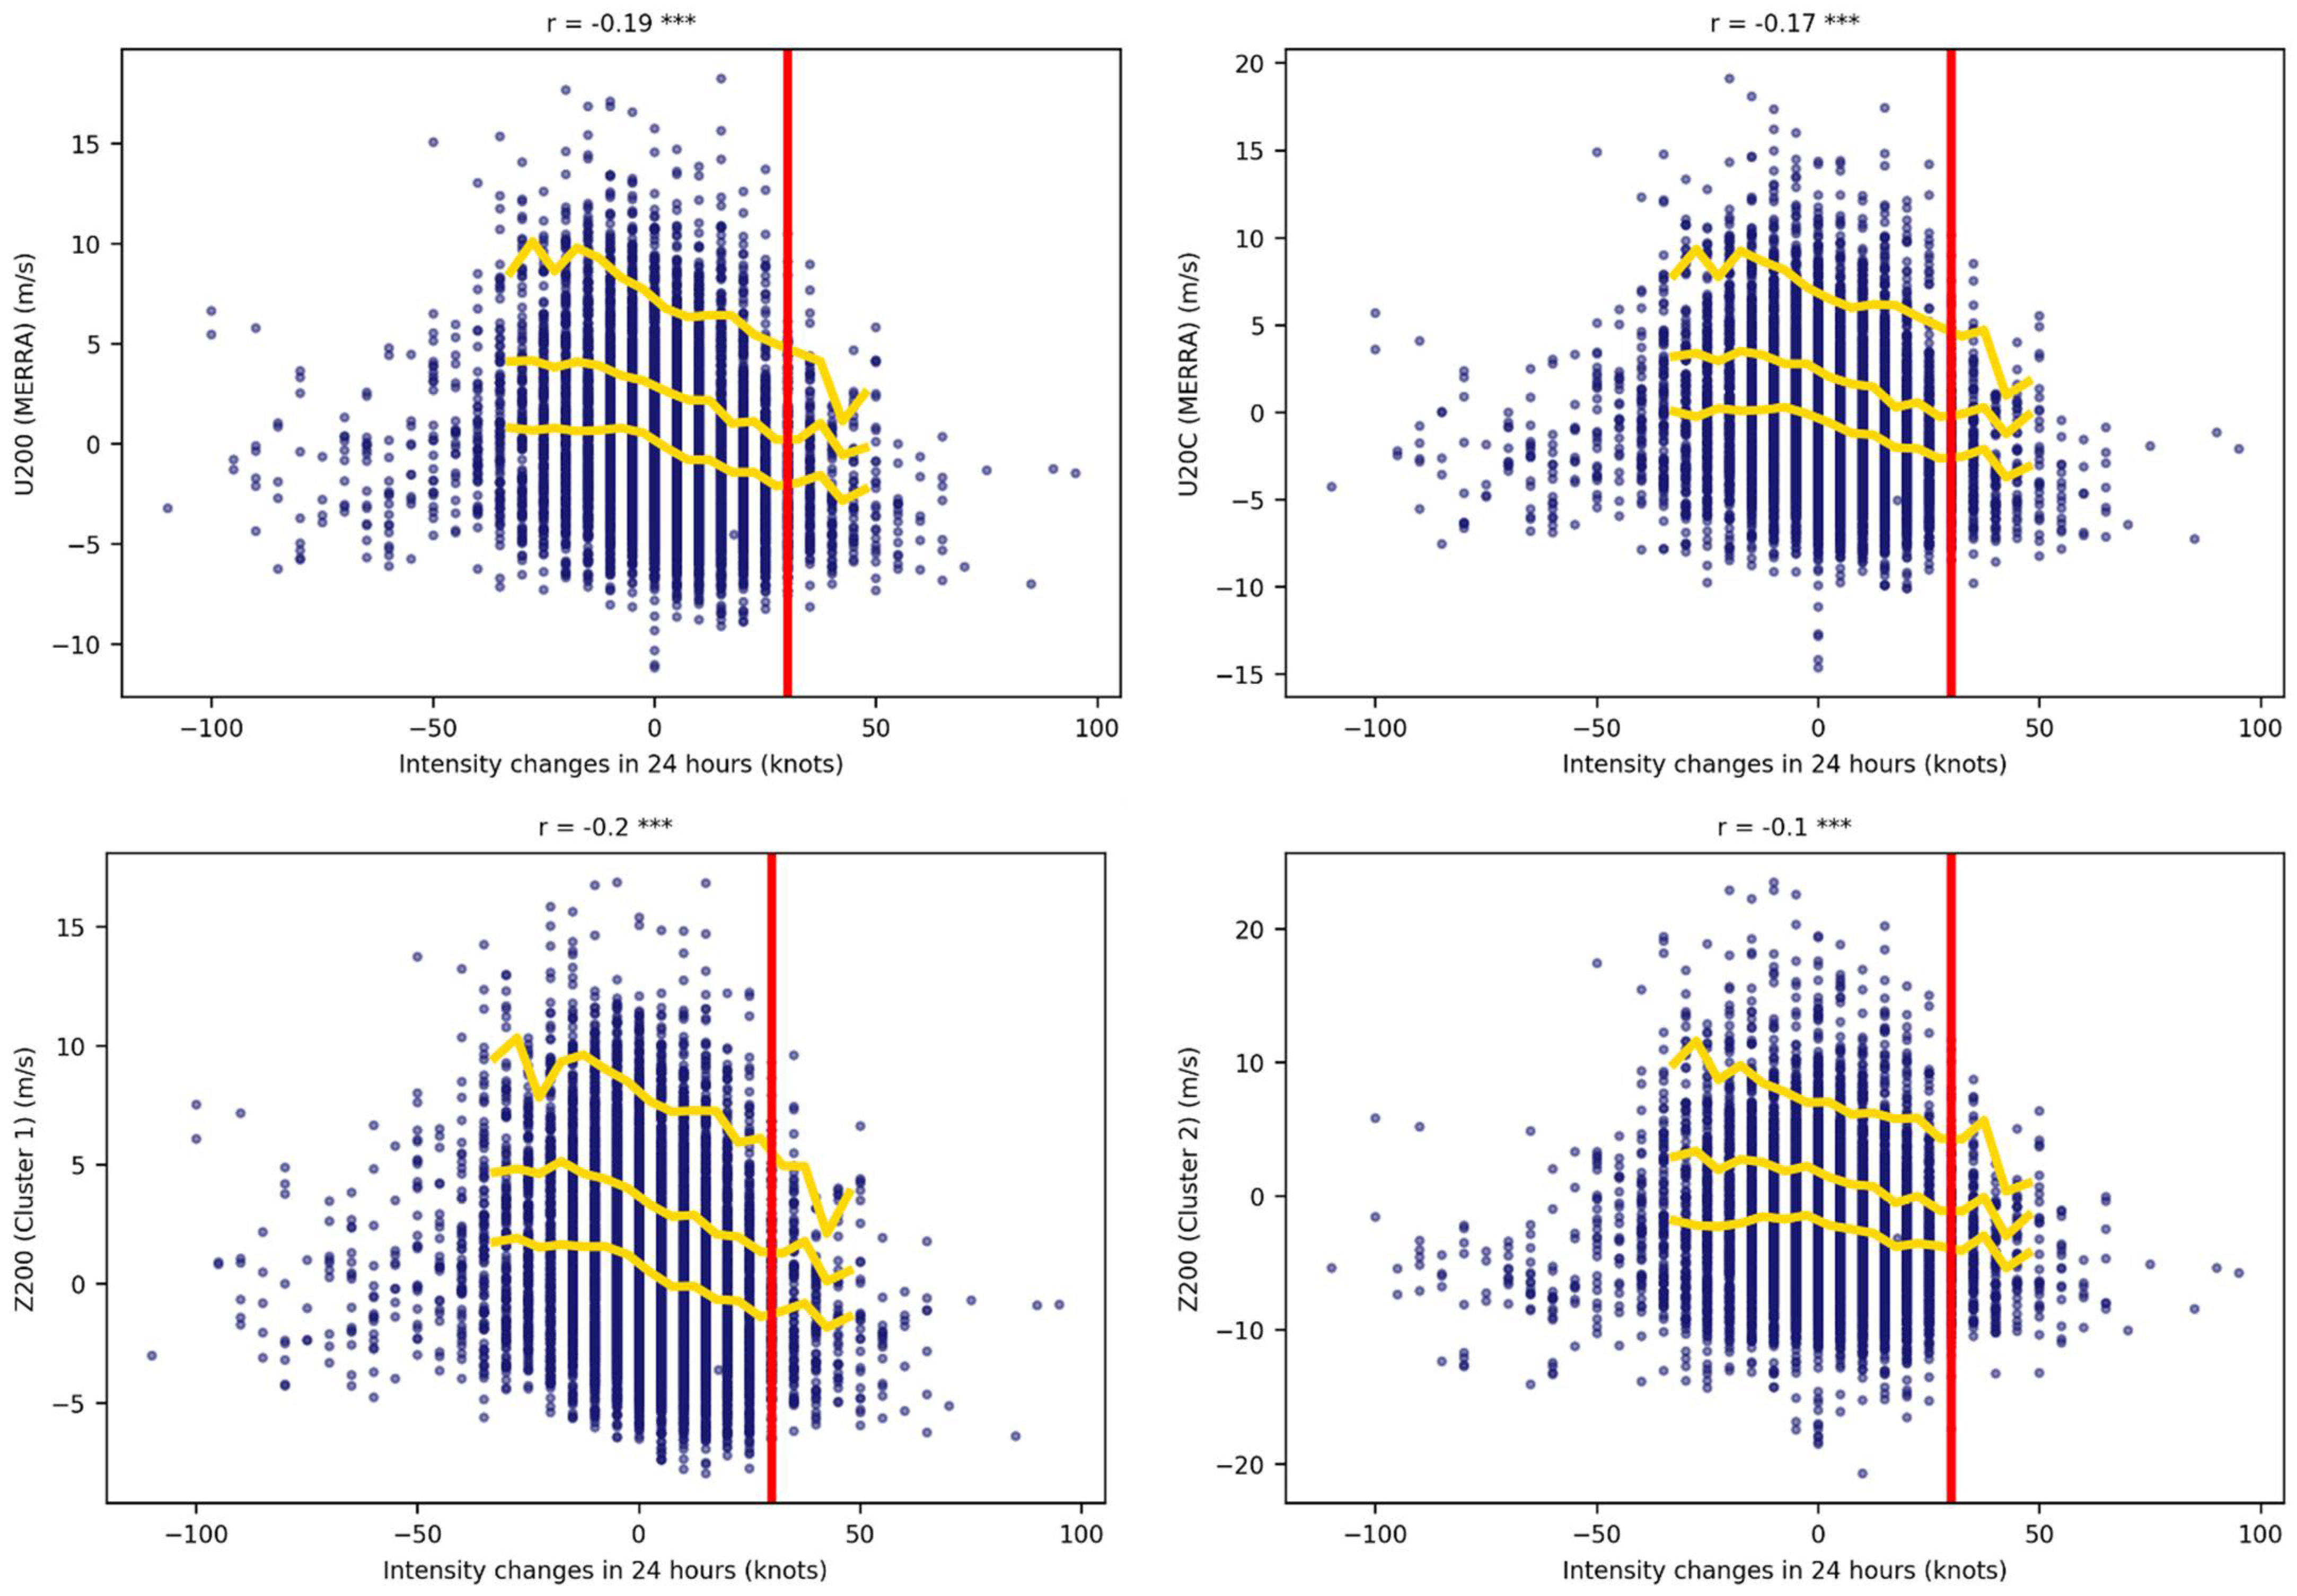
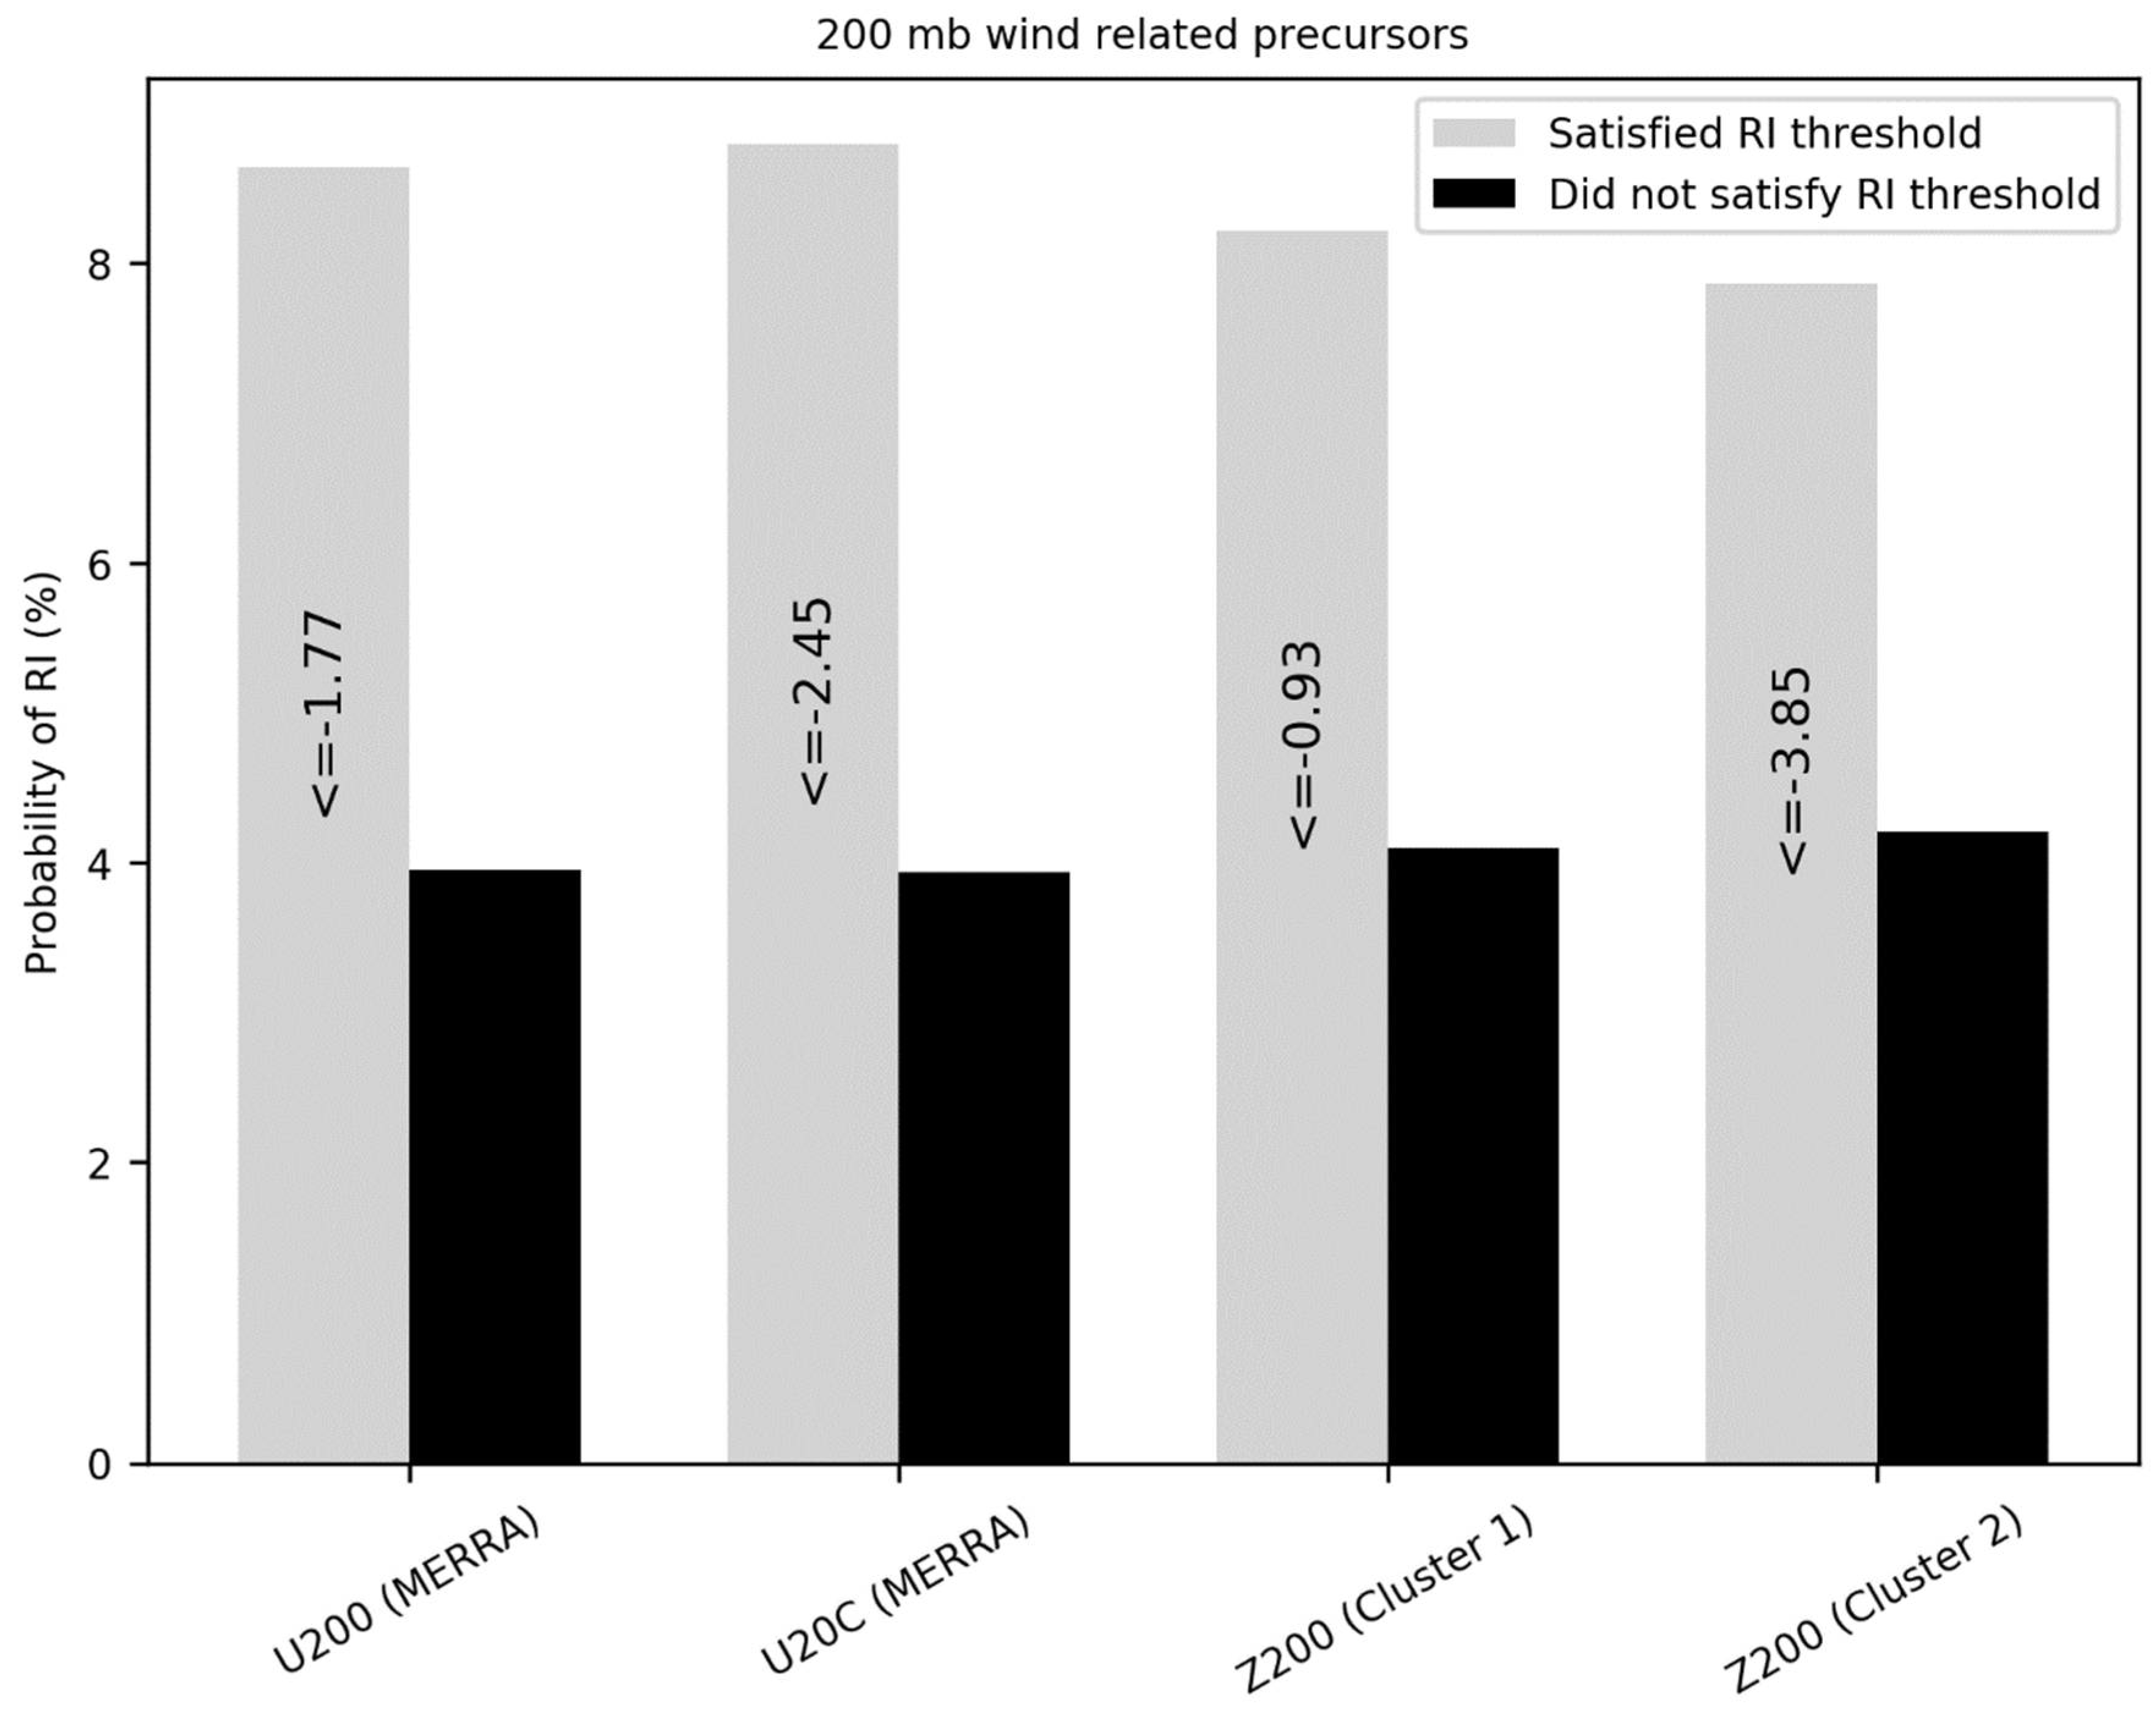
4.1. 200 hPa Zonal Wind

The SHIPS database contains two predictors related to 200 hPa zonal winds: U200 and U20C. U200 is the zonal wind averaged over an annulus between radii of 200 km and 800 km in 200 hPa. U20C is similar to U200, but the radii are changed to 0 km and 500 km, respectively. Figure 4b,c show the locations of these two predictors relative to the TC center. In our study, 40 × 33 grid cells around the tropical center containing anomaly 200 hPa zonal winds for RI composites were clustered using the SNN algorithm, with the parameters k, eps, and MinPts set to 50, 30, and 25, respectively. Two clusters, Z200 Cluster 1 and Z200 Cluster 2, were significantly different between the RI and non-RI groups, with p values less than 0.01. The two clusters represent homogenous regions in the zonal wind at 200 hPa, as shown in Figure 4a. Cluster 1 mainly contains grid cells in an annular area and Cluster 2 locates the right side of the cyclone center.
According to Figure 4, the region of Z200 Cluster 1 and U200 have some overlaps, as do Z200 Cluster 2 and U20C; thus, Cluster 1 was compared with U200 and Cluster 2 was compared with U20C in our analysis. The annular mean value of Cluster 1 and U200, and the circular mean value of Cluster 2 and U20C, were extracted from environmental fields, which were derived from MERRA at each time snapshot. Figure 5 shows scatter plots of these predictors in relation to intensity changes over 24 h. Figure 5a shows the correlation of U200 extracted from MERRA environmental fields and TC intensity changes in 24 h. The correlation value, −0.19, is statistically significant (p value < 0.01). The correlation of the Z200 Cluster 1 and TC intensity change is −0.2, and the correlation is also statistically significant. This indicates that our data mining framework could find a potential precursor that is comparable to an existing predictor. The difference in the correlation coefficient may be caused by the asymmetricity of the 200 hPa zonal wind field, which can be caught by Z200 Cluster 1 but not the standard U200, calculated from a symmetric annular mean of the wind field.
The same analysis was conducted for Z200 Cluster 2 and U20C, as shown in Figure 5. However, the degree of correlation between Z200 Cluster 2 and the TC intensity change is −0.1. It is less representative compared to U20C, whose correlation to intensity change is −0.17, indicating that Z200 Cluster 2 is not a good potential precursor. Apparently, in this case, the cluster has spatial bias from the TC center, and that is possibly the reason for the low correlation.
Figure 6 shows the probability of RI for predictors U200 (MERRA), U20C (MERRA), Z200 Cluster 1 and Z200 Cluster 2. The probability of RI ranges from ~7% when the RI threshold for Z200 Cluster 2 was satisfied to ~9% when the U20C (MERRA) or U200 (MERRA) RI thresholds were met, indicating that predictor candidates perform worse than existing ones in terms of probability of RI. Thus, although the two Z200 Clusters were found to be significantly different in two environmental groups, they are not good predictors.

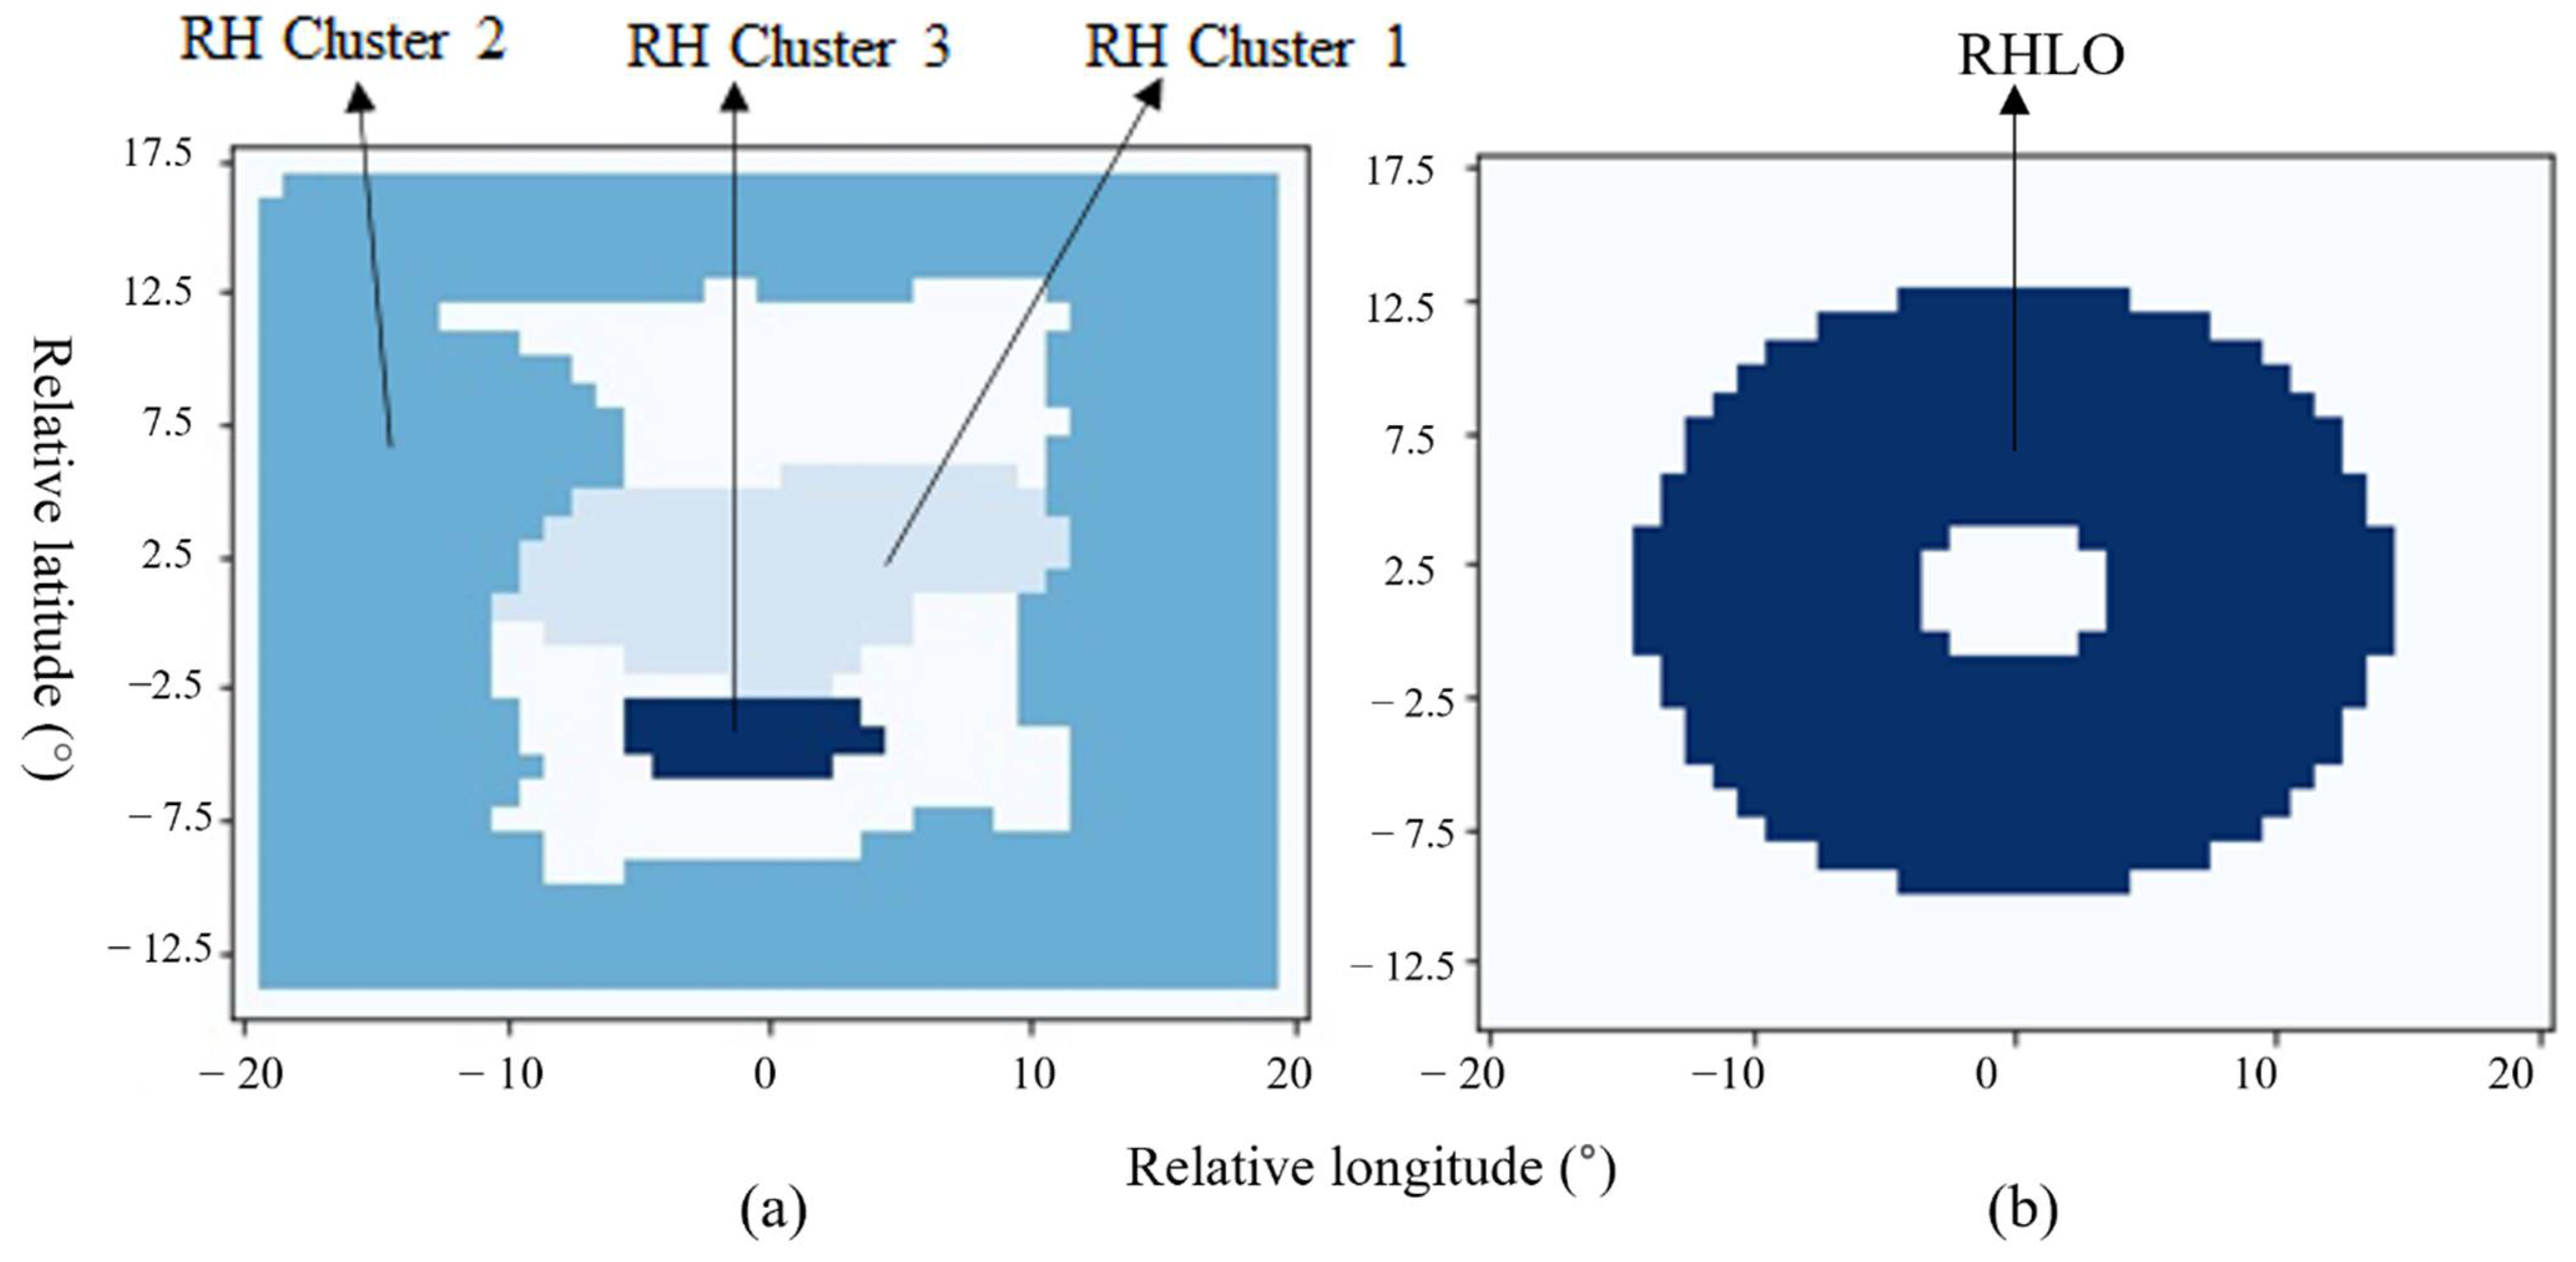
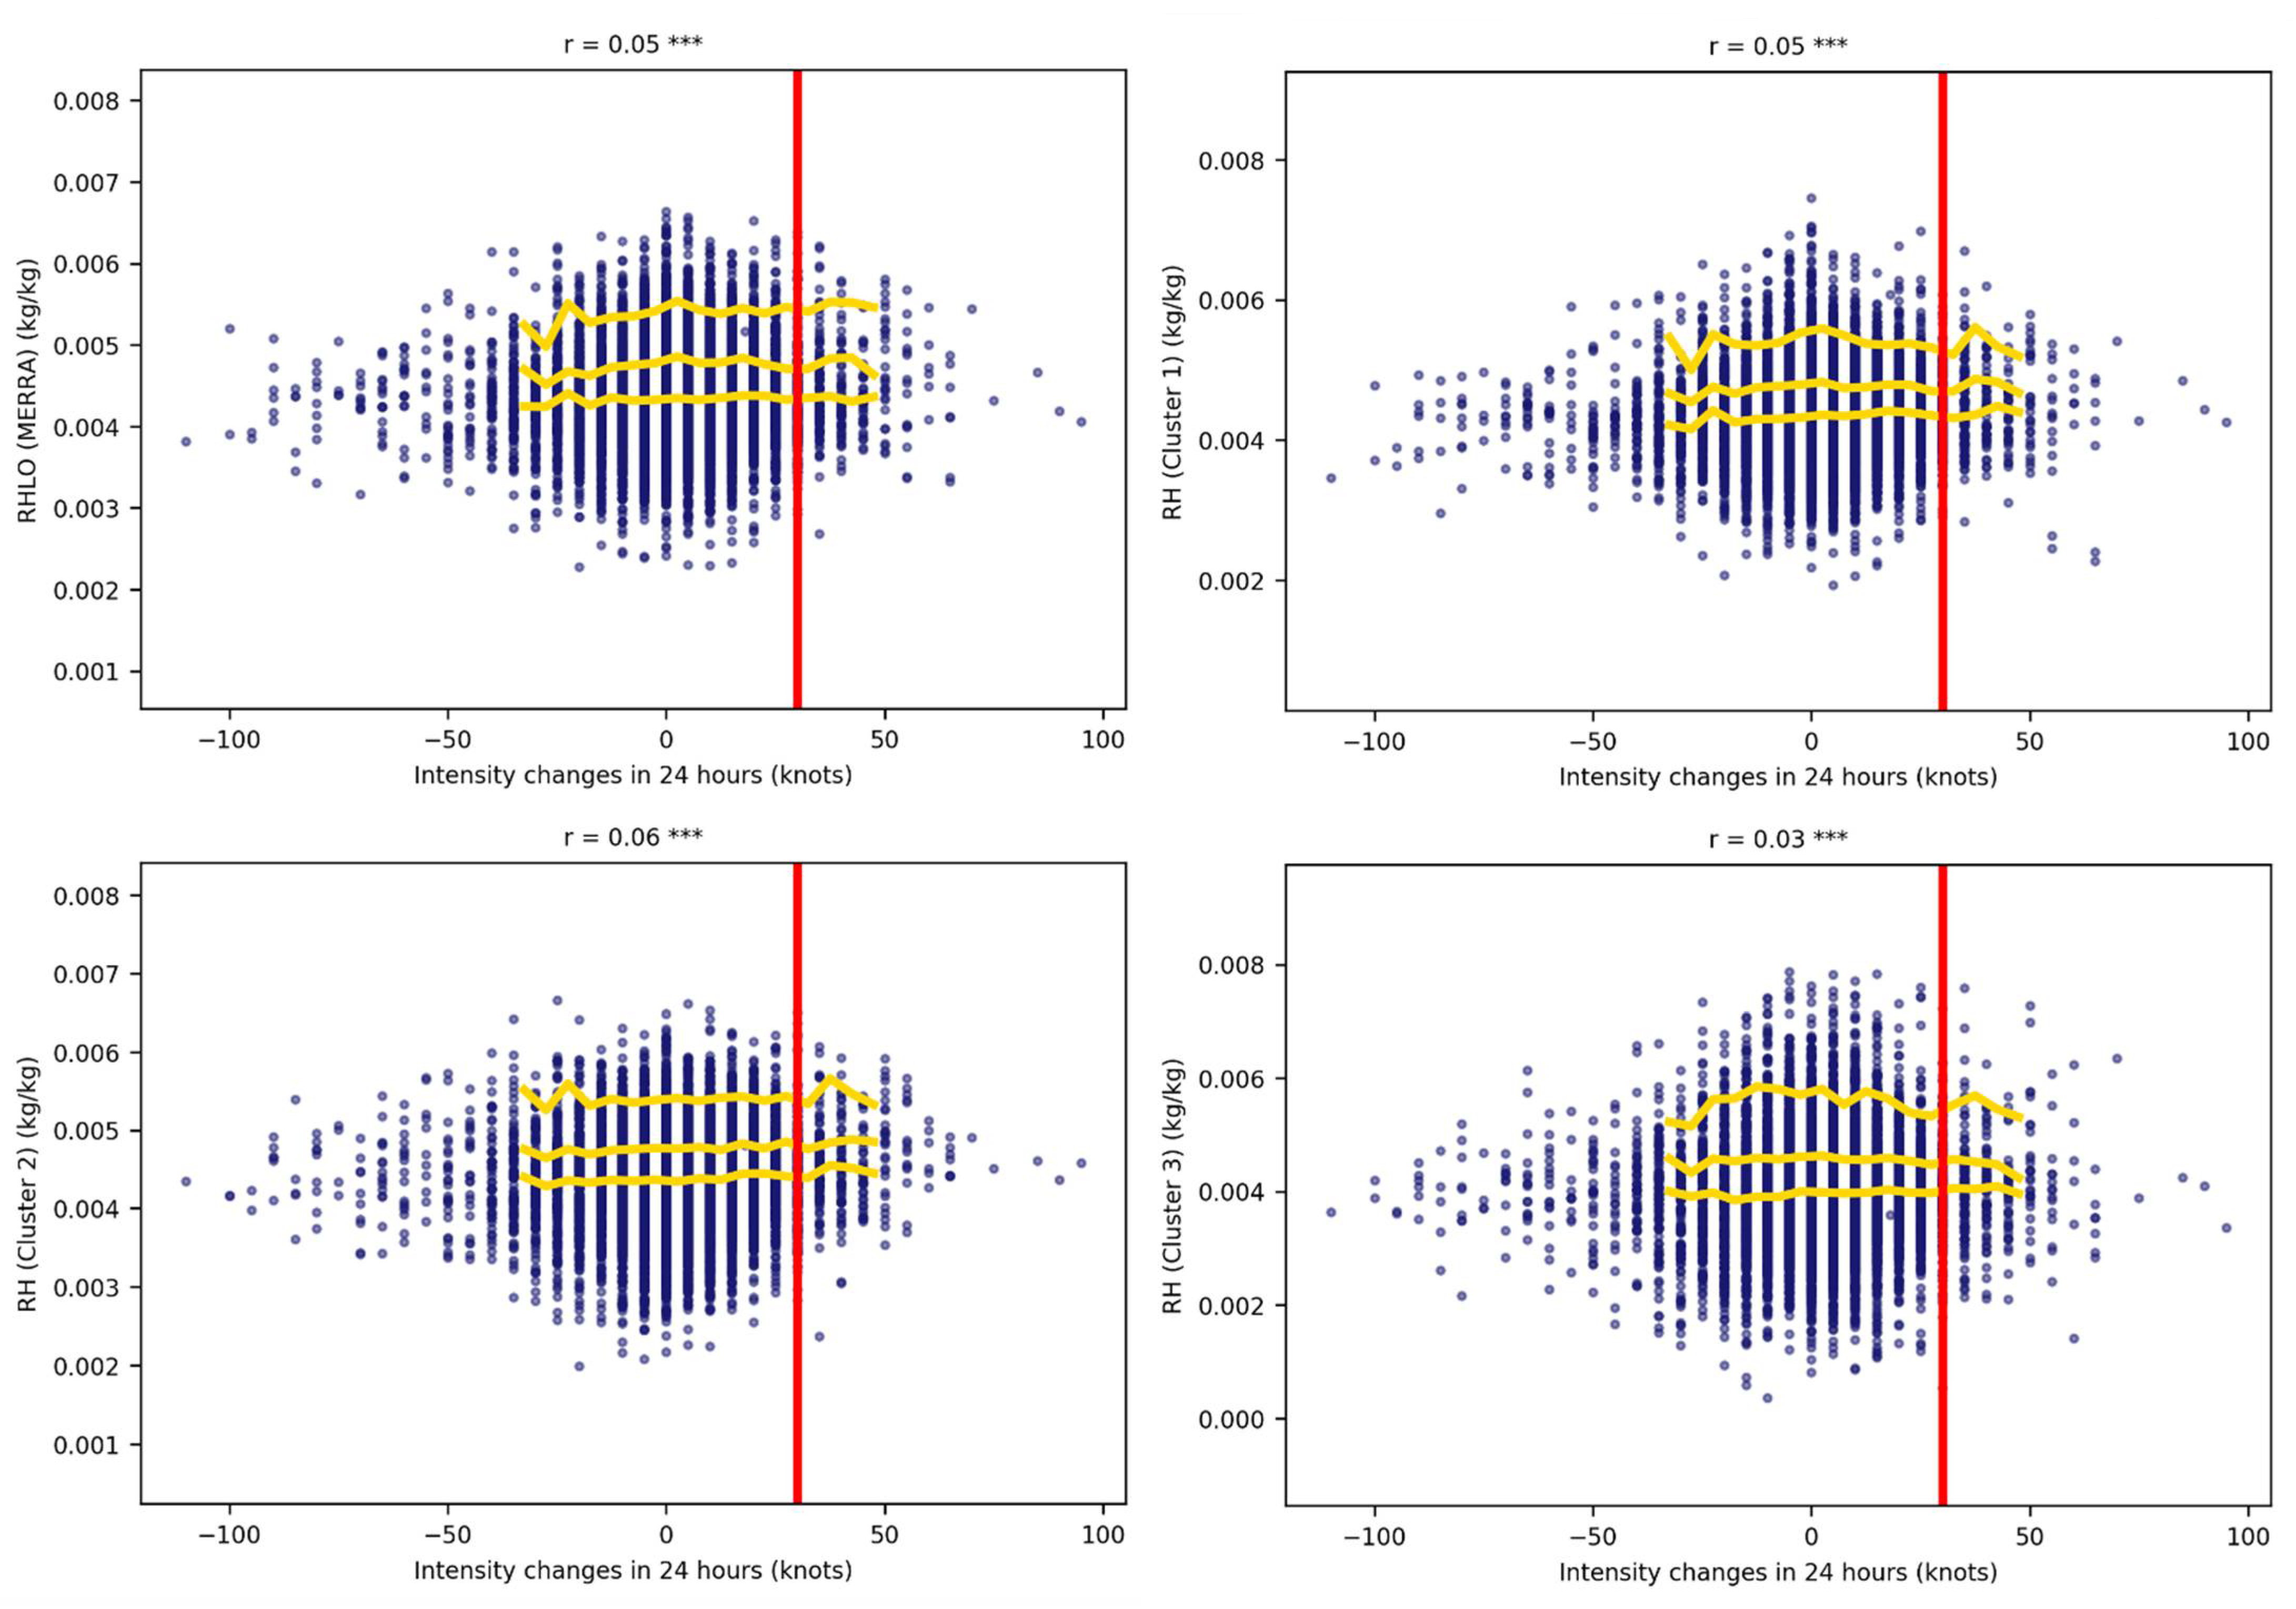
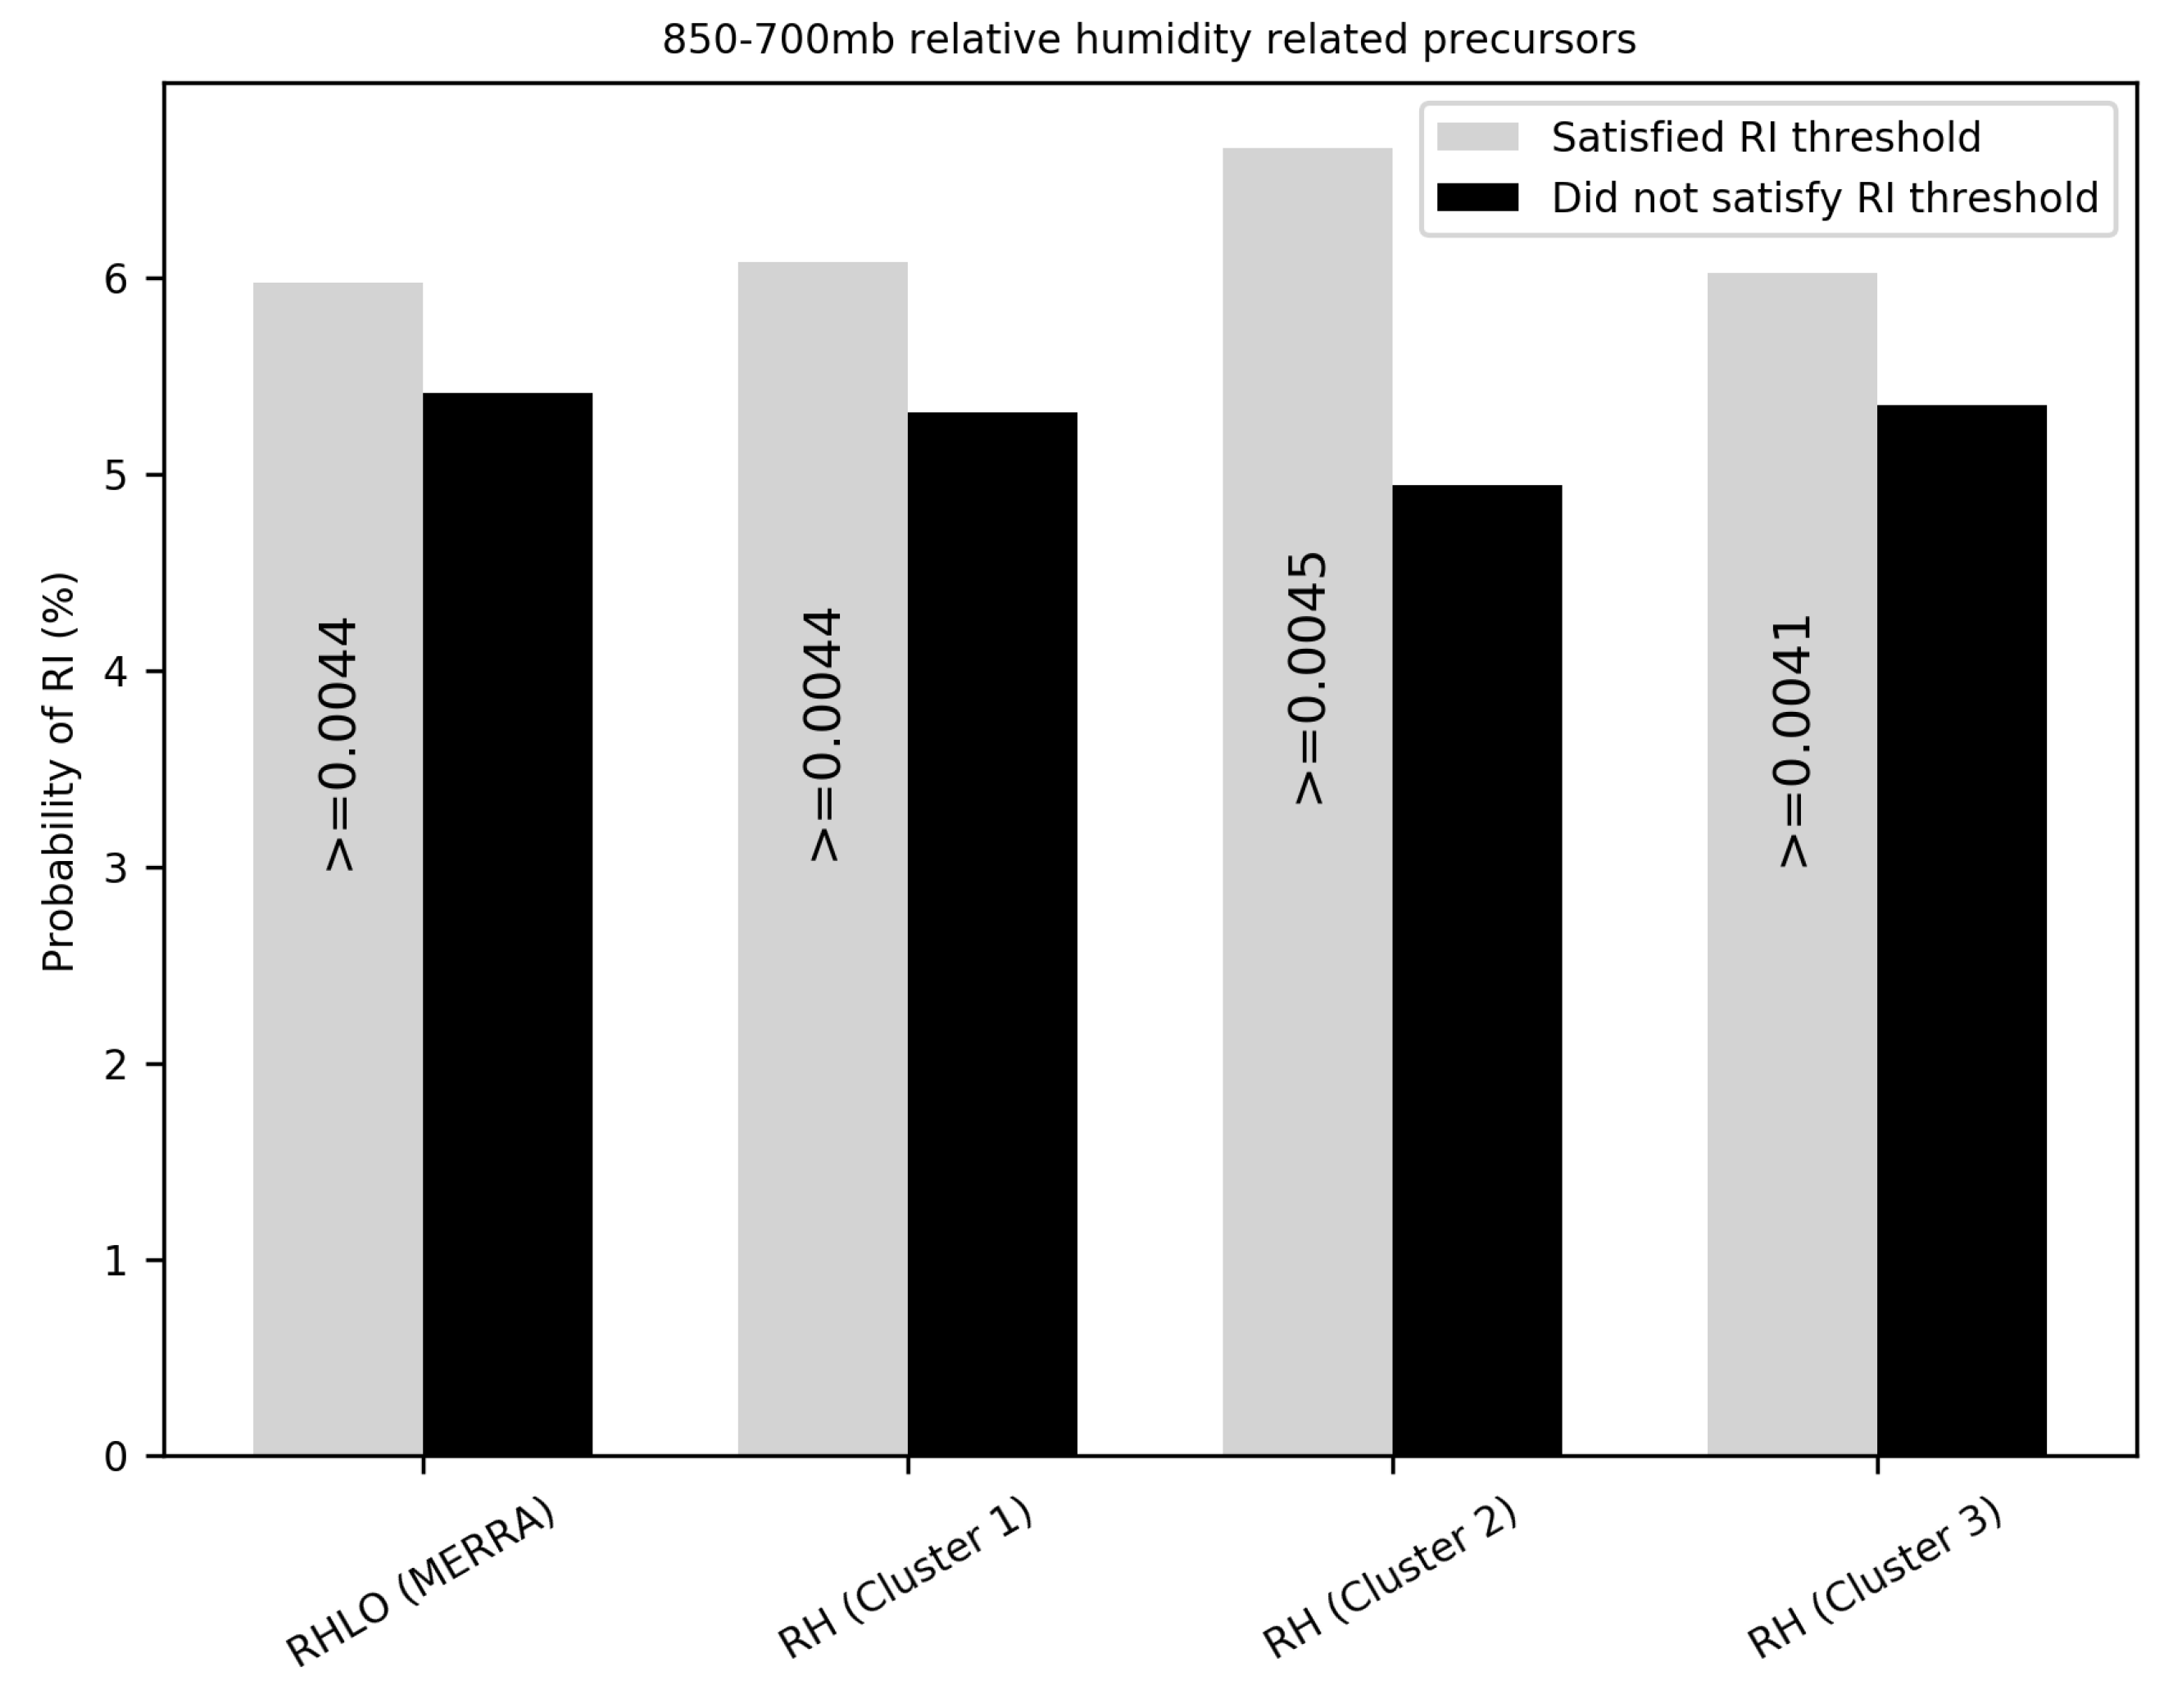
4.2. 850–700 hPa Relative Humidity

The RHLO predictor in the SHIPS database was derived from relative humidity between 850 hPa and 700 hPa, or specifically, the annular mean value between radii of 200 km and 800 km. Figure 7b represents the spatial distribution of RHLO. Similar to 200 hPa zonal wind, relative humidity environmental data around the tropical center were collected from RI groups as input for the SNN clustering operation. Three detected clusters are significantly distinct between RI and non-RI groups, with the p values of RH Cluster 1, RH Cluster 2 and RH Cluster 3 being 0.00, 0.00, and 0.028, respectively. The grid cells in each cluster have relatively similar behaviors. As shown in Figure 7, RH Cluster 1 is an area around the tropical center and RH Cluster 3 is a relatively small region in the southern direction of the cyclone center. RH Cluster 2 consists of grid cells in an annual area between ~500 km and ~1000 km.
As shown in Figure 7, the three clusters intersect with RHLO to some extent and all of them were compared to the RHLO predictor. The circular mean value of RH Cluster 1, RH Cluster 3, and RHLO, and the annular mean value of RH Cluster 2 were computed from environmental fields. The correlation between TC intensity changes in 24 h and values derived from the three clusters, as well as RHLO values from MERRA data, were examined separately. The degrees of correlation are 0.05, 0.06, 0.03, and 0.05 for RH Cluster 1, RH Cluster 2, RH Cluster 3 and RHLO (MERRA), respectively (Figure 8). Two precursors detected by our proposed workflow, RH Cluster 1 and RH Clusters 2, can explain the variance of TC intensity change as RHLO (MERRA).
The probability of RI ranges from ~6% to ~7% when the RI thresholds for 850–750 hPa relative humidity related predictors were met (Figure 9). In summary, the probability of RIs was higher when the threshold for RH Cluster 2 and RH Cluster 1 were satisfied. Two competitive precursors related to 850–700 hPa relative humidity were discovered. One of them represents the environment closer to the TC center than the RHLO, and the other expands the influencing areas to roughly 1000 km from the original 800 km RHLO definition in SHIPS.

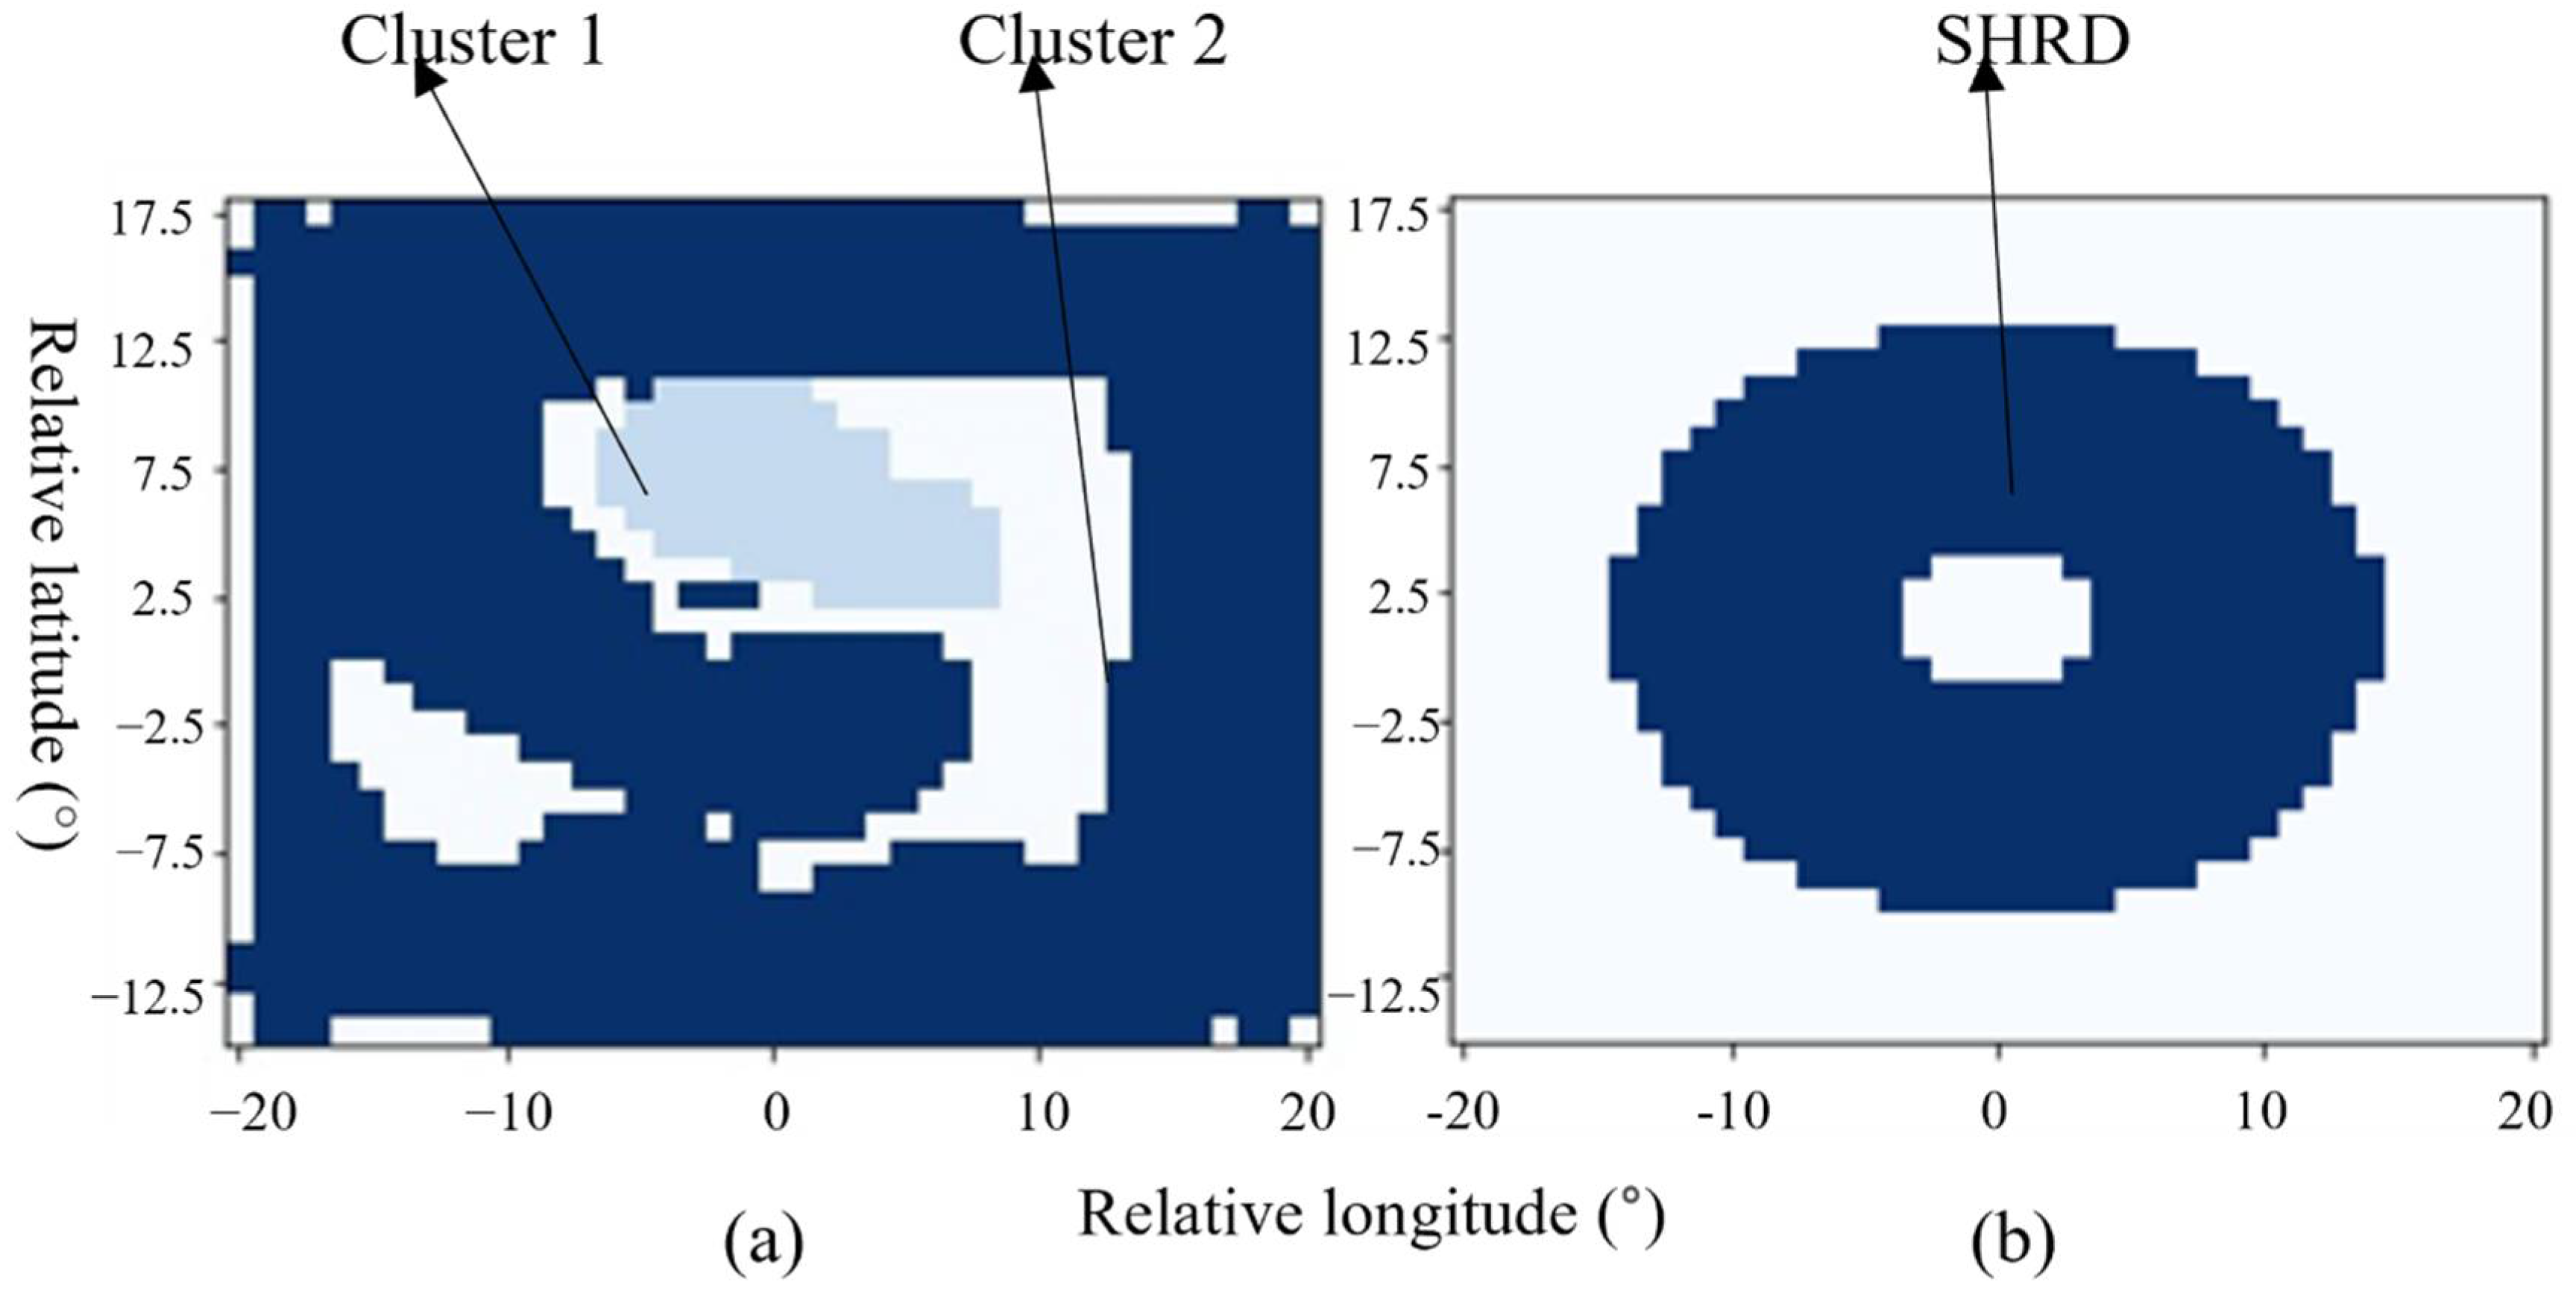
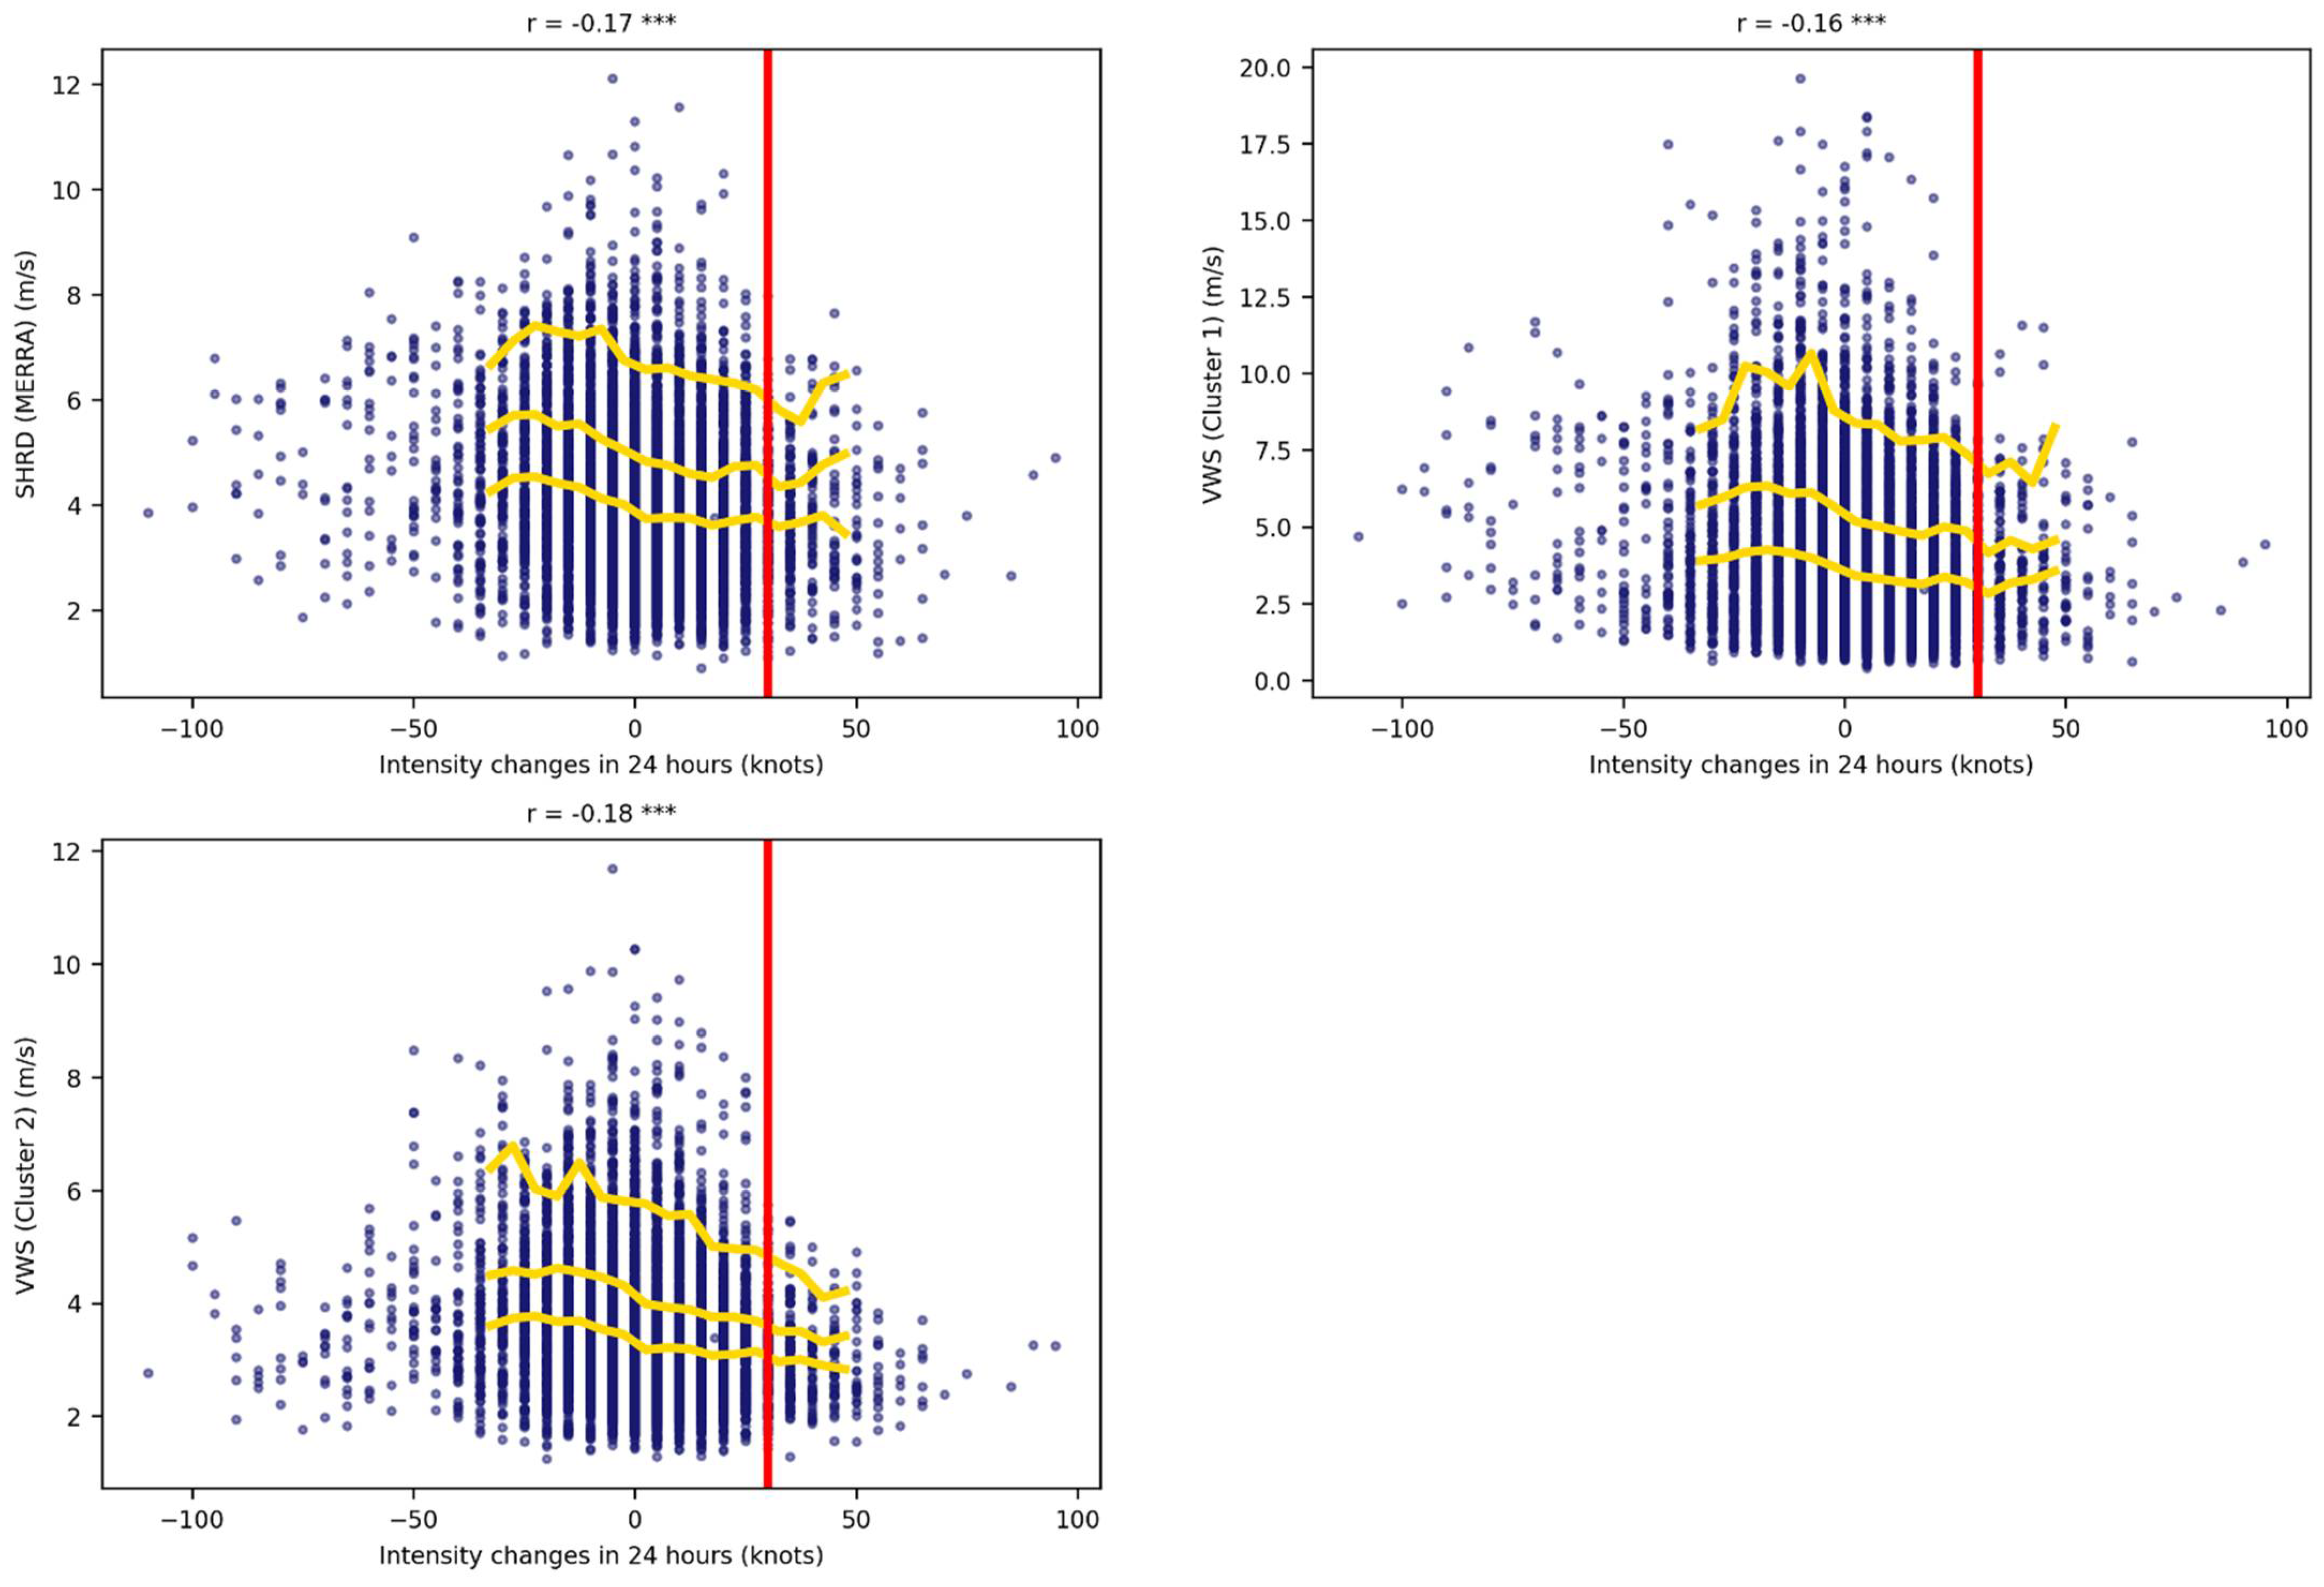
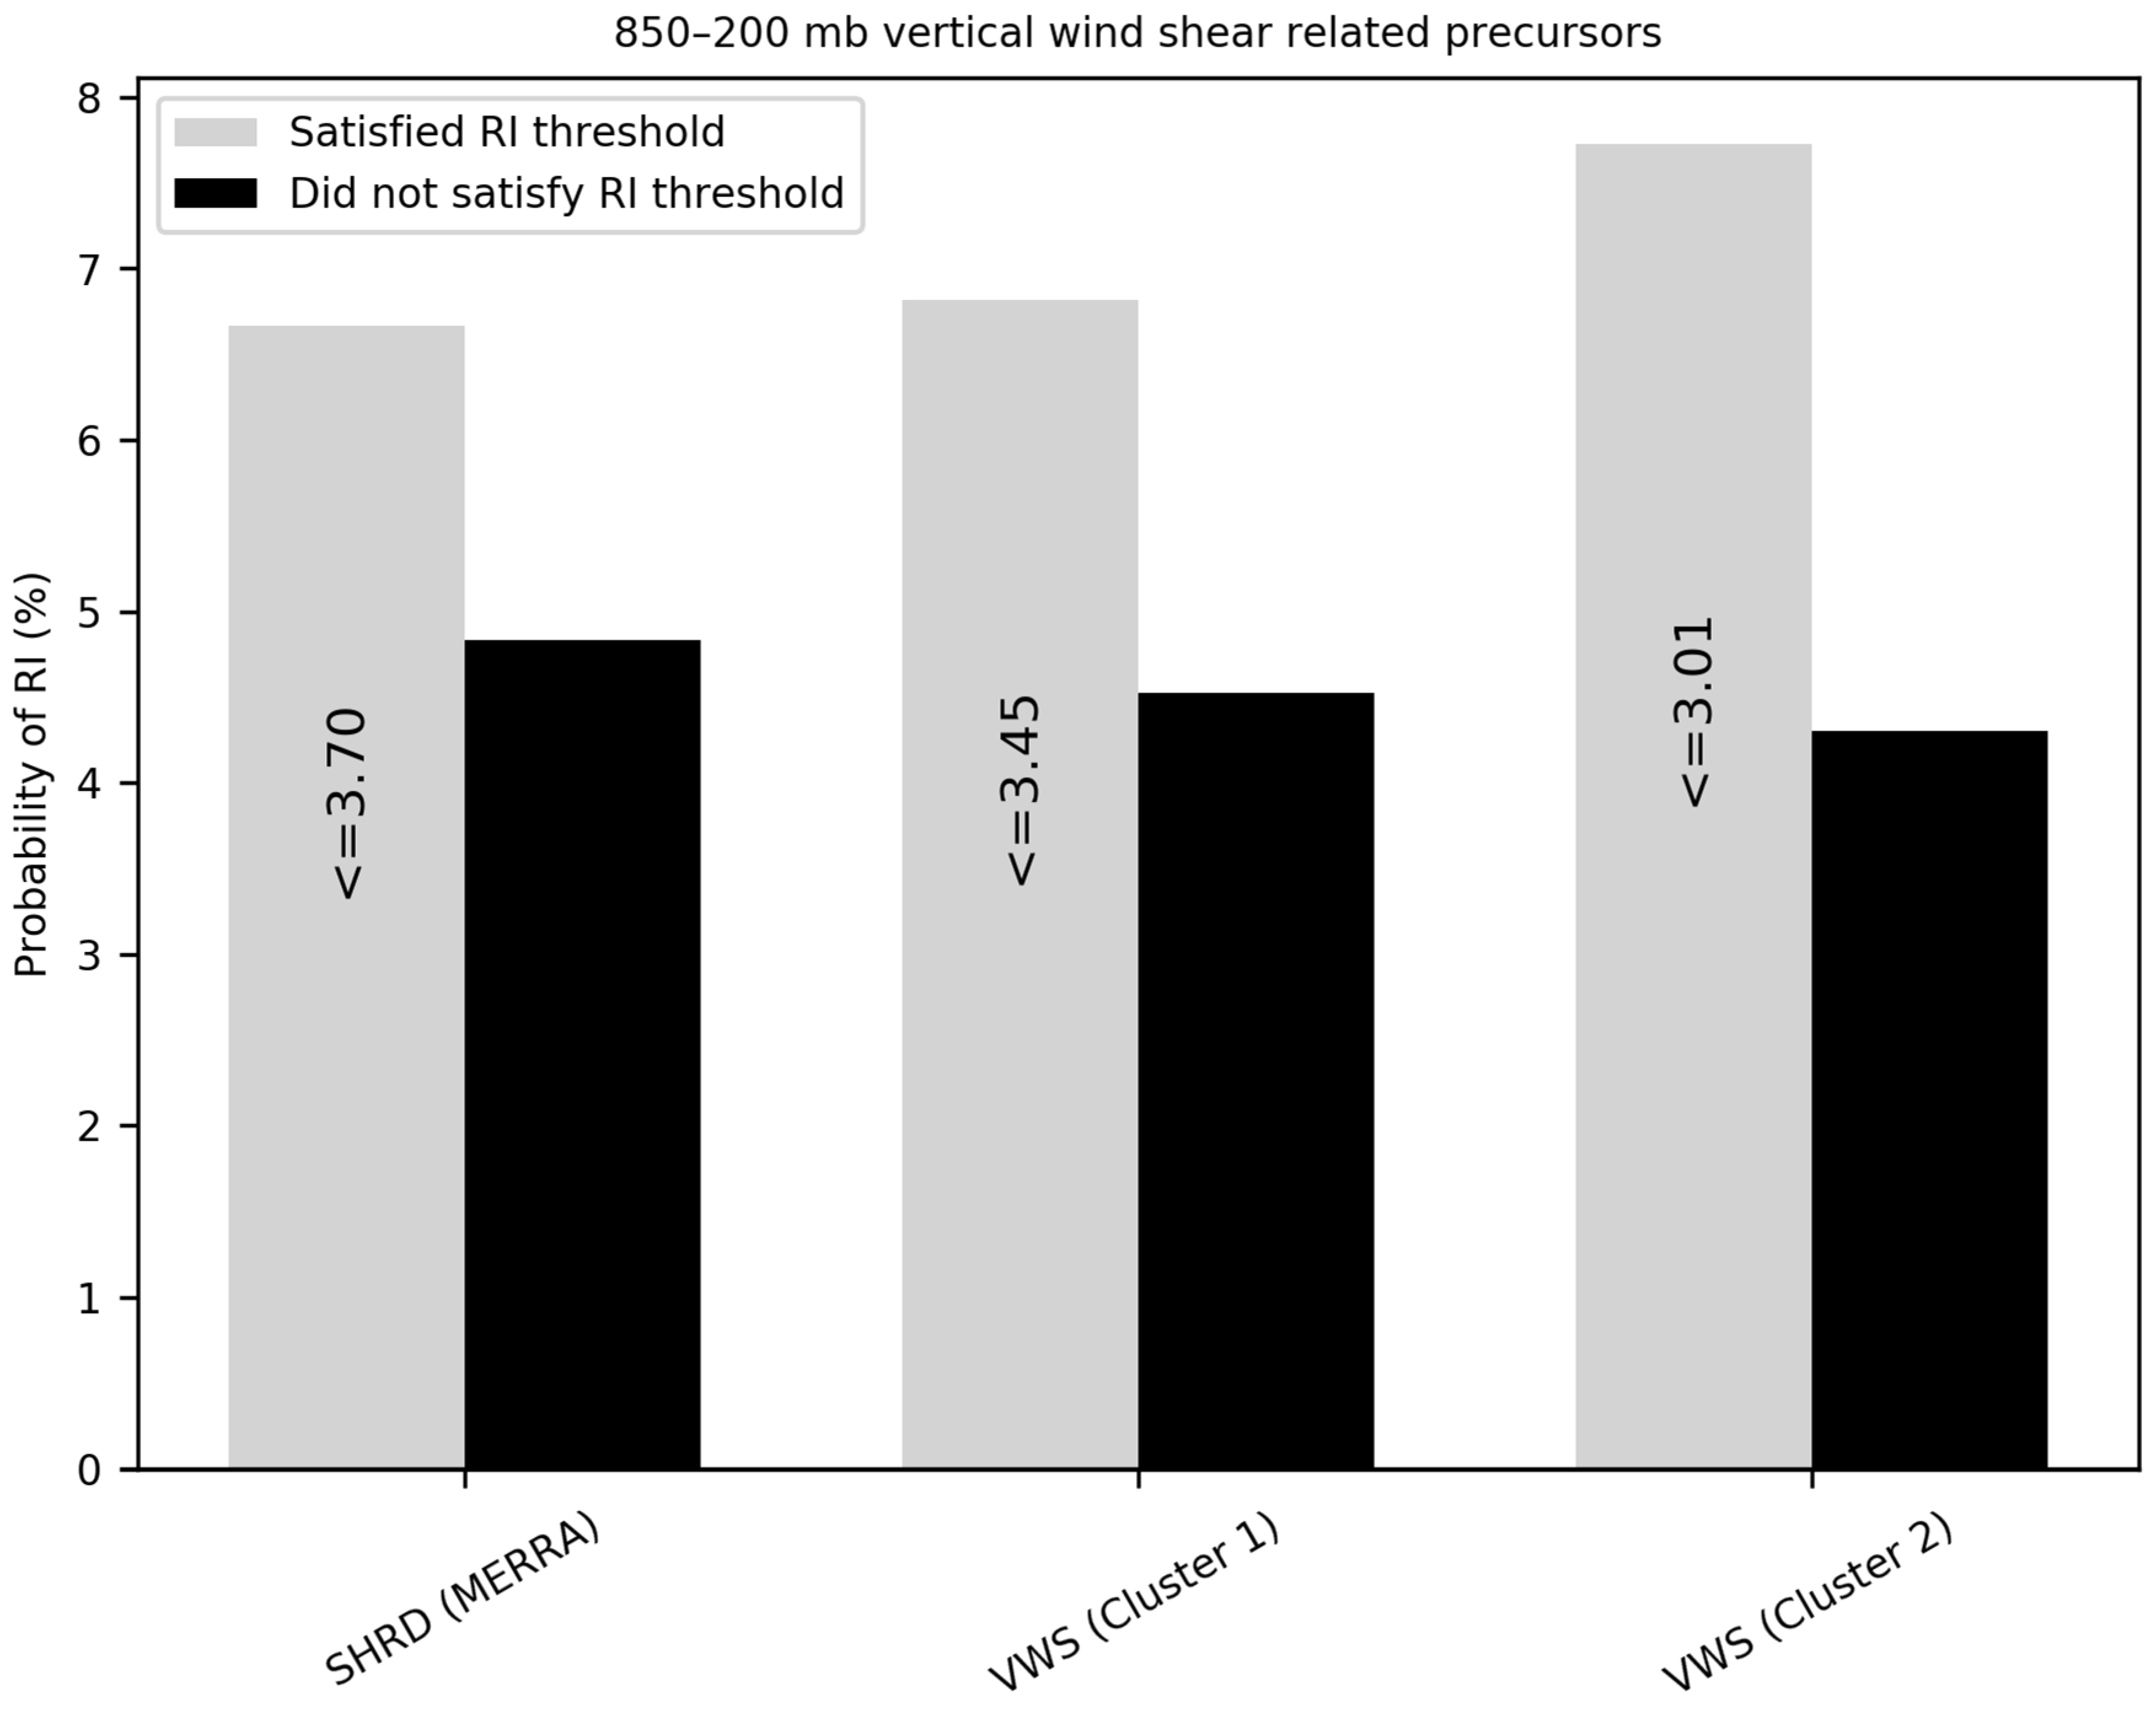
4.3. 850–200 hPa Vertical Wind Shear

Vertical wind shear between different pressure levels also plays an important role in intensity changes. The 850–250 hPa vertical wind shear is a commonly used measure. SHRD in the SHIPS database is the 200–800 km annular mean value of 850–200 hPa vertical wind shear. In this study, we also clustered grid cells in the vertical wind shear field between the two pressure level and found two clusters, as shown in Figure 10a. Similarly, we compared the location of the cluster centroids and SHRD, as well as comparing their correlations to TC intensity changes. As shown in Figure 11 and Figure 12, the correlation of VWS (Cluster 2) is compared to SHRD (MERRA), and the probability of RI is highest when the RI threshold for VWS (Cluster 2) is met, indicating that the proposed framework has found a potential new precursor related to vertical wind shear

5. Conclusions

This study investigated ways to automate the discovery of precursors to rapid intensification of tropical cyclones directly from 4-dimensional environmental data using spatiotemporal data mining techniques. Specifically, we propose an automatic knowledge-discovery framework including: (1) filtering environmental fields from reanalysis data and building two composites for RI and non-RI events; (2) utilizing the shared nearest neighbor based clustering algorithm to detect relatively homogenous regions of large-scale environmental fields around tropical cyclone centers; (3) determining precursor candidates from significantly different regions in RI and non-RI groups using a spatiotemporal statistical method. The mean values of these clusters delineate the behaviors of the detected regions and represent potential precursors to rapid intensification events if the correlations are comparable to existing predictors. The proposed knowledge discovery workflow was applied to separate circumstances involving 200 hPa zonal wind, 850–700 hPa relative humidity, and 850–200 hPa vertical shear. Compared to the corresponding predictors manually labeled, i.e., U200 and U20C, RHLO, and SHRD in the Statistical Hurricane Intensity Prediction Scheme, the discovered precursors have a comparable or better capability for estimating the probability of RI events. The proposed knowledge discovery framework could directly learn high level representations from raw high dimensional raster data, and the post cluster analysis enables the identification of potential new precursors to RI events from the high-level representations of raw data.
This study can be further improved in several directions. First, this research only focused on tropical cyclones in the Atlantic basin from 1982 to 2013, regardless of landfall. Future work could study tropical cyclones from other basins, e.g., the West Pacific, East Pacific, Central Pacific, and Indian Ocean. Second, limited environmental fields were analyzed in this study to prove the capability of the proposed knowledge discovery framework. Comprehensive analytics could be conducted using more meteorological fields (e.g., vorticity, wind speed, sea level pressure) and different time frames (e.g., 6 h, 12 h, 18 h, or 24 h before the rapid intensification event) to discover more precursors. Lastly, future work could include additional data from satellite and in situ observations, e.g., infrared, microwave, visible, and water vapor images captured by satellites. This knowledge discovery framework could also be applied to find favorable conditions in other spatiotemporal events, e.g., severe drought or heavy precipitation.

Author Contributions

Conceptualization, R.Y., C.Y. and Y.L.; methodology, Y.L.; software, Y.L.; validation, R.Y., C.Y. and H.S.; formal analysis, Y.L.; investigation, Y.L.; resources, Y.L.; data curation, Y.L.; writing—original draft preparation, Y.L.; writing—review and editing, H.S., R.Y. and C.Y.; visualization, Y.L.; supervision, C.Y.; project administration, C.Y.; funding acquisition, C.Y. All authors have read and agreed to the published version of the manuscript.

Funding

This research was funded by NSF (1841520, 1835507), NASA Center for Climate Simulation and NASA AIST.

Institutional Review Board Statement

Not applicable.

Informed Consent Statement

Not applicable.

Acknowledgments

H.S. conducted the work at the Jet Propulsion Laboratory, California Institute of Technology, under a contract with the National Aeronautics and Space Administration.

Conflicts of Interest

The authors declare no conflict of interest.

References

  1. Zhang, W.; Villarini, G.; Vecchi, G.A.; Smith, J.A. Urbanization exacerbated the rainfall and flooding caused by hurricane Harvey in Houston. Nature 2018, 563, 384–388. [Google Scholar] [CrossRef] [PubMed]
  2. Aberson, S.D. Five-Day Tropical Cyclone Track Forecasts in the North Atlantic Basin. Weather Forecast. 1998, 13, 1005–1015. [Google Scholar] [CrossRef]
  3. Aberson, S.D. The Ensemble of Tropical Cyclone Track Forecasting Models in the North Atlantic Basin (1976–2000). Bull. Am. Meteorol. Soc. 2001, 82, 1895–1904. [Google Scholar] [CrossRef] [Green Version]
  4. Kormahalleh, M.M.; Sefidmazgi, M.G.; Homaifar, A. A sparse recurrent neural network for trajectory prediction of Atlantic hurricanes. In Proceedings of the Genetic and Evolutionary Computation Conference, Denver, CO, USA, 20–24 July 2016; pp. 957–964. [Google Scholar]
  5. Ash, K.D.; Matyas, C.J. The influences of ENSO and the subtropical Indian Ocean Dipole on tropical cyclone trajectories in the southwestern Indian Ocean. Int. J. Clim. 2010, 32, 41–56. [Google Scholar] [CrossRef]
  6. DeMaria, M. A Simplified Dynamical System for Tropical Cyclone Intensity Prediction. Mon. Weather Rev. 2009, 137, 68–82. [Google Scholar] [CrossRef] [Green Version]
  7. DeMaria, M.; Sampson, C.R.; Knaff, J.A.; Musgrave, K.D. Is tropical cyclone intensity guidance improving? Bull. Am. Meteorol. Soc. 2014, 95, 387–398. [Google Scholar] [CrossRef] [Green Version]
  8. Emanuel, K. Tropical cyclones. Annu. Rev. Earth Planet. Sci. 2003, 31, 75–104. [Google Scholar] [CrossRef]
  9. Kaplan, J.; DeMaria, M.; Knaff, J. A Revised Tropical Cyclone Rapid Intensification Index for the Atlantic and Eastern North Pacific Basins. Weather Forecast. 2010, 25, 220–241. [Google Scholar] [CrossRef]
  10. Kaplan, J.; Rozoff, C.M.; Sampson, C.; Kossin, J.P.; Velden, C.S.; DeMaria, M.; Leighton, P. Improvements to the SHIPS Rapid Intensification Index: A Year-2 JHT Mid-term Report; University of Wisconsin-Madison: Madison, WI, USA, 2013. [Google Scholar]
  11. Kaplan, J.; Rozoff, C.M.; DeMaria, M.; Sampson, C.R.; Kossin, J.; Velden, C.S.; Cione, J.J.; Dunion, J.P.; Knaff, J.; Zhang, J.; et al. Evaluating Environmental Impacts on Tropical Cyclone Rapid Intensification Predictability Utilizing Statistical Models. Weather. Forecast. 2015, 30, 1374–1396. [Google Scholar] [CrossRef]
  12. Rozoff, C.M.; Kossin, J.P. New probabilistic forecast models for the prediction of tropical cyclone rapid intensification. Weather. Forecast. 2011, 26, 677–689. [Google Scholar] [CrossRef]
  13. Holliday, C.R.; Thompson, A.H. Climatological Characteristics of Rapidly Intensifying Typhoons. Mon. Weather Rev. 1979, 107, 1022–1034. [Google Scholar] [CrossRef]
  14. Grimes, A.; Mercer, A.E. Synoptic-Scale Precursors to Tropical Cyclone Rapid Intensification in the Atlantic Basin. Adv. Meteorol. 2015, 2015, 814043. [Google Scholar] [CrossRef] [Green Version]
  15. Elsberry, R.L.; Lambert, T.D.B.; Boothe, M.A. Accuracy of Atlantic and Eastern North Pacific Tropical Cyclone Intensity Forecast Guidance. Weather Forecast. 2007, 22, 747–762. [Google Scholar] [CrossRef]
  16. Montgomery, M.T.; Bell, M.M.; Aberson, S.D.; Black, M.L. Hurricane Isabel (2003): New insights into the physics of intense storms. Part I: Mean vortex structure and maximum intensity estimates. Bull. Am. Meteorol. Soc. 2006, 87, 1335–1347. [Google Scholar] [CrossRef] [Green Version]
  17. Bosart, L.F.; Velden, C.S.; Bracken, W.E.; Molinari, J.; Black, P.G. Environmental Influences on the Rapid Intensification of Hurricane Opal (1995) over the Gulf of Mexico. Mon. Weather Rev. 2000, 128, 322. [Google Scholar] [CrossRef]
  18. Yang, R.; Tang, J.; Kafatos, M. Improved associated conditions in rapid intensifications of tropical cyclones. Geophys. Res. Lett. 2007, 34. [Google Scholar] [CrossRef] [Green Version]
  19. Wang, Y.; Rao, Y.; Tan, Z.-M.; Schönemann, D. A Statistical Analysis of the Effects of Vertical Wind Shear on Tropical Cyclone Intensity Change over the Western North Pacific. Mon. Weather Rev. 2015, 143, 3434–3453. [Google Scholar] [CrossRef]
  20. Su, H.; Wu, L.; Zhai, C.; Jiang, J.H.; Neelin, J.D.; Yung, Y.L. Observed Tightening of Tropical Ascent in Recent Decades and Linkage to Regional Precipitation Changes. Geophys. Res. Lett. 2020, 47, e2019GL085809. [Google Scholar] [CrossRef] [Green Version]
  21. DeMaria, M.; Kaplan, J. A Statistical Hurricane Intensity Prediction Scheme (SHIPS) for the Atlantic Basin. Weather Forecast. 1994, 9, 209–220. [Google Scholar] [CrossRef]
  22. Yang, R.; Tang, J.; Sun, D. Association Rule Data Mining Applications for Atlantic Tropical Cyclone Intensity Changes. Weather Forecast. 2011, 26, 337–353. [Google Scholar] [CrossRef]
  23. Rew, R.; Davis, G. NetCDF: An interface for scientific data access. IEEE Comput. Graph. Appl. 1990, 10, 76–82. [Google Scholar] [CrossRef]
  24. Stonebraker, M.; Becla, J.; DeWitt, D.J.; Lim, K.T.; Maier, D.; Ratzesberger, O.; Zdonik, S.B. Requirements for Science Data Bases and SciDB. In Proceedings of the CIDR 2009 Fourth Biennial Conference on Innovative Data Systems Research, Asilomar, CA, USA, 4–7 January 2009. [Google Scholar]
  25. Kurihara, Y.; Bender, M.A.; Ross, R.J. An Initialization Scheme of Hurricane Models by Vortex Specification. Mon. Weather Rev. 1993, 121, 2030–2045. [Google Scholar] [CrossRef] [Green Version]
  26. Faber, V. Clustering and the continuous k-means algorithm. Los Alamos Sci. 1994, 22, 67. [Google Scholar]
  27. Schubert, E.; Sander, J.; Ester, M.; Kriegel, H.P.; Xu, X. DBSCAN revisited, revisited: Why and how you should (still) use DBSCAN. ACM Trans. Database Syst. 2017, 42, 1–21. [Google Scholar] [CrossRef]
  28. Indyk, P.; Motwani, R. Approximate Nearest Neighbors: Towards Removing the Curse of Dimensionality. In Proceedings of the Thirtieth Annual ACM Symposium on Theory of Computing, Dallas, TX, USA, 24–26 May 1998. [Google Scholar]
  29. Kumari, S.; Maurya, S.; Goyal, P.; Balasubramaniam, S.S.; Goyal, N. Scalable Parallel Algorithms for Shared Nearest Neighbor Clustering in High Performance Computing (HiPC). In Proceedings of the 2016 IEEE 23rd International Conference on High Performance Computing (HiPC), Hyderabad, India, 19–22 December 2016. [Google Scholar]
  30. Ertöz, L.; Steinbach, M.; Kumar, V. Finding Clusters of Different Sizes, Shapes, and Densities in Noisy, High Dimensional Data. In Proceedings of the 2003 SIAM International Conference on Data Mining, San Francisco, CA, USA, 1–3 May 2003. [Google Scholar]
  31. Ertoz, L.; Steinbach, M.; Kumar, V. A New Shared Nearest Neighbor Clustering Algorithm and Its Applications. In Proceedings of the Workshop on Clustering High Dimensional Data and Its Applications at 2nd SIAM International Conference on Data Mining, Arlington, VA, USA, 13 April 2002. [Google Scholar]
  32. Wilks, D.S. Statistical Methods in the Atmospheric Sciences: An Introduction; Academic Press: Cambridge, MA, USA, 1995. [Google Scholar]
Figure 1. An example of collocation MERRA2 dataset with one tropical cyclone instance.
Atmosphere 13 00882 g001
Figure 2. The total wind field (a) and environmental wind field (b) at 850 hPa for hurricane ALLI at 0600UTC, 3 July 1994.
Atmosphere 13 00882 g002
Figure 3. The workflow of discovery of precursors to tropical cyclone rapid intensification.
Atmosphere 13 00882 g003
Figure 4. (a) Two SNN clusters of 200 hPa zonal wind that are significantly different in RI and non-RI groups; (b) U200 in SHIPS database; and (c) U20C in SHIPS database.
Atmosphere 13 00882 g004
Figure 5. Scatter diagrams of the 24-h TC intensity change versus U200 (MERRA), U20C (MERRA), Z200 (Cluster 1), and Z200 (Cluster 2). The red vertical line in each panel shows the boundary of rapid intensification, and the yellow curves show the 95th, 75th, and 50th percentiles in each intensity change bin. Notes: *** p < 0.01.
Atmosphere 13 00882 g005
Figure 6. The probability of RI when the 200 hPa wind related precursors were satisfied for the RI and non-RI samples. The RI thresholds for each of the predictors are also presented in m/s.
Atmosphere 13 00882 g006
Figure 7. (a) Three SNN clusters of 850–700 hPa relative humidity that are significantly different in RI and non-RI groups, and (b) RHLO in SHIPS database.
Atmosphere 13 00882 g007
Figure 8. Scatter diagrams of 24-h TC intensity change versus RHLO (MERRA), RH (Cluster 1), RH (Cluster 2) and RH (Cluster 3). The red vertical line in each panel shows the boundary of rapid intensification, and the yellow curves show 95th, 75th, and 50th percentiles in each intensity change bin. Notes: *** p < 0.01.
Atmosphere 13 00882 g008
Figure 9. The probability of RI when the 850–700 hPa relative humidity related precursors were satisfied for the RI and non-RI samples. The RI thresholds for each of the predictors are also presented in kg/kg.
Atmosphere 13 00882 g009
Figure 10. (a) Two SNN clusters of 850–200 hPa vertical shear that are significantly different in RI and non-RI groups, and (b) SHRD in SHIPS database.
Atmosphere 13 00882 g010
Figure 11. Scatter diagrams of 24-h TC intensity change versus SHRD (MERRA), SHRD (Cluster 1) and SHRD (Cluster 2). The red vertical line in each panel shows the boundary of rapid intensification, and the yellow curves show 95th, 75th, and 50th percentiles in each intensity change bin. Notes: *** p < 0.01.
Atmosphere 13 00882 g011
Figure 12. The probability of RI when the 850–200 hPa vertical wind shear related precursors were satisfied for the RI and non-RI samples. The RI thresholds for each of the predictors are also presented in m/s.
Atmosphere 13 00882 g012
Table 1. Selected predictors in the SHIPS database.
Predictor NameDescription
LATStorm latitude
LONStorm longitude
VMAXMax sustained surface wind
U200200 hPa zonal wind (r = 200–800 km)
U20CAs for U200, but for (r = 0–500 km)
SHRD850–200 hPa sheer magnitude (10 kt) vs. time (200–800 km)
RHLO850–700 hPa relative humidity vs. time (200–800 km)
Table 2. Spatial, temporal, and intensity information of Hurricane ALBE which occurred in June 1982.
No.NameYearMonthDateTimeLATLONRI
1ALBE19826212217871Yes
2ALBE19826218222865Yes
3ALBE1982630226858Yes
4ALBE1982636228850No
Table 3. Selected meteorological variables in a MERRA2 dataset.
Short NameSpatial ResolutionTemporal ResolutionLevelVariable
M2I6NVANA0.5° × 0.625°6 h72QV (specific humidity)
U (eastward wind component)
V (northward wind component)
Publisher’s Note: MDPI stays neutral with regard to jurisdictional claims in published maps and institutional affiliations.

