Article

Temporal Variation of NO2 and HCHO Vertical Profiles Derived from MAX-DOAS Observation in Summer at a Rural Site of the North China Plain and Ozone Production in Relation to HCHO/NO2 Ratio

1
State Key Laboratory of Severe Weather & CMA Key Laboratory of Atmospheric Chemistry, Chinese Academy of Meteorological Sciences, Beijing 100081, China
2
State Key Laboratory of Applied Optics, Changchun Institute of Optics, Fine Mechanics and Physics, Chinese Academy of Sciences, Changchun 130033, China
3
CMA Meteorological Observation Centre, Beijing 100081, China
*
Author to whom correspondence should be addressed.
Atmosphere 2022, 13(6), 860; https://doi.org/10.3390/atmos13060860
Submission received: 25 April 2022 / Revised: 18 May 2022 / Accepted: 23 May 2022 / Published: 25 May 2022
(This article belongs to the Special Issue Remote Sensing and Multiple Observations of Air Quality in China)

Abstract

:
We performed a comprehensive and intensive field experiment including ground-based multi-axis differential optical absorption spectroscopy (MAX-DOAS) measurement at Raoyang (115°44′ E, 38°14′ N; 20 m altitude) in summer (13 June–20 August) 2014. The NO2 and HCHO profiles retrieved by MAX-DOAS take on different vertical distribution shapes, with the former declining with the increasing altitude and the latter having an elevated layer. The average levels of vertical column densities (VCDs) and near-surface volume mixing ratios (VMRs) were 1.02 ± 0.51 × 10¹⁶ molec·cm−2 and 3.23 ± 2.70 ppb for NO2 and 2.32 ± 0.56 × 10¹⁶ molec·cm−2 and 5.62 ± 2.11 ppb for HCHO, respectively. The NO2 and HCHO levels are closely connected with meteorological conditions, with the larger NO2 VCDs being associated with lower temperature, higher relative humidity (RH) and lower planetary boundary layer height (PBLH). With respect to the diurnal variations of vertical distribution, the NO2 in the residual layer gradually disappeared from 1.2 km height to the surface during the period of 7:00–11:00 Beijing time (BJ), and the near-surface NO2 had larger VMRs in the early morning and evening than in the later morning and afternoon. An elevated HCHO layer was observed to occur persistently with the lifted layer height rising from ~0.5 km to ~1.0 km before 10:00 BJ; the near-surface HCHO VMRs gradually increased and peaked around 10:00 BJ. The ratios of HCHO to NO2 (RHCHO-NO2) were generally larger than two in the boundary layer from 11:00 BJ until 19:00 BJ, the time period when ozone photochemistry was most active. Thus, ozone (O3) production was mainly in the NOx-limited regime during the observation campaign, which was closely related to relatively high temperatures and low RH. The O3 production regimes also changed with the wind’s direction. These results are significant to reveal the formation mechanism of O3 pollution and develop strategies for controlling the O3 photochemical pollution over the North China Plain.

1. Introduction

Nitrogen dioxide (NO2) and formaldehyde (HCHO) are not only important air pollutants in the troposphere, but also crucial precursors of ozone which play a key role in atmospheric chemistry [1,2,3,4,5]. Atmospheric NO2, a kind of nitrogen oxide (NOx), is generated by human activity (mainly fossil fuel combustion and biomass combustion) and natural processes (such as microbial processes and lightning) [6,7,8]. HCHO comes not only from primary sources, such as the emissions of biomass combustion, transportation and industry, but also secondary sources, i.e., photochemical production, by the way of the oxidation of volatile organic compounds (VOCs) [9]. Therefore, NO2 and HCHO are usually used as the markers of NOx and VOCs, respectively [10]. The investigations of NO2 and HCHO vertical distribution as well as their ratios are beneficial to reveal the spatial-temporal evolution of ozone-NOx-VOC sensitivity and formulate a reasonable ozone (O3) pollution control strategy [11,12].
The North China Plain (NCP) is one of the high-risk areas of O3 pollution, and O3 spatiotemporal heterogeneity is impacted by complex factors such as the photochemical process [13]. The limited vertical observations of NO2 and HCHO restrict the comprehensive understanding of the O3 pollution mechanism and long-term trend [14]. Ground-based multi-axis differential optical absorption spectroscopy (MAX-DOAS) has been widely used as a stereoscopic monitoring method to obtain NO2 and HCHO profiles [15]. For example, the MAX-DOAS observation at a rural site in the central-western NCP found lifted layers for both NO2 and HCHO with the 20–30% contribution of regional transport and the influence of agricultural burning on HCHO variation in May and June 2016 [16]. The ratios of HCHO to NO2 concentrations retrieved from (MAX-)DOAS measurement are usually applied to analyze the ozone-NOx-VOC sensitivity in different regions of China [17,18,19,20,21]. This research has shown that there are significant spatial and temporal variations for O3 photochemical production regimes. In addition, the studies by the observation-based box model suggest that in situ O3 photochemical formation varies in different controlled regimes at two rural NCP sites due to the polluted plume transport and biogenic emissions [22,23]. Moreover, the research at another NCP site indicates the regimes of O3 production changing with height and pollution conditions because of different levels of O3 precursors [24]. Despite the above studies, our knowledge of the vertical distribution of temporal evolutions of NO2 and HCHO and their influence on O3 production is still insufficient for us to understand the formation mechanism of O3 pollution and develop strategies for controlling the O3 pollution in the NCP rural area.
In this study, we present NO2 and HCHO vertical distributions retrieved from ground-based MAX-DOAS observation during a campaign in summer 2014 at a rural site of the NCP. Section 2 introduces the site, measurement instruments, methods of spectral analysis and vertical profile retrieval of NO2 and HCHO, as well as ancillary datasets. Section 3 shows the overall characteristics and diurnal variations of vertical profiles of NO2, HCHO and HCHO/NO2 ratio, as well as the relationship between HCHO/NO2 ratio and O3 production. Finally, discussion and conclusions are given in Section 4 and Section 5, respectively.

2. Experiments and Methods

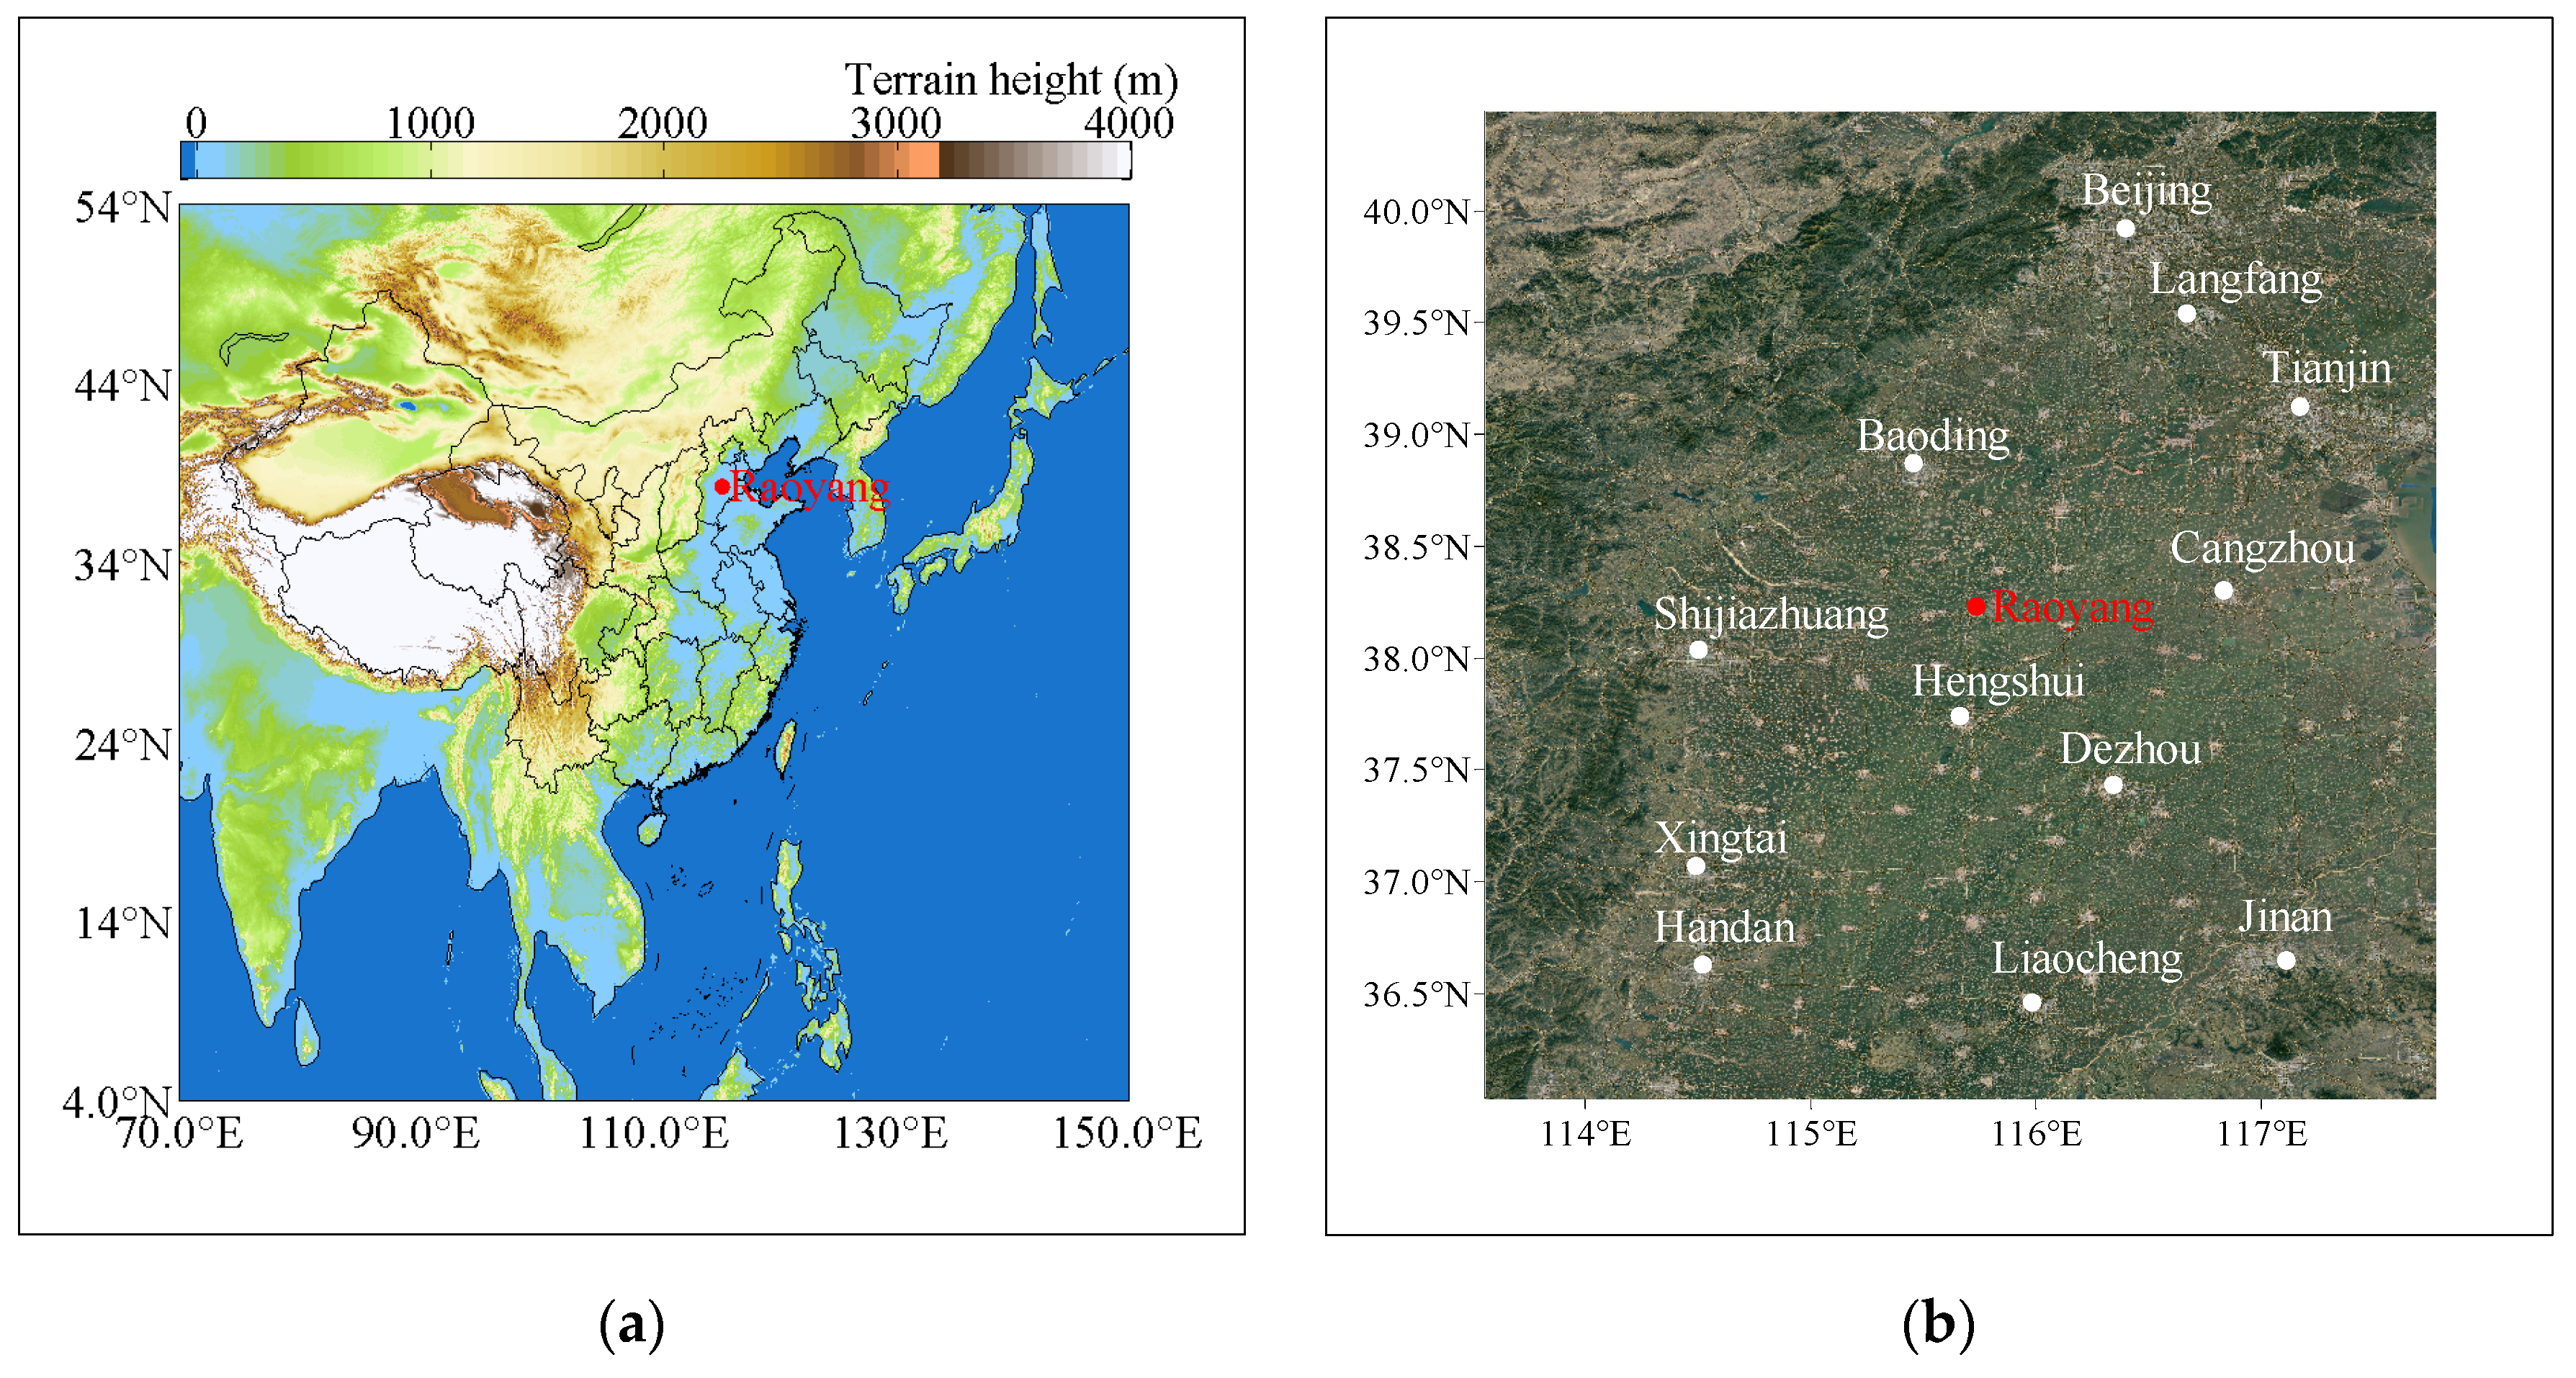
2.1. Site and Instrument

As an NCP rural site, Raoyang meteorological station (115°44′ E, 38°14′ N; 20 m above sea level) is located in the middle of Hebei Province, China (Figure 1a). There are no large local industrial emission sources. Agriculture is the main industry in Raoyang County. The Yanshan and Taihang Mountains are distributed in the north and west of Raoyang, respectively. A cluster of industrial and populated cites surrounding Raoyang observatory are approximately 50–200 km away (Figure 1b) [25]. More details of geographical conditions and atmospheric environment concerning Raoyang station can be found in previous studies [26,27,28,29].
The Mini MAX-DOAS system was set up on the roof of three-story building at Raoyang. It operated automatically from 13 June to 20 August 2014. The compact instrument, made by Hoffmann Messtechnik GmbH in Germany, collected scattered light via a telescope which was coupled to a fiber and transferred to a spectrograph. The spectrograph operated at the temperature of 5 ℃, covering the wavelength range of 292–447 nm. A stepper motor drove the instrument to achieve the measurement at different elevation angles with the same southeastern azimuth. The instrument recorded the scattered solar spectra at 11 elevation angles (1°, 2°, 3°, 4°, 5°, 6°, 8°, 10°, 15°, 30° and 90°). The integration time of each individual spectrum was ∼0.5 min. We performed spectral correction with the spectra of dark current and electronic offset as well as wavelength calibration before spectral fitting. A computer with professional software was used for operational control and data collection. More descriptions about the Mini MAX-DOAS instrument are available in our previous work [25,30,31,32,33].

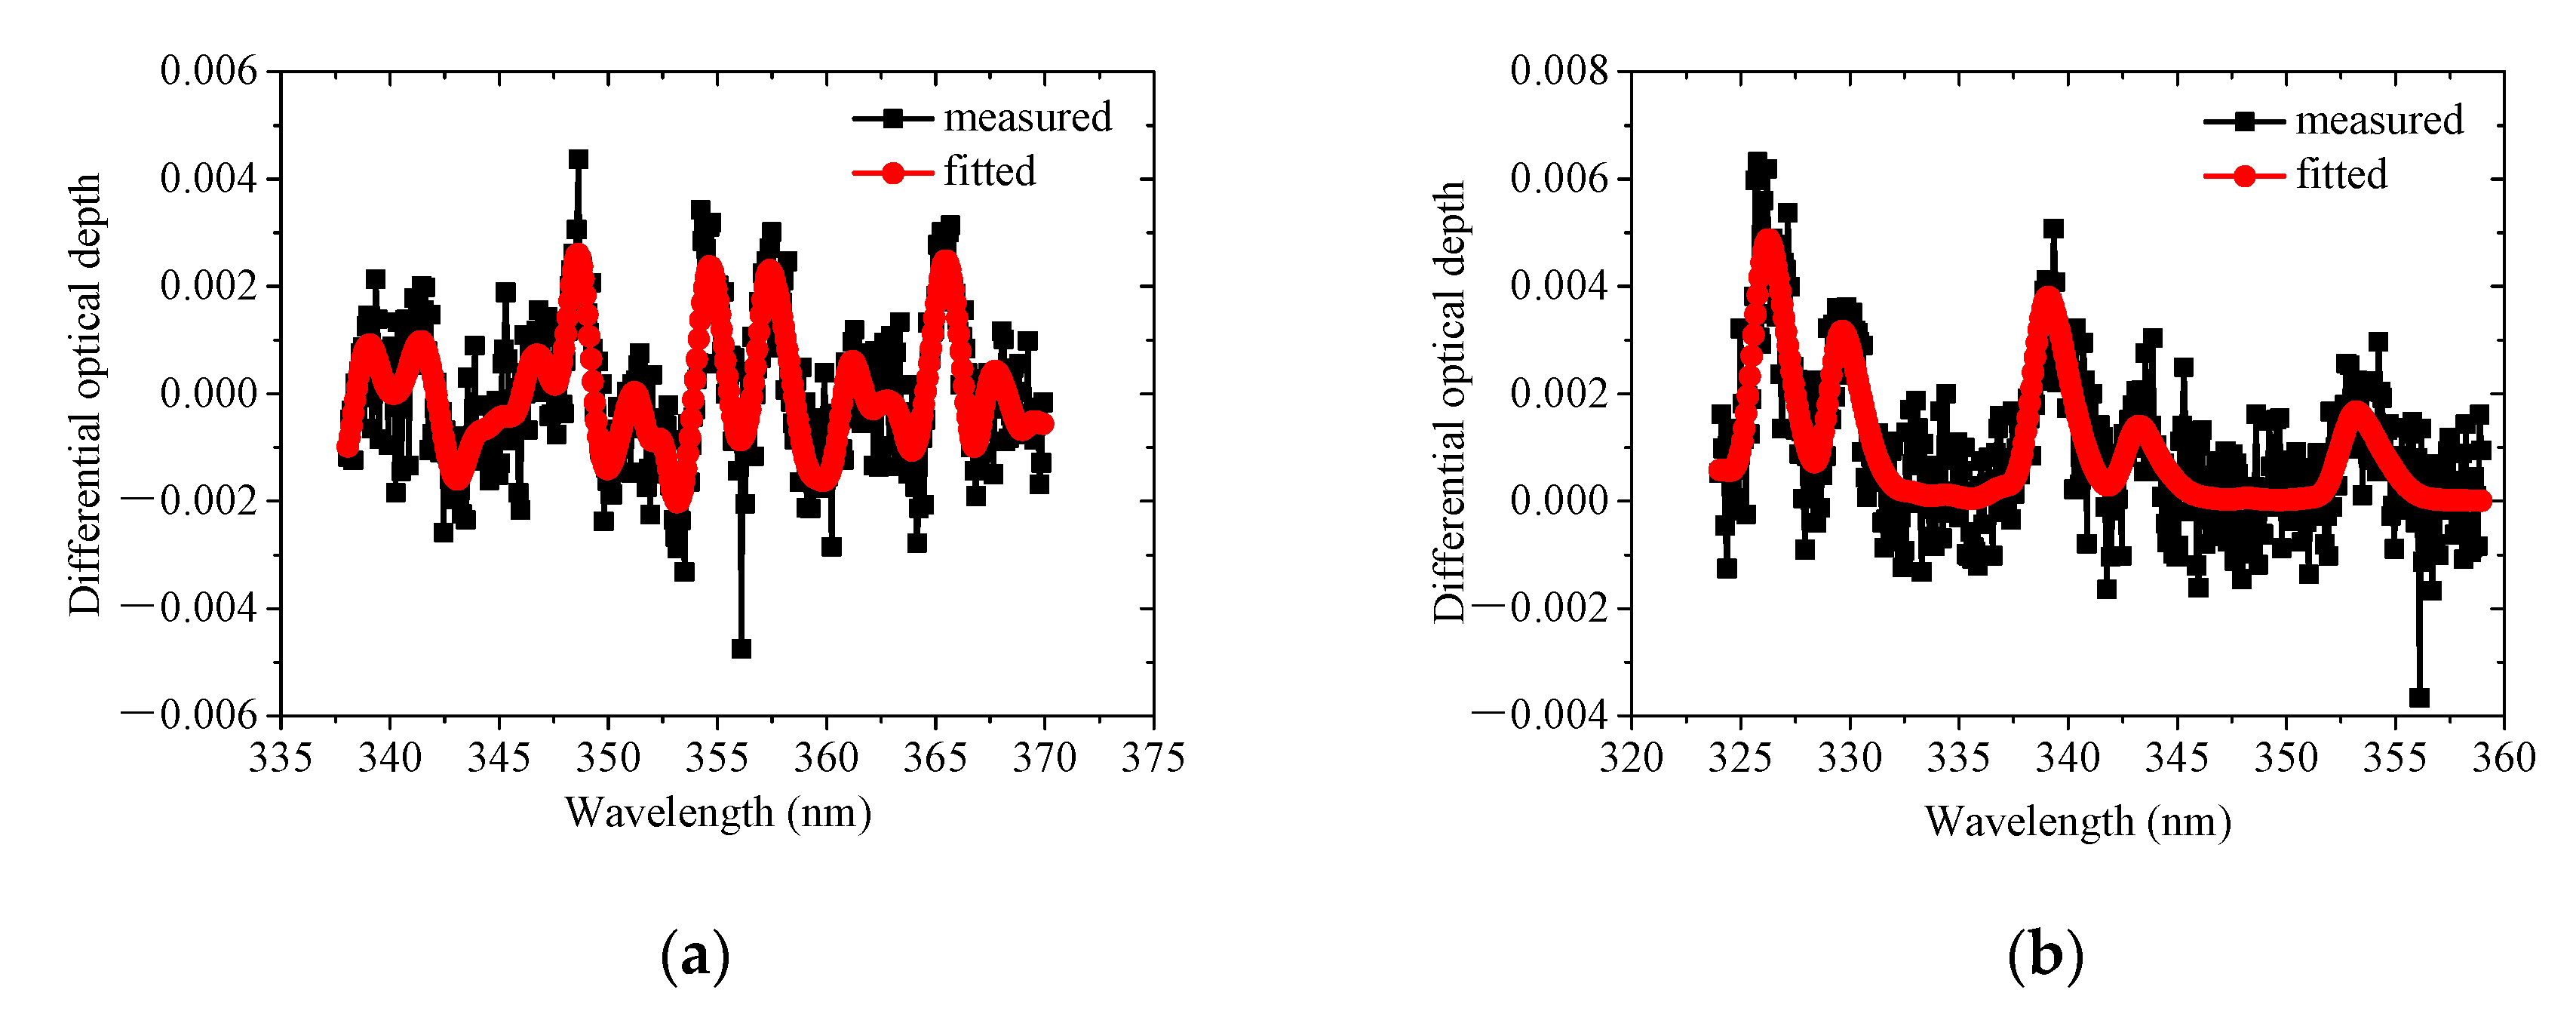
2.2. Spectral Analysis

According to the Beer–Lambert law, the differential slant column densities (dSCDs) of target species (such as NO2 and HCHO in this article) can be retrieved from measured spectra of scattering sunlight by the DOAS method [34]. The NO2 and HCHO dSCDs denote the differences of their slant column densities (SCDs) between measurement spectra and reference spectra. In this study, reference spectra were derived from sequential spectra, which were defined as the interpolated spectra between two zenith spectra measured before and after an off-zenith sequence of elevation angles. In this case, the NO2 and HCHO dSCDs from spectral inversion can be treated as tropospheric NO2 and HCHO dSCDs, i.e., so-called NO2 and HCHO delta SCDs [35]. The process of spectral analysis was achieved by QDOAS software (http://uv-vis.aeronomie.be/software/QDOAS/) based on the theory of non-linear least squares. The settings of fitting parameters for NO2 and HCHO spectral analysis can be taken from previous studies [16,31], listed in Table S1. In the post-processing of data quality control, NO2 and HCHO dSCDs were rejected when the root mean square (RMS) of spectral fitting residuals was larger than 0.003 [25]. Figure 2 shows an example of spectral fitting for NO2 and HCHO dSCDs from spectrum measured at the elevation angle of 10° at 12:05 Beijing time (BJ, UTC + 8 h) on 13 June 2014.

2.3. Retrieval of NO2 and HCHO Vertical Profiles

Vertical profiles of NO2 and HCHO volume mixing ratios (VMRs) in the lower troposphere (0–4 km) were separately retrieved from each elevation sequence of NO2 and HCHO delta dSCDs by the “Profile inversion algorithm of aerosol extinction and trace gas concentration” (PriAM) algorithm, which was a type of optimal estimation (OE) profile inversion algorithm for ground-based MAX-DOAS observation [36]. The solution of PriAM profile retrieval is achieved by numerical iteration procedure. PriAM contains a two-step inversion procedure, i.e., profile inversion of aerosol extinction (AE) and profile inversion of trace gas VMRs. The AE vertical profiles at 360 nm have been successfully retrieved from the oxygen dimer (O4) delta dSCDs during the field campaign. The specific results and inversion parameters (for example, surface albedo, single scattering albedo and asymmetry factor of aerosol, temperature and pressure profiles) for AE profiles can be referred to previous studies [25]. The AE profiles were used as the input parameters for NO2 and HCHO profile inversion in the second step. On the basis of the spectral fitting intervals of NO2 and HCHO, the simulations of air mass factor through the SCIATRAN radiative transfer model (RTM) were carried out at 360 nm for NO2 and 343 nm for HCHO. Retrieved AE profiles were converted into those at NO2 and HCHO simulation wavelengths with an Ångström exponent of 0.9, estimated from the collocated nephelometer measurement [26]. An exponential a priori NO2 profile and a Boltzmann distribution a priori HCHO profile the same as that used in the adjacent site were used in this study [16]. The diagonal elements of the a priori covariance matrix were set as 1 for NO2 and 0.25 for HCHO, which did not decrease with the altitudes in order to balance the flexibility and stability of the profile inversion. Except the first layer (0–50 m) adjacent to the ground, hereafter called the near-surface layer, the vertical interval in the NO2 and HCHO profiles was set as 200 m. During the procedure of data post processing, we rejected the NO2 (HCHO) profiles with a cost function of profile inversion larger than 30 and the relative deviations of NO2 (HCHO) dSCDs between PriAM simulation and MAX-DOAS measurement greater than 30%. The screening thresholds were based on the balance of data quality and amount. With respect to selected thresholds, 82% NO2 profiles and 72% HCHO profiles were left, and the corresponding averages of OE cost function were 5.72 for NO2 and 9.90 for HCHO. Then, the near-surface VMRs and vertical column densities (VCDs) of NO2 and HCHO could be obtained by extraction and vertical integration through NO2 and HCHO profiles. In addition, it should be noted that we use all the qualified MAX-DOAS data below without the classification of sky condition because NO2 and HCHO results are less influenced under most cloudy conditions (except fog and optically thick clouds) [36]. Meanwhile, the aforementioned data quality procedure can eliminate the parts of data interfered with by different sky conditions.

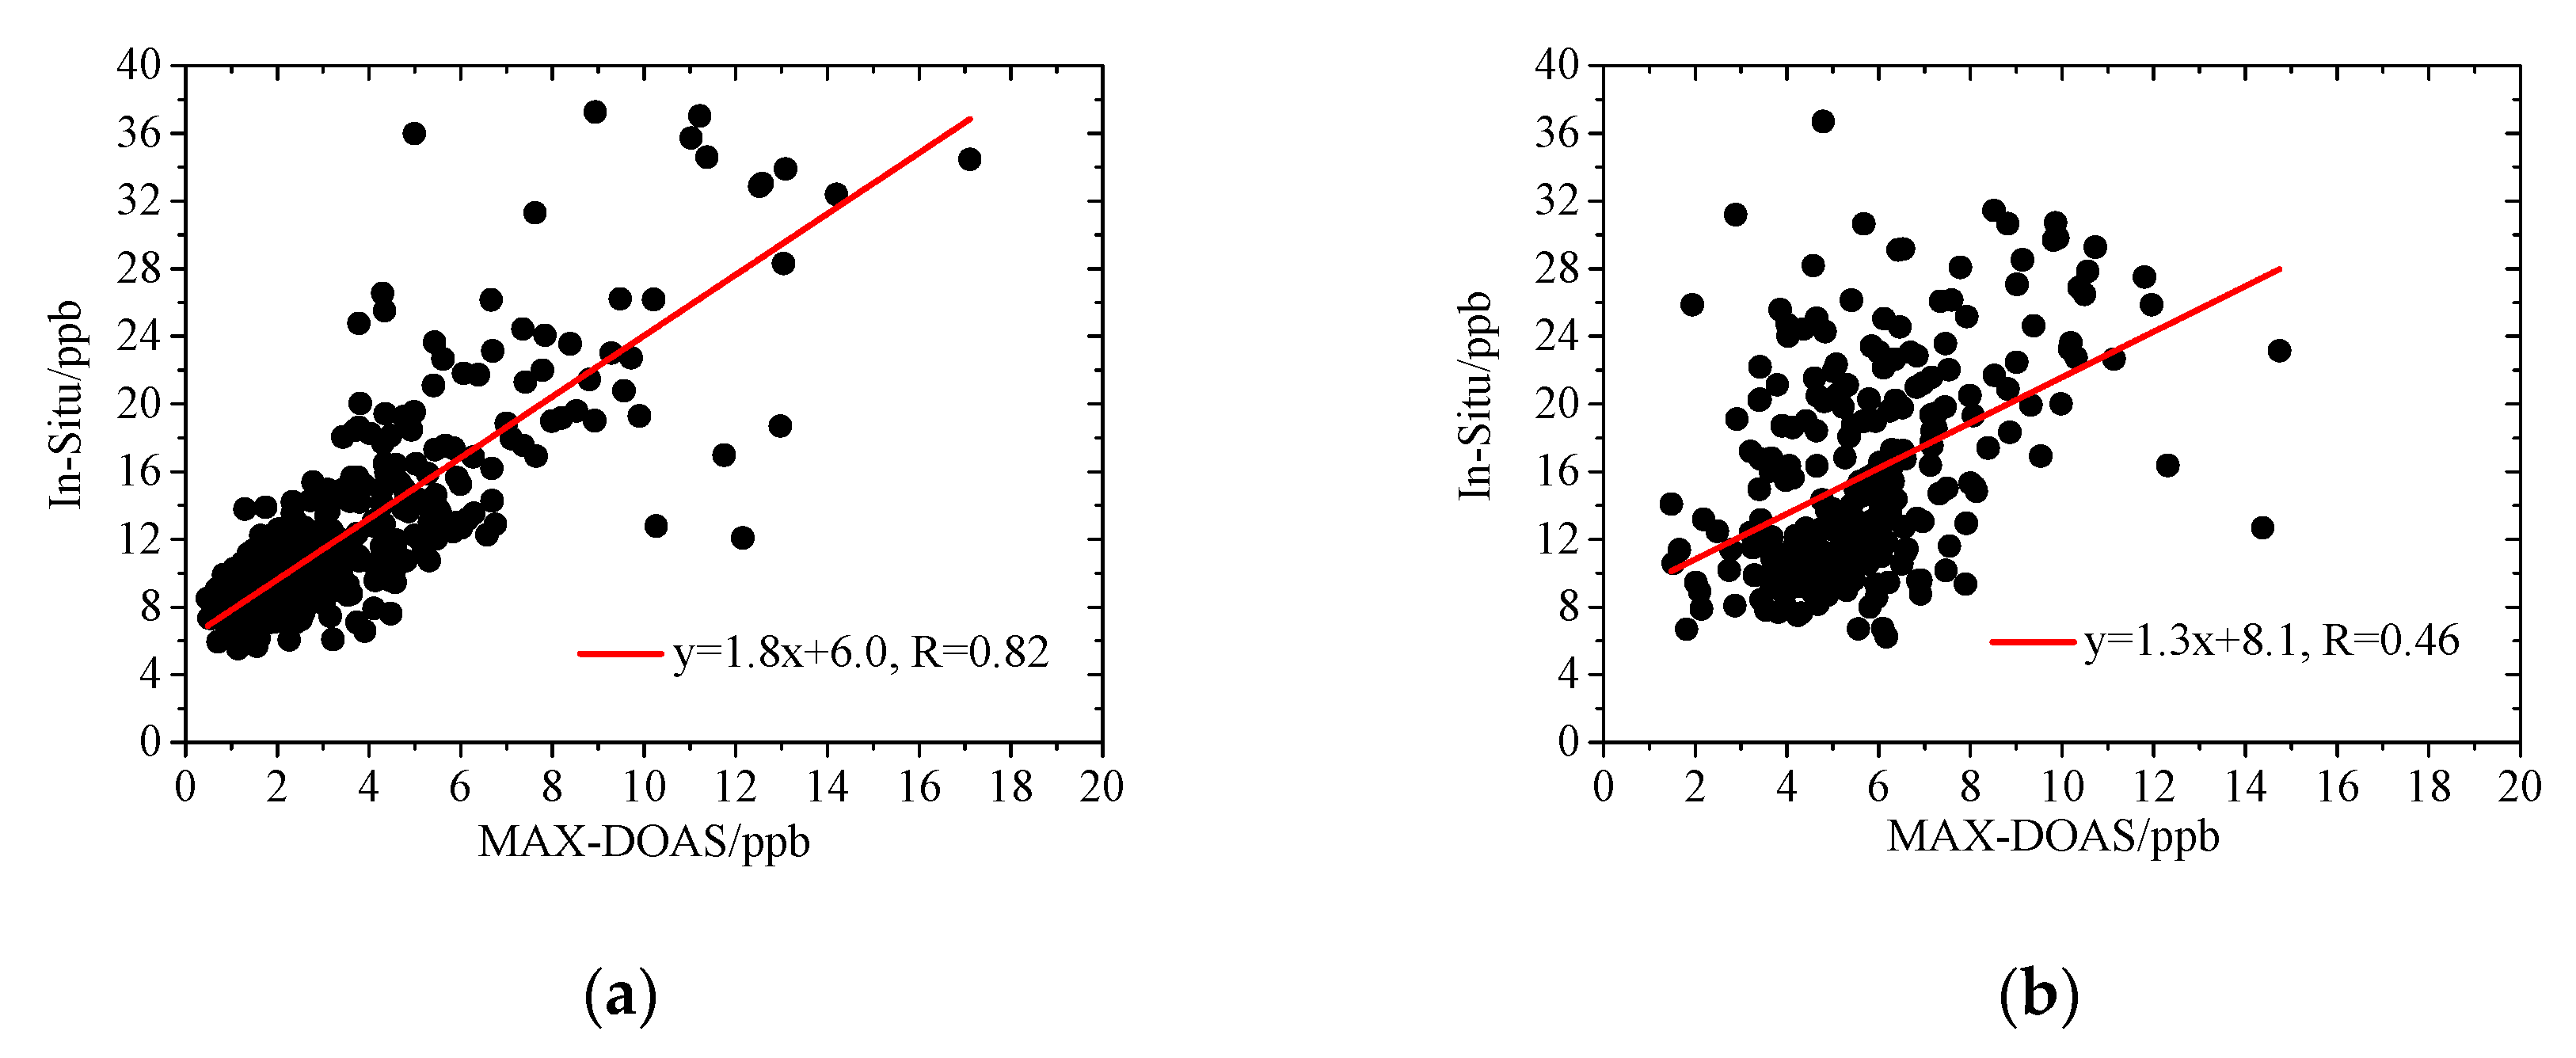
2.4. Ancillary Datasets

Hourly meteorological data, such as surface temperature, wind and relative humidity, were obtained from the synchronous operational observation of China Meteorological Administration (CMA) at the same site. The ERA5 reanalysis data (https://www.ecmwf.int/en/forecasts/datasets/reanalysis-datasets/era5, accessed on 15 June 2020) were also used for the extraction of the planetary boundary layer height (PBLH) as well as the a priori profiles of temperature and pressure. The measurements of in situ surface O3, NO2 and HCHO were also carried out during the intensive field campaign in the summer of 2014 [27,29]. Figure 3 shows the correlation of hourly concentrations between two data sets, i.e., in situ measurements and MAX-DOAS retrieval. The correlation coefficients (R) are 0.82 and 0.46 for NO2 and HCHO, respectively, which are similar to the results at a station on the central-western edge of the same NCP area [16]. To some extent, this implies that the retrieved data in this study are reliable to investigate the variations in NO2 and HCHO.

3. Results

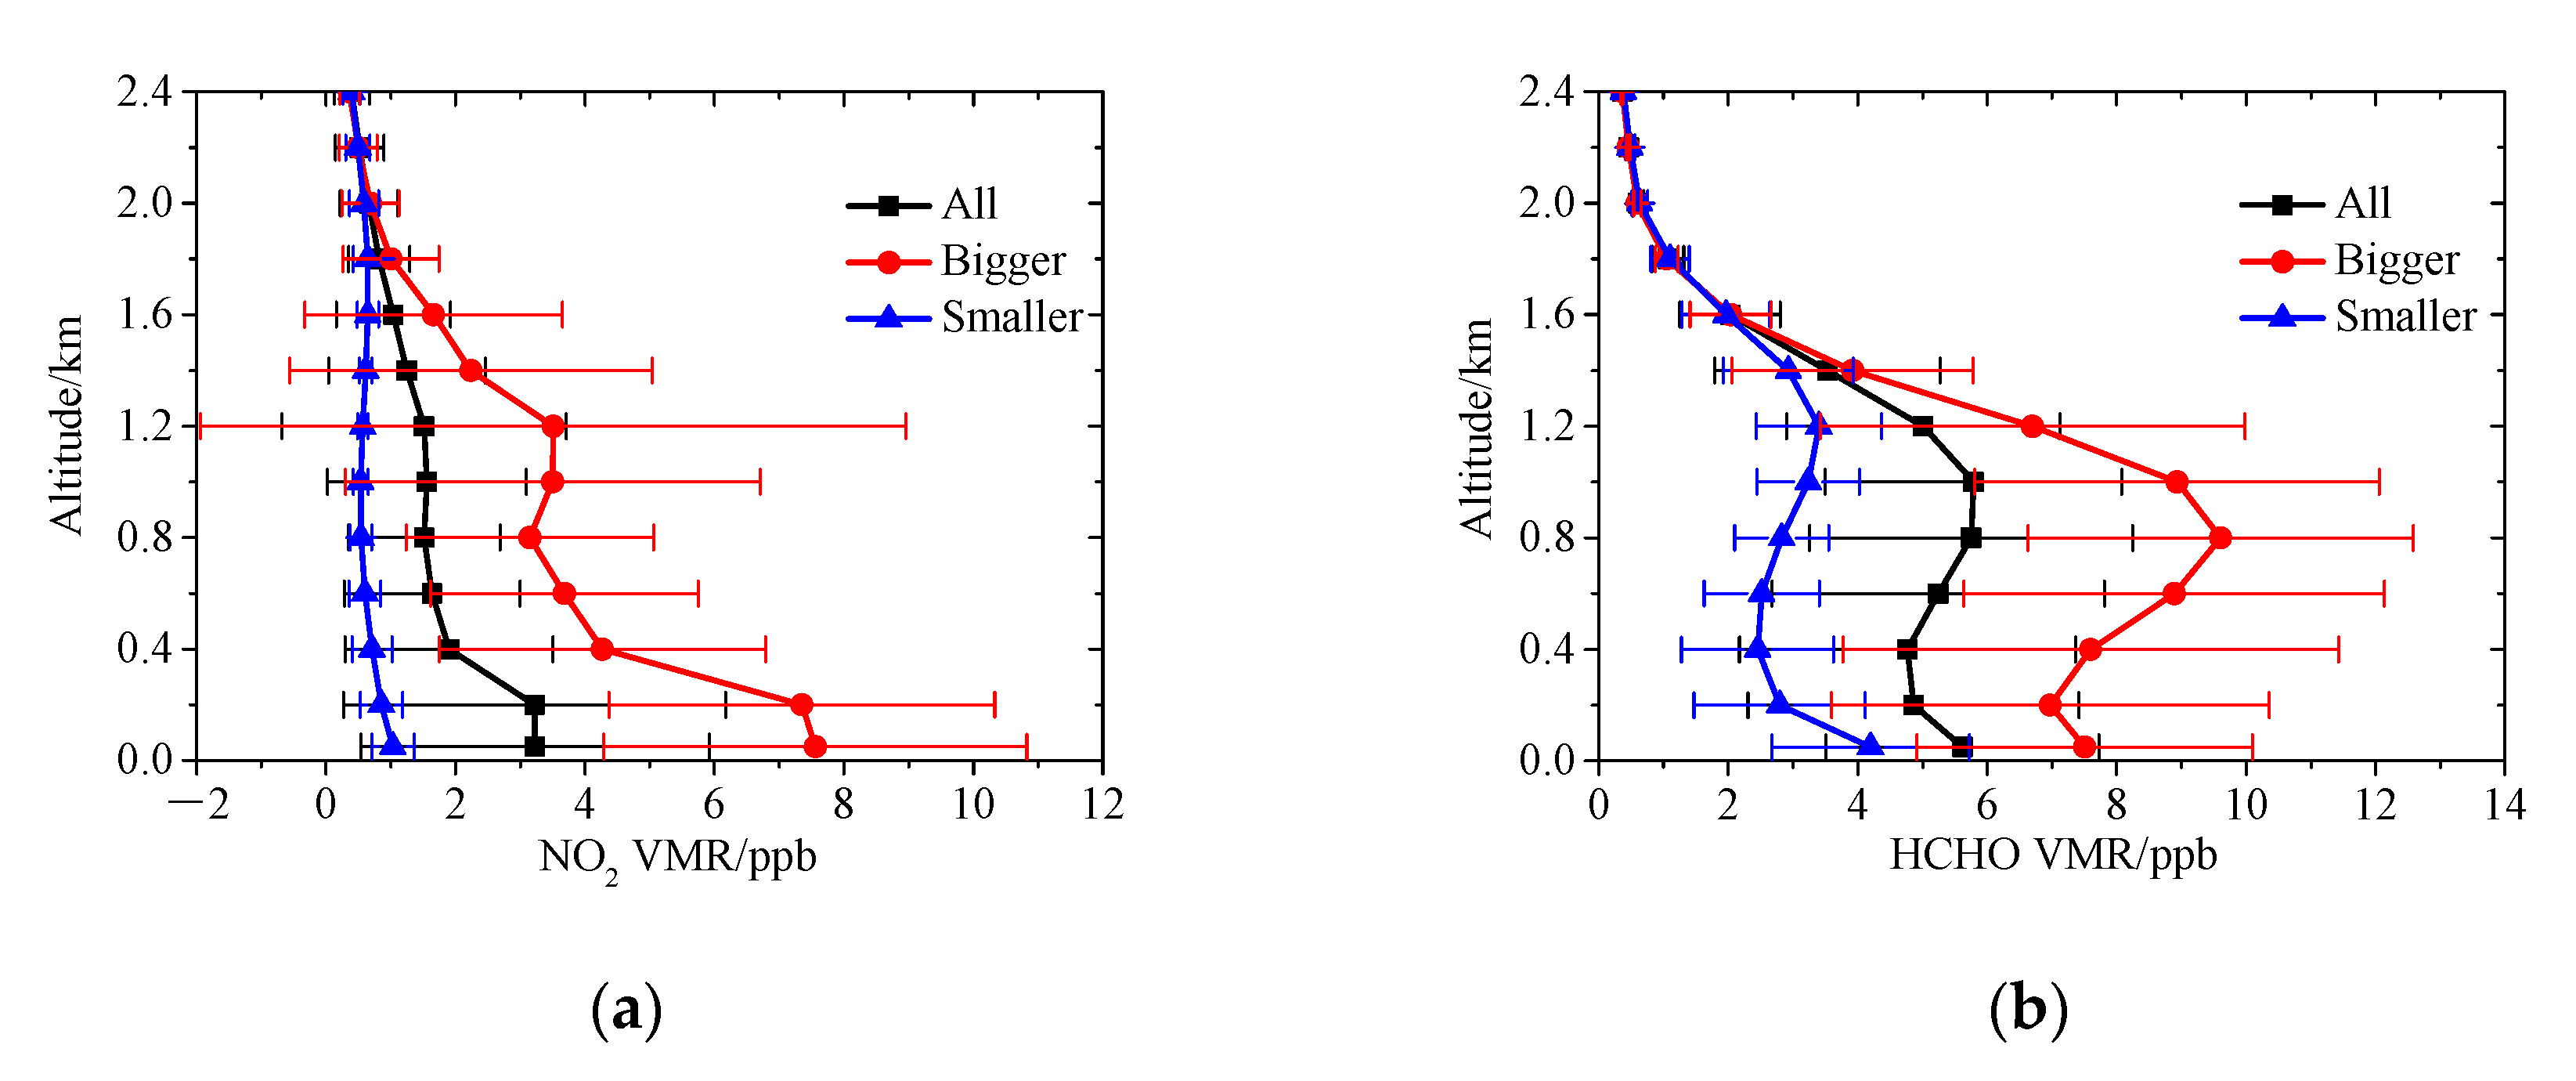
3.1. Abundance and Overall Characteristics

Owing to the fact that the substantial information on the concentrations derived from the measurements was mainly below 2 km (Figure S1), the averaged NO2 and HCHO vertical profiles below 2.4 km during the effective observation period are shown by the black lines with squares in Figure 4. The corresponding means ± standard deviations of VCDs and near-surface VMRs are 1.02 ± 0.51 × 10¹⁶ molec·cm−2 and 3.23 ± 2.70 ppb for NO2 and 2.32 ± 0.56 × 10¹⁶ molec·cm−2 and 5.62 ± 2.11 ppb for HCHO. The correlation coefficients between VCDs and near-surface VMRs are 0.69 for NO2 and 0.55 for HCHO, implying that there are limitations in the representation of NO2 and HCHO variations at higher altitudes due to their surface concentrations. This can be further confirmed by the vertical structure of NO2 and HCHO. While the NO2 VMR decreases with the increasing altitude as a whole, there is generally a significantly elevated HCHO pollution layer at the altitude of ~1 km mainly caused by HCHO secondary production at higher altitudes.
According to the aforementioned means and standard deviations of NO2 (HCHO) VCDs, two classifications of NO2 (HCHO) profile corresponding to the NO2 (HCHO) VCD “larger than mean + standard deviation” or “smaller than mean − standard deviation”, are screened and averaged, respectively, and presented as “Larger” and “Smaller” in Figure 4. Then, the NO2 (HCHO) levels and meteorological conditions for the three situations of “All”, “Larger”, and “Smaller” are also summarized in Table 1. For NO2, the secondary peak at the higher altitude (~1.1 km) appears to gradually become clear with the increasing NO2 VCD (Figure 4a). For HCHO, although the peak at the higher altitude (0.8–1.2 km) always exists, it enhances gradually with the increasing HCHO VCD (Figure 4b). The relatively lower temperature and higher relative humidity (RH) favor more severe NO2 pollution, while there are no significant differences in temperature and RH for the three HCHO situations (Table 1). This is probably connected with the differences of chemical reaction affecting NO2 and HCHO. Through comparing the wind for the “Larger” and “Smaller” situations, we find that the higher VCDs correspond to the lower wind speeds (WS) with the wind directions (WD) of north for NO2 and southeast for HCHO. In addition, the NO2 and HCHO pollution levels are closely related to the PBLHs. The higher PBLH, the weaker the NO2 VCDs.

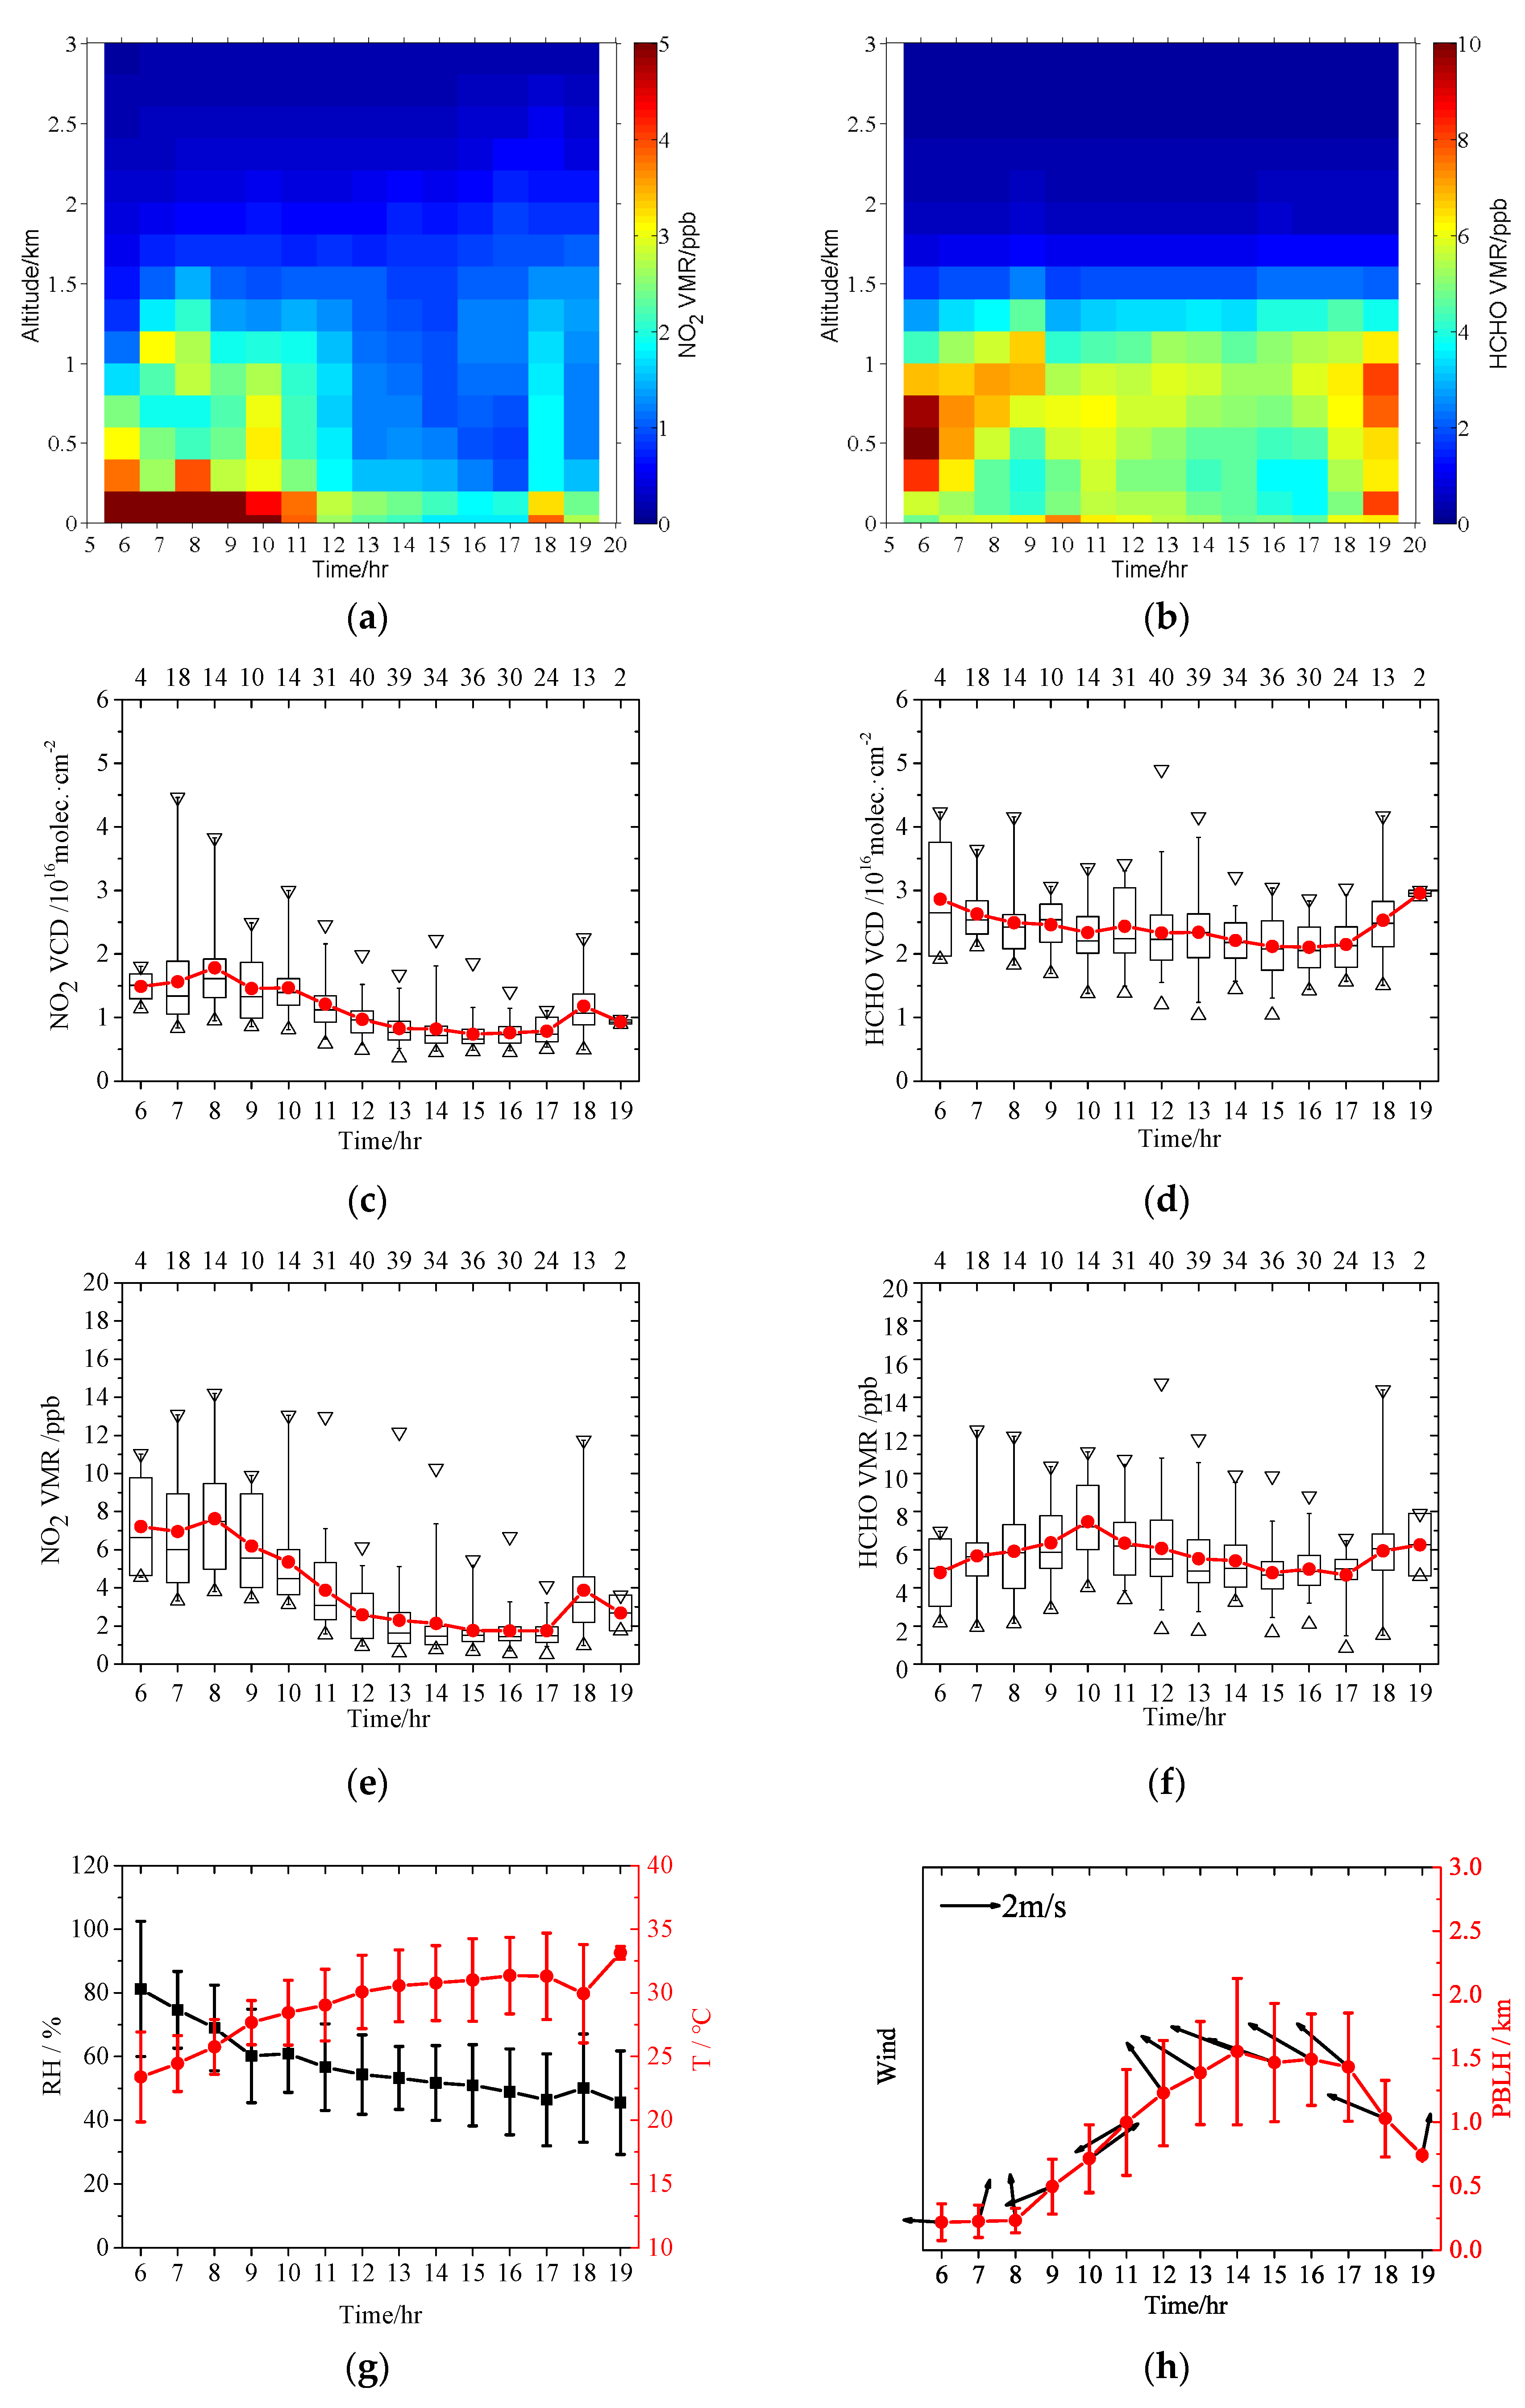
3.2. Diurnal Variations
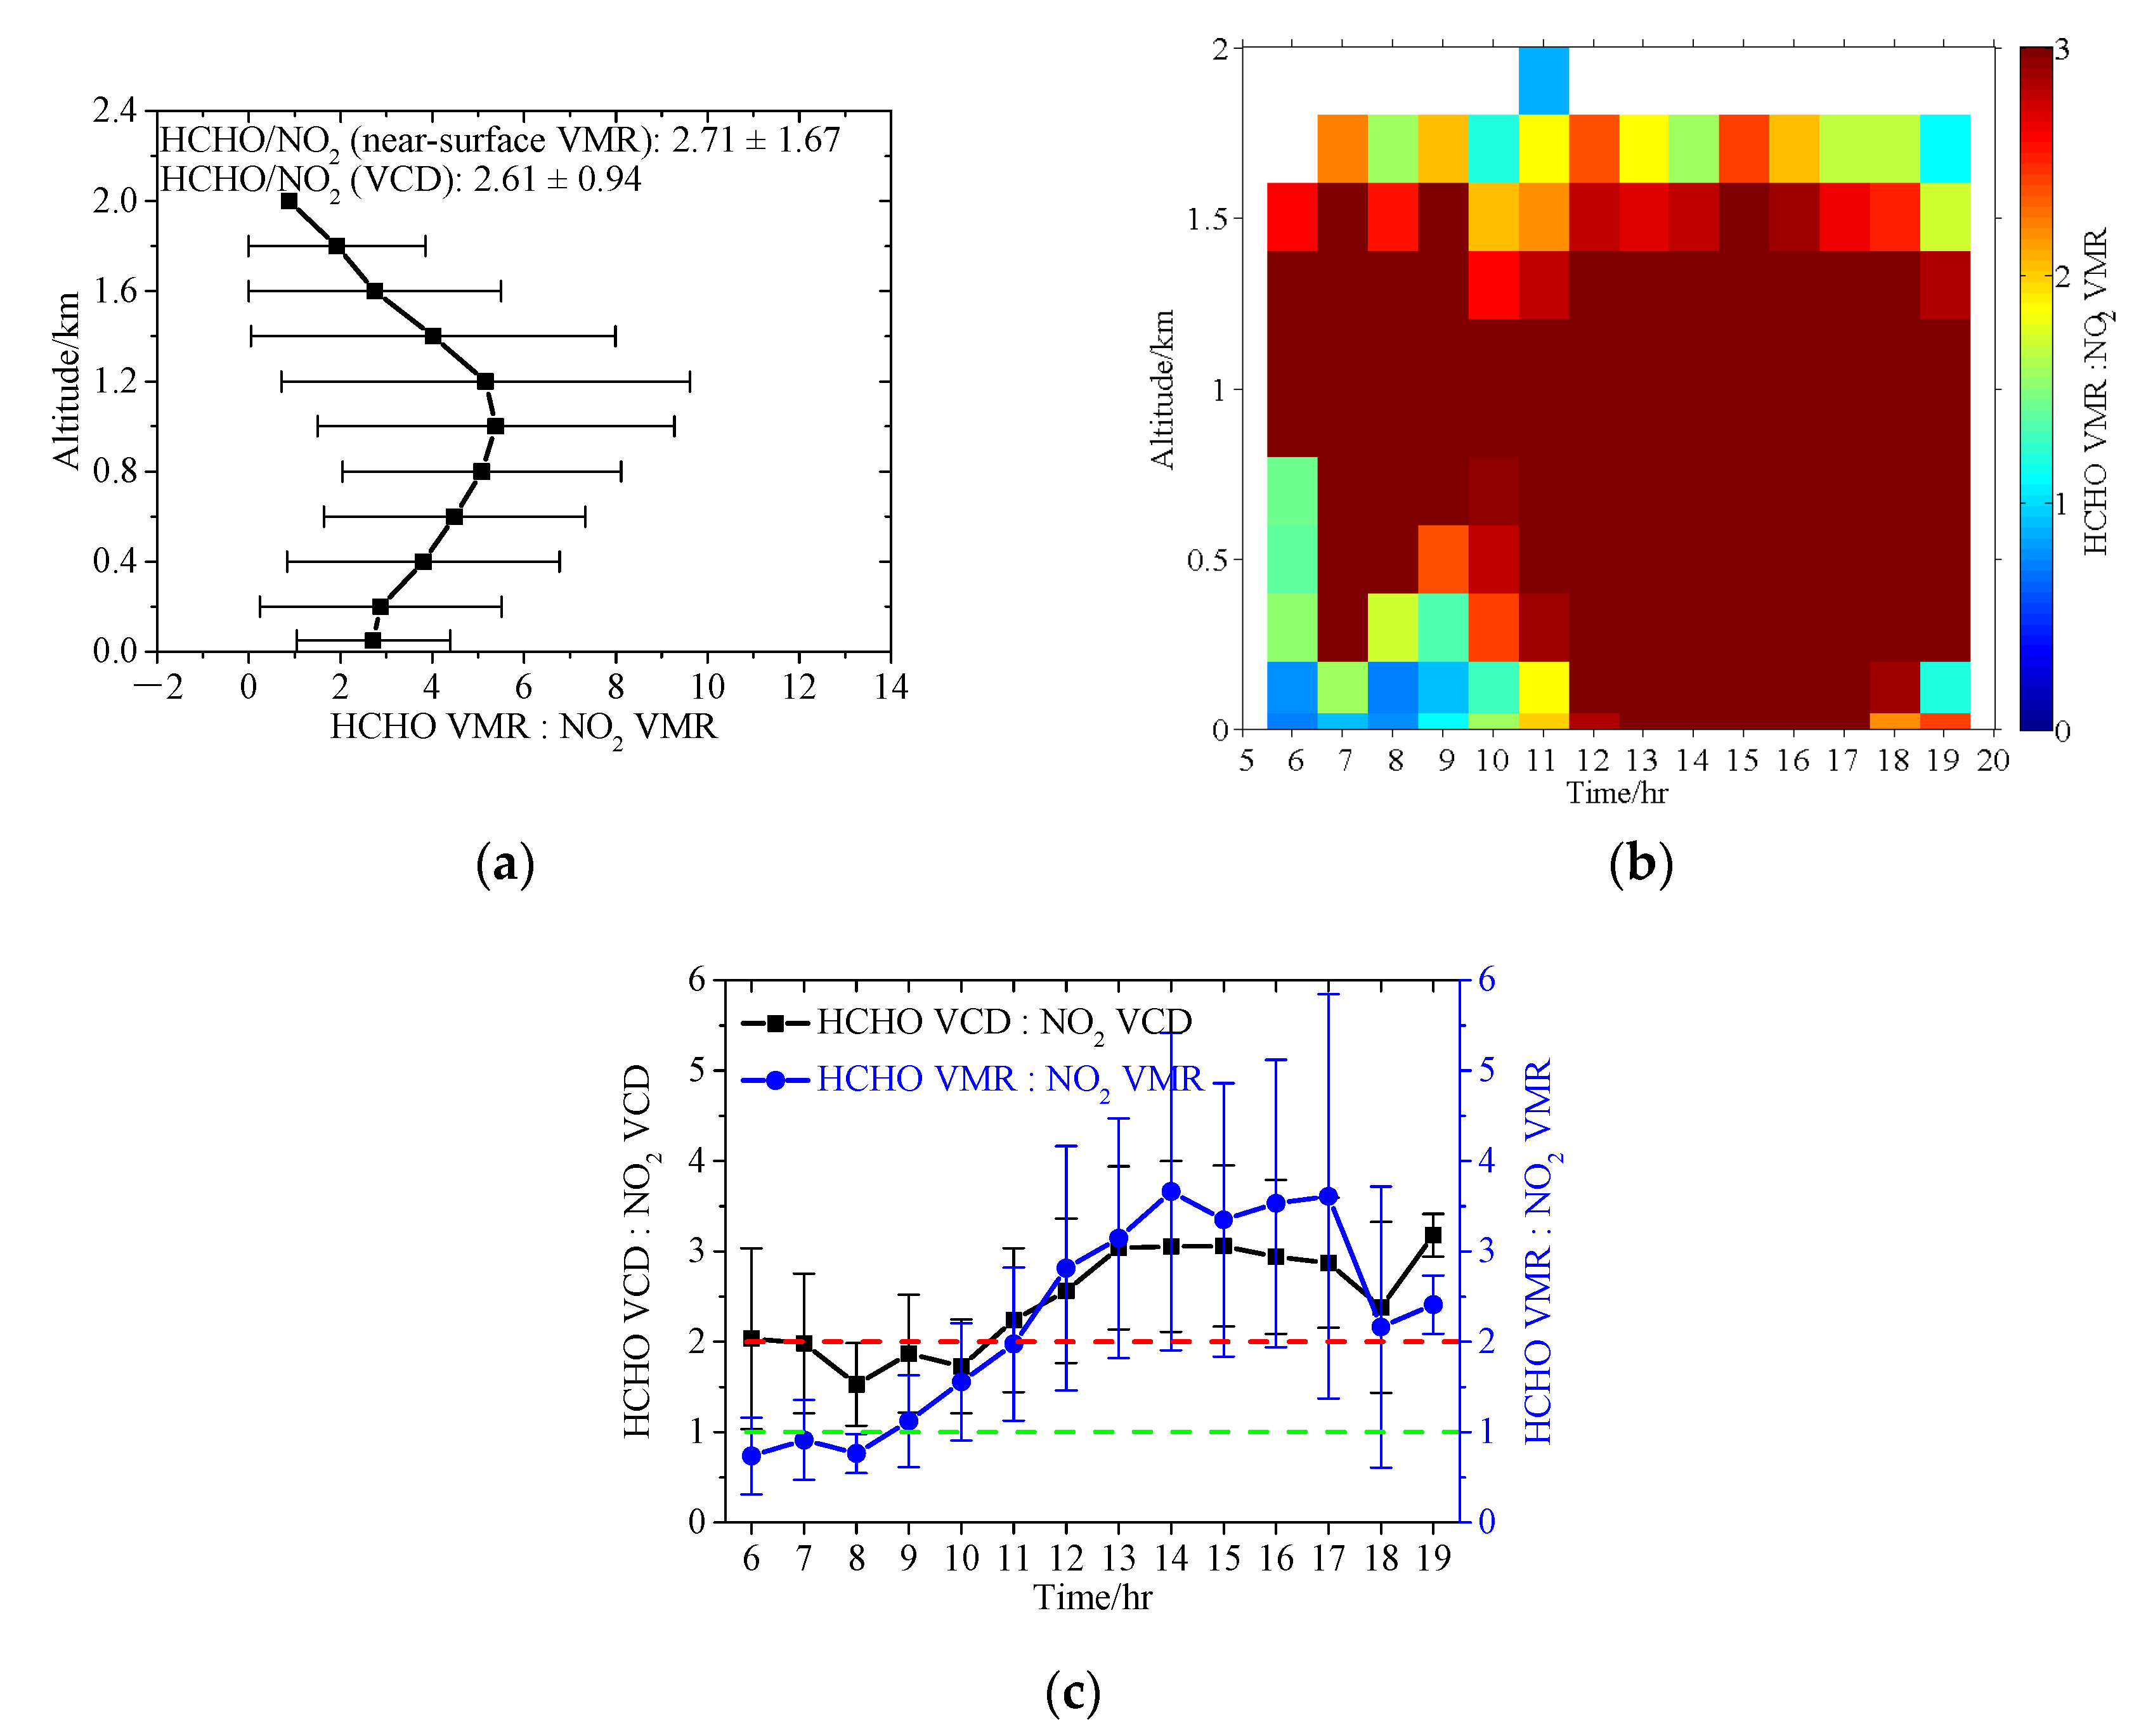
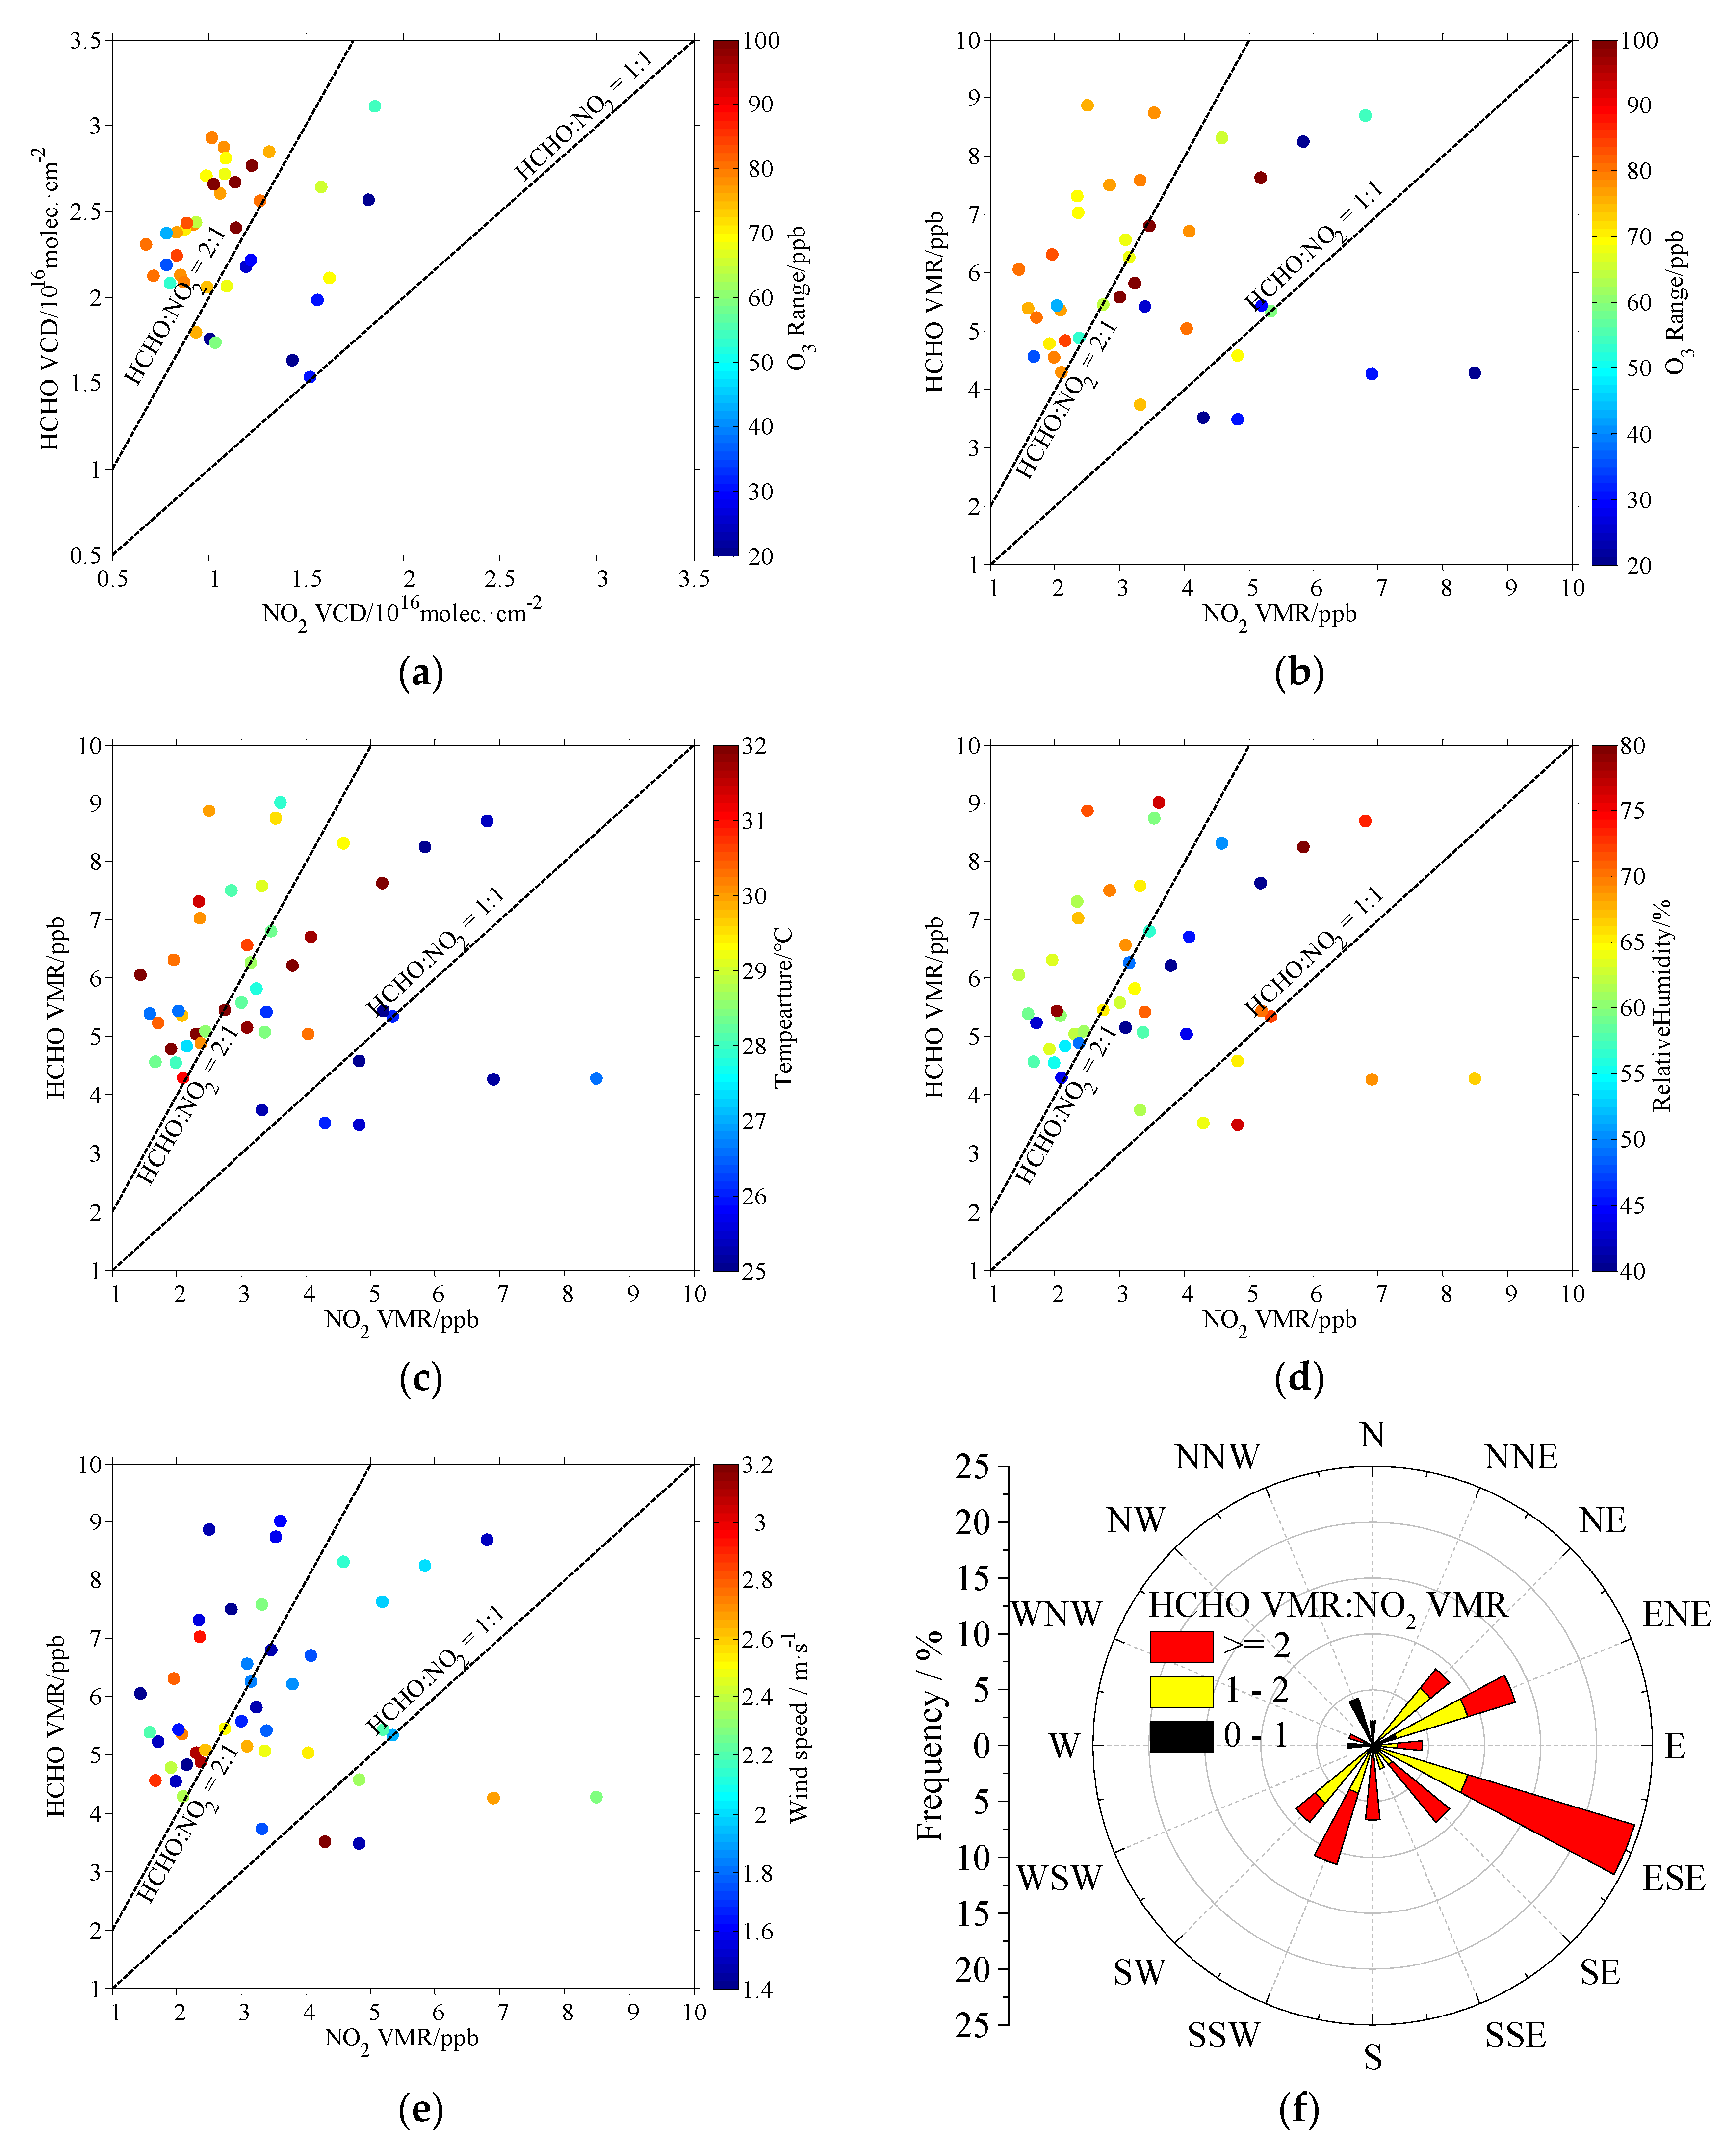
There are significant differences in the vertical distribution of NO2 and HCHO diurnal pattern (Figure 5a,b). It is clear that there are elevated pollution layers for both NO2 and HCHO before 10:00 BJ above the planetary boundary layer, i.e., in the residual layer (Figure 5a,b,h). With the development of a daytime planetary boundary layer, the NO2 lifted layer gradually disappears, and NO2 concentrates mainly at the heights of less than 0.2 km from 11:00–19:00 BJ. However, the elevated HCHO layer always exists through the entire day, and the associated HCHO concentration levels are lower due to the higher PBLH from 11:00–17:00 BJ. The most likely cause of elevated HCHO layers during 11:00–17:00 BJ is the more active photochemical reactions occurring in the upper part of the boundary layer, consistent with previous research results on the atmospheric pollution and oxidation pool over NCP [2].
The diurnal variations of NO2 VCD and near-surface VMR are basically consistent, and there are significant differences in the HCHO diurnal pattern between VCDs and near-surface VMRs (Figure 5c–f). For example, different from the peaks of NO2 VCDs and near-surface VMRs in the early morning and evening, the HCHO near-surface VMR gradually increases and peaks around 10:00 BJ. The diurnal variations of VCD and near-surface VMR are in the range of 0.74–1.78 × 10¹⁶ molec·cm−2 and 1.74–7.63 ppb for NO2 and 2.11–2.95 × 10¹⁶ molec·cm−2 and 4.67–7.47 ppb for HCHO. Comparing the diurnal variations of temperature and RH with the near-surface VMRs of NO2 and HCHO (Figure 5e–g), we still find that higher NO2 levels are associated with lower temperature and higher RH, and there is no significant relationship between HCHO concentration and temperature (or RH). Considering the relatively weak wind conditions (Figure 5h), the peaks of NO2 VCDs and near-surface VMRs in the early morning and evening are probably caused by local sources such as traffic emission. Meanwhile, the NO2 and HCHO pollution is relatively weaker when the planetary boundary layer is fully developed around 15:00 BJ, showing a PBLH of ~1.5 km (Figure 5c–f,h).

3.3. HCHO/NO2 Ratio

3.3.1. Vertical Profile and Diurnal Variation

The ratio of HCHO to NO2 (RHCHO-NO2) has been proved to be an effective indicator to investigate the sensitivity of tropospheric ozone production to nitrogen oxide and reactive volatile organic compound (VOC) [37,38]. The averaged RHCHO-NO2 profile (Figure 6a) was calculated through the profiles of HCHO and NO2 VMRs retrieved from ground-based MAX-DOAS. For the calculation of RHCHO-NO2 (Figure S2), only the data with HCHO VMRs larger than 1 ppb and smaller than 10 ppb were considered in order to balance the data reliability and amount of RHCHO-NO2. The averages of RHCHO-NO2 calculated from near-surface VMRs and VCDs are RHCHO-NO2,VMR = 2.71 ± 1.67 and RHCHO-NO2,VCD = 2.61 ± 0.94, respectively, during the effective observation period; these values are close to each other. However, the RHCHO-NO2 below 2.0 km is in the range of 0.88–5.39 with an elevated layer around the altitude of 1.0 km.
The averaged diurnal variations of daytime RHCHO-NO2 profile are shown in Figure 6b. Smaller RHCHO-NO2 (<2) values mainly appear before 11:00 BJ in the lower layer. The height of the lower boundary of the elevated RHCHO-NO2 layer gradually decreases from 6:00 BJ (0.8 km) to 11:00 BJ (0.2 km) until the higher RHCHO-NO2 (>2) fills the whole lower troposphere (below 1.4 km) during the period of 12:00–17:00 BJ. Above the altitude of 1.6 km, most RHCHO-NO2 values are in the range of 1–2. After 19:00 BJ, the smaller RHCHO-NO2 in the lower layer seems to occur again. Correspondingly, diurnal variations of RHCHO-NO2,VMR are in the range of 0.74–3.66, greater than that of RHCHO-NO2,VCD (1.53–3.18) (Figure 6c). However, the trends of their diurnal variation are similar with the wide peak around 15:00 BJ, although there are larger differences in the absolute value between RHCHO-NO2,VMR and RHCHO-NO2,VCD before 10:00 BJ and after 19:00 BJ. It is worth noting that both RHCHO-NO2,VMR and RHCHO-NO2,VCD are larger than 2 after 10:00 BJ, when the photochemistry reaction is active. This implies that the sensitivities of O3 production to NOx and VOCs are the same in the lower troposphere at Raoyang, which can be further confirmed by RHCHO-NO2 vertical distribution (Figure 6a).

3.3.2. Relationship to O3 Production and Meteorological Condition

The relationships of the daytime (7:00–18:00 BJ) averages of HCHO and NO2 to O3 production and meteorological condition are shown in Figure 7. To analyze the influence of HCHO and NO2 on O3 production, we assume the daytime surface O3 diurnal variations at Raoyang station were mainly caused by O3 photochemical reaction [4,5], using the variation range of daytime O3 concentration as a proxy for O3 production (“O3 Range” in Figure 7a,b). Upon previous studies [39,40], O3 production regimes could be assigned as VOC-limited (RHCHO-NO2 < 1), transition zone (1 < RHCHO-NO2 < 2) and NOx-limited (RHCHO-NO2 > 2) for HCHO VMRs lower than 10ppb. Therefore, inferred from the RHCHO-NO2,VCD in Figure 7a, O3 production regimes are in the NOx-limited section and transition zone, corresponding to the larger and smaller O3 ranges with the typical boundary of ~60 ppb, respectively. Differently from the VCD situation, in which there is no case of RHCHO-NO2,VCD < 1, there is a small quantity of cases with RHCHO-NO2,VMR < 1 (i.e., VOC-limited) as shown in Figure 7b, which is associated with weak near-surface O3 production (O3 range < 40 ppb). It is interesting that the strongest near-surface O3 production (O3 Range > 90 ppb) occurs in the transition zone, i.e., 1 < RHCHO-NO2,VMR < 2, probably signifying combined air pollution in the region of Raoyang. On the whole, the cases with high O3 ranges are found in the NOx-limited regime for both VCDs and near-surface VMRs in summer in the NCP rural area.
In the interests of consistency with surface meteorological observation, we focus on the near-surface HCHO and NO2 VMRs as well as RHCHO-NO2,VMR in the following discussion. It is clear that the zones of RHCHO-NO2,VMR > 2 and RHCHO-NO2,VMR < 1 are corresponding to the high and low daytime averaged temperatures, respectively (Figure 7c). With the opposite situation for RH, the low (typically 55%) and high (typically 65%) RH appears in the NOx-limited and VOC-limited O3 production regimes, respectively (Figure 7d). Therefore temperature and RH are two important driving factors of HCHO and NO2 photochemical process in summer, partly because they affect the photochemistry activity and biogenic isoprene emissions [41,42]. The relationship between RHCHO-NO2,VMR and wind speed is unapparent (Figure 7e), partly because the wind speed changes in a small range. However, the rose of RHCHO-NO2,VMR in 16 wind sectors clearly presents its dependency of wind direction (Figure 7f). The total frequencies for RHCHO-NO2,VMR > 2, 1 < RHCHO-NO2,VMR < 2, RHCHO-NO2,VMR < 1 are 49%, 40% and 11%, respectively. The ratios of RHCHO-NO2,VMR > 2 are distributed at the southeast side of the NE–SW axis with a maximum frequency of ~16% in the ESE section. The ratios of RHCHO-NO2,VMR < 1 are mainly distributed in the NNW section with a maximum frequency of ~5%. Therefore, air masses from different source regions can lead to different sensitivities of O3 production to NOx and VOCs at the Raoyang station [22]. In addition, southeasterly winds occur mainly during the afternoon period (Figure 5h), when O3 production is NOx-limited (RHCHO-NO2, Figure 6b). This can partly explain the dependence of RHCHO-NO2 on wind direction (Figure 7f).

4. Discussion

The level of NO2 VCD in this study is higher than that at the NCP background station of Shangdianzi and lower than that in the NCP megacity of Beijing in summer [30,32,43]. However, the level of HCHO VCD is higher than that at another NCP rural site of Gucheng and close to the HCHO abundance in Beijing in the summer of 2017 [44]. Satellite observation also found significant spatial differences and temporal variations for NO2 and HCHO levels over the NCP [45,46]. Even so, we found similar vertical structures and diurnal variations of NO2 and HCHO profiles retrieved by MAX-DOAS measurements at the NCP rural site of Xingtai [16]. The boundary layer evolution and photochemical reaction played an important role in the diurnal variation of NO2 and HCHO vertical distribution, leading to the elevated pollution layer in the residual layer before 10:00 BJ and the HCHO oxidation layer in the upper part of the boundary layer from 11:00–17:00 BJ [2,14]. Different from the studies at another NCP suburban site [24], the NOx-limited regime of O3 production stayed stable in the boundary layer as a whole. Meteorological conditions also affect the levels and spatiotemporal variation of NO2 and HCHO, and the sensitivities of O3 production vary accordingly because meteorological conditions such as temperature can influence the natural source emission and the photochemical efficiency of O3 precursors [13,23,41].

5. Conclusions

In this article, we present vertical profiles of NO2, HCHO and HCHO/NO2 ratios retrieved from ground-based MAX-DOAS measurements in summer 2014 at the Raoyang rural site of the NCP. Temporal variations of NO2 and HCHO vertical profiles as well as the relationship of HCHO/NO2 to O3 production were investigated. The main findings are summarized as follows.
The average levels of VCDs and near-surface VMRs were 1.02 ± 0.51 × 10¹⁶ molec·cm−2 and 3.23 ± 2.70 ppb for NO2 and 2.32 ± 0.56 × 10¹⁶ molec·cm−2 and 5.62 ± 2.11 ppb for HCHO during the field experiment. The NO2 vertical distribution averaged by all effective profiles had a declining shape with increasing altitude, while there was an elevated layer for HCHO at the altitude of ~1km, indicating an enhancement of photochemistry in the upper planetary boundary layer. Thus, the correlation coefficient between VCDs and near-surface VMRs for NO2 (R = 0.69) is larger than that for HCHO (R = 0.55), implying more limitations of in situ surface measurement in representation of the vertical variations of HCHO than NO2 due to HCHO secondary production at higher altitudes. NO2 and HCHO levels are closely connected with meteorological conditions. For example, higher NO2 VCDs are usually associated with lower temperature, higher RH and lower PBLH.
The diurnal variations of VCD and near-surface VMR were in the range of 0.74–1.78 × 10¹⁶ molec·cm−2 and 1.74–7.63 ppb for NO2 and 2.11–2.95 × 10¹⁶ molec·cm−2 and 4.67–7.47 ppb for HCHO during the effective observation period, respectively. The severe NO2 pollution cases, i.e., peaks for VCDs and near-surface VMRs, appeared in the early morning and evening. The higher HCHO VCDs occurred in the morning and evening, while the near-surface HCHO VMRs gradually increased and peaked around 10:00 BJ. There were elevated pollution layers for both NO2 and HCHO in the residual layer before 10:00 BJ. However, the NO2 pollution without an elevated layer mainly concentrated at heights less than 0.2 km from 11:00–17:00 BJ, while the elevated HCHO layers always existed, and the associated HCHO concentration levels were lower due to the higher PBLH. Complex effects of boundary layer processes and photochemistry reactions on the diurnal variations of NO2 and HCHO vertical distribution need to be further studied in the future.
The averaged diurnal variations of daytime HCHO/NO2 ratio (RHCHO-NO2) profile indicated that RHCHO-NO2 was generally larger than 2 in the boundary layer from 11:00 BJ until 19:00 BJ, when ozone photochemistry was most active. The most frequent O3 production was in the NOx-limited regime during the observation campaign, inferred from both RHCHO-NO2,VCD and RHCHO-NO2,VMR. The ozone-NOx-HCHO production sensitivities were closely related to the meteorological conditions, such as temperatures, RH and wind. Temperature and RH probably affected photochemistry activity and natural source emissions, and the air masses from different source regions transported different atmospheric compositions to Raoyang. Therefore, more investigations of NO2 and HCHO vertical profiles are still needed to reveal the formation mechanism and long-term evolution of O3 pollution and to develop strategies for controlling the O3 photochemical pollution over the NCP in the future.

Supplementary Materials

The following supporting information can be downloaded at: https://www.mdpi.com/article/10.3390/atmos13060860/s1, Figure S1: time series of the qualified hourly NO2 and HCHO as well as coincident meteorological conditions; Figure S2: time series for vertical profiles of VMR ratios of HCHO to NO2 as well as HCHO/NO2 ratios of VCD and near-surface VMR; Table S1: fit settings for the NO2 and HCHO spectral analyses.

Author Contributions

Conceptualization, S.C. and J.M.; formal analysis, S.C. and S.L.; funding acquisition, J.L. and X.X.; investigation, S.C.; methodology, S.C., J.J. and J.M.; resources, J.M.; visualization, S.C.; writing—original draft, S.C.; writing—review & editing, S.C., J.J., J.M., J.L. and X.X. All authors have read and agreed to the published version of the manuscript.

Funding

This research was funded by the National Natural Science Foundation of China (Nos. 41875146, 41805027, 41330422), the Fund of State Key Laboratory of Applied Optics (No. SKLAO2021001A02) and the National Key Research and Development Program of China (Nos. 2018YFC1505703, 2017YFC1501802).

Institutional Review Board Statement

Not applicable.

Informed Consent Statement

Not applicable.

Data Availability Statement

Not applicable.

Acknowledgments

We thank ECMWF and BIRA-IASB for the reanalysis meteorological products and QDOAS spectral analysis software, respectively. We appreciate Thomas Wagner, Yang Wang and the other colleagues of MPIC and AIOFM for PriAM profile retrieval. We thank Weili Lin, Shihui Jia, Wei Peng and Rui Wang for making in situ measurements at Raoyang.

Conflicts of Interest

The authors declare no conflict of interest. The funders had no role in the design of the study; in the collection, analyses or interpretation of data; in the writing of the manuscript or in the decision to publish the results.

References

  1. Seinfeld, J.H.; Pandis, S.N. Atmospheric Chemistry and Physics: From Air Pollution to Climate Change, 3rd ed.; John Wiley & Sons, Inc.: Hoboken, NJ, USA, 2016; pp. 175–264. [Google Scholar]
  2. Ma, J.Z.; Wang, W.; Chen, Y.; Liu, H.J.; Yan, P.; Ding, G.A.; Wang, M.L.; Sun, J.; Lelieveld, J. The IPAC-NC field campaign: A pollution and oxidization pool in the lower atmosphere over Huabei, China. Atmos. Chem. Phys. 2012, 12, 3883–3908. [Google Scholar] [CrossRef] [Green Version]
  3. Ma, J.; Xu, X.; Zhao, C.; Yan, P. A review of atmospheric chemistry research in China: Photochemical smog, haze pollution, and gas-aerosol interactions. Adv. Atmos. Sci. 2012, 29, 1006–1026. [Google Scholar] [CrossRef]
  4. Ma, J.; Zhou, X. Summertime tropospheric ozone over China simulated with a regional chemical transport model 2. Source contributions and budget. J. Geophys. Res. 2002, 107, ACH 2-1–ACH 2-11. [Google Scholar] [CrossRef]
  5. Ma, J.; Liu, H.; Hauglustaine, D. Summertime tropospheric ozone over China simulated with a regional chemical transport model 1. Model description and evaluation. J. Geophys. Res. 2002, 107, 4660. [Google Scholar] [CrossRef]
  6. Granier, C.; Bessagnet, B.; Bond, T.; D’Angiola, A.; Denier van der Gon, H.; Frost, G.J.; Heil, A.; Kaiser, J.W.; Kinne, S.; Klimont, Z.; et al. Evolution of anthropogenic and biomass burning emissions of air pollutants at global and regional scales during the 1980–2010 period. Clim. Change 2011, 109, 163–190. [Google Scholar] [CrossRef]
  7. Zhao, B.; Wang, P.; Ma, J.Z.; Zhu, S.; Pozzer, A.; Li, W. A high-resolution emission inventory of primary pollutants for the Huabei region, China. Atmos. Chem. Phys. 2012, 12, 481–501. [Google Scholar] [CrossRef] [Green Version]
  8. Lee, D.S.; Köhler, I.; Grobler, E.; Rohrer, F.; Sausen, R.; Gallardo-Klenner, L.; Olivier, J.G.J.; Dentener, F.J.; Bouwman, A.F. Estimations of global NOx emissions and their uncertainties. Atmos. Environ. 1997, 31, 1735–1749. [Google Scholar] [CrossRef]
  9. Stavrakou, T.; Müller, J.F.; De Smedt, I.; Van Roozendael, M.; van der Werf, G.R.; Giglio, L.; Guenther, A. Evaluating the performance of pyrogenic and biogenic emission inventories against one decade of space-based formaldehyde columns. Atmos. Chem. Phys. 2009, 9, 1037–1060. [Google Scholar] [CrossRef] [Green Version]
  10. Jin, X.M.; Holloway, T. Spatial and temporal variability of ozone sensitivity over China observed from the Ozone Monitoring Instrument. J. Geophys. Res. Atmos. 2015, 120, 7229–7246. [Google Scholar] [CrossRef]
  11. Liu, H.; Liu, C.; Xie, Z.; Li, Y.; Huang, X.; Wang, S.; Xu, J.; Xie, P. A paradox for air pollution controlling in China revealed by “APEC Blue” and “Parade Blue”. Sci. Rep. 2016, 6, 34408. [Google Scholar] [CrossRef] [Green Version]
  12. Sun, Y.; Liu, C.; Palm, M.; Vigouroux, C.; Notholt, J.; Hu, Q.; Jones, N.; Wang, W.; Su, W.; Zhang, W.; et al. Ozone seasonal evolution and photochemical production regime in the polluted troposphere in eastern China derived from high-resolution Fourier transform spectrometry (FTS) observations. Atmos. Chem. Phys. 2018, 18, 14569–14583. [Google Scholar] [CrossRef] [Green Version]
  13. Zhang, X.; Yan, B.; Du, C.; Cheng, C.; Zhao, H. Quantifying the interactive effects of meteorological, socioeconomic, and pollutant factors on summertime ozone pollution in China during the implementation of two important policies. Atmos. Pollut. Res. 2021, 12, 101248. [Google Scholar] [CrossRef]
  14. Tang, G.; Liu, Y.; Huang, X.; Wang, Y.; Hu, B.; Zhang, Y.; Song, T.; Li, X.; Wu, S.; Li, Q.; et al. Aggravated ozone pollution in the strong free convection boundary layer. Sci. Total Environ. 2021, 788, 147740. [Google Scholar] [CrossRef] [PubMed]
  15. Liu, C.; Gao, M.; Hu, Q.; Brasseur, G.P.; Carmichael, G.R. Stereoscopic Monitoring: A Promising Strategy to Advance Diagnostic and Prediction of Air Pollution. B. Am. Meteorol. Soc. 2021, 102, E730–E737. [Google Scholar] [CrossRef]
  16. Wang, Y.; Dörner, S.; Donner, S.; Böhnke, S.; De Smedt, I.; Dickerson, R.R.; Dong, Z.; He, H.; Li, Z.; Li, Z.; et al. Vertical profiles of NO2, SO2, HONO, HCHO, CHOCHO and aerosols derived from MAX-DOAS measurements at a rural site in the central western North China Plain and their relation to emission sources and effects of regional transport. Atmos. Chem. Phys. 2019, 19, 5417–5449. [Google Scholar] [CrossRef] [Green Version]
  17. Liu, R.; Feng, T.; Guo, Y.; Wang, H.; Ming, R.; Wang, S.; Zhou, B. Study on ozone sensitivity in typical tropical region from DOAS ground-to-space measurements. Acta Sci. Circumstantiae 2021, 41, 2262–2271. (In Chinese) [Google Scholar]
  18. Luo, Y.; Dou, K.; Fan, G.; Huang, S.; Si, F.; Zhou, H.; Wang, Y.; Pei, C.; Tang, F.; Yang, D.; et al. Vertical distributions of tropospheric formaldehyde, nitrogen dioxide, ozone and aerosol in southern China by ground-based MAX-DOAS and LIDAR measurements during PRIDE-GBA 2018 campaign. Atmos. Environ. 2020, 226, 117384. [Google Scholar] [CrossRef]
  19. Ren, B.; Xie, P.; Xu, J.; Li, A.; Qin, M.; Hu, R.; Zhang, T.; Fan, G.; Tian, X.; Zhu, W.; et al. Vertical characteristics of NO2 and HCHO, and the ozone formation regimes in Hefei, China. Sci. Total Environ. 2022, 823, 153425. [Google Scholar] [CrossRef]
  20. Tanvir, A.; Javed, Z.; Jian, Z.; Zhang, S.; Bilal, M.; Xue, R.; Wang, S.; Bin, Z. Ground-Based MAX-DOAS Observations of Tropospheric NO2 and HCHO During COVID-19 Lockdown and Spring Festival Over Shanghai, China. Remote Sens. 2021, 13, 488. [Google Scholar] [CrossRef]
  21. Xue, J.; Zhao, T.; Luo, Y.; Miao, C.; Su, P.; Liu, F.; Zhang, G.; Qin, S.; Song, Y.; Bu, N.; et al. Identification of ozone sensitivity for NO2 and secondary HCHO based on MAX-DOAS measurements in northeast China. Environ. Int. 2022, 160, 107048. [Google Scholar] [CrossRef]
  22. Zong, R.; Yang, X.; Wen, L.; Xu, C.; Zhu, Y.; Chen, T.; Yao, L.; Wang, L.; Zhang, J.; Yang, L.; et al. Strong ozone production at a rural site in the North China Plain: Mixed effects of urban plumesand biogenic emissions. J. Environ. Sci. 2018, 71, 261–270. [Google Scholar] [CrossRef] [PubMed]
  23. Tan, Z.; Lu, K.; Dong, H.; Hu, M.; Li, X.; Liu, Y.; Lu, S.; Shao, M.; Su, R.; Wang, H.; et al. Explicit diagnosis of the local ozone production rate and the ozone-NOx-VOC sensitivities. Sci. Bull. 2018, 63, 1067–1076. [Google Scholar] [CrossRef] [Green Version]
  24. Chi, X.; Liu, C.; Xie, Z.; Fan, G.; Wang, Y.; He, P.; Fan, S.; Hong, Q.; Wang, Z.; Yu, X.; et al. Observations of ozone vertical profiles and corresponding precursors in the low troposphere in Beijing, China. Atmos. Res. 2018, 213, 224–235. [Google Scholar] [CrossRef]
  25. Cheng, S.; Jin, J.; Ma, J.; Xu, X.; Ran, L.; Ma, Z.; Chen, J.; Guo, J.; Yang, P.; Wang, Y.; et al. Measuring the Vertical Profiles of Aerosol Extinction in the Lower Troposphere by MAX-DOAS at a Rural Site in the North China Plain. Atmosphere 2020, 11, 1037. [Google Scholar] [CrossRef]
  26. Zhang, L.; Yan, P.; Mao, J.; Zhang, X.; Tian, P.; Chang, H. Observation study on aerosol scattering phase function at Raoyang of Hebei, China. J. Appl. Meteorol. Sci. 2017, 28, 436–446. (In Chinese) [Google Scholar]
  27. Wang, R.; Xu, X.; Jia, S.; Ma, R.; Ran, L.; Deng, Z.; Lin, W.; Wang, Y.; Ma, Z. Lower tropospheric distributions of O3 and aerosol over Raoyang, a rural site in the North China Plain. Atmos. Chem. Phys. 2017, 17, 3891–3903. [Google Scholar] [CrossRef] [Green Version]
  28. Ran, L.; Deng, Z.; Xu, X.; Yan, P.; Lin, W.; Wang, Y.; Tian, P.; Wang, P.; Pan, W.; Lu, D. Vertical profiles of black carbon measured by a micro-aethalometer in summer in the North China Plain. Atmos. Chem. Phys. 2016, 16, 10441–10454. [Google Scholar] [CrossRef] [Green Version]
  29. Peng, W.; Wang, Y.; Gao, X.; Jia, S.; Xu, X.; Cheng, H.; Meng, Z. Characteristics of ambient formaldehyde at two rural sites in the North China Plain in summer. Res. Environ. Sci. 2016, 29, 1119–1127. (In Chinese) [Google Scholar]
  30. Cheng, S.; Ma, J.; Cheng, W.; Yan, P.; Zhou, H.; Zhou, L.; Yang, P. Tropospheric NO2 vertical column densities retrieved from ground-based MAX-DOAS measurements at Shangdianzi regional atmospheric background station in China. J. Environ. Sci. 2019, 80, 186–196. [Google Scholar] [CrossRef]
  31. Ma, J.; Dörner, S.; Donner, S.; Jin, J.; Cheng, S.; Guo, J.; Zhang, Z.; Wang, J.; Liu, P.; Zhang, G.; et al. MAX-DOAS measurements of NO2, SO2, HCHO, and BrO at the Mt. Waliguan WMO GAW global baseline station in the Tibetan Plateau. Atmos. Chem. Phys. 2020, 20, 6973–6990. [Google Scholar] [CrossRef]
  32. Ma, J.Z.; Beirle, S.; Jin, J.L.; Shaiganfar, R.; Yan, P.; Wagner, T. Tropospheric NO2 vertical column densities over Beijing: Results of the first three years of ground-based MAX-DOAS measurements (2008–2011) and satellite validation. Atmos. Chem. Phys. 2013, 13, 1547–1567. [Google Scholar] [CrossRef] [Green Version]
  33. Jin, J.; Ma, J.; Lin, W.; Zhao, H.; Shaiganfar, R.; Beirle, S.; Wagner, T. MAX-DOAS measurements and satellite validation of tropospheric NO2 and SO2 vertical column densities at a rural site of North China. Atmos. Environ. 2016, 133, 12–25. [Google Scholar] [CrossRef]
  34. Platt, U.; Stutz, J. Differential Optical Absorption Spectroscopy, Principles and Applications; Springer: Berlin, Germany, 2008; pp. 135–175. [Google Scholar]
  35. Hönninger, G.; Friedeburg, C.v.; Platt, U. Multi axis differential optical absorption spectroscopy (MAX-DOAS). Atmos. Chem. Phys. 2004, 4, 231–254. [Google Scholar] [CrossRef] [Green Version]
  36. Wang, Y.; Lampel, J.; Xie, P.; Beirle, S.; Li, A.; Wu, D.; Wagner, T. Ground-based MAX-DOAS observations of tropospheric aerosols, NO2, SO2 and HCHO in Wuxi, China, from 2011 to 2014. Atmos. Chem. Phys. 2017, 17, 2189–2215. [Google Scholar] [CrossRef] [Green Version]
  37. Ryan, R.G.; Rhodes, S.; Tully, M.; Schofield, R. Surface ozone exceedances in Melbourne, Australia are shown to be under NOx control, as demonstrated using formaldehyde:NO2 and glyoxal:formaldehyde ratios. Sci. Total Environ. 2020, 749, 141460. [Google Scholar] [CrossRef]
  38. Hong, Q.; Liu, C.; Hu, Q.; Zhang, Y.; Xing, C.; Su, W.; Ji, X.; Xiao, S. Evaluating the feasibility of formaldehyde derived from hyperspectral remote sensing as a proxy for volatile organic compounds. Atmos. Res. 2021, 264, 105777. [Google Scholar] [CrossRef]
  39. Duncan, B.N.; Yoshida, Y.; Olson, J.R.; Sillman, S.; Martin, R.V.; Lamsal, L.; Hu, Y.; Pickering, K.E.; Retscher, C.; Allen, D.J.; et al. Application of OMI observations to a space-based indicator of NOx and VOC controls on surface ozone formation. Atmos. Environ. 2010, 44, 2213–2223. [Google Scholar] [CrossRef] [Green Version]
  40. Souri, A.H.; Nowlan, C.R.; Wolfe, G.M.; Lamsal, L.N.; Chan Miller, C.E.; Abad, G.G.; Janz, S.J.; Fried, A.; Blake, D.R.; Weinheimer, A.J.; et al. Revisiting the effectiveness of HCHO/NO2 ratios for inferring ozone sensitivity to its precursors using high resolution airborne remote sensing observations in a high ozone episode during the KORUS-AQ campaign. Atmos. Environ. 2020, 224, 117341. [Google Scholar] [CrossRef]
  41. Duncan, B.N.; Yoshida, Y.; Damon, M.R.; Douglass, A.R.; Witte, J.C. Temperature dependence of factors controlling isoprene emissions. Geophys. Res. Lett. 2009, 36, L05813. [Google Scholar] [CrossRef]
  42. Archibald, A.T.; Neu, J.L.; Elshorbany, Y.F.; Cooper, O.R.; Young, P.J.; Akiyoshi, H.; Cox, R.A.; Coyle, M.; Derwent, R.G.; Deushi, M.; et al. Tropospheric Ozone Assessment Report: A critical review of changes in the tropospheric ozone burden and budget from 1850 to 2100. Elem. Sci. Anthropocene 2020, 8, 34. [Google Scholar] [CrossRef]
  43. Hendrick, F.; Müller, J.-F.; Clémer, K.; Wang, P.; Mazière, M.D.; Fayt, C.; Gielen, C.; Hermans, C.; Ma, J.Z.; Pinardi, G.; et al. Four years of ground-based MAX-DOAS observations of HONO and NO2 in the Beijing area. Atmos. Chem. Phys. 2014, 14, 765–781. [Google Scholar] [CrossRef] [Green Version]
  44. Javed, Z.; Liu, C.; Khokhar, M.F.; Tan, W.; Liu, H.R.; Xing, C.Z.; Ji, X.G.; Tanvir, A.; Hong, Q.Q.; Sandhu, O.; et al. Ground-Based MAX-DOAS Observations of CHOCHO and HCHO in Beijing and Baoding, China. Remote Sens. 2019, 11, 1524. [Google Scholar] [CrossRef] [Green Version]
  45. Zhu, S.; Li, X.; Yu, C.; Wang, H.; Wang, Y.; Miao, J. Spatiotemporal Variations in Satellite-Based Formaldehyde (HCHO) in the Beijing-Tianjin-Hebei Region in China from 2005 to 2015. Atmosphere 2018, 9, 5. [Google Scholar] [CrossRef] [Green Version]
  46. Hou, Y.F.; Wang, L.T.; Zhou, Y.; Wang, S.X.; Liu, W.L.; Zhu, J.F. Analysis of the tropospheric column nitrogen dioxide over China based on satellite observations during 2008–2017. Atmos. Pollut. Res. 2019, 10, 651–655. [Google Scholar] [CrossRef]
Figure 1. (a) Geographical location of the Raoyang meteorological station in China and (b) satellite image of the major neighborhood cities around Raoyang observatory, marked by white and red dots, respectively.
Atmosphere 13 00860 g001
Figure 2. Example of spectral fitting for (a) NO2 and (b) HCHO. Black and red curves with symbols indicate the measured and fitted differential optical depth, respectively. The fitted NO2 and HCHO dSCDs are 3.73 × 10¹⁶ molec·cm−2 and 7.07 × 10¹⁶ molec·cm−2, respectively. The corresponding root mean square (RMS) of fitting residuals between measured and fitted spectra are 7.98 × 10⁻⁴ and 8.81 × 10⁻⁴, respectively.
Atmosphere 13 00860 g002
Figure 3. Correlation of the hourly averaged (a) NO2 and (b) HCHO VMRs (black dots) between in situ measurement and MAX-DOAS retrieval in the near-surface layer. The red lines indicate the linear fit between both data sets. The unit conversion between “ppb” and “molec·cm−3” for MAX-DOAS observation is achieved by the coefficient of 2.5 × 10¹⁰.
Atmosphere 13 00860 g003
Figure 4. Vertical profiles of (a) NO2 and (b) HCHO VMRs. The black lines with squares represent the profiles averaged by all the valid NO2 (HCHO) profiles during the effective observation period. According to the mean and standard deviation of all the valid NO2 (HCHO) VCDs, the corresponding profiles are averaged on the condition of NO2 (HCHO) VCDs larger than “mean + standard deviation” (the red lines with dots) or smaller than “mean − standard deviation” (the blue lines with triangles), respectively. The error bars denote the standard deviations of NO2 (HCHO) VMRs at different altitudes.
Atmosphere 13 00860 g004
Figure 5. Diurnal variations of (a) NO2 VMR profiles, (c) NO2 VCD and (e) NO2 VMR in the lowest layer based on the qualified hourly MAX-DOAS data as well as coincident meteorological conditions; (g) diurnal pattern of in situ surface RH and T; (h) diurnal variations of in situ wind direction and speed presented by vector arrow and PBLH from linearly interpolated reanalysis data. (b,d,f) are separately the same as (a,c,e) except for HCHO. Lower (upper) error bars, boxes and lower (upper) triangles in (cf) are the 5th (95th), 25th (75th) percentiles, minima (maxima) of the data grouped in each hour, respectively. Hyphens inside the boxes and red curves with circles in (cf) separately denote the medians and the averages. The numbers of integrated sampling days for specific hour are labeled at the top axis in (cf). The error bar in (g,h) denotes the standard deviation, and the scale of wind vector is also shown by a horizontal arrow in (h). The time shown in the figures is Beijing time (BJ).
Atmosphere 13 00860 g005
Figure 6. Averaged vertical profile of (a) VMR ratio of HCHO to NO2. Diurnal variation of (b) vertical profiles of VMR ratios of HCHO to NO2 as well as (c) HCHO/NO2 ratios of VCD and VMR in the lowest layer. The color blocks are not shown in (b), once the HCHO VMRs are smaller than 1ppb or larger than 10 ppb. The 1:1 and 2:1 ratios of HCHO/NO2 in (c) are also shown by the colored dashed lines.
Atmosphere 13 00860 g006
Figure 7. Relationship of HCHO and NO2 to O3 and meteorological conditions. (a) HCHO vs NO2 VCD daytime (7:00–18:00 BJ) averages, colored by the range of surface O3 daytime variation. (b) is same as (a), but for HCHO vs NO2 VMR daytime averages in the lowest layer. (ce) is similar to (b), but separately colored by daytime averages of air temperature, relative humidity and wind speed. (f) Rose showing the frequency of VMR ratios of HCHO to NO2 in 16 wind sectors. The ratios of HCHO/NO2 = 1:1 and 2:1 are also presented by the dash lines in (ae).
Atmosphere 13 00860 g007
Table 1. Averages for the NO2 and HCHO concentrations as well as corresponding meteorological parameters.
ParametersNO2HCHO
AllLargerSmallerAllLargerSmaller
VCD/1016 molec·cm−21.02 ± 0.512.03 ± 0.600.47 ± 0.042.32 ± 0.563.29 ± 0.461.51 ± 0.18
VMR/ppb3.23 ± 2.707.56 ± 3.271.03 ± 0.335.62 ± 2.117.50 ± 2.594.20 ± 1.53
Temperature/°C302633302928
RH/%556642556158
WD/°12035398120131263
WS/m·s−12.21.82.22.21.62.8
PBLH/km1.160.461.561.160.990.95
Publisher’s Note: MDPI stays neutral with regard to jurisdictional claims in published maps and institutional affiliations.

