Abstract
Although there is a growing interest in the association between ambient temperatures and mortality, little evidence is available for Thessaloniki, the second largest city of Greece. In this study, we present an assessment of the effects of temperature on daily mortality from 2006 to 2016 in the urban area of Thessaloniki, by describing the exposure-lag-response association between temperature and cause-specific mortality with the use of a distributed lag non-linear model (DLNM). A J-shaped relationship was found between temperature and mortality. The highest values of risk were evident for respiratory (RR > 10) and cardiovascular causes (RR > 3), probably due to the fact that health status of individuals with chronic respiratory and cardiovascular diseases rapidly deteriorates during hot periods. Cold effects had longer lags of up to 15 days, whereas heat effects were short-lived, up to 4 days. Percentage change in all- and cause-specific mortality per 1 °C change above and below Minimum Mortality Temperature showed a larger increase for all-cause mortality in heat (1.95%, 95% CI: 1.07–2.84), in contrast to a smaller increase in cold (0.54%, 95% CI: 0, 1.09). Overall, 3.51% of all-cause deaths were attributable to temperature, whereas deaths attributed to heat (2.34%) were more than deaths attributed to cold (1.34%). The findings of this study present important evidence for planning public-health interventions, to reduce the health impact of extreme temperatures.
1. Introduction
The interactions between ambient temperature and human health have emerged as major issues in the global research community during recent years. Not only extreme temperatures [1,2,3], but also changes in moderate temperatures have been shown to present a direct increase in mortality [4]. Meanwhile, climate change is recognized as one of the most imperative global health threats in the 21st century [5]. Several areas around the globe are at high risk not only in present [6] but in future climate as well [7].
The Mediterranean area is particularly susceptible to temperature increases and it is anticipated to experience more intense, severe and frequent heat waves under warmer and drier future conditions [8,9,10]. Concerning Greece, located in southeast Mediterranean, the average temperature under a “business as usual” scenario (Representative Concentration Pathway RCP8.5) is projected to increase by 4.5 °C in summer and 2.6 °C in winter, until 2100 [5]. Taken into consideration poor air quality, comfort conditions become even more unfavorable during heat wave episodes [11].
Global warming is generally predicted to lead to both an increase in heat-related mortality and a decrease in cold-related mortality [12]. Nevertheless, it is well established that the temperature–mortality relationships demonstrate strong dependencies on local climate characteristics and vary significantly among study areas [13]. Therefore, it is of vital importance to conduct local-based environmental epidemiology studies and thorough investigation on the city level, in order to deliver robust heat-health action plans for the improvement and strengthening of public decision making and health care [14]. These action plans should also include meteorological variables such as relative humidity and precipitation, when possible, in order to better formulate adaptation strategies and measures [15,16]. Associating ambient temperatures with health outcomes poses significant challenges. To model the temperature–health dependencies, the dose–response association, which is non-linear and heterogeneous between populations with different demographic characteristics, should be taken into consideration [17]. In addition, the impact of the exposure event may not be immediate, but rather delayed in time by a few days or even weeks (defined lags). Sophisticated statistical approaches are necessary to describe such complex patterns.
Distributed lag non-linear models (DLNMs) is a flexible modeling framework capable of simultaneously representing the nonlinear and delayed effects of temperature on mortality. In addition to the usual exposure–response relationship over the space of the predictor, the lag dimension represents a new space over which the association is defined, by describing a lag–response relationship. The dependency is characterized in the bi-dimensional space of predictor and lag, and it is defined as an exposure-lag-response association [18]. DLNMs have been successfully applied in previous temperature-related epidemiological studies: Nordio et al. [19] investigated 211 US cities from 1962 to 2006, accounting for hot and cold temperatures at different lags, to evaluate change of associations over space and time. An extensive analysis between 1998 and 2012 estimated the location-specific temperature–mortality relationships of 147 regions in 16 European countries [20], and de’Donato et al. [21] evaluated the patterns of changes in the temperature–mortality relationship and the number of deaths attributable to heat in nine European cities before and after summer 2003 (1996–2002 and 2004–2010), also controlling for air pollution.
Greece lies within the Mediterranean climate change hotspot, and according toWHO, more than 400 heat-attributable deaths per year are expected in Athens for 2030 under RCP8.5 [22]. Previous studies concerning Athens showed an increase in cardiovascular and respiratory mortality among the elderly (65 years and over) by 20% to 35% respectively [23], and reported a 5.54% increase in natural mortality above the city-specific threshold [24]. Last, a recent study of Zafeiratou et al. investigated the intra-urban differentiation in the temperature–mortality effects of 42 Municipalities within the Greater Athens Area, showing an increase on all-cause, cardiovascular and respiratory mortality for increases in temperatures [25].
As it has been made evident, the literature focuses almost entirely on Athens, with the rest of Greek urban agglomerations being under-represented. The recent study by Kouis et al. [26] is the first significant contribution for the greater area of Thessaloniki, on the association between high ambient air temperature and cardio-respiratory mortality from 1999 to 2012. The study shows significant effects of heat above the temperature threshold of 33 °C. Furthermore, cardiovascular and respiratory mortality risk increased by 4.4% and 5.9% above the threshold, respectively.
The motivation of this study is two-fold. On one side, global warming leads to climate changes over various spatiotemporal scales. Future alterations in climate extremes is likely to severely impact all sectors of life, namely agriculture, river basins, coastal systems or tourism [27]. More importantly, the subsequent response of extreme temperatures to global warming is particularly concerning, as exceptionally high temperatures are expected to be experienced by large parts of population due to climate change, and increase up to 4.4 °C by the end of century [28]. As a result, heat waves are increasing in frequency, duration and intensity [29]. Exposure to heat presents adverse effects on human health, which is the second aspect of this paper’s drive. Increased mortality [30] and morbidity [31] are documented in various study areas, along with heat fatigue, heat cramps, heat syncope, heat exhaustion and heat stroke [32].
Additionally to the prior, the absence of adequate investigation of Thessaloniki area on the matter of global warming and human health response to high temperatures indicates a scientific question that should be addressed. The present investigation aims to contribute to this scope, increasing the knowledge on the effects of heat on daily mortality in the urban area of Thessaloniki, Greece.
For such purposes, we investigate the association between daily maximum apparent temperature and daily all-cause (natural, non-accidental), cardiovascular, cerebrovascular and respiratory mortality and mortality concerning the elderly (all-causes, 65+ years) from 2006 to 2016 in the urban area of Thessaloniki, by describing the exposure-lag-response association with the use of a DLNM. We also examine the effect of time lag and non-optimum temperatures using measures such as relative risk and attributable fractions, as very little is known about the relative contribution of both heat and cold from moderate and extreme temperatures to the whole disease burden.
The present analysis is based on recent developments in statistical modeling to account for the versatile temperature–mortality dependencies. This single-city analysis demonstrates significant advantages, taking into consideration the size of the examined area, the city population lasting exposure to high temperatures and the increasing proportion of elderly people among urban dwellers. The data and methodology used in this work are described in Section 2 and Section 3 and contain detailed presentation of results, and Section 4 summarizes the major conclusions.
2. Data and Methods
2.1. Study Area
This study focuses on the urban area of Thessaloniki, consisting of six Municipalities and one Municipal Unit. Thessaloniki, the second largest city of Greece and one of the largest urban agglomerations in the Balkan Peninsula, is located in the northern part of the country accommodating approximately 1,000,000 inhabitants [33]. As shown in Figure 1, it is built along the north-east coast of the Thermaikos Gulf and its Mediterranean climate, with hot and dry summers and mild and wet winters, and is directly affected by the sea. The annual mean temperature is 15.9 °C, the annual mean relative humidity is 62.4%, the annual mean precipitation is 448.7 mm and the annual mean wind speed is 5.6 m/s [34].
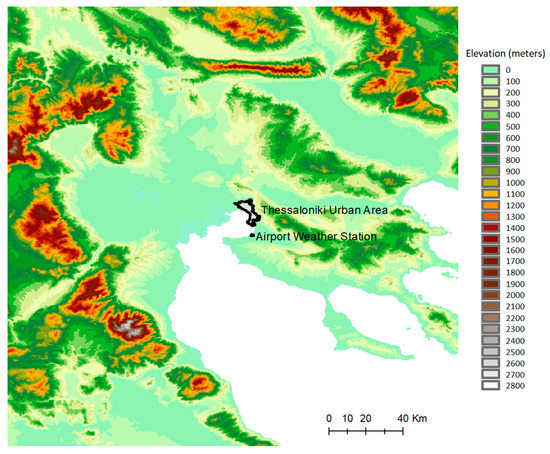
Figure 1.
The study area. Topography is shaded with linear altitude (above sea level) scales. The locations of Thessaloniki centre and Airport weather station are shown.
2.2. Meteorological and Mortality Data
Hourly values of temperature and dew-point temperature for the period 2006–2016 were obtained from the Makedonia Airport weather station (Longitude 22.97, Latitude 40.53, Elevation 2m), which is operated by the Hellenic National Meteorological Service. Previous studies, e.g., [35], have shown that uniformity and stability tests are performed to achieve better results when using in-situ data. Nevertheless, the meteorological dataset used in this study is provided by HNMS, responsible for Greece’s national weather forecast and certifier of the national weather network. Therefore, the evaluation performed on the data by the authors indicated no further assessment.
The exposure variable considered in the study is represented by Apparent Temperature, a thermal index that expresses thermal stress and comfort perceived by humans. To identify the most effective thermal predictor of heat-related mortality, we investigated daily mean temperature (Tmean, °C) and daily maximum Apparent Temperature (Tapp, °C). Tapp was computed from temperature and dew-point data as follows:
where Ta = air temperature (°C) and Td= dew point temperature (°C). Then, the daily maximum value was extracted (Tappmax), defined as the highest among hourly values.
Tapp = −2.653 + 0.994 × Ta + 0 0153 × Td2
Tapp is a discomfort index widely used in the literature [21,36] and it is used operationally as the main thermal index in the Italian National Heat Health Watch Warning Systems [37]. It is also found that Tapp is an optimal indicator for predicting all-cause mortality risk and for activating heat alerts and warnings [38,39].
The Hellenic Statistical Authority (ELSTAT) provided the daily mortality data, including age and cause of death for all Municipalities in the urban area of Thessaloniki for the study period (2006–2016). The causes of death were classified to All causes (natural, non-accidental), Cardiovascular, Cerebrovascular and Respiratory, according to ICD-10 (International Classification of Diseases, 10th version). A focus on elderly total mortality was carried out, considering all total deaths among people aged 65 years and older.
2.3. Data Analysis
When assessing the mortality–temperature relationship in a specific area, the most appropriate temperature-based index needs to be investigated [4]. Various studies have been conducted on the matter but were unable to draw a decisive conclusion [40,41], whereas in order to adopt an appropriate temperature index, regional meteorological characteristics and the disease status of population should be considered.
In the present study, we investigate the effect of temperature-related variables on mortality for the urban area of Thessaloniki during the period 2006–2016, using Distributed Lag Non-linear Models in order to simultaneously account for the non-linear and lagged effect of temperatures on mortality, as previously presented in the literature [42,43,44,45]. The main advantage of this method is that it provides a detailed representation of the time-course of the exposure–response relationship, which then estimates the overall effect in the presence of delayed contributions. This family of models is implemented in the package DLNM [46] within the statistical environment R (R version 4.1.1; R Foundation for Statistical Computing https://www.r-project.org/foundation/ (accessed on 14 April 2022)).
According to the Akaike information criterion (AIC) [43], we applied a generalized non-linear model with quasi-Poisson family, with the following choices regarding the control of confounders for the effect of temperature index: (i) natural cubic splines to describe the exposure–response function; (ii) natural cubic splines to describe the lag–response function; (iii) knots were placed at quantiles (10th, 75th, 90th) in the range of temperature variables and at equal intervals in the logarithmic scale of lags; (iv) maximum lag was set to 20 days; (v) indicator variables were chosen for day of the week and 6 degrees of freedom per year were set to describe long-time trends and seasonality.
To evaluate the best model specification concerning the exposure variable, we compared the constructed models with Tmean and Tappmax using:
- (a)
- The Quasi Akaike Information Criterion (QAIC), a modified version of AIC to deal with the over-dispersed Poisson model, which can be used to assess the model fit of the quasi-Poisson regression model. It considers both the statistical fitness of the model and the number of parameters fitted [47].
- (b)
- The partial autocorrelation function (PACF) criterion calculated as the absolute value of the sum of the partial autocorrelations of the residuals from lags 1 to 20 [48]. PACF investigates the remaining autocorrelation.
The best model is chosen when/if both QAIC and PACF are minimized at the same time. These two criteria are widely used in time series analysis to decide for the best fit [49,50,51].
Table 1 reports QAIC and PACF values for the two models. Based on these, Tappmax can be uniformly chosen as the most representative exposure variable for Thessaloniki for our dataset.

Table 1.
Model fit statistical criteria per exposure variable.
3. Results and Discussion
During the 11-year study period, we analyzed 73,990 deaths from all natural causes—21,811 from cardiovascular diseases, 10,007 from cerebrovascular causes and 7134 from respiratory causes. Moreover, total mortality concerning the elderly counted 62,482 deaths. Table 2 provides the descriptive statistics on exposure variable Tappmax (bottom panel) and daily mortality (top panel) during the study period. Elderly mortality is distinctively noticeable, as Greece is among the countries with the highest proportion of elderly population in Europe [52]. It is also evident that cardiovascular deaths account for an important part of cause-specific daily mortalities. This result is supported by [53], which reported that stroke and ischemic heart disease is the leading causes of death in Greece.

Table 2.
Summary statistics of daily mortality (number of deaths, top) and Tappmax (°C, bottom).
Figure 2 displays the bi-dimensional exposure-lag-response surface of the fitted RR in a three-dimensional diagram for maximum apparent temperature and lag values. The association between Tappmax and mortality is non-linear, suggesting an immediate increase in mortality for exposures to high levels of Tappmax at lag days 1–3, whereas for low levels the effect is delayed (day 10–15).
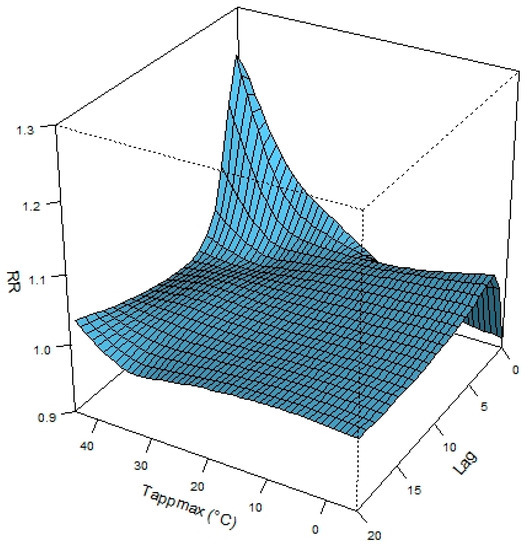
Figure 2.
Exposure-lag-response risk surface demonstrating the nonlinear association between temperature and mortality, as calculated for the city of Thessaloniki for the period 2006–2016.
Figure 3 top panel shows an overall cumulative exposure–response curve (with 95% CI marked as grey areas), interpreted as the risk cumulated over the entire lag period of 20 days, and Tappmax range as a frequency histogram. Dashed lines define extreme temperatures (5th and 95th percentile, 2.5 °C and 35 °C respectively) and dotted line represents minimum mortality temperature (MMT) at 22 °C.
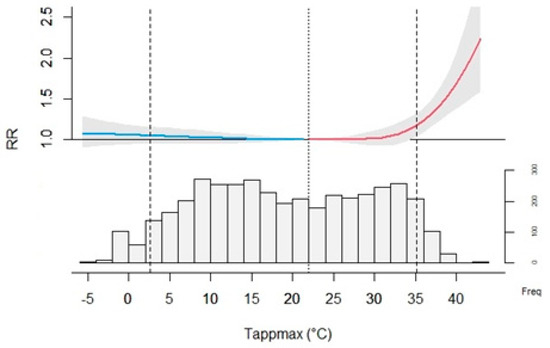
Figure 3.
Overall cumulative exposure-response association (top panel) and Tappmax distribution (bottom panel), as calculated for the city of Thessaloniki for the period 2006–2016.
Identifying MMT has important practical implications for the investigation of the relationship between temperature and mortality and the definition of non-optimum temperatures, as mortality rates increase at temperatures outside local MMT [54]. Studies have shown that MMT varies from city to city, according to local climate and latitude [55]. The values in the present work were anticipated for a Mediterranean city [26,54], although for respiratory mortality, MMΤ was found to be lower. Generally, MMT levels are higher for Mediterranean cities than those in Northern Europe, indicating that residents of south-coastal cities are acclimatized to heat and risk conditions [24].
Risk increases rather slowly for cold temperatures below MMT and shows a more prominent exponential rise below the 5th percentile of Tappmax, although it is not statistically significant for Thessaloniki. Similarly, hot temperatures between MMT and 95th percentile depict a slow, insignificant increase in RR, with a significant effect only for extreme values above 35 °C, reaching the highest RR values at 43 °C.
Table 3 summarizes the effect of heat and cold on cause-specific mortality and mortality of the elderly. Results show statistically significant effects of high temperatures on total and cause-specific mortality with a greater risk for respiratory deaths (RR 1.47, CI 95% 0.9–2.4), as shown in previous studies [56]. In Thessaloniki, exposure to cold (Tappmax between 5th percentile and MMT) did not show a significant effect on mortality.

Table 3.
Relative risks of daily cause-specific mortality and elderly mortality associated with non-optimum ambient temperatures, for changes below and above MMT and the 95th and 5th percentile.
Figure 4 illustrates the non-linear effects of Tappmax (lag 0–20) on cause-specific and elderly mortality. The exposure–response curves show the typical J-shape with an increase in the risk of mortality for high temperatures. U, J or V-shaped relationships between temperature (or temperature-based thermal indices) and mortality have been identified in many previous studies [3,36,56,57,58,59], with optimum temperature corresponding to the lowest point in the curve; the shape of the curve may vary by geographic locations, climatic characteristics and demographic factors [19,56,60]. It is worth noting that respiratory mortality risk reaches very high values (RR > 10), as found in other studies [59].
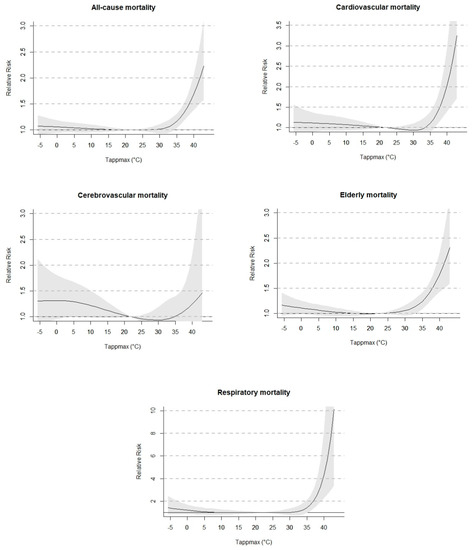
Figure 4.
Cumulative exposure-response curves between daily Tappmax and cause-specific mortality and elderly mortality, over lag days 0–20, as calculated for the city of Thessaloniki for the period 2006–2016. 95% CI marked as grey areas.
As shown in Figure 5, the mortality risks of extreme cold Tappmax, defined as the 5th percentile at 2.5 °C, reach maximum values on day 3 and subsequently decrease until day 10 (all-cause, cardiovascular, elderly) to 15 (cerebrovascular, respiratory).
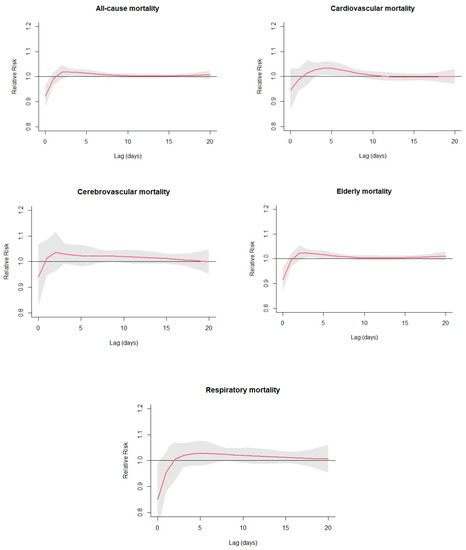
Figure 5.
Non-linear effects of extreme cold Tappmax on daily cause-specific mortality and elderly mortality at lag 0–20, as calculated for the city of Thessaloniki for the period 2006–2016. Effects were defined as the risks at 5th percentile of Tappmax distribution compared with the estimated MMT.
Figure 6 shows the estimated lag–response curves at the 95th percentile of Tappmax (35 °C) for various causes of mortality and elderly mortality. The graphs indicate strong risk in the first days, followed by a protective association (RR < 1) at longer lags for All-cause, Cerebrovascular, Respiratory and Elderly mortality. For respiratory and cerebrovascular mortality, there is a suggestive mortality displacement, or a harvesting effect, as the initial increase caused by an event of extreme temperatures is followed by a negative risk in mortality [24,26,61]. The overall shape of the curves is consistent with Kouis et al. who focused on Thessaloniki [26].
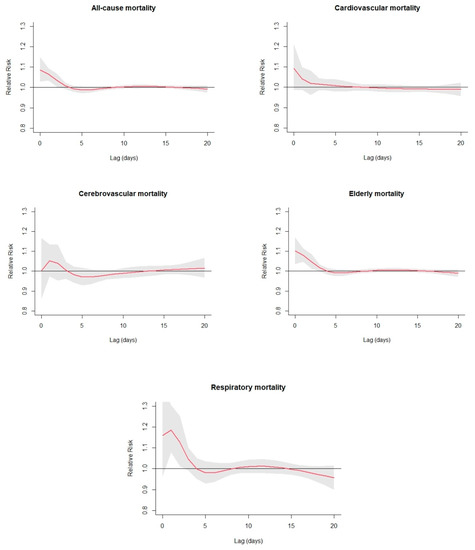
Figure 6.
Non-linear effects of extreme hot Tappmax on daily cause-specific mortality and elderly mortality at lag 0–20, as calculated for the city of Thessaloniki for the period 2006–2016. Effects were defined as the risks at 95th percentile of Tappmax distribution compared with the estimated MMT.
Percent change in mortality per 1 °C change above and below MMT (Table 4) shows a larger increase for all-cause mortality in heat (1.95%, 95% CI: 1.07–2.84), in contrast to smaller (insignificant) increases in cold (0.54%, 95% CI: 0–1.09). Cerebrovascular mortality is largely affected by cold (1.7%, 95% CI: 0.2–3.3), whereas the highest increase in mortality concerns respiratory causes in heat (5.07%, 95% CI: 2.1–8.1), followed by elderly mortality (2.36%, 95% CI: 1.34–3.34). Bunker et al. [62] reported that with 1 °C increase above the heat-related threshold, respiratory mortality was the most affected category, depicting the largest risk increase, followed by cardiovascular and cerebrovascular causes. This pattern is also evident in the present study. It is interesting to notice that, although heat risk is often associated with effects on the cardiovascular system, relative risks for cardiovascular mortality are no higher than those of most other causes of death, and remarkably lower than respiratory causes, a result found also in Gasparrini et al. [63]. Statistically insignificant results were obtained for cerebrovascular heat mortality (0.98%, 95% CI: −1.4–3.41), cardiovascular cold mortality (0.97%, 95% CI: −0.1–1.98), and respiratory cold mortality (1.48%, 95% CI: −0.3–3.24).

Table 4.
Percentage change in mortality per 1 °C change in Tappmax above and below MMT.
The estimation of the overall attributable fraction categorized per cause of death is reported in Table 5. Regarding All-cause mortality, 3.51% of deaths are attributed to temperature. The total attributable risk is then separated into components due to cold and hot temperatures, defined as those below and above MMT, respectively [64,65]. The comparison of the two contributions clearly indicates that heat is responsible for most of the all-cause mortality attributable to Tappmax, with an value equal of 2.34% compared to 1.34% for cold.

Table 5.
Cause-specific mortality and elderly mortality fraction (%) attributable to high and low levels of Tappmax.
Cardiovascular and cerebrovascular mortality is mostly attributed to cold temperatures, a result which is expected from the high MMTs of 30 °C. Mortality concerning the elderly and mortality due to respiratory causes are mostly attributed to heat (3.75% and 5.6% respectively).
The analysis is extended by further separating the attributable components into contributions from mild and extreme Tappmax as follows:
- (a)
- Extreme cold: minimum to 5th percentile
- (b)
- Mild cold: 5th percentile to MMT
- (c)
- Mild hot: MMT to 95th percentile
- (d)
- Extreme hot: 95th percentile to maximum
As indicated in Figure 7, which illustrates the attributable fractions of causes of mortality and elderly mortality associated with different components of non-optimum Tappmax, All-cause and Respiratory mortality are mainly attributed to extreme high values of Tappmax (1.35% and 3.3%, respectively). Mild cold Tappmax accounts for the majority of attributable mortality due to cardiovascular and cerebrovascular causes by far (7.21% and 11.6%, respectively). Lastly, Mild hot Tappmax is mostly responsible for Elderly mortality (2.22%).
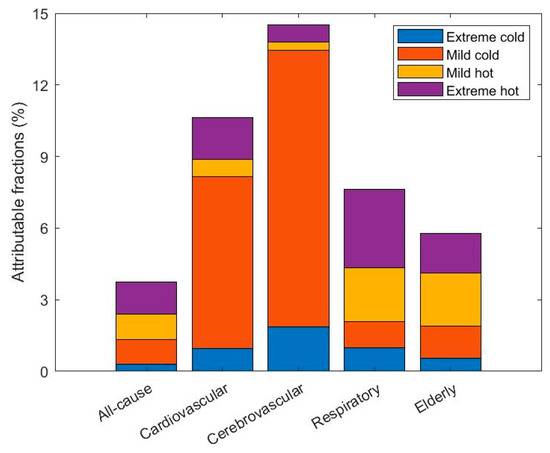
Figure 7.
Fractions of mortality and elderly mortality attributable to non-optimum Tappmax.
4. Conclusions
In the present study, the effects of Tappmax on daily mortality from 2006 to 2016 in the urban area of Thessaloniki, Greece, were assessed. DLNMs were used to examine the associations between thermal indicator Tappmax and cause-specific mortality, and to investigate the effect of time lag and non-optimum temperatures.
There is a documented association between high temperatures and mortality for Thessaloniki [65]. The present results come to agreement with recent work [22] and contribute further in increasing the knowledge concerning the effects of temperature on daily mortality in the urban area of Thessaloniki: (a) a wide range of mortality categories was investigated in the present study, covering the majority of deaths related to temperature with the use of a state-of-the-art statistical framework, (b) instead of choosing a single temperature parameter, we calculated Tappmax as a thermal index expressing thermal stress and comfort perceived by humans, and (c) we also examined the attributable fraction on non-optimum temperatures.
In Thessaloniki, extreme high temperatures strongly influence the risk in mortality. Strong exponential rise was evident over 35 °C, with further and more prominent increase with Tappmax values over 40 °C. J-shaped relationships were found between temperature and mortalities. Heat was short lived with an immediate effect (mortality increase), whereas cold had a prolonged effect.
Percent change in mortality per 1 °C change above and below MMT showed large increase for all-cause, cardiovascular and respiratory mortality in heat. Similarly, elderly mortality was also affected by heat. Taking into consideration the attributable fraction of mortality assigned to the various causes investigated, it was noted that overall 3.51% deaths were attributable to Tappmax. Deaths attributed to heat outnumbered deaths attributed to cold, with stronger impacts on respiratory mortality and among the elderly.
In conclusion, heat-attributable mortality in Thessaloniki was found to be mainly associated with high temperatures. Given the eminent vulnerability of the Mediterranean area to temperature rise due to climate change and the expected more frequent occurrence of heat wave episodes [7], these results could contribute to the decision-making process regarding extreme weather preparedness. The need to conduct heat health action plans for the implementation and coordination of extreme heat response activities that will reduce the negative impact of extreme heat is undeniable and requires high-resolution information on the association between temperature and mortality on the city-level.
The results of the present study can effectively contribute to this scope, whereas future work should be conducted to include not only major Greek cities but additional environmental stressors such as air pollutants as well, in order to draw decisive conclusions on the national frame. Investigating mortality behavior under the influence of climate change could be a critical next step.
Author Contributions
Conceptualization, D.P.; Data curation, D.P.; Methodology, D.P. and S.C.; Project administration, D.M.; Software, D.P.; Supervision, D.M.; Visualization, D.P.; Writing—original draft, D.P.; Writing—review and editing, D.P., S.C., C.G., S.C.K., S.P., F.d., C.S. and D.M. All authors have read and agreed to the published version of the manuscript.
Funding
This research was supported by the National Network on Climate Change and its Impacts—CLIMPACT, Public Investment Program of Greece, General Secretary of Research and Technology/Ministry of Development and Investments. 105658 17/10/2019.
Institutional Review Board Statement
Not applicable.
Data Availability Statement
Mortality data provided by ELSTAT are confidential. Meteorological data were acquired by https://www.ncdc.noaa.gov/cdo-web, accessed on 9 December 2020.
Conflicts of Interest
The authors declare no conflict of interest.
References
- Basu, R.; Samet, J.M. Relation between elevated ambient temperature and mortality: A review of the epidemiologic evidence. Epidemiol. Rev. 2002, 24, 190–202. [Google Scholar] [CrossRef] [PubMed]
- McGregor, G.R.; Bessemoulin, P.; Ebi, K.; Menne, B. Heatwaves and Health: Guidance on Warning-System Development; World Meteorological Organization and World Health Organization: Geneva, Switzerland, 2015; ISBN 9789263111425. [Google Scholar]
- Anderson, B.G.; Bell, M.L. Weather-Related Mortality. Epidemiology 2009, 20, 205–213. [Google Scholar] [CrossRef] [PubMed] [Green Version]
- Analitis, A.; Katsouyanni, K.; Biggeri, A.; Baccini, M.; Forsberg, B.; Bisanti, L.; Kirchmayer, U.; Ballester, F.; Cadum, E.; Goodman, P.G.; et al. Effects of cold weather on mortality: Results from 15 European cities within the PHEWE project. Am. J. Epidemiol. 2008, 168, 1397–1408. [Google Scholar] [CrossRef] [PubMed] [Green Version]
- Keppas, S.C.; Papadogiannaki, S.; Parliari, D.; Kontos, S.; Poupkou, A.; Tzoumaka, P.; Kelessis, A.; Zanis, P.; Casasanta, G.; De’donato, F.; et al. Future climate change impact on urban heat island in two mediterranean cities based on high-resolution regional climate simulations. Atmosphere 2021, 12, 884. [Google Scholar] [CrossRef]
- Iyakaremye, V.; Zeng, G.; Ullah, I.; Gahigi, A.; Mumo, R.; Ayugi, B. Recent Observed Changes in Extreme High-Temperature Events and Associated Meteorological Conditions over Africa. Int. J. Climatol. 2021, 1–16. [Google Scholar] [CrossRef]
- Ullah, I.; Saleem, F.; Iyakaremye, V.; Yin, J.; Ma, X.; Syed, S.; Hina, S.; Asfaw, T.G.; Omer, A. Projected Changes in Socioeconomic Exposure to Heatwaves in South Asia Under Changing Climate. Earth’s Future 2022, 10, e2021EF002240. [Google Scholar] [CrossRef]
- Giannaros, C.; Melas, D.; Giannaros, T.M. On the short-term simulation of heat waves in the Southeast Mediterranean: Sensitivity of the WRF model to various physics schemes. Atmos. Res. 2019, 218, 99–116. [Google Scholar] [CrossRef]
- Georgoulias, A.K.; Akritidis, D.; Kalisoras, A.; Kapsomenakis, J.; Melas, D.; Zerefos, C.S.; Zanis, P. Climate change projections for Greece in the 21st century from high-resolution EURO-CORDEX RCM simulations. Atmos. Res. 2022, 271, 106049. [Google Scholar] [CrossRef]
- Giannakopoulos, C.; Le Sager, P.; Bindi, M.; Moriondo, M.; Kostopoulou, E.; Goodess, C.M. Climatic changes and associated impacts in the Mediterranean resulting from a 2 °C global warming. Glob. Planet. Change 2009, 68, 209–224. [Google Scholar] [CrossRef]
- Papanastasiou, D.K.; Melas, D.; Kambezidis, H.D. Air quality and thermal comfort levels under extreme hot weather. Atmos. Res. 2015, 152, 4–13. [Google Scholar] [CrossRef]
- Watts, N.; Adger, W.N.; Agnolucci, P. Health and climate change: Policy responses to protect public health. Lancet 2015, 386, 1861–1914. [Google Scholar] [CrossRef]
- Armstrong, B.G.; Chalabi, Z.; Fenn, B.; Hajat, S.; Kovats, S.; Milojevic, A.; Wilkinson, P. Association of mortality with high temperatures in a temperate climate: England and Wales. J. Epidemiol. Community Health 2011, 65, 340–345. [Google Scholar] [CrossRef] [PubMed] [Green Version]
- Matthies, F.; Bickler, G.; Marin, N.; Hales, S. Heat–Health Action Plans-Guidance; World Health Organization: Geneva, Switzerland, 2008; Available online: http://www.euro.who.int/__data/assets/pdf_file/0006/95919/E91347.pdf (accessed on 29 April 2022).
- Sein, Z.M.M.; Ullah, I.; Iyakaremye, V.; Azam, K.; Ma, X.; Syed, S.; Zhi, X. Observed spatiotemporal changes in air temperature, dew point temperature and relative humidity over Myanmar during 2001–2019. Meteorol. Atmos. Phys. 2022, 134, 7. [Google Scholar] [CrossRef]
- Sein, Z.M.M.; Zhi, X.; Ullah, I.; Azam, K.; Ngoma, H.; Saleem, F.; Xing, Y.; Iyakaremye, V.; Syed, S.; Hina, S.; et al. Recent variability of sub-seasonal monsoon precipitation and its potential drivers in Myanmar using in-situ observation during 1981–2020. Int. J. Clim. 2022, 42, 3341–3359. [Google Scholar] [CrossRef]
- Gasparrini, A.; Guo, Y.; Hashizume, M. Mortality risk attributable to high and low ambient temperature: A multicounty observational study. Lancet 2015, 14, 464–465. [Google Scholar] [CrossRef]
- Gasparrini, A. Distributed Lag Linear and Non-Linear Models in R: The Package dlnm. J. Stat. Softw. 2011, 43, 1. Available online: http://www.lshtm.ac.uk/people/gasparrini.antonio/ (accessed on 29 April 2022). [CrossRef] [Green Version]
- Nordio, F.; Zanobetti, A.; Colicino, E.; Kloog, I.; Schwartz, J. Changing patterns of the temperature-mortality association by time and location in the US, and implications for climate change. Environ. Int. 2015, 81, 80–86. [Google Scholar] [CrossRef] [Green Version]
- Martínez-Solanas, È.; Quijal-Zamorano, M.; Achebak, H.; Petrova, D.; Robine, J.M.; Herrmann, F.R.; Rodó, X.; Ballester, J. Projections of temperature-attributable mortality in Europe: A time series analysis of 147 contiguous regions in 16 countries. Lancet Planet. Health 2021, 5, e446–e454. [Google Scholar] [CrossRef]
- de’ Donato, F.K.; Leone, M.; Scortichini, M.; De Sario, M.; Katsouyanni, K.; Lanki, T.; Basagaña, X.; Ballester, F.; Åström, C.; Paldy, A.; et al. Changes in the effect of heat on mortality in the last 20 years in nine European cities. Results from the PHASE project. Int. J. Environ. Res. Public Health 2015, 12, 15567–15583. [Google Scholar] [CrossRef]
- World Health Organization. Heat Threatens Health: Key Figures for Europe. 2022. Available online: https://www.euro.who.int/en/health-topics/environment-and-health/Climate-change/archive/heat-threatens-health-key-figures-for-europe (accessed on 29 April 2022).
- Paravantis, J.; Santamouris, M.; Cartalis, C.; Efthymiou, C.; Kontoulis, N. Mortality associated with high ambient temperatures, heatwaves, and the urban heat island in Athens, Greece. Sustainability 2017, 9, 606. [Google Scholar] [CrossRef] [Green Version]
- Baccini, M.; Biggeri, A.; Accetta, G.; Kosatsky, T.; Katsouyanni, K.; Analitis, A.; Anderson, H.R.; Bisanti, L.; D’Iippoliti, D.; Danova, J.; et al. Heat effects on mortality in 15 European cities. Epidemiology 2008, 19, 711–719. [Google Scholar] [CrossRef] [PubMed]
- Zafeiratou, S.; Analitis, A.; Founda, D.; Giannakopoulos, C.; Varotsos, K.V.; Sismanidis, P.; Keramitsoglou, I.; Katsouyanni, K. Spatial variability in the effect of high ambient temperature on mortality: An analysis at municipality level within the greater athens area. Int. J. Environ. Res. Public Health 2019, 16, 3689. [Google Scholar] [CrossRef] [PubMed] [Green Version]
- Kouis, P.; Kakkoura, M.; Ziogas, K.; Paschalidou, A.; Papatheodorou, S.I. The effect of ambient air temperature on cardiovascular and respiratory mortality in Thessaloniki, Greece. Sci. Total Environ. 2019, 647, 1351–1358. [Google Scholar] [CrossRef] [PubMed]
- Ciscar Martinez, J.C. The Impacts of Climate Change in Europe (the PESETA Research Project); Eurostat: Luxembourg, 2009.
- IPCC. Technical Summary. In Contribution of Working Group I to the Sixth Assessment Report of the Intergovernmental Panel on Climate Change; IPCC: Paris, France, 2021; ISBN 9789291691586. [Google Scholar]
- Perkins, S.E.; Alexander, L.V.; Nairn, J.R. Increasing frequency, intensity and duration of observed global heatwaves and warm spells. Geophys. Res. Lett. 2012, 39, 20714. [Google Scholar] [CrossRef]
- Fouillet, A.; Rey, G.; Laurent, F.; Pavillon, G.; Bellec, S.; Guihenneuc-Jouyaux, C.; Clavel, J.; Jougla, E.; Hémon, D. Excess mortality related to the August 2003 heat wave in France. Int. Arch. Occup. Environ. Health 2006, 80, 16–24. [Google Scholar] [CrossRef] [Green Version]
- Semenza, J.C.; McCullough, J.E.; Flanders, W.D.; McGeehin, M.A.; Lumpkin, J.R. Excess Hospital Admissions During the July 1995 Heat Wave in Chicago. Am. J. Prev. Med. 1999, 16, 269–277. [Google Scholar] [CrossRef]
- Koppe, C.; Kovats, S.; Jendritzky, G.; Menne, B. Heat-Waves: Risks and Responses; Health and Global Environmental Change Series, No. 2; World Health Organization: Geneva, Switzerland, 2004; Volume 2, pp. 3505–3545. [Google Scholar] [CrossRef]
- Poupkou, A.; Nastos, P.; Melas, D.; Zerefos, C. Climatology of discomfort index and air quality index in a large urban mediterranean agglomeration. Water Air Soil Pollut. 2011, 222, 163–183. [Google Scholar] [CrossRef]
- Giannaros, T.M.; Melas, D. Study of the urban heat island in a coastal Mediterranean City: The case study of Thessaloniki, Greece. Atmos. Res. 2012, 118, 103–120. [Google Scholar] [CrossRef]
- Ullah, I.; Ma, X.; Yin, J.; Asfaw, T.G.; Azam, K.; Syed, S.; Liu, M.; Arshad, M.; Shahzaman, M. Evaluating the meteorological drought characteristics over Pakistan using in situ observations and reanalysis products. Int. J. Climatol. 2021, 41, 4437–4459. [Google Scholar] [CrossRef]
- D’Ippoliti, D.; Michelozzi, P.; Marino, C.; De’Donato, F.; Menne, B.; Katsouyanni, K.; Kirchmayer, U.; Analitis, A.; Medina-Ramón, M.; Paldy, A.; et al. The impact of heat waves on mortality in 9 European cities: Results from the EuroHEAT project. Environ. Health A Glob. Access Sci. Source 2010, 9, 37. [Google Scholar] [CrossRef] [Green Version]
- Michelozzi, P.; de’ Donato, F.K.; Bargagli, A.M.; D’Ippoliti, D.; de Sario, M.; Marino, C.; Schifano, P.; Cappai, G.; Leone, M.; Kirchmayer, U.; et al. Surveillance of summer mortality and preparedness to reduce the health impact of heat waves in Italy. Int. J. Environ. Res. Public Health 2010, 7, 2256–2273. [Google Scholar] [CrossRef] [PubMed]
- Zhang, K.; Li, Y.; Schwartz, J.D.; O’Neill, M.S. What weather variables are important in predicting heat-related mortality? A new application of statistical learning methods. Environ. Res. 2014, 132, 350–359. [Google Scholar] [CrossRef] [PubMed] [Green Version]
- Lin, Y.K.; Chang, C.K.; Li, M.H.; Wu, Y.C.; Wang, Y.C. High-temperature indices associated with mortality and outpatient visits: Characterizing the association with elevated temperature. Sci. Total Environ. 2012, 427, 41–49. [Google Scholar] [CrossRef]
- Barnett, A.G.; Tong, S.; Clements, A.C.A. What measure of temperature is the best predictor of mortality? Environ. Res. 2010, 110, 604–611. [Google Scholar] [CrossRef] [Green Version]
- Kim, Y.-M.; Kim, S.; Cheong, H.-K.; Kim, E.-H. Comparison of Temperature Indexes for the Impact Assessment of Heat Stress on Heat-Related Mortality. Environ. Health Toxicol. 2011, 26, e2011009. [Google Scholar] [CrossRef] [PubMed]
- Gasparrini, A. Distributed Lag Linear and Non-Linear Models for Time Series Data. 2014, pp. 1–12. Available online: http://143.107.212.50/web/packages/dlnm/vignettes/dlnmTS.pdf (accessed on 29 April 2022).
- Gasparrini, A.; Armstrong, B.; Kenward, M.G. Distributed lag non-linear models. Stat. Med. 2010, 29, 2224–2234. [Google Scholar] [CrossRef] [Green Version]
- Gasparrini, A. Modeling exposure-lag-response associations with distributed lag non-linear models. Stat. Med. 2014, 33, 881–899. [Google Scholar] [CrossRef] [Green Version]
- Guo, C.-Y.; Huang, X.-Y.; Kuo, P.-C.; Chen, Y.-H. Extensions of the distributed lag non-linear model (DLNM) to account for cumulative mortality. Environ. Sci. Pollut. Res. 2021, 28, 38679–38688. [Google Scholar] [CrossRef]
- Gasparrini, A.; Scheipl, F.; Armstrong, B.; Kenward, M.G. A penalized framework for distributed lag non-linear models. Biometrics 2017, 73, 938–948. [Google Scholar] [CrossRef]
- Peng, R.D.; Dominici, F.; Louis, T.A. Model choice in time series studies of air pollution and mortality. J. R. Stat. Soc. Ser. A Stat. Soc. 2006, 169, 179–203. [Google Scholar] [CrossRef] [Green Version]
- Touloumi, G.; Samoli, E.; Pipikou, M.; Tertre, A.L.; Atkinson, R.; Katsouyanni, K. Seasonal confounding in air pollution and health time-series studies: Effect on air pollution effect estimates. Stat. Med. 2006, 25, 4164–4178. [Google Scholar] [CrossRef] [PubMed]
- Peng, R.; Dominici, F. Statistical Methods for Environmental Epidemiology with R: A Case Study in Air Pollution and Health; Springer: New York, NY, USA, 2008; ISBN 9780387781662. [Google Scholar]
- Yan, S.; Wei, L.; Duan, Y.; Li, H.; Liao, Y.; Lv, Q.; Zhu, F.; Wang, Z.; Lu, W.; Yin, P.; et al. Short-term effects of meteorological factors and air pollutants on hand, foot and mouth disease among children in Shenzhen, China, 2009–2017. Int. J. Environ. Res. Public Health 2019, 16, 3639. [Google Scholar] [CrossRef] [PubMed] [Green Version]
- Rodopoulou, S.; Samoli, E.; Analitis, A.; Atkinson, R.W.; de’Donato, F.K.; Katsouyanni, K. Searching for the best modeling specification for assessing the effects of temperature and humidity on health: A time series analysis in three European cities. Int. J. Biometeorol. 2015, 59, 1585–1596. [Google Scholar] [CrossRef] [PubMed]
- EUROSTAT. Ageing Europe-Looking at the Lives of Older People in the EU; Strandell, H., Wolf, P., Eds.; EUROSTAT: Luxembourg, 2019.
- Greece: Country Health Profile 2019, State of Health in the EU. Brussels. 2019. Available online: https://read.oecd-ilibrary.org/social-issues-migration-health/greece-country-health-profile-2019_d87da56a-en#page1%0Ahttps://www.oecd-ilibrary.org/social-issues-migration-health/greece-country-health-profile-2019_d87da56a-en%0Ahttps://read.oecd-ilibrary.o (accessed on 29 April 2022).
- Yin, Q.; Wang, J.; Ren, Z.; Li, J.; Guo, Y. Mapping the increased minimum mortality temperatures in the context of global climate change. Nat. Commun. 2019, 10, 4640. [Google Scholar] [CrossRef] [PubMed] [Green Version]
- Tobías, A.; Armstrong, B.; Gasparrini, A. Brief report: Investigating uncertainty in the minimum mortality temperature. Epidemiology 2017, 28, 72–76. [Google Scholar] [CrossRef] [PubMed]
- Breitner, S.; Wolf, K.; Devlin, R.B.; Diaz-Sanchez, D.; Peters, A.; Schneider, A. Short-term effects of air temperature on mortality and effect modification by air pollution in three cities of Bavaria, Germany: A time-series analysis. Sci. Total Environ. 2014, 485, 49–61. [Google Scholar] [CrossRef]
- Ma, W.; Chen, R.; Kan, H. Temperature-related mortality in 17 large Chinese cities: How heat and cold affect mortality in China. Environ. Res. 2014, 134, 127–133. [Google Scholar] [CrossRef]
- Michelozzi, P.; De Sario, M.; Accetta, G.; De’Donato, F.; Kirchmayer, U.; D’Ovidio, M.; Perucci, C.A. Temperature and summer mortality: Geographical and temporal variations in four Italian cities. J. Epidemiol. Community Health 2006, 60, 417–423. [Google Scholar] [CrossRef] [Green Version]
- Zhang, Y.; Li, C.; Feng, R.; Zhu, Y.; Wu, K.; Tan, X.; Ma, L. The short-term effect of ambient temperature on mortality in Wuhan, China: A time-series study using a distributed lag non-linear model. Int. J. Environ. Res. Public Health 2016, 13, 722. [Google Scholar] [CrossRef] [Green Version]
- Liu, L.; Breitner, S.; Pan, X.; Franck, U.; Leitte, A.M.; Wiedensohler, A.; Von Klot, S.; Wichmann, H.E.; Peters, A.; Schneider, A. Associations between air temperature and cardio-respiratory mortality in the urban area of Beijing, China: A time-series analysis. Environ. Health A Glob. Access Sci. Source 2011, 10, 51. [Google Scholar] [CrossRef] [Green Version]
- Hajat, S.; Armstrong, B.G.; Gouveia, N.; Wilkinson, P. Mortality displacement of heat-related deaths: A comparison of Delhi, São Paulo, and London. Epidemiology 2005, 16, 613–620. [Google Scholar] [CrossRef] [PubMed]
- Bunker, A.; Wildenhain, J.; Vandenbergh, A.; Henschke, N.; Rocklöv, J.; Hajat, S.; Sauerborn, R. Effects of Air Temperature on Climate-Sensitive Mortality and Morbidity Outcomes in the Elderly; a Systematic Review and Meta-analysis of Epidemiological Evidence. EBioMedicine 2016, 6, 258–268. [Google Scholar] [CrossRef] [PubMed] [Green Version]
- Gasparrini, A.; Armstrong, B.; Kovats, S.; Wilkinson, P. The effect of high temperatures on cause-specific mortality in England and Wales. Occup. Environ. Med. 2011, 69, 56–61. [Google Scholar] [CrossRef] [PubMed]
- Chen, R.; Yin, P.; Wang, L.; Liu, C.; Niu, Y.; Wang, W.; Jiang, Y.; Liu, Y.; Liu, J.; Qi, J.; et al. Association between ambient temperature and mortality risk and burden: Time series study in 272 main Chinese cities. BMJ 2018, 363, k4306. [Google Scholar] [CrossRef] [Green Version]
- Gasparrini, A.; Leone, M. Attributable risk from distributed lag models. BMC Med. Res. Methodol. 2014, 14, 55. [Google Scholar] [CrossRef] [Green Version]
Publisher’s Note: MDPI stays neutral with regard to jurisdictional claims in published maps and institutional affiliations. |
© 2022 by the authors. Licensee MDPI, Basel, Switzerland. This article is an open access article distributed under the terms and conditions of the Creative Commons Attribution (CC BY) license (https://creativecommons.org/licenses/by/4.0/).