Article

The Light Absorption Heating Method for Measurement of Light Absorption by Particles Collected on Filters

1
Alaska Climate Research Center, University of Alaska, Fairbanks, AK 99775, USA
2
Natural Systems Research INC, Fairbanks, AK 99712, USA
3
SchnaiTEC GMBH, 76646 Bruchsal, Germany
4
Institute of Meteorology and Climate Research, Karlsruhe Institute of Technology, 76131 Karlsruhe, Germany
5
Department of Physics, University of Nevada-Reno, Reno, NV 89557, USA
*
Author to whom correspondence should be addressed.
Atmosphere 2022, 13(5), 824; https://doi.org/10.3390/atmos13050824
Submission received: 2 April 2022 / Revised: 10 May 2022 / Accepted: 10 May 2022 / Published: 18 May 2022
(This article belongs to the Special Issue Light-Absorbing Particles in Snow and Ice)

Abstract

:
A new instrument for the quantification of light absorption by particles collected on filters has been developed to address long standing environmental questions about light-absorbing particles in air, water, and on snow and ice. The Light Absorption Heating Method (LAHM) uses temperature changes when filters are exposed to light to quantify absorption. Through the use of calibration standards, the observed temperature response of unknown materials can be related to the absorption cross section of the substance collected on the filter. Here, we present a detailed description of the instrument and calibration. The results of the calibration tests using a common surrogate for black carbon, Fullerene soot, show that the instrument provides stable results even when exposed to adverse laboratory conditions, and that there is little drift in the instrument over longer periods of time. Calibration studies using Fullerene soot suspended in water, airborne propane soot, as well as atmospheric particulates show consistent results for absorption cross section when using accepted values for the mass absorption cross section of the soot and when compared to results from a 3-wavelength photoacoustic instrument. While filter sampling cannot provide the time resolution of other instrumentation, the LAHM instrument fills a niche where time averaging is reasonable and high-cost instrumentation is not available. The optimal range of absorption cross sections for LAHM is from 0.1 to 5.0 cm2 (~1.0–50.0 µg soot) for 25 mm filters and 0.4 to 20 cm2 (4.0–200.0 µg soot) for 47 mm filters, with reduced sensitivity to higher values.

1. Introduction

For many types of scientific measurements, the standard practice is to collect samples on filters. Common examples include air pollution measurements such as PM2.5 and PM10 (airborne particulate matter aerodynamically smaller than 2.5 and 10 microns) in which air is pulled through a filter at a constant rate with instrumentation such as an MiniVol Sampler (AirMetrics, Springfield, OR, USA). Air pollution filter samples are commonly used worldwide for scientific research purposes [1] as well as for day to day monitoring. Additional applications of filtration include studies of water turbidity [2] and the measurement of light-absorbing particles in snow and ice [3]. For turbidity and snow and ice samples, a known quantity of water is filtered, and the filters are preserved for further analysis of impurities.
The LAHM instrument was initially developed to determine light-absorbing particles on snow [4]. An earlier version of the instrument was used to quantify light-absorbing particles on glaciers in Peru [4]. In that study, the LAHM instrument results were shown to be well correlated to black carbon as measured by the Single Particle Soot Photometer (SP2: Droplet Measurement Technologies, Longmont, CO, USA) [5]. Later studies showed that this was not typically the case when non-SP2-sized particles or non-soot particles were present [6]. Further studies suggested that the LAHM instrument could determine the absorption cross section of the full particle load on the filter. These results were useful for calculations of the spectral reflectance of snow when compared to observations [6]. The LAHM instrument directly measures light absorption rather than mass for the total population of particles on the filter, which facilitates the study of the impacts of light-absorbing particles on snow.
The analysis of filter samples is often conducted by gravimetric means, by weighing the filter before and after sample collection. Beyond mass, often the optical characteristics of particles collected on filters can be of interest. Optical techniques such as measuring light attenuation through a sample filter and comparing the attenuation to that of a clean filter are frequently utilized [7,8] and are the basis of operation for the Maggee science sootscan transmissometer and the Particle Soot Absorption Photometer (PSAP: Berkeley, CA, USA), used in the Global Atmospheric Watch (GAW) program. Light attenuation by particles on filters can be interpreted to estimate black carbon (BC) concentration on filters, as well as attributing the absorption between BC and other materials such as dust and brown carbon, as is conducted by [9] for snow-borne impurities. A frequently used system for light-absorbing particles in snow is the Integrating Sphere integrating Sandwich spectrometer (ISSW: University of Washington, Washington, WA, USA) [9]. The ISSW measures the spectra of light after it passes through a filter that is loaded with particles. The spectral information assists in distinguishing different species. More sophisticated instruments such as the Single Particle Soot Photometer (SP2) have been developed for the measurement of airborne BC and have been adapted for the measurement of snow-borne BC [5].
For some applications, knowledge of the absorption cross section of filter-borne particles is sufficient without a complete understanding of the particle makeup. For applications such as light-absorbing particles in and on snow, the absorption of light by particles is the fundamental value necessary to estimate the radiative forcing caused by the particles. Source attribution requires knowledge of the exact quantity of the emission product of the source. Speciation of light-absorbing particles is not critical for understanding the impacts on snow (e.g., melting).
The convention for reporting light-absorbing particles on snow is to report the mass. In the case of the SP2, this is the mass of rBC (refractory Black Carbon), essentially, the portion of black carbon that is detected by the SP2. The LAHM instrument as well as the ISSW reports in units of eBC (effective Black Carbon), basically, the mass of black carbon that absorbs an equivalent amount of light as the particles on the filter. Thus, eBC is essentially a measure of the absorption cross section of the particles.
While instrumentation for the measurement of light-absorbing particles can be expensive, the basic measurement of the absorption of light is relatively straight forward. High time resolution and particle by particle information can be useful for some applications, but bulk measurements can be scientifically valuable and can be studied with lower cost techniques. For reasons of instrument cost, portability, and accuracy, we have developed the Light Absorption Heating Method (LAHM) instrument to characterize the absorption of particles on filters. The LAHM instrument can be used to analyze filters such as 47 mm diameter filters often used for PM2.5 studies as well as 25 mm filters used for waterborne and snow-borne particle studies. The LAHM instrument takes advantage of the fact that light-absorbing particles increase in temperature upon the absorption of visible light. A filter loaded with a sample is placed in the instrument in a thermally isolated location and exposed to visible light. A noncontact infrared thermometer measures the resulting temperature change of the filter. With appropriate calibration, the temperature increase of the filter can be directly related to the absorption cross section of the particles on the filter, which can be converted to particle mass with knowledge of the mass absorption cross section (MAC).
The technique is straightforward, does not involve costly equipment, and can be used to detect light absorption accurately across filter loadings spanning two orders of magnitude. The instrument has been refined from an earlier version [4] to the point where it now produces repeatable results, with the uncertainty having been reduced by a factor of ten even under unstable laboratory conditions such as full sun exposure. The instrument version described in this publication was developed with ease of use and stability in mind. The previous version [4] had an uncertainty of about 10% each time the same filter was analyzed. The current version reduced the uncertainty by a factor of 10. This improvement was achieved by improving several components of the system. This started with better isolating the filter from the surroundings during the measurement. The previous version had a more open format, and airflow in the laboratory could easily impact the measurements. Reproducibility of filter placement was improved in the current version by placing the light, filter, and infrared thermometer in line rather than having 45° angles between these components. In the current version, a microcontroller controls the light source and data collection; whereas, in the previous version, the operator operated the light manually. The better standardization of the initiation of the lighting phase of the measurement significantly reduces uncertainty as well.
The LAHM instrument can be calibrated for known substances, and its sensitivity can span two orders of magnitude (e.g., from less than 1 µg to 50 µg of BC on a filter can be quantified to a high degree of certainty). Here, we describe the LAHM instrument from a theoretical perspective as well as the current instrument, which is being used by 10 research groups worldwide studying light-absorbing particles on glaciers. The LAHM instrument has been used to quantify light-absorbing particles extracted from snow and is being used in studies of aerosol absorption in the PM2.5 and PM10 size ranges. In Section 2, the instrument is described in detail. Section 3 describes the calibration, stability, and uncertainty of the instrument. In Section 4, the results of two intercomparison studies are presented demonstrating the utility of the instrument for measuring the absorption cross section of airborne aerosols. In Section 5, the work is summarized.

2. Instrument Description

The principle of operation of the LAHM instrument is that the temperature response of a substance to impinging light can be directly related to the absorption cross section of the substance. As suggested by the name of the LAHM technique, the thermodynamic state of particles on a filter are perturbed by increasing the quantity of light impinging on the substance leading to an increase in the temperature as the substance re-equilibrates with its surroundings. The increase in absorbed energy is accompanied by additional infrared emission as the filter temperature increases.
Basic thermodynamic considerations can be used to understand the response of the LAHM instrument. When the light is switched on, a portion of that energy is absorbed by the particles on the filter leading to an increase in the temperature of the filter. Once the filter is out of equilibrium with its surroundings, it begins to radiate more as indicated by its brightness temperature as well as directly transmitting energy by contact with air in order to return to equilibrium with its surroundings. A broadband visible wavelength range LED lightbulb is used to illuminate the filter, and an infrared detector measures the brightness temperature of the filter over time. The LAHM instrument works by monitoring the infrared brightness temperature after the LED is switched on and the filter nears a new equilibrium temperature.

2.1. Physical Design

The specific instrument description presented here is for an instrument designed to determine particle properties of particles on 25 mm filters. 
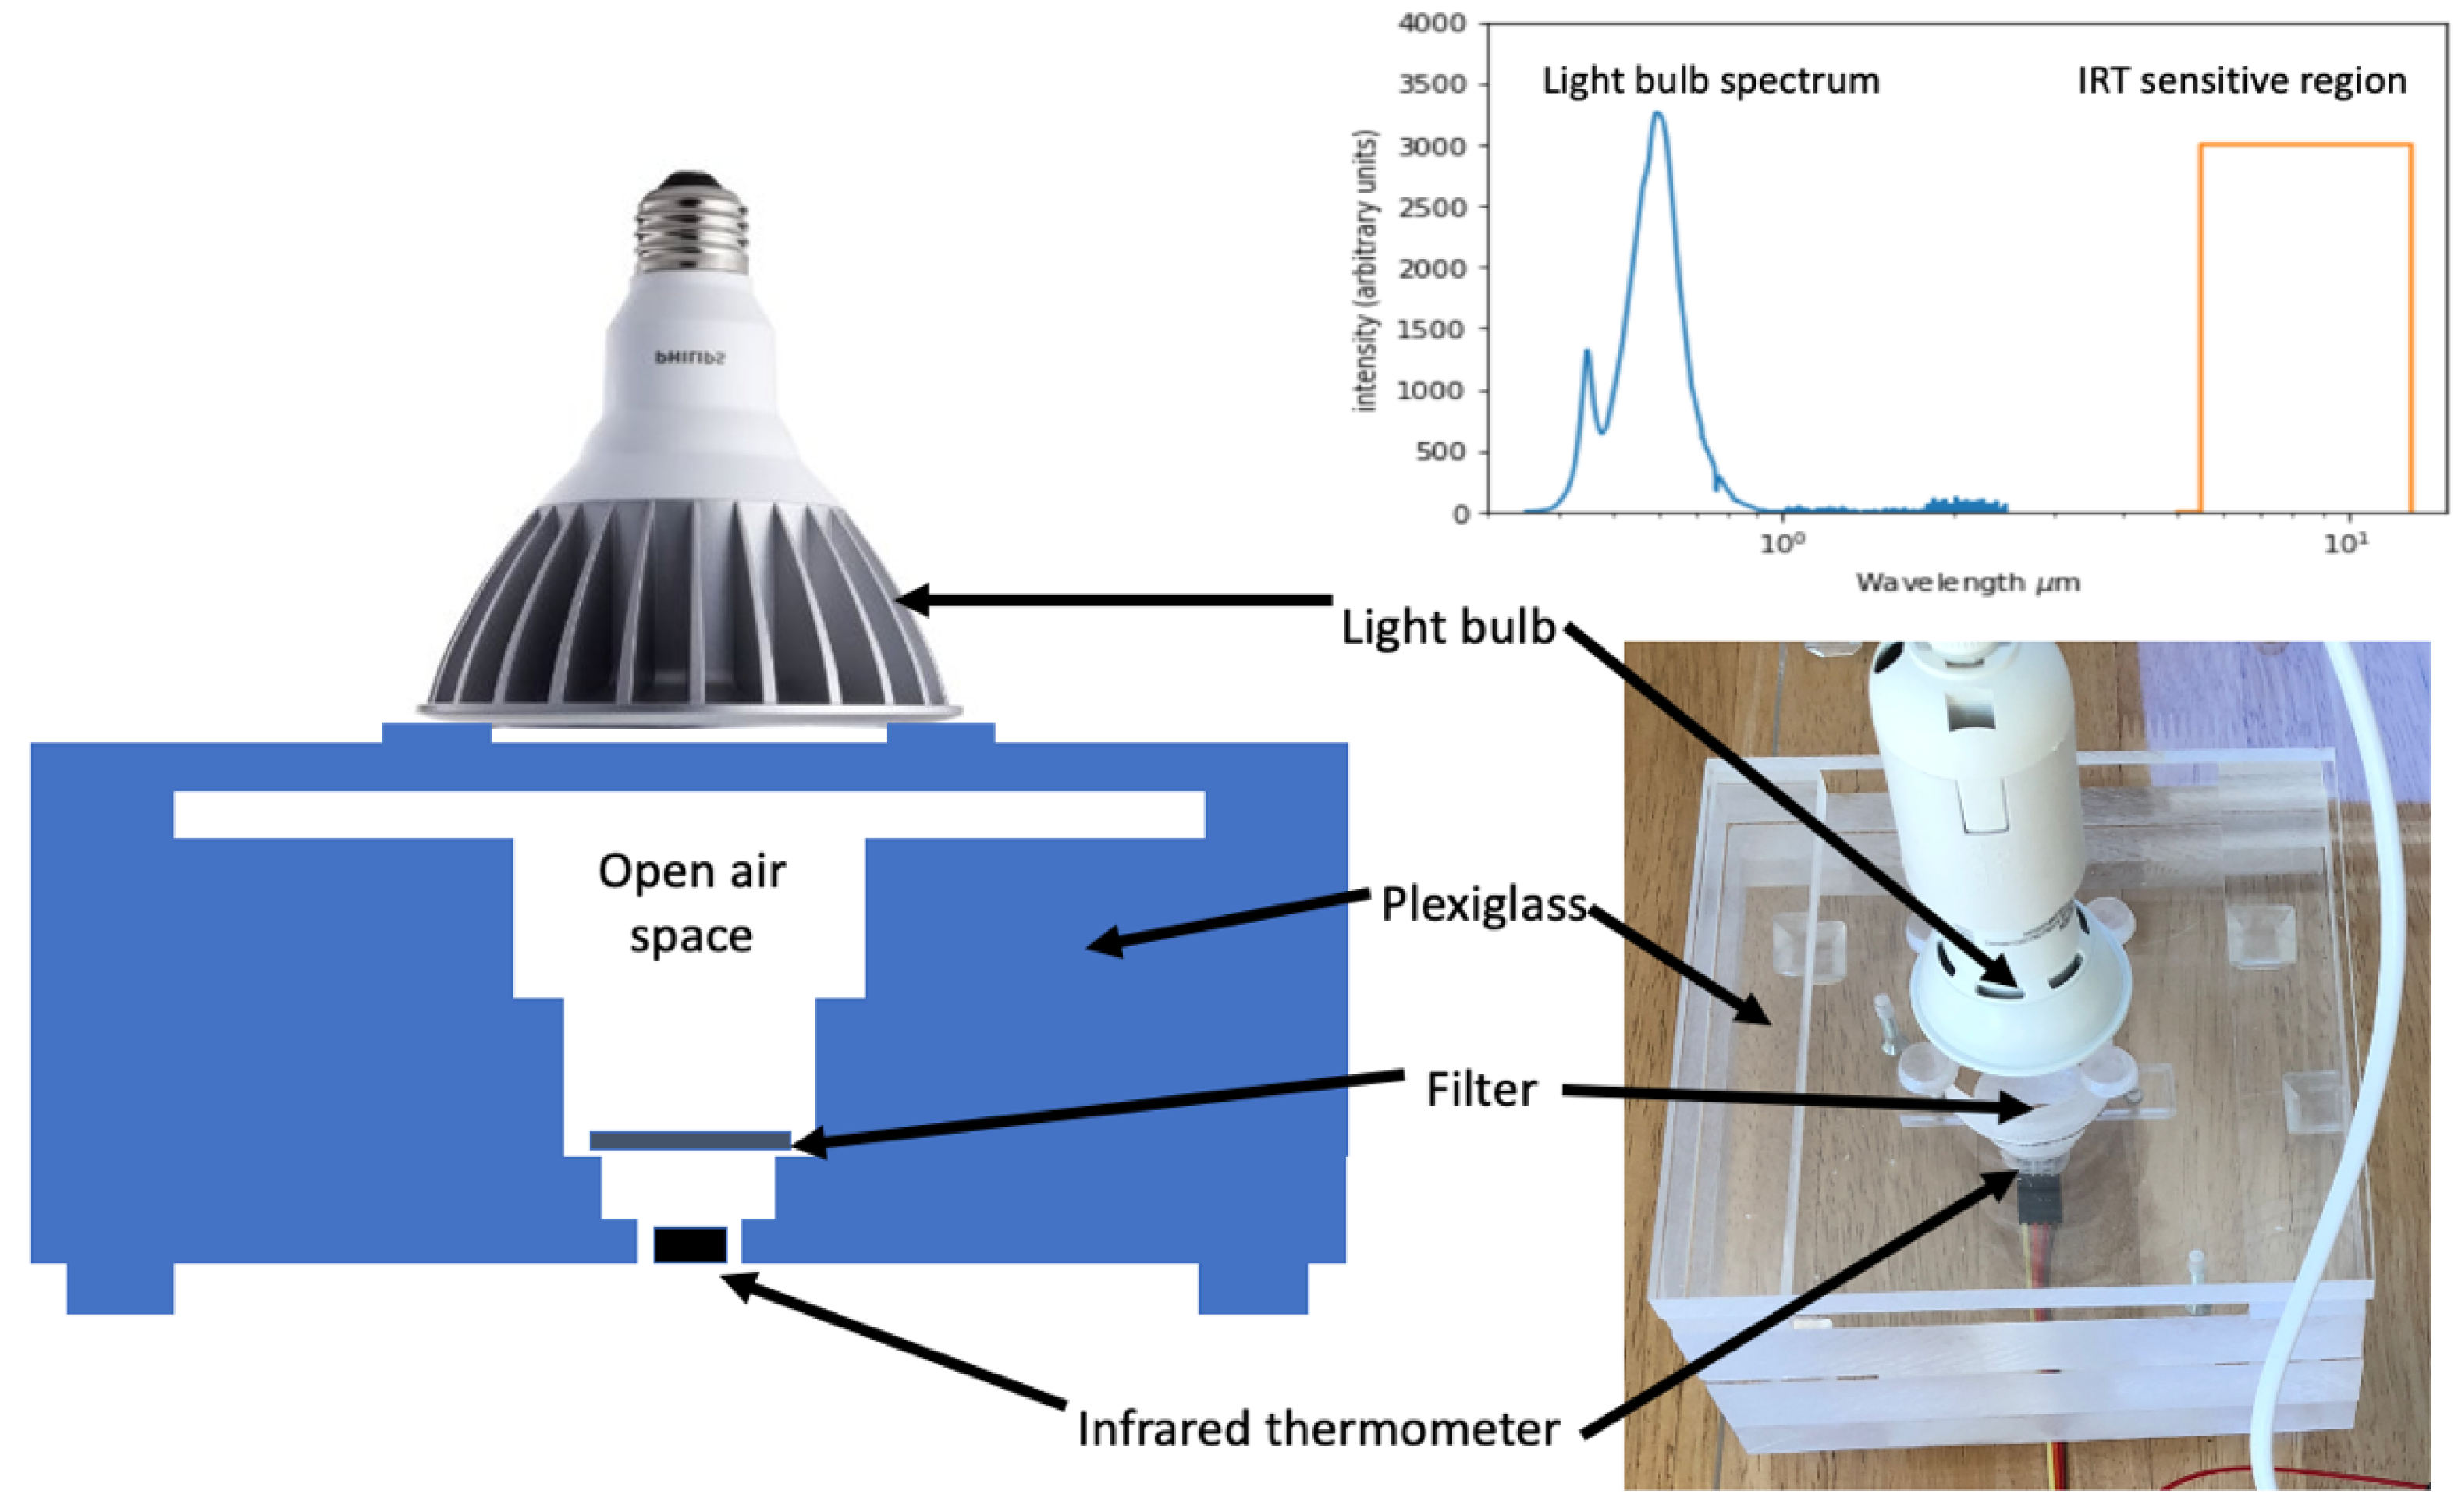
Figure 1 shows a schematic diagram of the instrument as well as a photo. With simple configuration changes, 47 mm filters can be accommodated. The instrument is composed of several plexiglass sheets 15 × 15 cm in size. Thick clear sheets of plexiglass are used because they do not change temperature rapidly, and stray light leaves the system rather than being reflected back to the filter, where it could increase uncertainty. The bottom sheet is 2 cm thick and has a 23 mm diameter hole that penetrates 1.5 cm into the sheet. The remaining 0.5 cm is drilled to the diameter of an infrared thermometer (IRT) module (MLX90614, Melexis Microelectronics, leper, Belgium, approximately 0.8 cm diameter). The datasheet for the IRT module states that its sensitivity range is from 5.5 to 14 microns. The IRT module is secured on bottom of the sheet with space for the thermometer electronics. For analysis, a 25 mm filter is placed over the 23 mm hole; this placement positions most of the filter underside into the field of view of the IRT. Two additional 2.5 cm thick sheets with increasingly larger diameter holes are placed on top of the first sheet for analysis. The additional sheets enable direct transmission of light to the filter. To prevent the accumulation of warmed air above the filter, a gap is created using two 2.5 × 15 cm bars 0.5 cm thick and a final 15 × 15 sheet 0.5 cm thick again. An LED light (Philips 7W LED 50W replacement indoor flood, Philips Electronics, Amsterdam, The Netherlands) is then placed onto four small rubber bumpers on top of the top sheet. The LED light spectrum ranges from 400 to 800 nm and peaks at 600 nm (see Figure 1 inset for the LED spectrum compared to the IRT sensitivity region. The rubber bumpers create another small air gap thus further reducing the possibility of the transfer of heat directly from the bulb to the instrument (although the bulb temperature change is only 1–2 °C even after several hours of operation). The final configuration was determined through experimentation in an effort to reduce the heat exchange between the components of the instrument. The IRT is monitored with an Arduino microcontroller that also controls the light through a relay system.

2.2. Data System

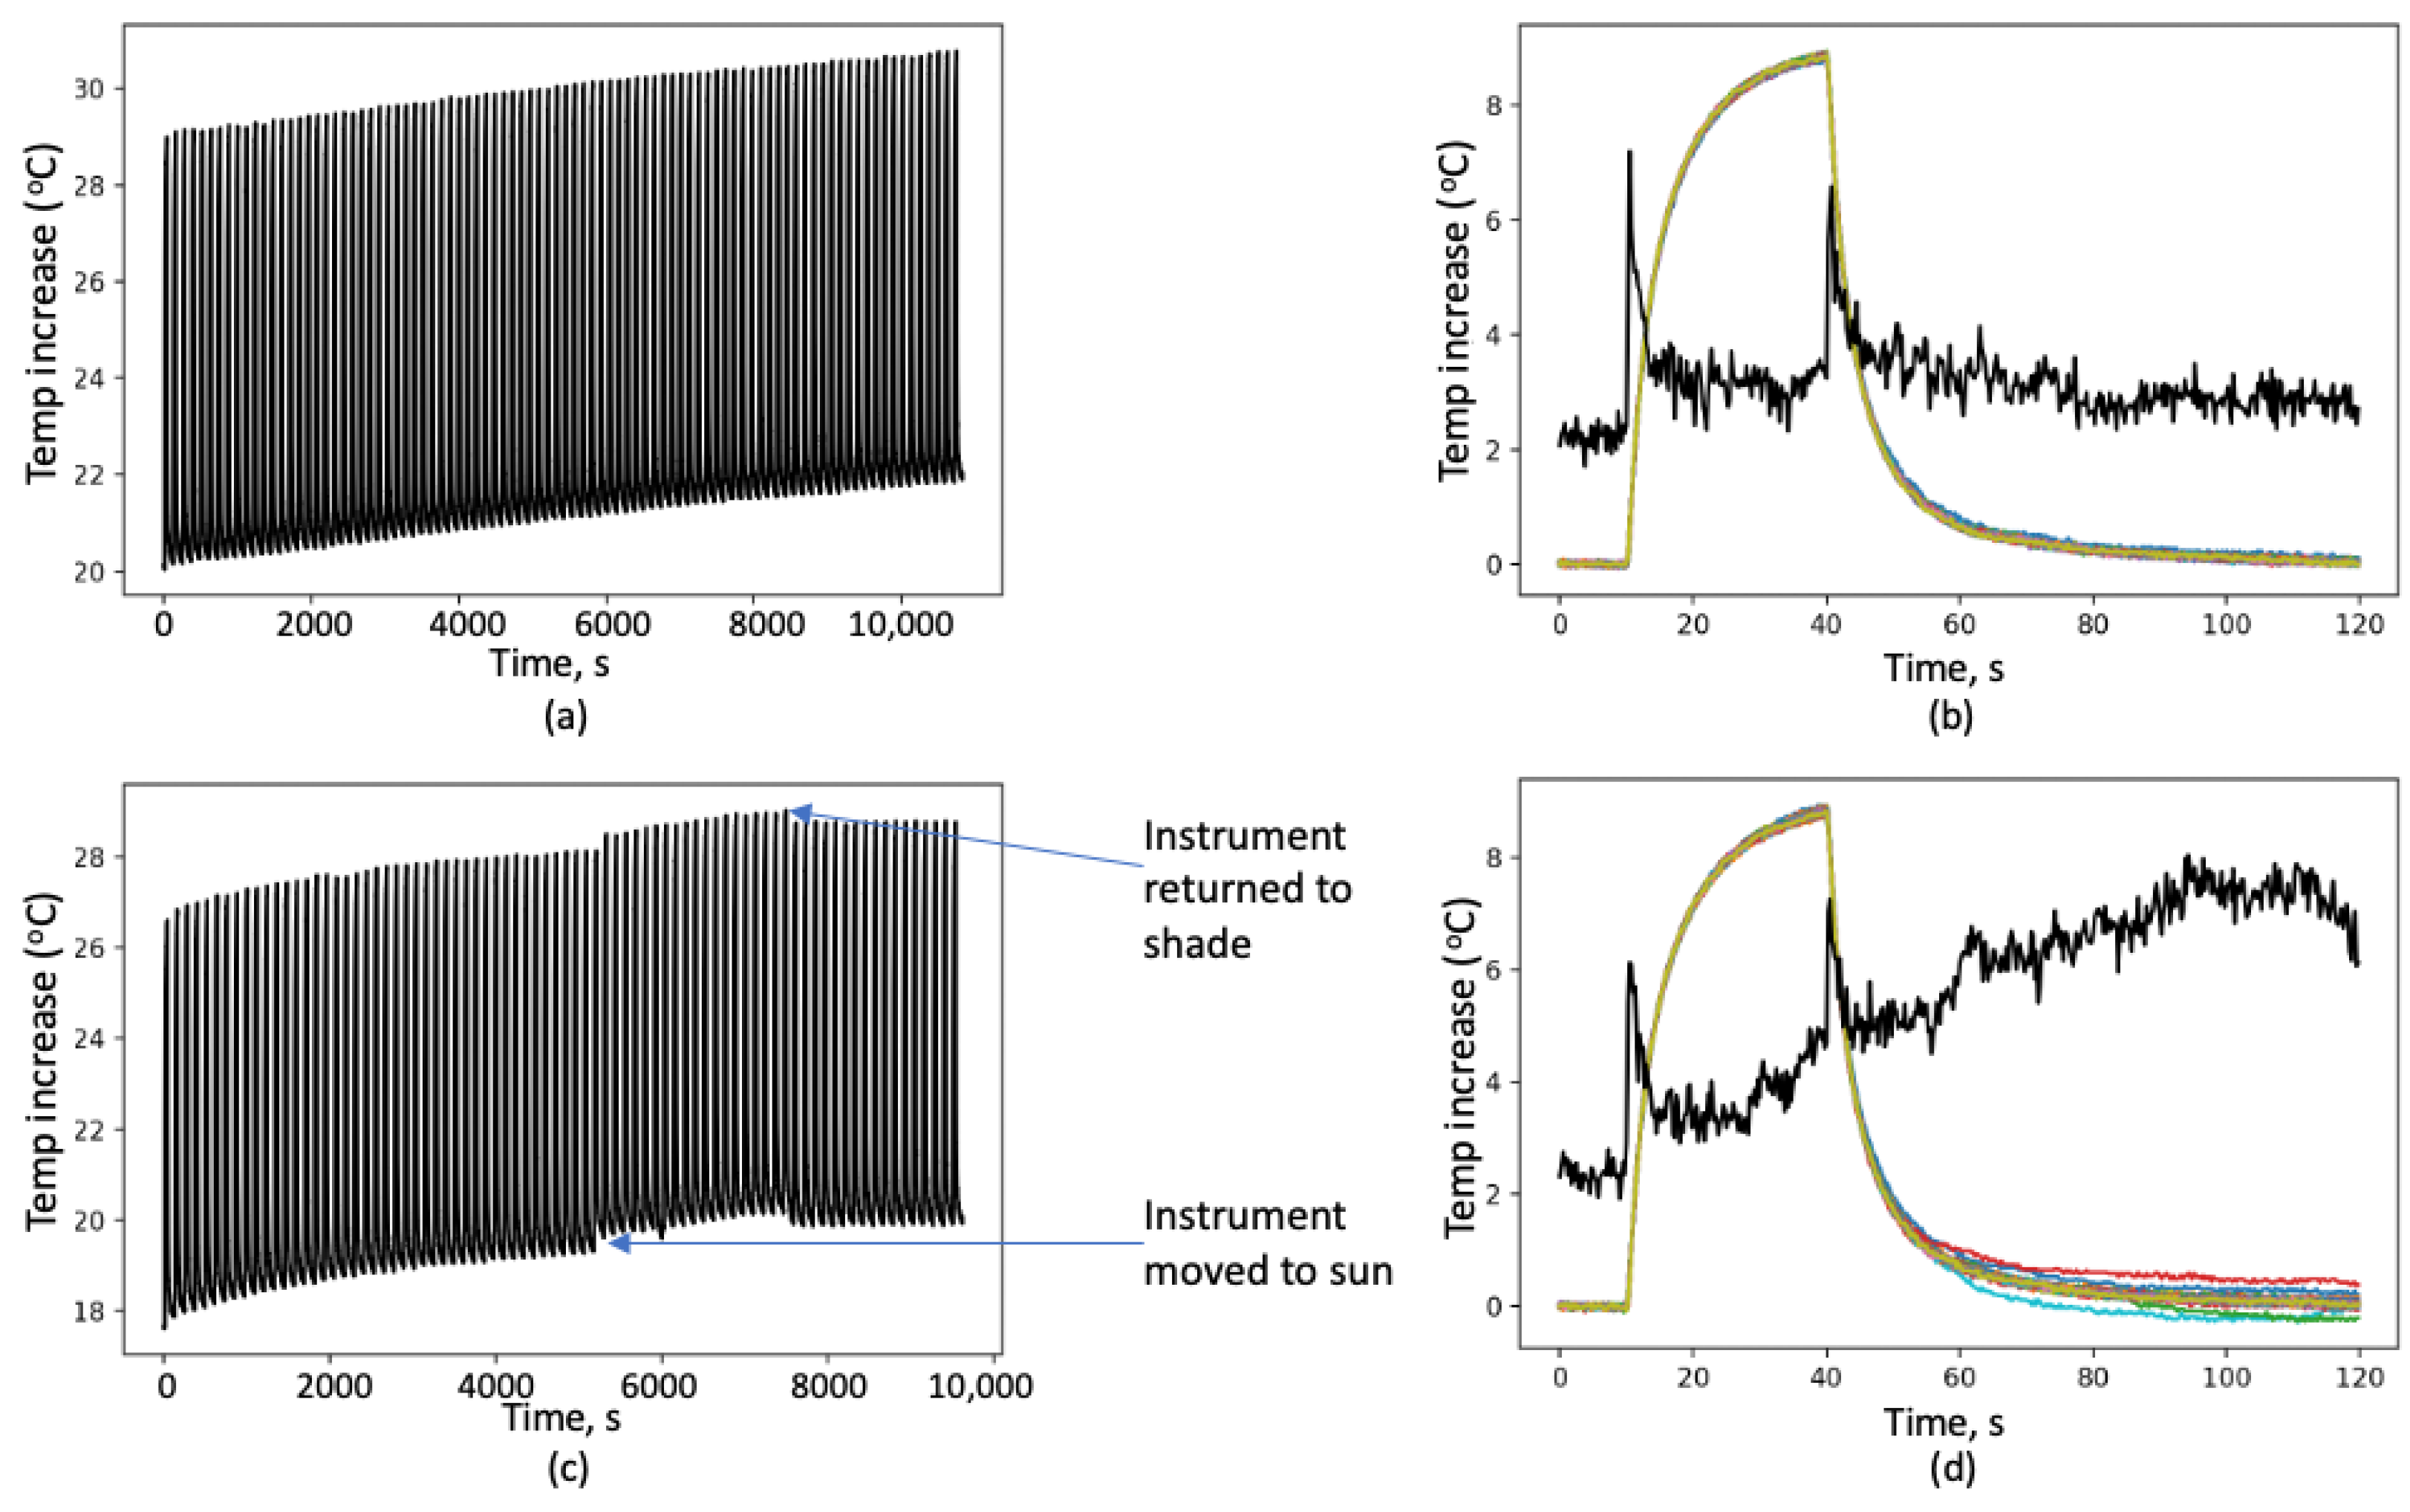
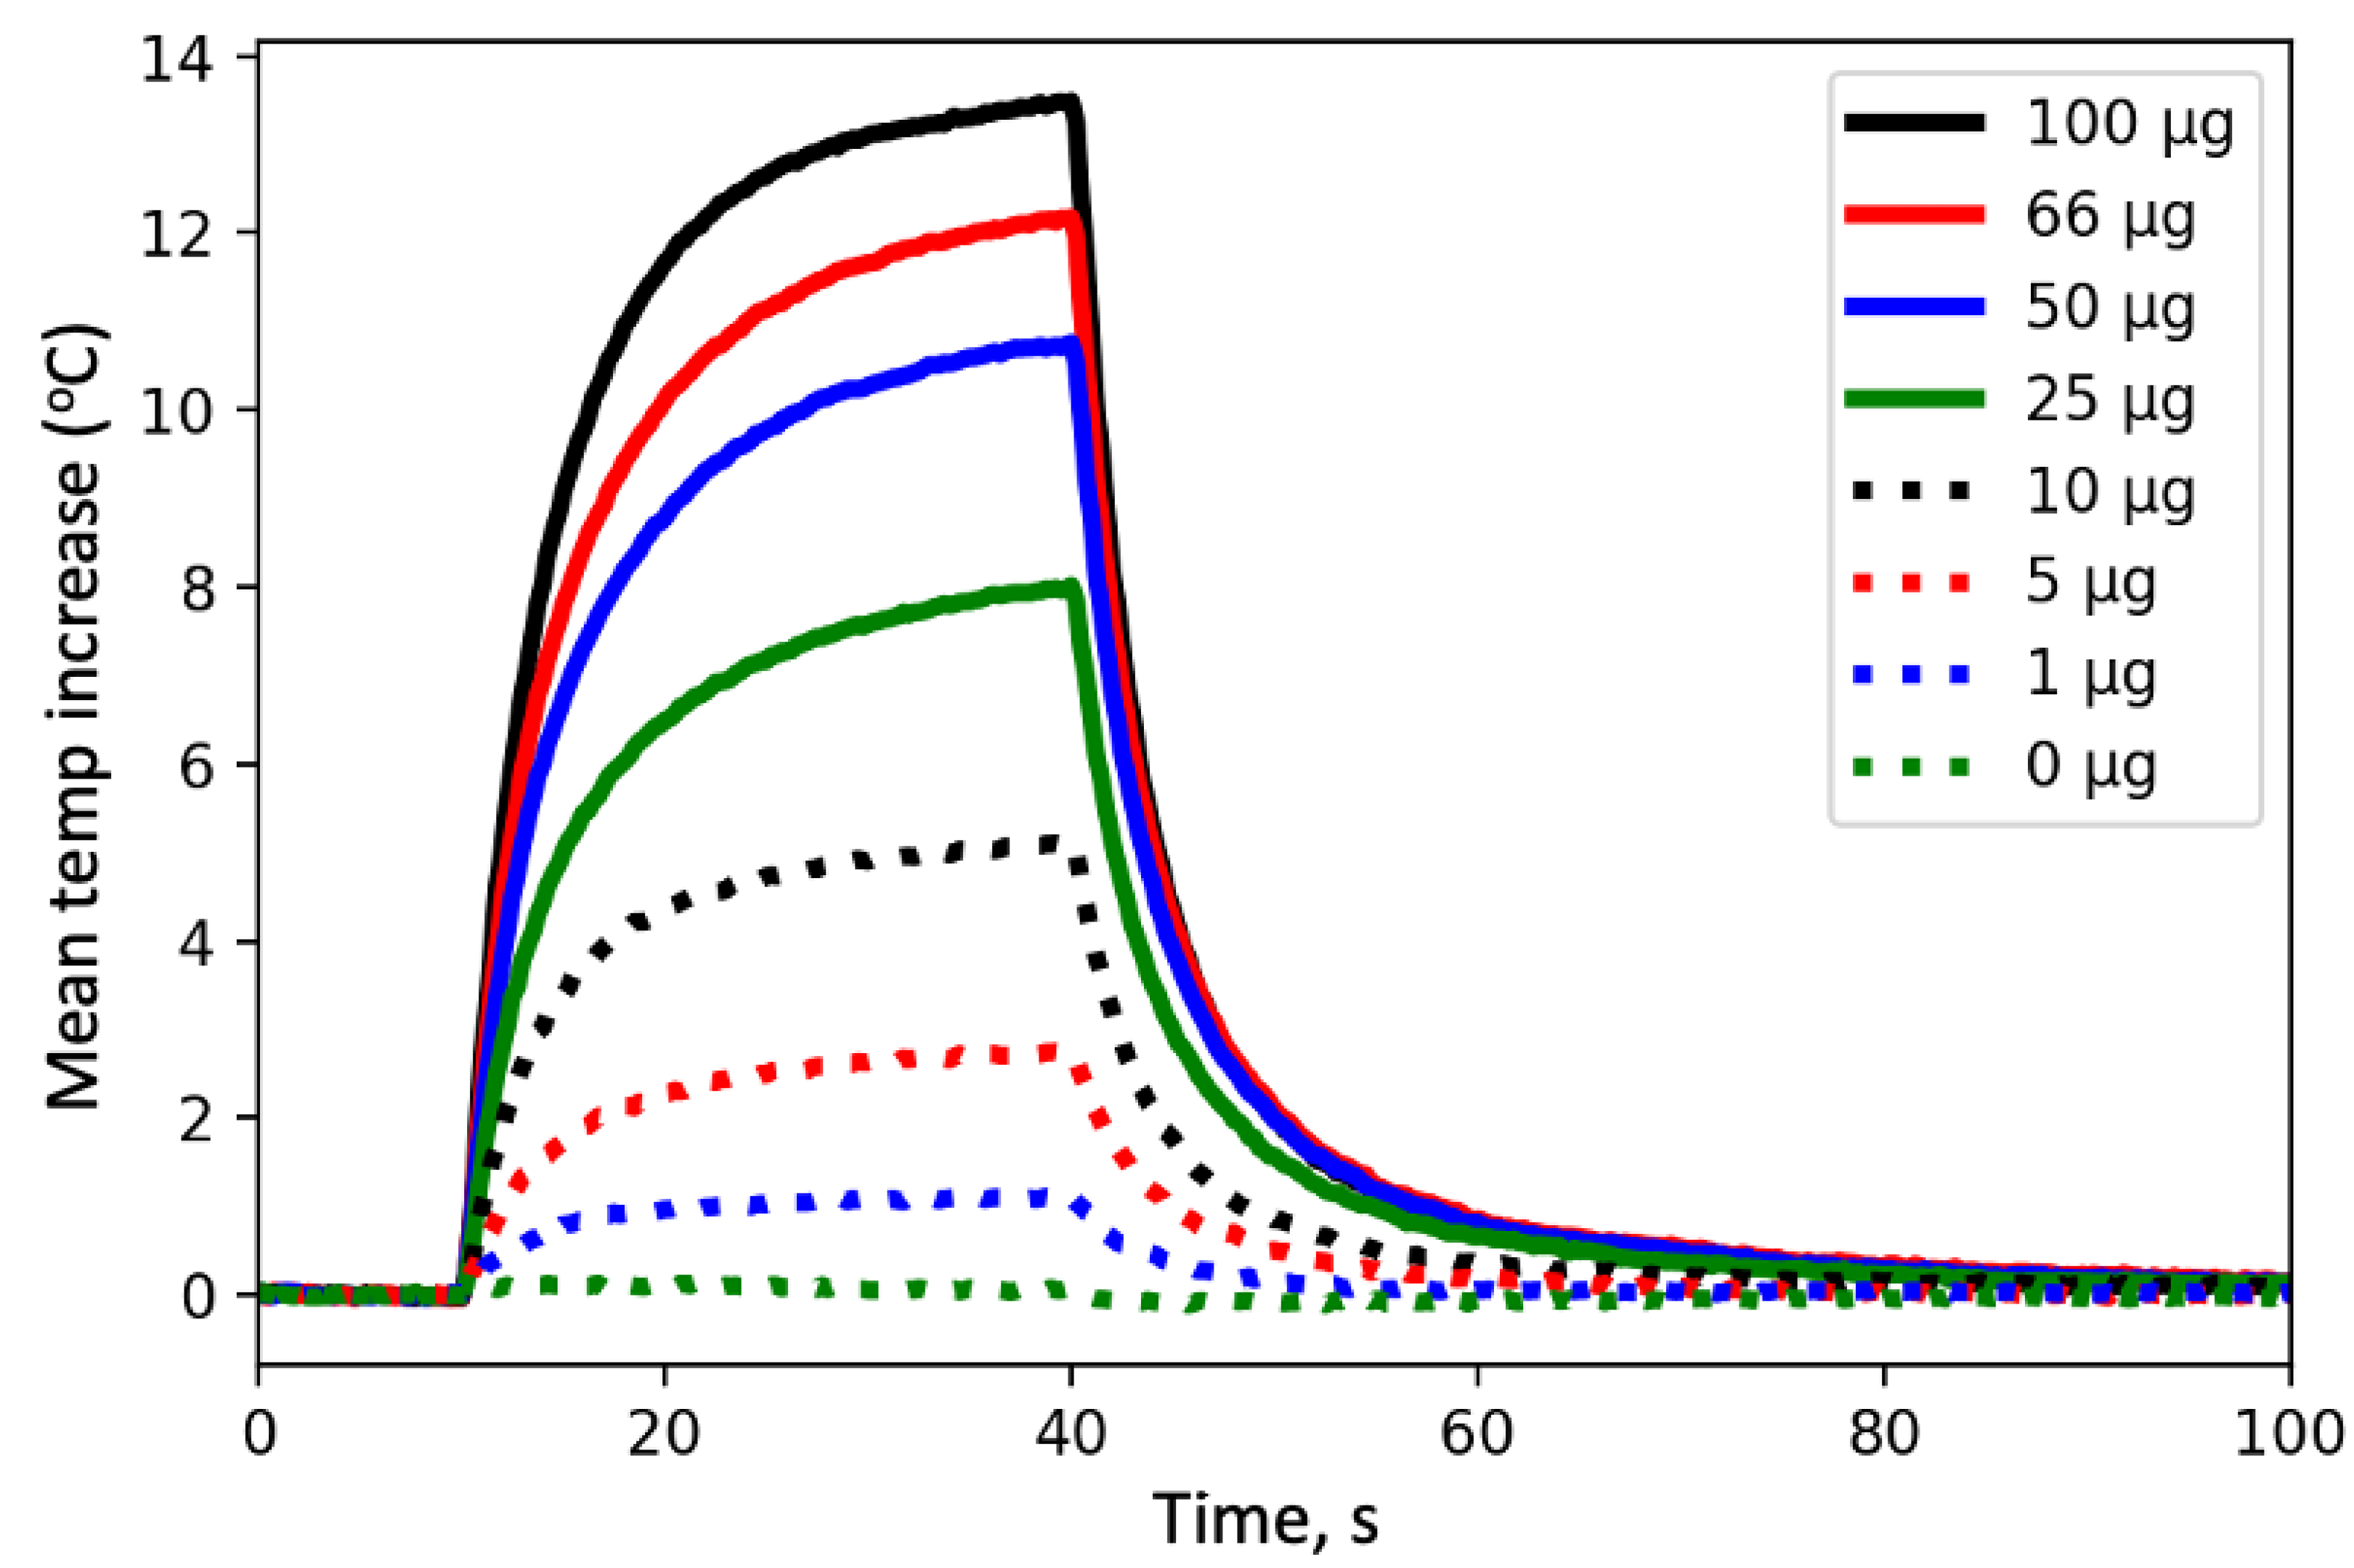
An Arduino program has been written to operate the system through five illumination and cooling cycles for each sample measurement. Taking the average temperature increase over 3–5 cycles substantially reduces the instrument uncertainty, while additional cycles do not appreciably improve the results. The first four illumination periods were 30 s long, and the final was 120 s, all followed by 90 s cooling periods. Unless otherwise stated, temperature profiles presented in this publication are the average of the first four heating cycles with ambient temperature removed by averaging the ten seconds before the initial heating cycle began. The final 120 s cycle can be used to estimate the actual mass of extremely heavily loaded filters, which has a very high uncertainty and is, therefore, not described here. During operation, the temperature data are saved at 4 Hz, and the resulting data are saved for later final analysis. The instrument has been mainly used with 25 mm filters, investigating light-absorbing particles extracted from glaciers.

3. Instrument Calibration

3.1. Calibration

Instrument calibration was conducted empirically with a set of filters loaded with known quantities of fullerene soot (Stock # 40971, Lot F12S011, Alfa Aesar Inc., Ward Hill, MA, USA), a laboratory BC that is the recommended proxy for refractory BC [10]. As described in [4], the filters were loaded with fullerene soot quantities ranging from 1 to 100 micrograms from a gravimetric standard in which the particle size distribution was similar to the ambient atmospheric BC aerosol size distributions (diameters in the range of ~0.1–0.5 µm) [11]. Then, 25 mm diameter Millipore mixed cellulose ester filter membrane 0.22 micron filters, used in the LAHM, captured approximately 97% of the total fullerene mass (determined by passing the post-filter water through a single-particle soot photometer (SP2)). Note that since the entire filter is heated by the light absorbed by the particles, different filter types that are heavier or lighter will have different response functions. For filtering snow water, Pallflex Membrane Tissuquartz (Pall, Port Washington, NY, USA) 0.7 micron filters have similar temperature responses in the LAHM instrument. It is also critical to completely dry the filter before analysis, as excess water mass in the filter impacts the LAHM instrument response.
Figure 2 shows the temperature responses for a selection of calibration filters and a blank filter. It shows the temperature profiles measured with the LAHM instrument with fullerene soot masses ranging from 0 to 100 micrograms. The temperature of the blank filter increased less than 0.1 °C, while the temperature of a filter with one microgram increased about 0.5 °C demonstrating the sensitivity at very low filter loadings. The temperature difference between the two highest filters (with 66 and 100 micrograms) was approximately 1.0 °C suggesting that the sensitivity was much less at higher values. If the instrument is operated without a filter in place, the temperature increase is approximately 3.8 °C indicating that the IRT is sensitive to light put out by the lightbulb, but given that a blank filter reduces that substantially and the filter temperature can reach much higher values, the process of absorption of visible light and then reemission in the IR is dominant.
The LAHM was calibrated through the development of an empirical relationship between the temperature increase and the mass of fullerene soot on the filter. The temperature increase (dT) is found by averaging the temperature increase for the four initial 30-s heating cycles after the average of the ambient temperature (Ta) for the first 10-s (time 0–10 on Figure 2) preceding each cycle is subtracted. Variability in the laboratory ambient temperature was found to affect the measurement slightly and predictably. The effect of ambient temperature on the dT values can be found using Equation (1).
Tcorr = dT × (1.0536 − 0.00163 × Ta − 0.0000815 × Ta2)−1
The adjustment in Equation (1) was determined by repeatedly analyzing three filters (with 10, 25, and 44 micrograms of Fullerene soot, respectively) at laboratory ambient temperatures, Ta, from −3 °C to +25 °C. Each instrument was slightly different, mainly due to the variability in the lightbulbs. It has been found that the temperature increase caused by one lightbulb can be scaled to another light with 0.5% certainty with a factor developed by measuring the dT for the two lights using the same filter. In this manner, all instruments were calibrated to a standard instrument (owned by the lead author), which is used for determining response calibrations.
Figure 3 shows a calibration curve developed for the fullerene soot test filters, which used the Tcorr increase after 30 s (T30, 40 s after on the x axis of Figure 2). Individual filter temperature increases are shown on the plot as well. The scatter in the data is likely due to the variability in Fullerene soot properties. Calibration filters were created on three different occasions using different starting mixtures that were made by mixing Fullerene soot in water and allowing the larger particles to settle to achieve a distribution similar to airborne black carbon. Given that each mixture could be slightly different, all calibration filters were used to develop the plot shown in Figure 3. The R2 value for the fit was 0.971. Equation (2) shows the Equation for the fit
M = 3.43 × exp (T30 × 0.238) − 3.0
where T30 is the corrected filter temperature after thirty seconds of illumination (Time = 40 s on Figure 2), and M is the mass in micrograms of fullerene soot on the filter. The reader is cautioned that it is critical to reference the specific type of BC that is associated with the calibration measurement, as different types of BC can have significantly different Mass Absorption Cross-section (MAC) values that can substantially affect the results. If the MAC of the particle(s) was not known, Equation (2) would give the effective black carbon quantity (eBC).

3.2. Instrument Stability

To test instrument stability, the instrument was set to operate indefinitely with two minute cycles of thirty seconds illumination followed by 90 s cooldown. Twice, the instrument was allowed to operate for 80 cycles. Figure 4 shows the instrument response during these experiments. The overall temperature registered slowly increased throughout each of the tests, likely due to in some part to the ambient temperature increasing rather than solely due to the instrument operation. During the second test (lower panels), the instrument was relocated to an area with direct sunlight after cycle 39 then returned to an area out of the sun at cycle 60. Both the low temperature baseline and the local high temperature for each illumination phase elevated approximately 0.2 °C degrees with exposure to direct sun and then dropped 0.2 °C when removed from direct sun. Treating each illumination phase individually (by normalizing for the ten seconds before) the profiles show remarkable stability even when comparing the sunlit phases to the non-sunlit phases. For each time step, the standard deviation of the observed dT values of the 80 normalized profiles was calculated for the two experiments. The 80 individual traces as well as the standard deviation (multiplied by 100 so it can be seen) are shown in the right panels of Figure 4. Note that the standard deviation is higher for the 80 measurements with the sun influence; yet, the increase was still small during the illumination phase. The higher standard deviation for the sunlight experiment was caused by the profiles collected as the instrument was moved in and out of the sun. The direct sunlight test is an extreme case suggesting that standard laboratory conditions should not affect the results significantly. The only profiles significantly affected were the profiles collected during the transition suggesting that one should avoid placing the instrument near a window in the sun when clouds were passing by from time to time, although the 0.2 °C difference would likely be reduced by averaging four profiles as is standard, and the 0.2 °C affects all parts of the temperature profile, thus having a negligible effect on dT.

3.3. Measurement Uncertainty

The uncertainty in the LAHM instrument is the uncertainty in the temperature increase. In the upper right plot of Figure 4, the uncertainty in the 80 runs was approximately 0.035 °C based on the standard deviation plot between 20 and 40 s. In addition to this, there is the potential for instrument drift over time. To test this, two filters that were analyzed in 2016 were reanalyzed in 2022. The average difference in temperature at time = 40 s was 0.7% for a filter with 12 °C temperature change (equal to 0.084 °C). The second filter with a lighter load had a similar percentage change as well. Thus, the instrument uncertainty was approximately 0.12 °C. Using Equation (2) (e.g., assuming Fullerene soot absorption), a 0.12 °C error led to a 3% uncertainty with a 12 °C measured temperature change. Applying the same percentage temperature difference over six years to a filter that had a 2.5 °C temperature change also led to a 3% uncertainty. Larger particles with low MAC values would likely experience significant overlap, so it is recommended that filters be only lightly loaded, thus reducing any potential issues with overlap.

4. Results

4.1. Estimating Mass with Known Particle Characteristics

In April–May 2016, the prototype LAHM instrument was operated in conjunction with the SP2 and the three wavelength photoacoustic absorption spectrometer PAAS-3λ (SchnaiTEC, Bruchsal, Germany) [12] at the Aerosol Interactions and Dynamics in the Atmosphere (AIDA) cloud chamber in Karlsruhe, Germany, during a research campaign to study the spectral optical properties of airborne soot from a co-flow diffusion flame of propane and air [13]. Airborne soot particles were sampled by the SP2, the PAAS-3λ, and collected on filters for thermographic elemental carbon/organic carbon (EC/OC) analysis and for light absorption analysis by LAHM. SP2 measurements were used to determine the mass of propane soot collected on the filters. The LAHM instrument showed substantially more absorption per unit mass of soot on the filter as compared to filters with the same mass of fullerene soot indicating that the MAC for the propane soot particles was significantly higher than the MAC for fullerene soot. The values in the literature suggest that propane soot can have an MAC on the order of 12–15 m2/g [12,14], while fullerene soot has been reported to have a MAC value between 7 and 10 m2/g [15]. Figure 5 shows the temperature increase for the LAHM calibration filters made with fullerene soot along with several propane soot filters as a function of micrograms of BC of each type. The temperature increase for the propane soot particles was substantially more than the temperature increase for the fullerene soot filters with the same mass, confirming the MAC difference from previous studies as well as with the PAAS-3λ measurements at AIDA. A fit equation to the propane soot filters is shown in Equation (3).
M = 2.42 × exp (T30 × 0.236) − 3.0
As Equations (2) and (3) are similar aside from the prefactor, it can be estimated that the MAC difference between Fullerene soot and propane soot is the ratio of the prefactors, indicating that the propane soot has an MAC value 1.42 times higher than Fullerene soot, which fits reasonably within the ranges mentioned in the previous paragraph.

4.2. Ambient Measurements of Absorption Coefficient

The Karlsruhe Institute of Technology, Karlsruhe, Germany conducted measurements with a PAAS-3λ for two months of ambient sampling during the winter of 2019. The 25 mm sample filters were collected in conjunction with PAAS-3λ measurements. The PAAS-3λ sampled continuously provided measurements of photoacoustic absorption coefficient [1/m] at three wavelengths (405 nm, 532 nm, 658 nm) with high time resolution, while the filters collected aerosol for periods between 1 and 4 days. As the PAAS-3λ alternates wavelengths during measurement cycles, the average absorption coefficient was taken for each filter sampling period; then, the value was scaled by the filter sample duration and the volume sampling rate (i.e., the total sampled volume). This led to an estimate of the absorption cross section [cm2] of all particles on the filter. This absorption cross section was plotted versus LAHM temperature after 30 s of light exposure. One important note is that the physical sampling area of a 25 mm diameter filter is approximately 7 cm2; thus, values higher than this in the PAAS data suggest that there would be significant particle overlap on the filter. Figure 6 shows the fit data and the measurement data. Equations (4)–(6) show the relationship between the LAHM response and blue, green, and red photoacoustic absorption.
Ablue = 0.34 × exp (T30 × 0.26)
Agreen = 0.17 × exp (T30 × 0.28)
Ared = 0.15 × exp (T30 × 0.28)

5. Conclusions

The Light Absorption Heating Method instrument fulfills a significant need in research and monitoring. For applications such as the measurement of light absorption by particles on snow, the LAHM instrument provides a method to quantify the absorption characteristics of the particle population making it much more straightforward to quantify the impact of the particle population. This compares to other techniques that measure particle concentrations, sizes, and composition, and use those particle characteristics to calculate the light absorption. For air pollution sampling, the LAHM instrument can be used to estimate the bulk absorption cross section of particles collected on filters. In this article, we have shown that the LAHM instrument is very stable, provides repeatable results over time, and that potential uncertainties can be quantified or minimized. The results are comparable to other techniques of measuring absorption; however, knowledge of the particle MAC is critical to determining exact mass of a specific particle type. Conversely, with knowledge of the exact mass, the LAHM instrument provides a unique method to directly measure the relative differences in MAC for different substances. Additionally, the LAHM instrument is made of low cost components making it cost effective for student projects, laboratory classes, as well as for research and monitoring by research groups with lower levels of financial support.
For optimal results, the filters should be lightly loaded. Absorption cross sections of more than half of the filter area can lead to substantial uncertainties. If the absorption cross section is too high, the likelihood of absorbing particles being hidden by other particles increases significantly.
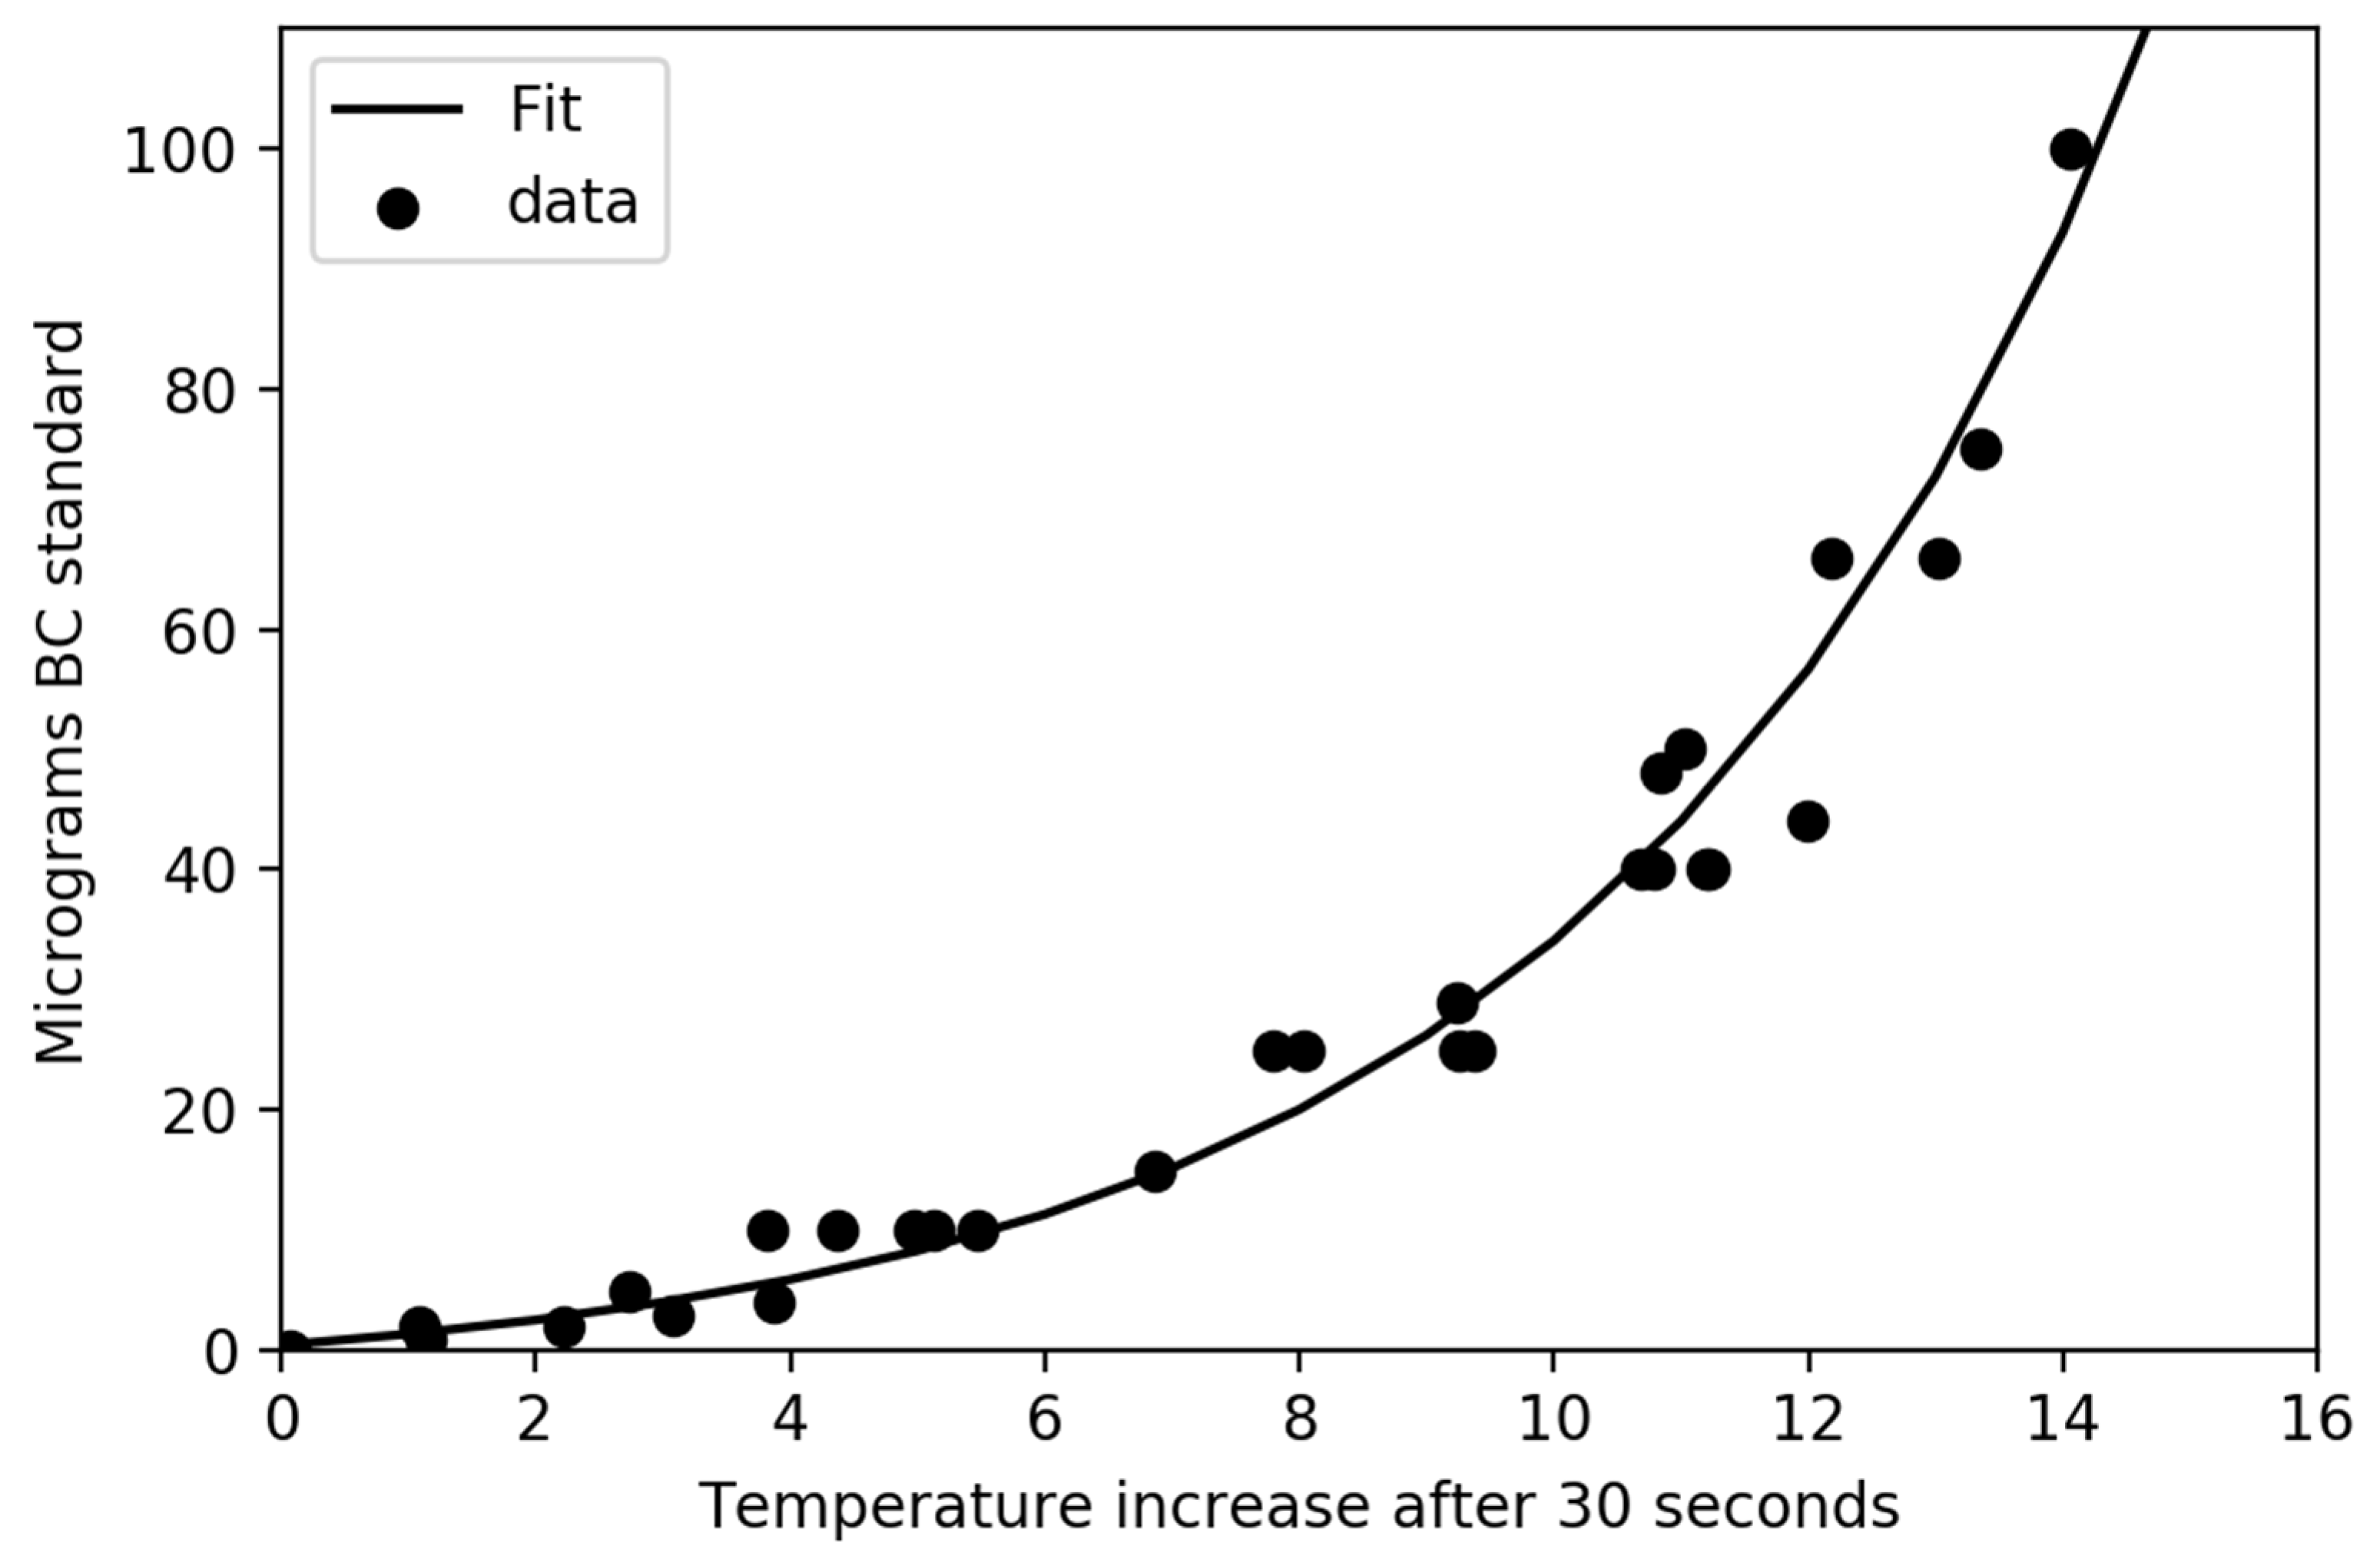
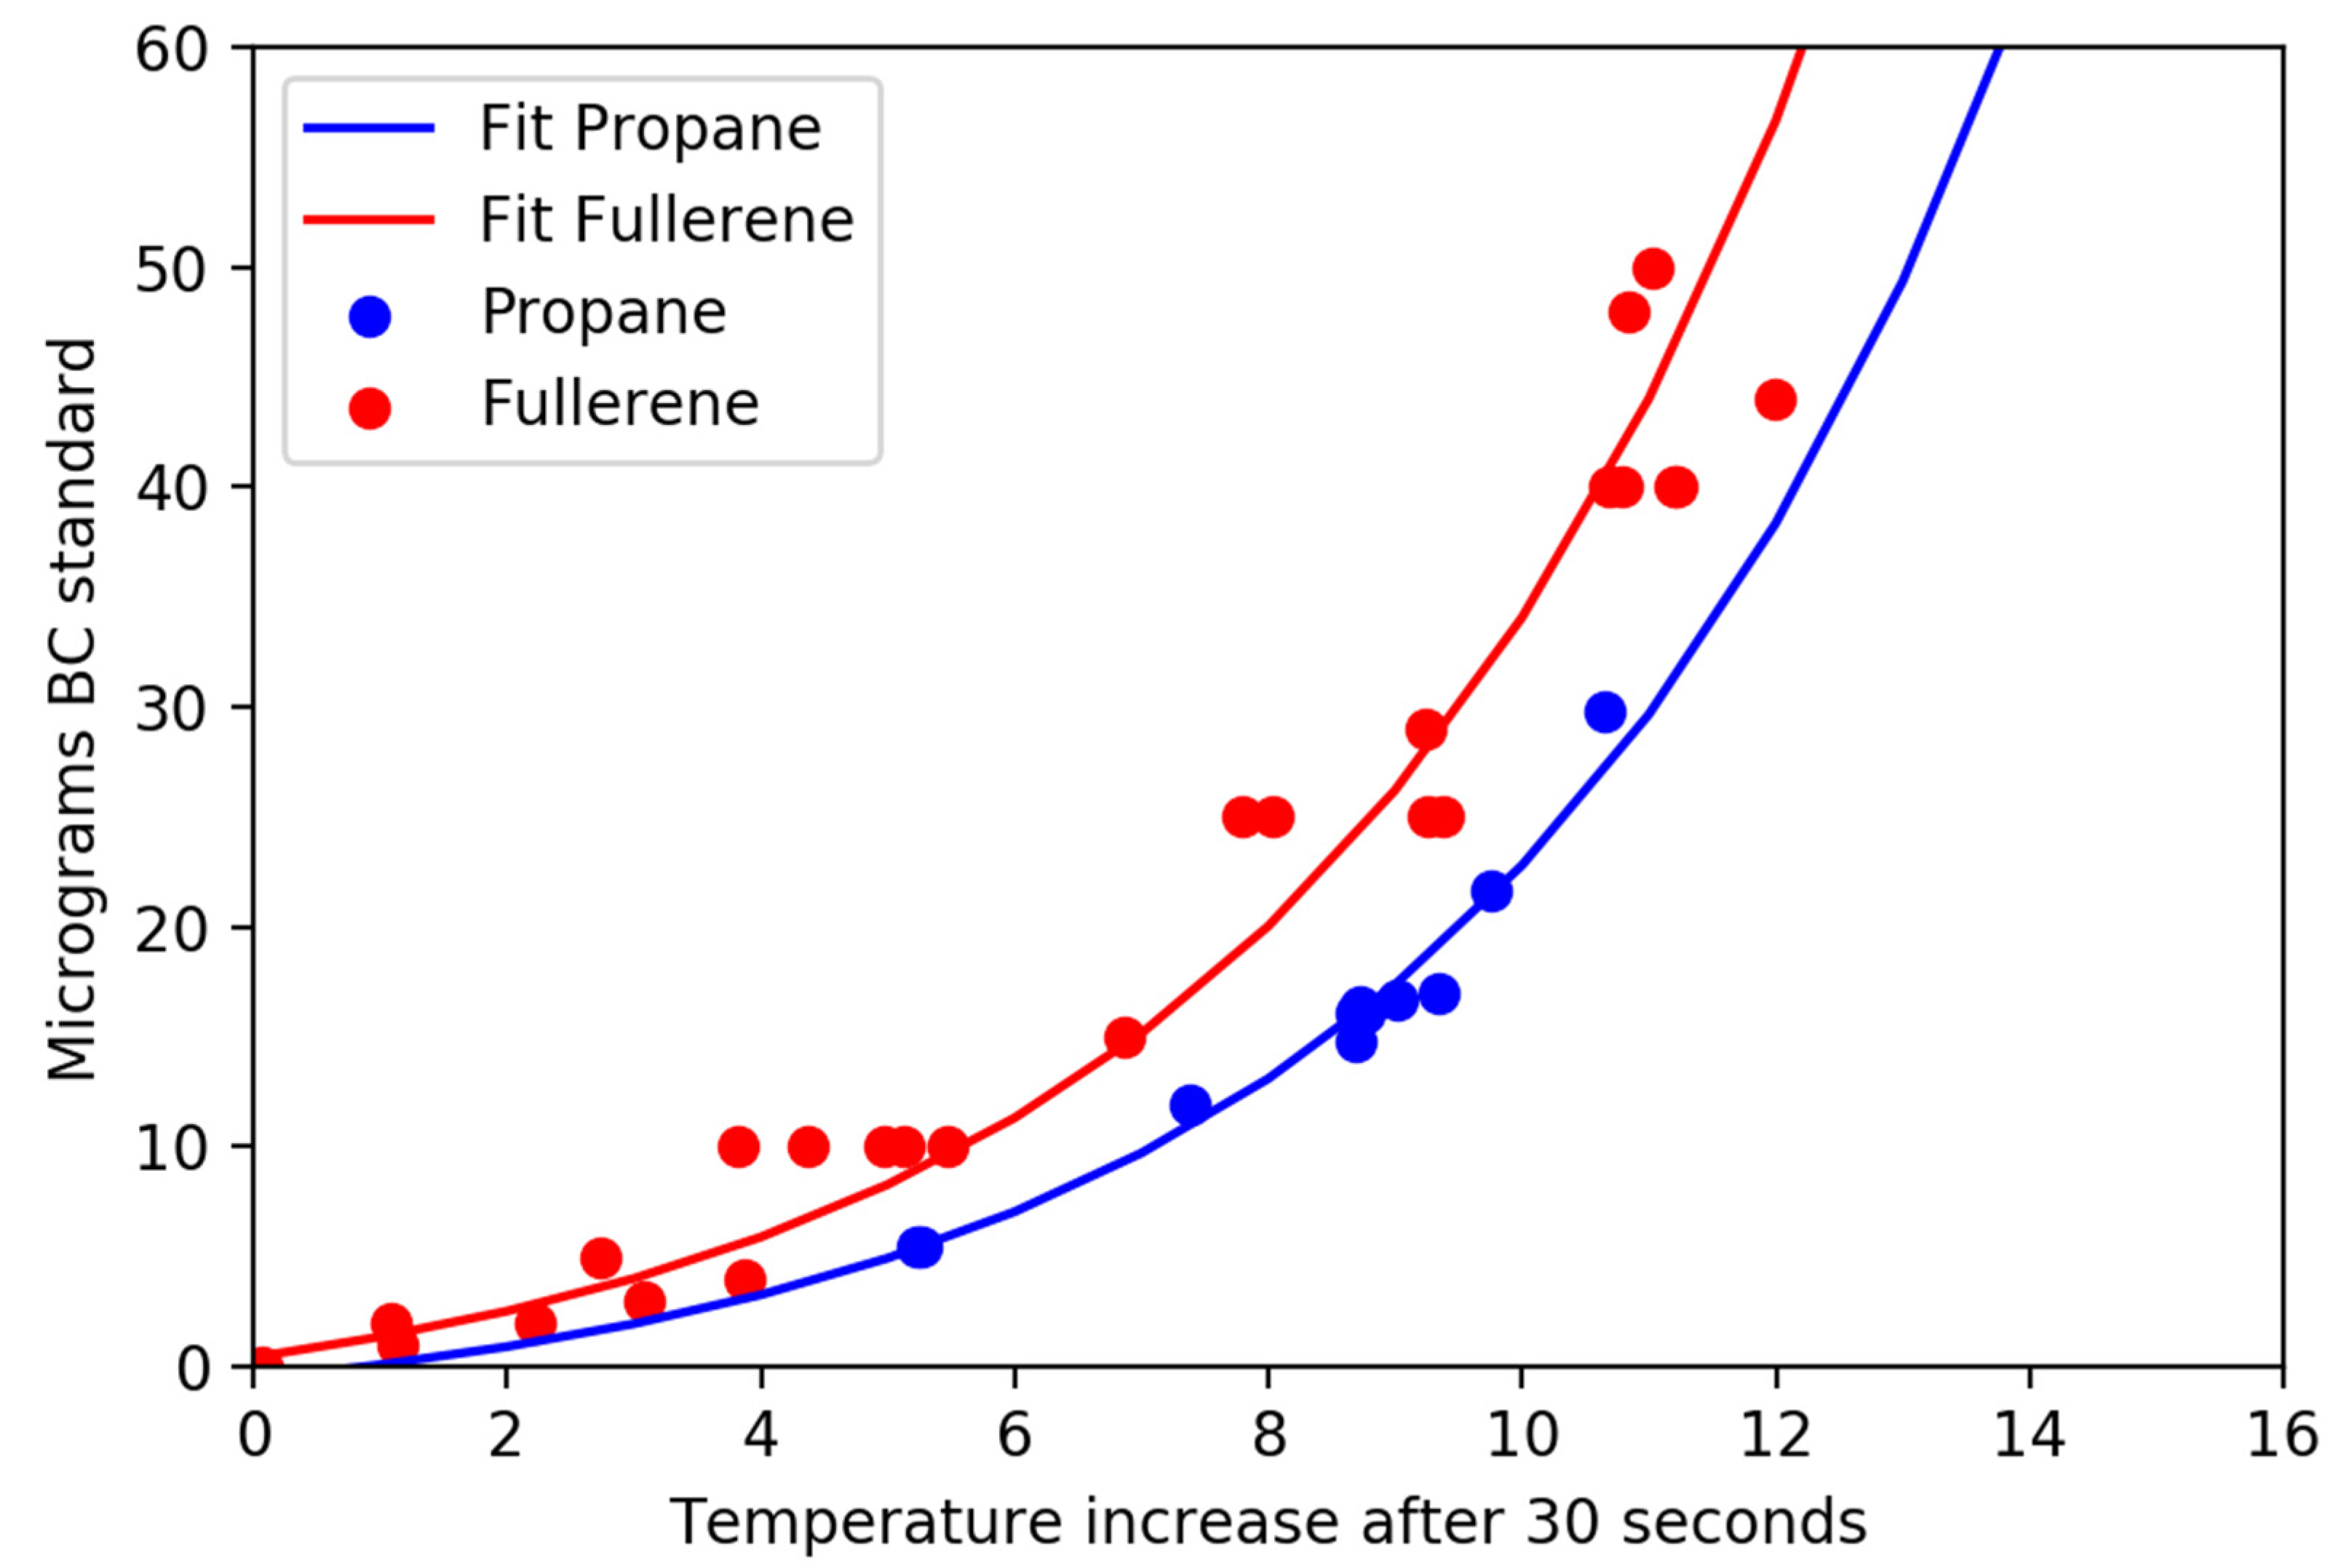
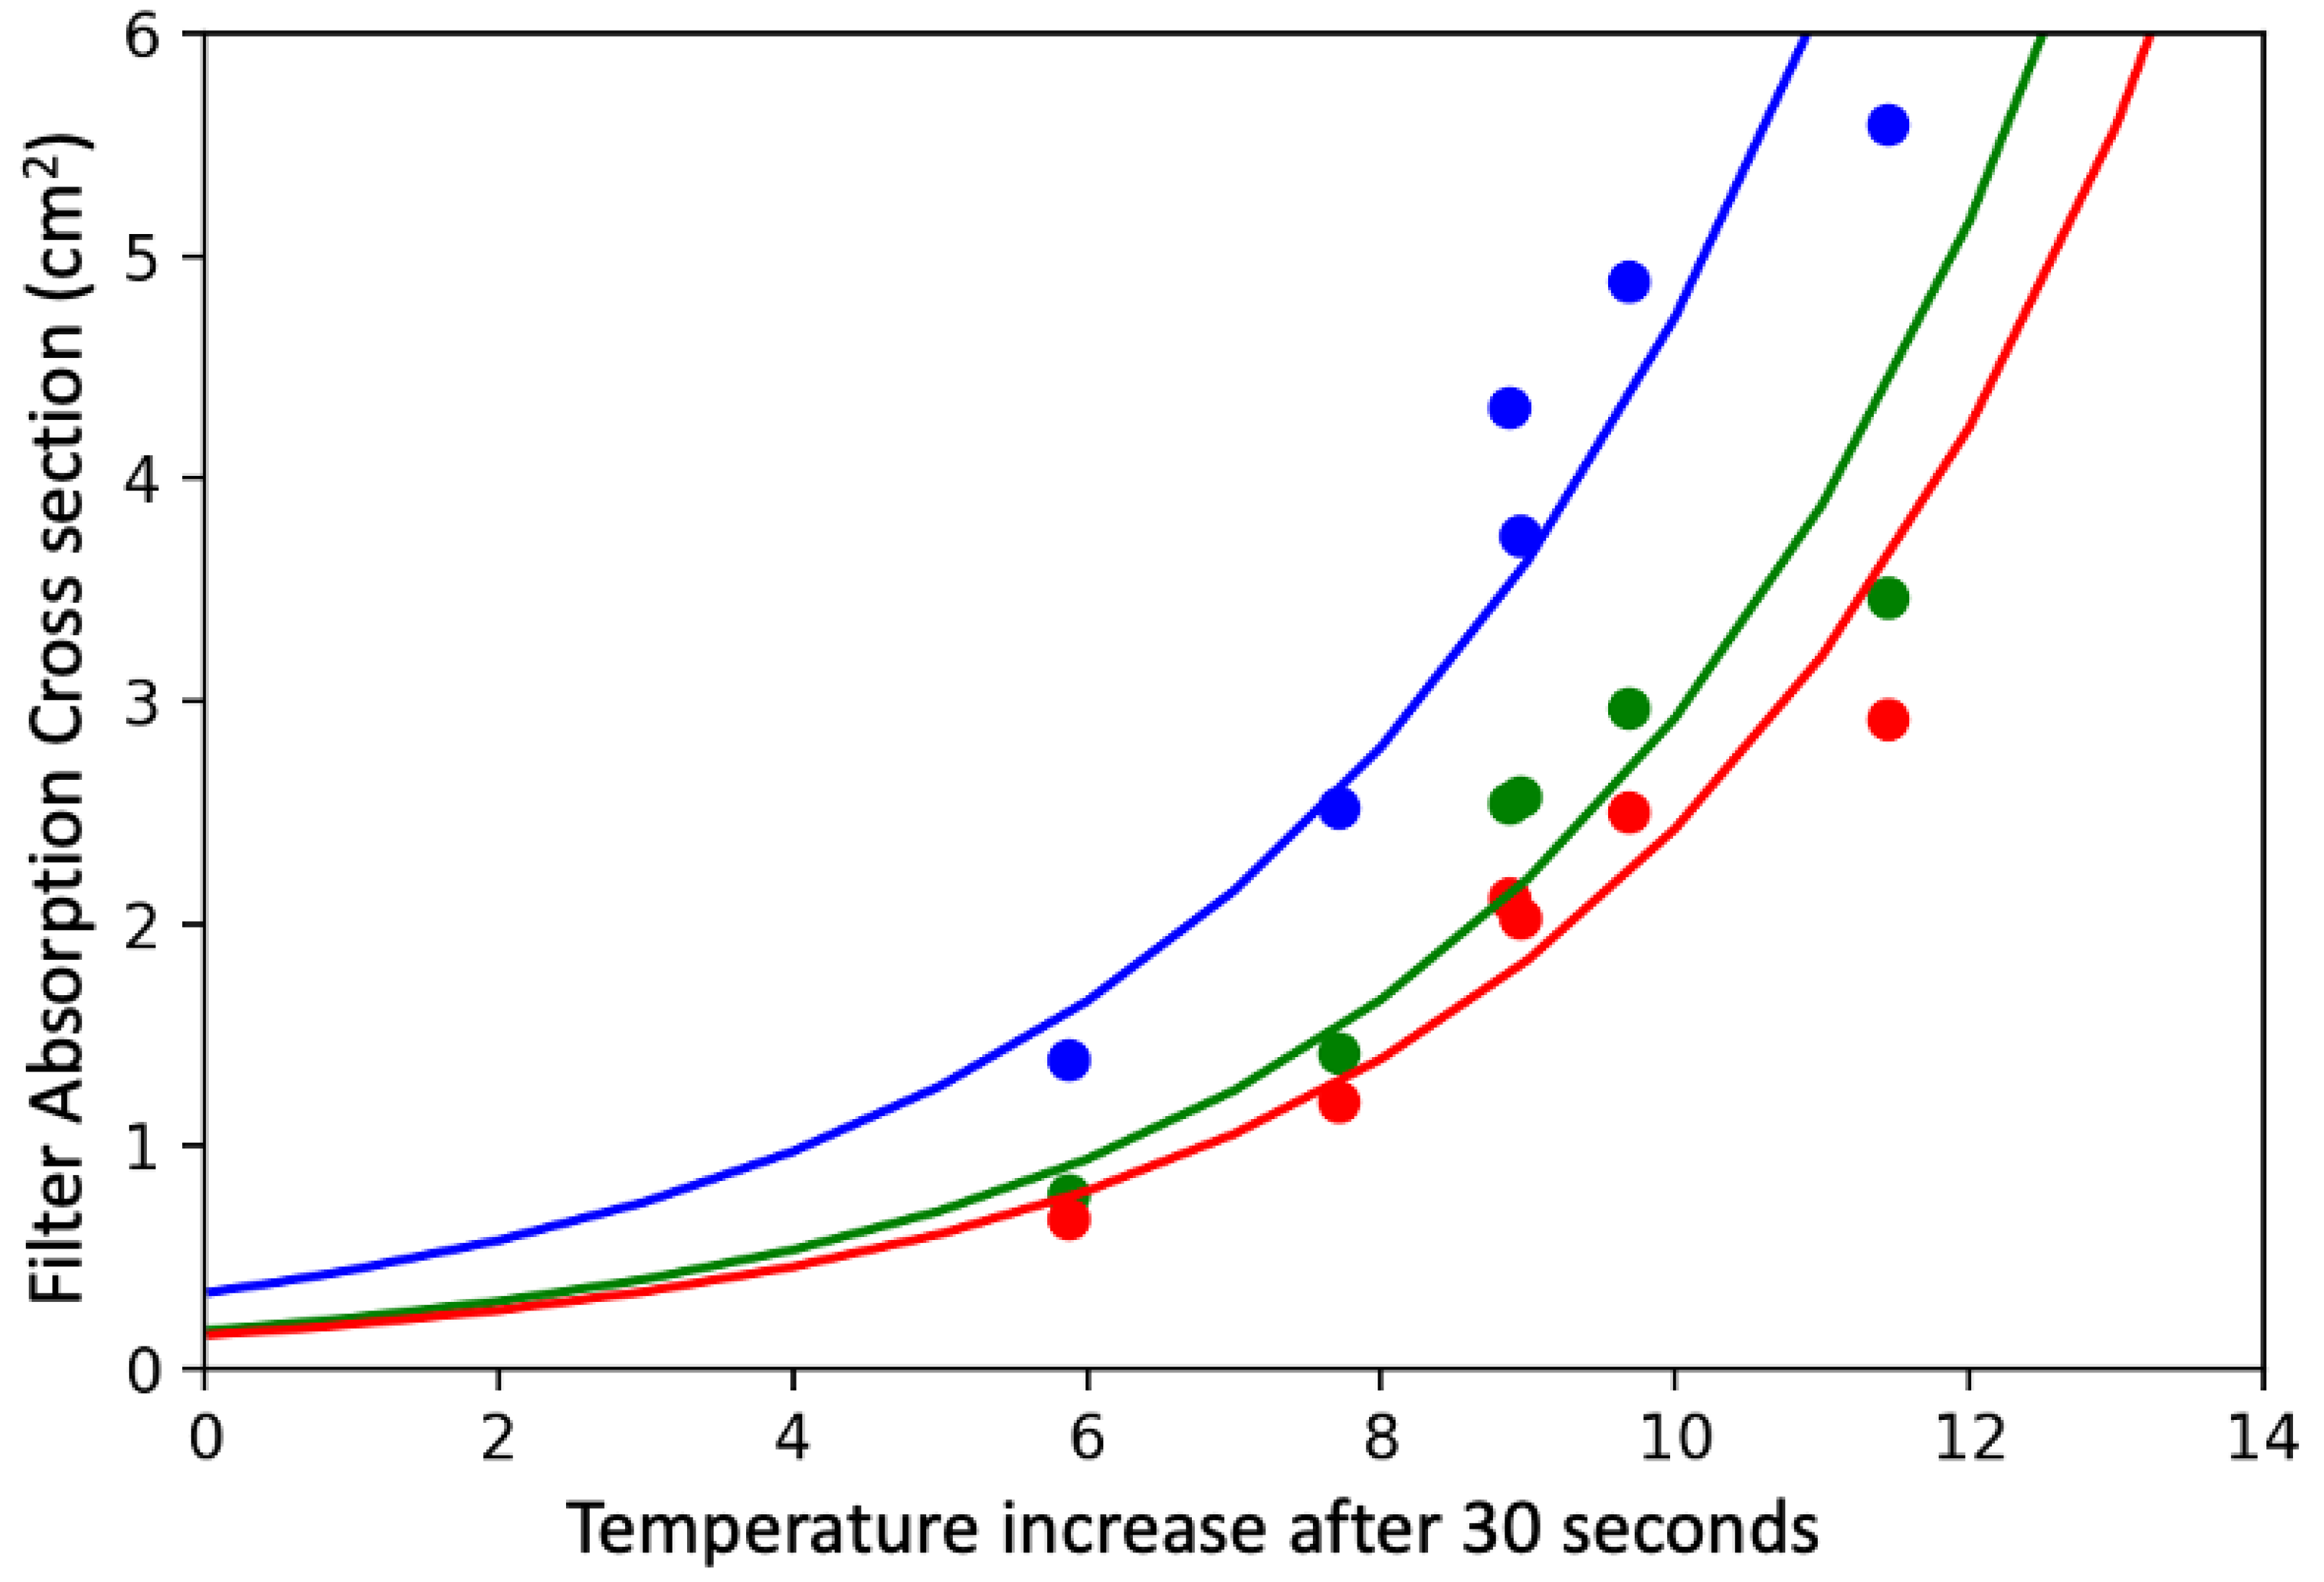
 Figure 3 and Figure 5 clearly demonstrate that small differences in mass can lead to large changes in temperature when the total mass loads are low; thus, the sensitivity is much better at low values of absorption. Data from overloaded filters (not shown) suggests that particles with different MAC values behave quite differently, likely due to scattering within the particles on the filter. This suggests an upper limit of approximately 25 micrograms of highly efficient absorbers (soot) on a 25 mm filter or up to 100 micrograms of soot on a 47 mm filter. While the results presented herein are for 25 mm filters, relationships for 47 mm filters are under development. Uncertainty estimates suggest that there is a potential 1% uncertainty in temperature change for a filter that warms 12 °C which leads to an uncertainty of 3% or less for light absorption.

Author Contributions

Conceptualization, C.G.S. and W.P.A.; methodology, C.G.S.; software, C.G.S.; validation, M.S. and C.L.; formal analysis, C.G.S. All authors have read and agreed to the published version of the manuscript.

Funding

C.G.S. and W.P.A. received no external funding for this research. M.S., and C.L., received funding from the German Helmholtz Research Program Atmosphere and Climate. The APC was funded by Natural Systems Research INC.

Institutional Review Board Statement

Not applicable.

Informed Consent Statement

Not applicable.

Data Availability Statement

LAHM data shown in this publication are available at: www.naturalsystemsresearch.com/Data.html (accessed on 1 April 2022).

Acknowledgments

The authors would like to thank John All, Rebecca Cole, and Ellen Lapham and the American Climber Science program for providing the motivation to develop the LAHM instrument. The authors would like to thank Joshua P Schwarz for assistance with creating Fullerene soot calibration filters.

Conflicts of Interest

C.G.S. is a co-owner of Natural Systems Research INC which sells the LAHM instrument.

References

  1. Chow, J.C.; Watson, J.G.; Lowenthal, D.H.; Solomon, P.A.; Magliano, K.L.; Ziman, S.D.; Richards, L.W. PM10 and PM2.5 Compositions in California’s San Joaquin Valley. Aerosol Sci. Technol. 1993, 18, 105–128. [Google Scholar] [CrossRef] [Green Version]
  2. Peng, F.; Effler, S.W.; Pierson, D.C.; Smith, D.G. Light-scattering features of turbidity-causing particles in interconnected reservoir basins and a connecting stream. Water Res. 2009, 43, 2280–2292. [Google Scholar] [CrossRef] [PubMed]
  3. Doherty, S.J.; Warren, S.G.; Grenfell, T.C.; Clarke, A.D.; Brandt, R.E. Light-absorbing impurities in arctic snow. Atmos. Chem. Phys. 2010, 10, 11647–11680. [Google Scholar] [CrossRef] [Green Version]
  4. Schmitt, C.G.; All, J.D.; Schwarz, J.P.; Arnott, W.P.; Cole, R.J.; Lapham, E.; Celestian, A. Measurements of light-absorbing particles on the glaciers in the Cordillera Blanca, Peru. Cryosphere 2015, 9, 331–340. [Google Scholar] [CrossRef] [Green Version]
  5. McConnell, J.R.; Edwards, R.; Kok, G.L.; Flanner, M.G.; Zender, C.S.; Saltzman, E.S.; Banta, J.R.; Pasteris, D.R.; Carter, M.M.; Kahl, J.D.W. 20th-century industrial black carbon emissions altered Arctic climate forcing. Science 2007, 317, 1381–1384. [Google Scholar] [CrossRef] [PubMed] [Green Version]
  6. Khan, A.L.; Dierssen, H.; Schwarz, J.P.; Schmitt, C.; Chlus, A.; Hermanson, M.; Painter, T.H.; McKnight, D.M. Impacts of coal dust from an active mine on the spectral reflectance of Arctic surface snow in Svalbard, Norway. J. Geophys. Res. Atmos. 2017, 122, 1767–1778. [Google Scholar] [CrossRef]
  7. Lin, C.I.; Baker, M.; Charlson, R.J. Absorption coefficient of atmospheric aerosol: A method for measurement. Appl. Opt. 1973, 12, 1356–1363. [Google Scholar] [CrossRef] [PubMed]
  8. Cereceda-Balic, F.; Gorena, T.; Soto, C.; Vidal, V.; Lapuerta, M.; Moosmuller, H. Optical determination of black carbon mass concentrations in snow samples: A new analytical method. Sci. Total Environ. 2019, 697, 133934. [Google Scholar] [CrossRef] [PubMed]
  9. Grenfell, T.C.; Doherty, S.J.; Clarke, A.D.; Warren, S.G. Light absorption from particulate impurities in snow and ice determined by spectrophotometric analysis of filters. Appl. Opt. 2011, 50, 2037–2048. [Google Scholar] [CrossRef] [PubMed]
  10. Baumgardner, D.; Popovicheva, O.; Allan, J.; Bernardoni, V.; Cao, J.; Cavalli, F.; Cozic, J.; Diapouli, E.; Eleftheriadis, K.; Genberg, P.J.; et al. Soot reference materials for instrument calibration and intercomparisons: A workshop summary with recommendations. Atmos. Meas. Tech. 2012, 5, 1869–1887. [Google Scholar] [CrossRef] [Green Version]
  11. Schwarz, J.P.; Doherty, S.J.; Li, F.; Ruggiero, S.T.; Tanner, C.E.; Perring, A.E.; Gao, R.S.; Fahey, D.W. Assessing Single Particle Soot Photometer and Integrating Sphere/Integrating Sandwich Spectrophotometer measurement techniques for quantifying black carbon concentration in snow. Atmos. Meas. Tech. 2012, 5, 2581–2592. [Google Scholar] [CrossRef] [Green Version]
  12. Linke, C.; Ibrahim, I.; Schleicher, N.; Hitzenberger, R.; Andreae, M.O.; Leisner, T.; Schnaiter, M. A novel single-cavity three-wavelength photoacoustic spectrometer for atmospheric aerosol research. Atmos. Meas. Tech. 2016, 9, 5331–5346. [Google Scholar] [CrossRef] [Green Version]
  13. Schnaiter, M.; Gimmler, M.; Llamas, I.; Linke, C.; Jager, C.; Mutaschke, H. Strong spectral dependence of light absorption by organic carbon particles formed by propane combustion. Atmos. Chem. Phys. 2006, 6, 2981–2990. [Google Scholar] [CrossRef] [Green Version]
  14. Laborde, M.; Schnaiter, M.; Linke, C.; Saathoff, H.; Naumann, K.-H.; Möhler, O.; Berlenz, S.; Wagner, U.; Taylor, J.W.; Liu, D.; et al. Single Particle Soot Photometer intercomparison at the AIDA chamber. Atmos. Meas. Tech. 2012, 5, 3077–3097. [Google Scholar] [CrossRef] [Green Version]
  15. Schnaiter, M.; Linke, C.; Ibrahim, I.; Kiselev, A.; Waitz, F.; Leisner, T.; Norra, S.; Rehm, T. Specifying the light-absorbing properties of aerosol particles in fresh snow samples, collected at the Environmental Research Station Schneefernerhaus (UFS), Zugspitze. Atmos. Chem. Phys. 2019, 19, 10829–10844. [Google Scholar] [CrossRef] [Green Version]
Figure 1. Schematic drawing and image of the LAHM instrument. The schematic view is a cross section through the instrument with blue representing the plexiglass sheets or transparent rubber feet (highest and lowest) to support the instrument or to support the lightbulb. The upper (wider) level of the open air space is not closed on the adjacent sides, which allows air warmed by the filter through conduction and convection to escape. The upper right plot shows the measured spectrum of the lightbulb compared to the IRT sensitivity.
Atmosphere 13 00824 g001
Figure 2. Eight measured temperature profiles for calibration filters. The calibration filters had between 0 and 100 micrograms of fullerene soot.
Atmosphere 13 00824 g002
Figure 3. Calibration curve developed for LAHM for fullerene soot coated Millipore filters. Each dot represents one calibration filter, and the solid line is an empirical fit to the data.
Atmosphere 13 00824 g003
Figure 4. Demonstration of instrument stability. (a) Experiment showing 80 two minute cycles with 30 s with illumination followed by 90 s without illumination. (b) All 120 s from (a) plotted together after subtracting the mean of the 10 s before each illumination phase. The standard deviation at each time step multiplied by 100 is also shown. (c) Same as (a) except the instrument was moved into direct sunlight, then returned to the shade where indicated. (d) Same as (b) showing the increased standard deviation caused by the change in lighting.
Atmosphere 13 00824 g004
Figure 5. Temperature to BC mass relationship for two different types of soot, fullerene soot (orange), or propane flame soot (blue).
Atmosphere 13 00824 g005
Figure 6. LAHM Tcorr plotted versus the filter absorption cross section deduced from collocated photoacoustic measurements of the spectral absorption coefficient for Karlsruhe ambient air. The individual wavelengths of the PAAS instrument are represented in blue (405 nm), green (532 nm), and red (658 nm).
Atmosphere 13 00824 g006
Publisher’s Note: MDPI stays neutral with regard to jurisdictional claims in published maps and institutional affiliations.

