Article

Temporal Distribution and Source Apportionment of Composition of Ambient PM2.5 in Urumqi, North-West China

1
Autonomous Region Key Laboratory of Clean Coal Conversion and Chemical Process, Xinjiang University, Urumqi 830046, China
2
Guangdong Provincial Key Laboratory of Water and Air Pollution Control, South China Institute of Environmental Science, Ministry of Ecology and Environment, Guangzhou 510655, China
3
State Key Laboratory of Organic Geochemistry, Guangzhou Institute of Geochemistry, Chinese Academy of Sciences, Guangzhou 510640, China
4
Guangdong-Hong Kong-Macao Joint Laboratory for Environmental Pollution and Control, Guangzhou Institute of Geochemistry, Chinese Academy of Sciences, Guangzhou 510640, China
*
Authors to whom correspondence should be addressed.
Atmosphere 2022, 13(5), 781; https://doi.org/10.3390/atmos13050781
Submission received: 28 April 2022 / Revised: 9 May 2022 / Accepted: 10 May 2022 / Published: 12 May 2022
(This article belongs to the Special Issue Effects of Outdoor Pollutants on Human Health)

Abstract

:
In order to identify the pollution characteristics and sources of PM2.5 in Urumqi, fine particulate matter samples were collected from September 2017 to August 2018, and the water-soluble ions (WSIs), organic carbon (OC), elemental carbon (EC), polycyclic aromatic hydrocarbons (PAHs), and metal elements were analyzed. The results indicate that the annual mass concentration of PM2.5 in Urumqi was 158.85 ± 15.11 μg/m3, with the highest seasonal average in autumn (180.49 ± 87.22 μg/m3) and the lowest in summer (148.41 ± 52.60 μg/m3). SO42− (13.58 ± 16.4 μg/m3), NO3 (13.46 ± 17.5 μg/m3), and NH4+ (10.88 ± 12.2 μg/m3) were the most abundant WSIs, and the secondary inorganic ions (SNA = SO42− + NO3 + NH4+) accounted for 87.23% of the WSIs. The NO3/SO42− ratio indicates that the contribution of stationary sources was dominant. The annual concentrations of OC and EC were 12.00 ± 4.4 µg/m3 and 5.00 ± 3.5 µg/m3, respectively, the OC/EC ratios in winter (2.55 ± 0.7), spring (3.43 ± 1.3), and summer (3.22 ± 1.1) were greater than 2, and there was the formation of secondary organic carbon (SOC). The correlation between OC and EC in spring in Urumqi (R2 = 0.53) was low. In the PM2.5, Al and Fe were the most abundant elements. The highest mass concentration season occurred in autumn, with mass concentrations of 15.11 ± 10.1 µg/m3 and 8.33 ± 6.9 µg/m3, respectively. The enrichment factor (EF) shows that most of the metal elements come from natural sources, and the Cd element mainly comes from anthropogenic sources. PAHs with a middle molecular weight were the main ones, and the annual average annual mass concentration of the PAHs was 451.35 ng/m3. The positive matrix factor model (PMF) source analysis shows that there are five main sources of PM2.5 in Urumqi, including crustal minerals, biomass combustion, coal combustion, vehicular transport, and secondary aerosols. The distribution percentages of these different sources were 19.2%, 10.2%, 12.1%, 8.2%, and 50.3%, respectively.

1. Introduction

For a long time, the pollution of fine particulate matter (PM2.5) has had a substantial impact on all aspects of society, which has attracted great attention from scholars [1,2]. Fine particulate matter has potential effects on human health, including upper respiratory tract irritation, asthma attacks, lung cancer, and heart disease [3,4]. In addition, high concentrations of PM2.5 seriously reduce visibility in the atmosphere, leading to the delay of flights [5]. Studies have shown that more than 60% of the main components of PM2.5 are metal elements, water-soluble ions, and organic matter [6].
Urumqi is located in central Xinjiang, northwestern China, at the center of the Eurasian continent, the northern foot of the middle section of the Tianshan Mountains, and the southern edge of the Junggar Basin. It is adjacent to Central Asian countries and is the largest city in the world farthest from the ocean. Under the promotion of the “One Belt And One Road” national strategy, “five centers”, namely a transportation hub center, a medical service center, a financial service center, a culture science and education center, and a trade and logistics center, will be built in the future. As the core area of the silk road economic belt, their status will be increasingly prominent [7]. However, the energy of Urumqi is dominated by fossil fuels such as coal and natural gas. Coupled with the stable atmospheric structure (especially in winter), it is difficult to form the atmospheric conditions for diffusing pollutants, and the content of fine particles in the air keeps increasing, which makes the atmospheric pollution more and more serious [8].
At present, there are many types of research on the concentration characteristics and sources of pollutants in the atmospheric PM2.5 in Urumqi. Turap et al. [6] studied the chemical characteristics and sources of PM2.5 collected from October 2012 to May 2013, which showed that after the conversion of heating coal to natural gas in winter in Urumqi, the mass concentration of PM2.5 decreased significantly, with an average concentration of 197.40 μg/m3 in winter. Ren et al. [9] studied Urumqi in January–March 2012 and January-March 2014 for the “shifting coal to natural gas” project, and the results showed that the concentrations of n-alkanes, PAHs, and OPAHs decreased by 74%, 74%, and 82%, respectively, after the implementation of the project. Zhang et al. [8] used the PMF model to analyze the sources of water-soluble ions in PM2.5 collected from 2017 to 2018 and found that the four main sources of target components in PM2.5 in Urumqi’s atmosphere were crustal materials (9.8%), residential coal and motor vehicle exhaust (58.6%), biomass combustion (17.2%), and industrial emissions (14.4%). It is an urgent need to investigate which materials and emission sources contribute to PM2.5 in different seasons in order to develop effective control strategies. This article comprehensively analyzes the concentrations of water-soluble ions, carbonaceous matter, polycyclic aromatic hydrocarbons, and metal elements of PM2.5 in Urumqi over a whole year (2017–2018), and we used the source analysis method to explore the possible sources of PM2.5.

2. Materials and Methods

2.1. Sample Collection

The sampling point was located on the roof (25 m) of Xinjiang University of No. 9 (43.76 N, 87.61 E) in Urumqi (Figure 1). The site is 200 m away from the main traffic road and adjacent to residential and commercial building streets and urban construction sites, which is representative of the living area of urban Urumqi. A quartz fiber filter (203 × 254 mm, Whatman, UK) was prebaked at 450 °C for 4 h to remove the organic matter that may be contained on the surface of the quartz film. PM2.5 samples were collected with a high-volume PM sampler (TH-1000, Wuhan Tianhong Instruments Co., Ltd., Wuhan, China) for 22 h. The seasons were categorized as follows: autumn (September–November, n = 13), winter (December–February, n = 11), spring (March–May, n = 19), and summer (June–August, n = 22). During each sampling episode, the gaseous pollutants and meteorological data were recorded (https://www.aqistudy.cn/, accessed on 15 April 2022). Each filter was measured using an electronic microbalance (AB204-S, Mettler-Toledo, accuracy: 1/10,000). The weight difference was used to calculate the net mass and concentration of PM2.5. After sampling, the filters were wrapped in aluminum foil and saved under −20 °C conditions to prevent the evaporation of volatilized components before analysis.

2.2. Chemical Analysis

The water-soluble five cations (NH4+, Ca2+, Na+, K+, Mg2+) and five anions (SO42−, NO3, F, PO43−, Cl) anions were analyzed using ion chromatography (883 Basic IC Plus). The detection limits of Na+, NH4+, K+, Mg2+, Ca2+, SO42−, NO3, PO43−, Cl, and F were 0.014, 0.014, 0.046, 0.017, 0.041, 0.018, 0.032, 0.136, 0.022, and 0.026 μg/m3, respectively, and the recovery of each ion was 90–105%. The analysis of OC and EC was performed using the DRI2015 Multi-band Carbon Analyzer from the Desert Research Institute of the United States. The method detection limits (MDLs) for the OC and EC were 0.18 ± 0.06 and 0.04 ± 0.01 μg/m3, respectively. Replicate measurements were performed every three samples, and the differences among the replicates were <10%.
The pretreatment of the WSOC was consistent with that of the WSIs. The concentration of WSOC was determined using a total carbon analyzer (Sievers M9, General Electric Company, Boston, MA, USA) with a detection limit of 0.03 μg/m3. The analysis process consisted of two stages: First, the sample was acidified by 6 mol/L H3PO4 and then entered into the inorganic carbon remover (ICR) to measure the content of CO2. Second, the total CO2 content of the sample was detected after oxidation by 15% (NH4)2S2O8 and an ultraviolet lamp. The difference between the two results was the concentration of WSOC. This process was repeated three times for each sample, and the differences among the replicates were <5%.
The samples were analyzed by an Agilent 7890/5975C gas chromatography-mass spectrometer (GC–MS) equipped with an HP-5 capillary column (30 m, 0.25 mm, 0.25 μm). Helium was used as the carrier gas, with a constant flow rate of 1.2 mL/min. The auto-injection of 1 μL samples was conducted with a solvent delay of 6 min. Sixteen PAHs and their detection limits were quantified as follows: naphthalene (Nap)—0.01, acenaphthylene (Acy)—0.01, acenaphthene (Ace)—0.02, fluorene (Flu)—0.03, phenanthrene (Phe)—0.04, anthracene (Ant)—0.08, fluoranthene (Fla)—0.06, pyrene (Pyr)—0.03, benz(a)anthracene (BaA)—0.10, chrysene (Chry)—0.10, benzo(b)fluoranthene (BbF)—0.13, benzo(k)fluoranthene (BkF)—0.03, benzo(a)pyrene (BaP)—0.05, benzo(ghi)perylene (BghiP)—0.07, indeno(cd)pyrene (IcdP)—0.07, dibenzo(a,h)anthrancene (DahA)—0.05.
The cut quartz filter (area of 5.06 cm2) was put into a mixture of acid (4 mL of 67–70% HNO3 and 1 mL of 47–51% HF) and extracted by microwave digestion (XT-9912, Shanghai, China). Then, the determination was carried out using inductively coupled plasma-mass spectrometry (ICP-MS). Nineteen metallic elements were determined: Al, Li, Be, V, Mn, Fe, Co, Ni, Cu, Zn, Ga, As, Rb, Sr, Cd, Cs, Ba, Tl, and Pb. The detection limit of the first 4 elements was 0.01ug/m3, that of the next 4 elements was 0.02 ug/m3, and that of the last 11 elements was 0.12 ug/m3, with an uncertainty of <5%.

2.3. Source Identification Methods

The ratios of the PAHs were used to distinguish the major sources of pollution based on the distinctions among the different source components [10]. The method was applied to identify the sources of the PAHs by using the ratios of Flua/(Flua+Pyr), Ant/(Ant+Phe), IcdP/(IcdP+BghiP), and BaA/(BaA+Chry). When the samples were inconsistent with the isomer ratio, the total index was used to determine the emission of the PAH sources, and the total index equation was defined as in Equation (1) [11]:
Total   index = Flu / ( Flu + Pyr ) 0 . 4 + Ant / ( Ant + Phe ) 0 . 1   + Bap / ( Bap + chry ) 0 . 2   + IcdP / ( IcdP + BghiP ) 0 . 5
The enrichment factor (EF), proposed in the 1970s, is a treatment method used to represent the enrichment degree of elements in the environment and to judge and evaluate the sources of elements [12]. The EF method is often used to distinguish anthropogenic sources from natural processes and to assess the degree of elemental pollution. Its principle is to compare the measured value of the element in the sample with the content of the element background to determine the human influence of the element in the environmental medium. The following equation was used:
EF = ( C i / C r ) Sample / ( C i / C r ) soil   background
In Equation (2), EF is the enrichment factor; it is the ratio of the element content in the sample to the background value of the corresponding element in the soil as the enrichment degree of the element. A value of EF between 0.5 and 2 is generally a natural source, and a value greater than 2 is an anthropogenic source [13]. The source analysis of the total components adopted the US EPA PMF 5.0 model (http://www.epa.gov/heasd/research/pmf.html, accessed on 15 April 2022). Its main principle is to determine the main source and contribution rate of the pollutants by the least square method. When data are put into this model, and when the mass concentration is below the method detection limit (MDL), it is replaced by half of the detection limit. The uncertainty (Unc) of each chemical component is entered into the model due to the uncertainty of the detected chemical component data. If the mass concentration is greater than the detection limit, Equation (3) is used, while Equation (4) is applied if the concentration is less than the method detection limit.
Unc = ( Error   Fraction × Concentration ) 2 + ( 0 . 5 × MDL ) 2
Unc = 5 6 MDL

3. Results and Discussion

3.1. Characteristics of PM2.5 and Chemical Composition

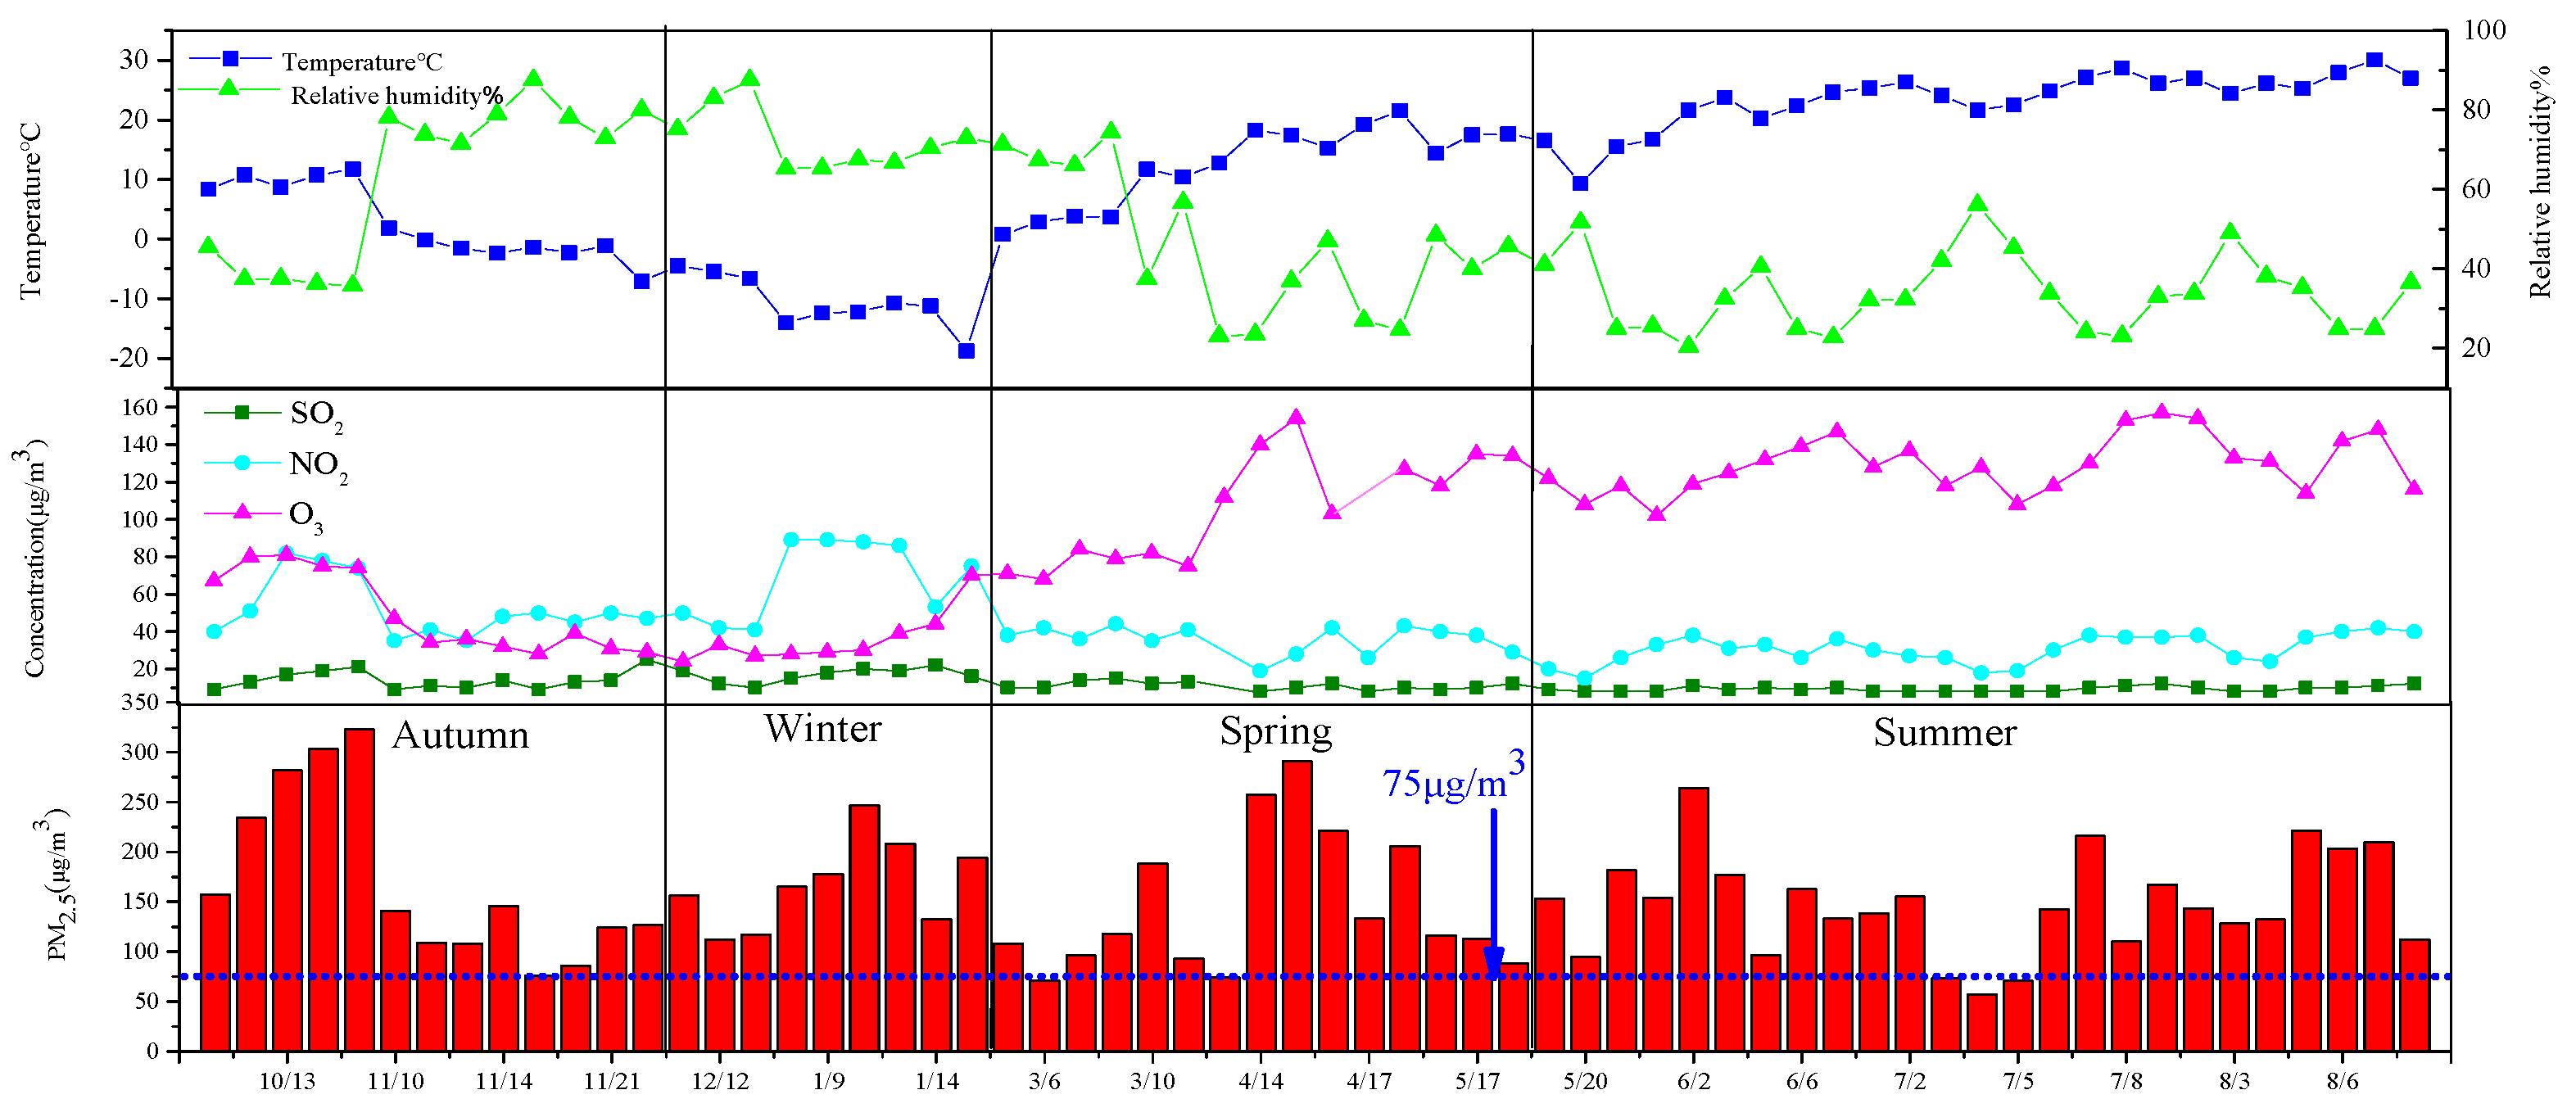
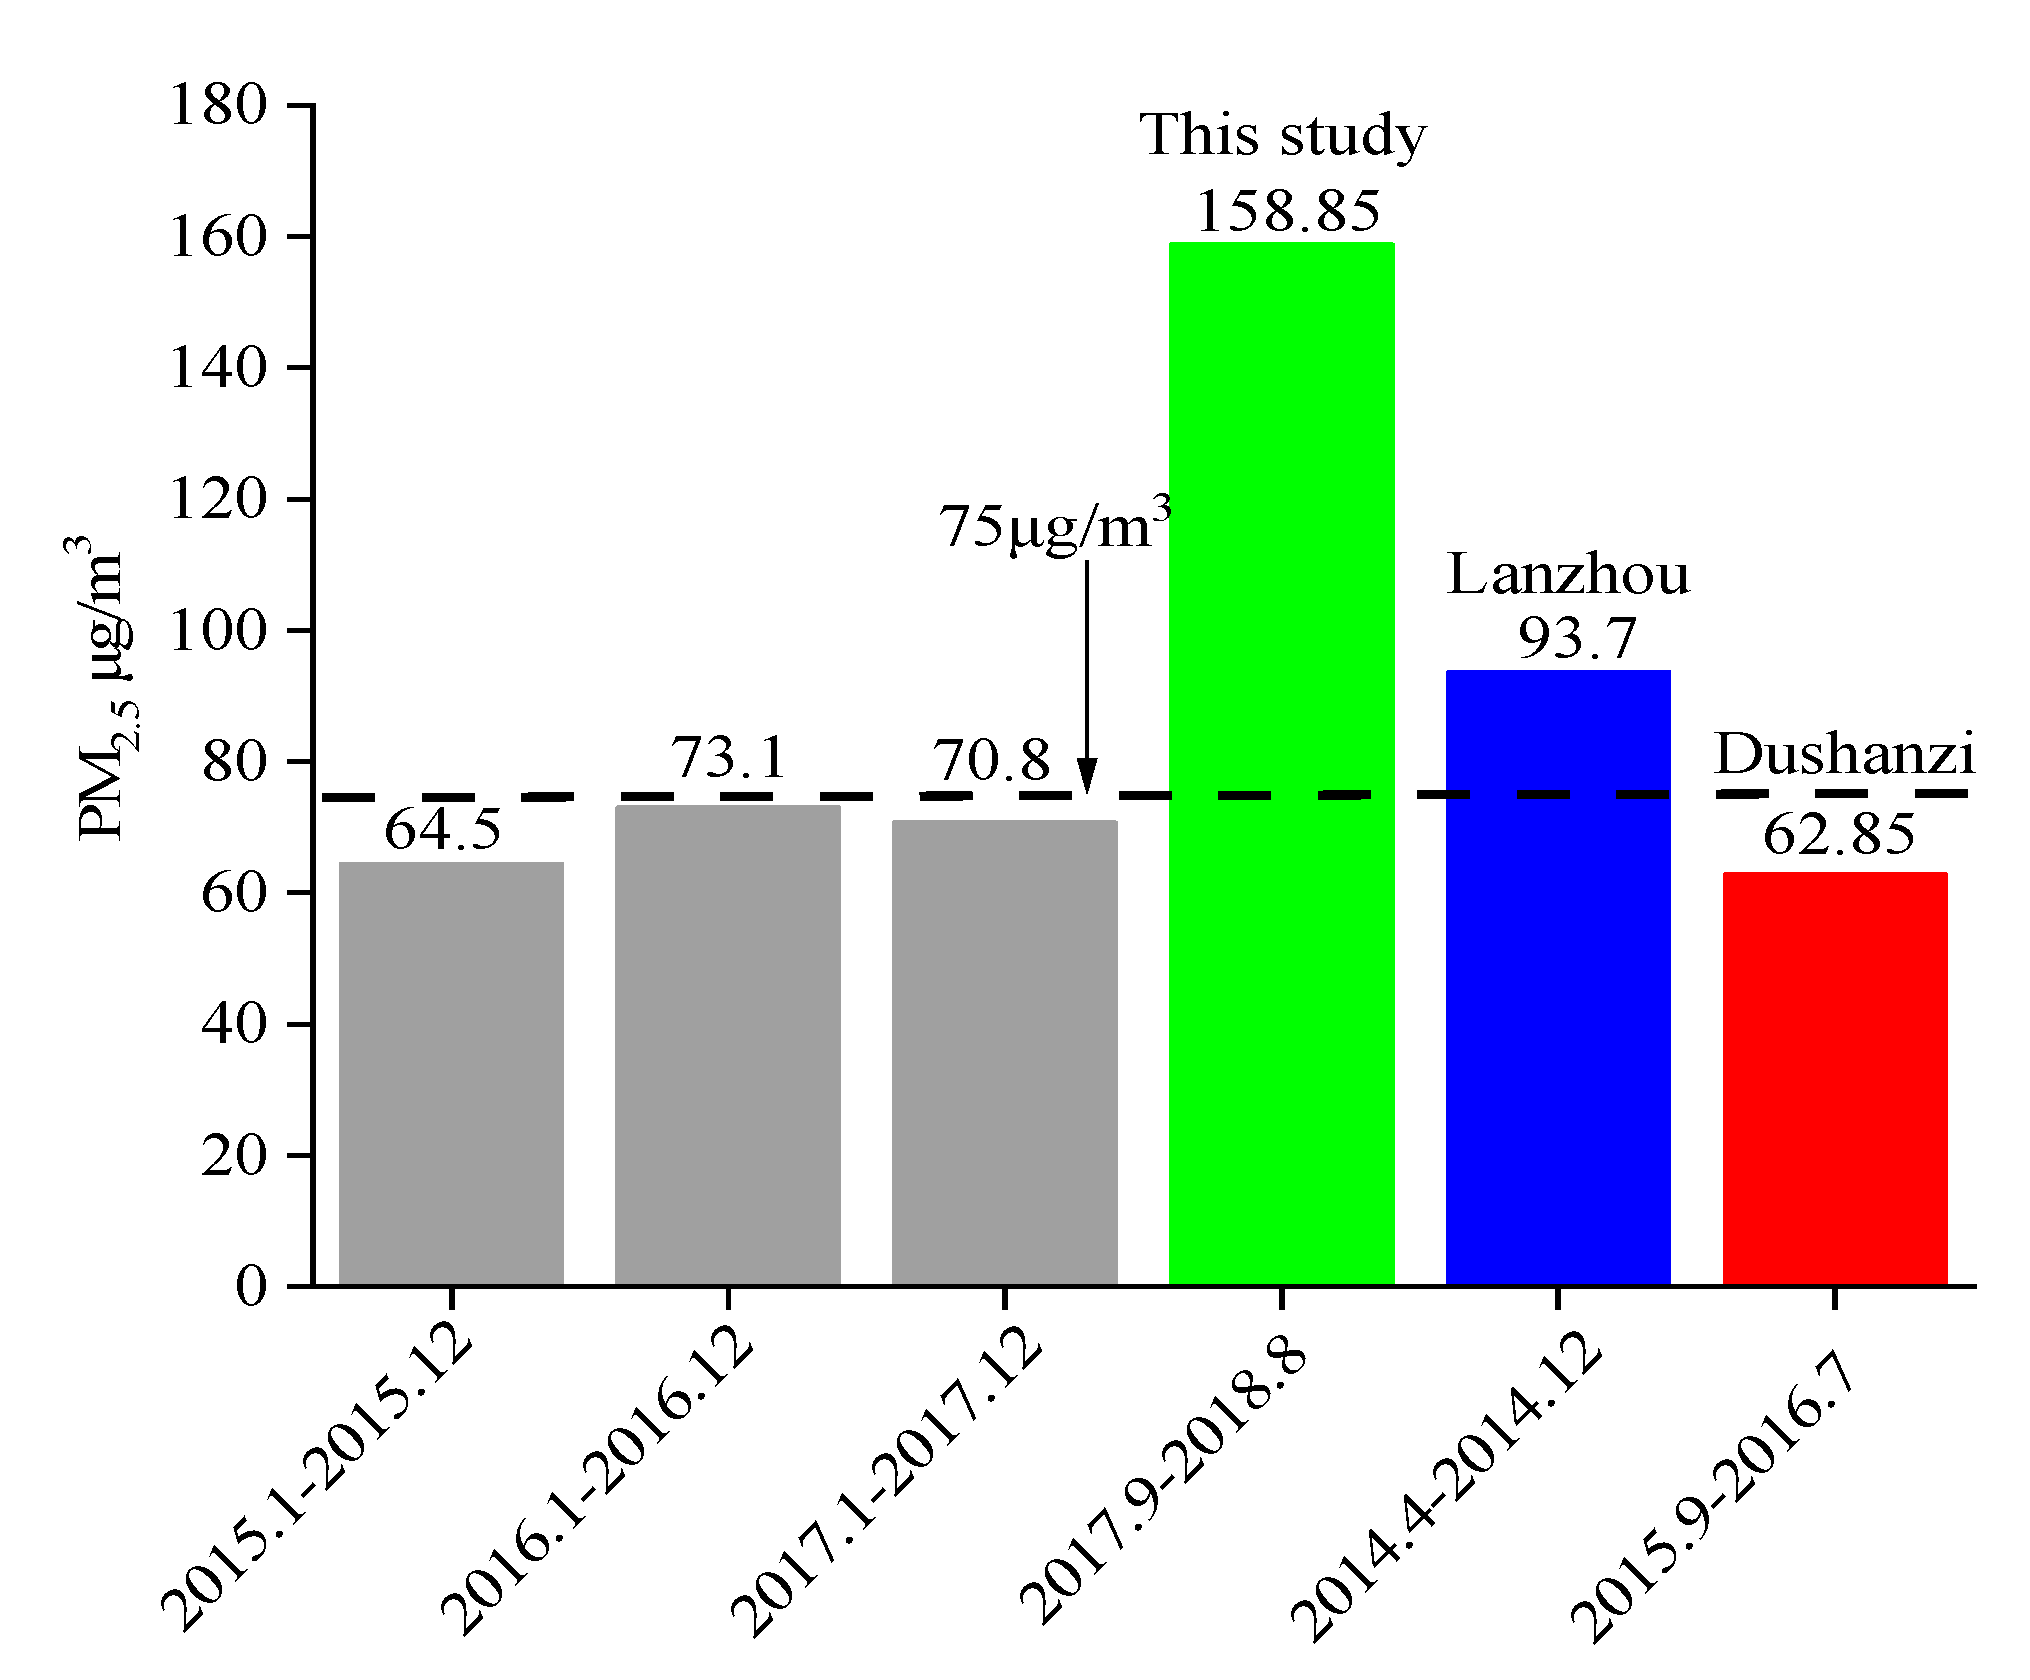
3.1.1. PM2.5 Concentration

Figure 2 shows the changes in the temperature, relative humidity, gaseous pollutants, and PM2.5 concentration during the sampling period. The temperature first decreased and then increased. It was the lowest in the winter on 5 February, and then the temperature rose in a fluctuating manner. The temperature ranged from −19 to 31 °C, and the annual average temperature was 11.6 °C. The highest relative humidity appeared on 13 December 2017, with a value of 88%, and the lowest relative humidity was 20%, which appeared on 2 June 2018. The gaseous pollutants SO2, NO2, and O3 varied in the ranges of 8–25 μg/m3, 15–89 μg/m3, and 24–157 μg/m3, respectively. High concentrations of SO2 and NO2 appeared in winter, and their values were 25 μg/m3 and 89 μg/m3, respectively. The concentration of O3 was highest in summer, and its average concentration was 157 μg/m3. Apart from winter, the concentration variation ranges of SO2 and NO2 in the other seasons were relatively small, which may be because SO2 and NO2 are mainly from combustion sources and motor vehicle exhaust. In winter, heating increases the emission of SO2, while in winter, low temperatures increase the start-up time of motor vehicles and promote an increase in NO2 [14]. The concentration of O3 was the highest in summer, which may have been due to the high temperatures promoting the photochemical reaction of NOx and VOC in the atmosphere [15], so that the concentration of O3 was on the rise; the PM2.5 concentration ranged from 56.84 to 322.59 μg/m3.
The annual average mass concentration was 158.85 ± 15.11 μg/m3. The PM2.5 concentration in autumn was the highest with an average of 180.49 ± 87.22 μg/m3, and the average concentration in summer was the lowest at 148.41 ± 52.60 μg/m3, with a difference of 32.08 μg/m3. The annual average daily mass concentration of PM2.5 (Figure 2) mostly exceeded the national secondary standard (75 μg/m3), indicating that Urumqi’s atmospheric PM2.5 pollution was at a high level. Figure 3 shows the concentration changes of PM2.5 in Urumqi since 2015 [16]. From the figure, it can be seen that the mass concentration of PM2.5 in Urumqi increased from 2017 to 2018, which is twice as much as that in 2015–2017. This may have been mainly due to the dust released during the demolition of old houses in the Tianshan District of Urumqi with the development of the city [17]. The mass concentration of PM2.5 in this study was higher than that in Lanzhou City [18] of Gansu Province (93.7 ug/m3) and Dushanzi District [19] of Xinjiang (62.85 ug/m3).

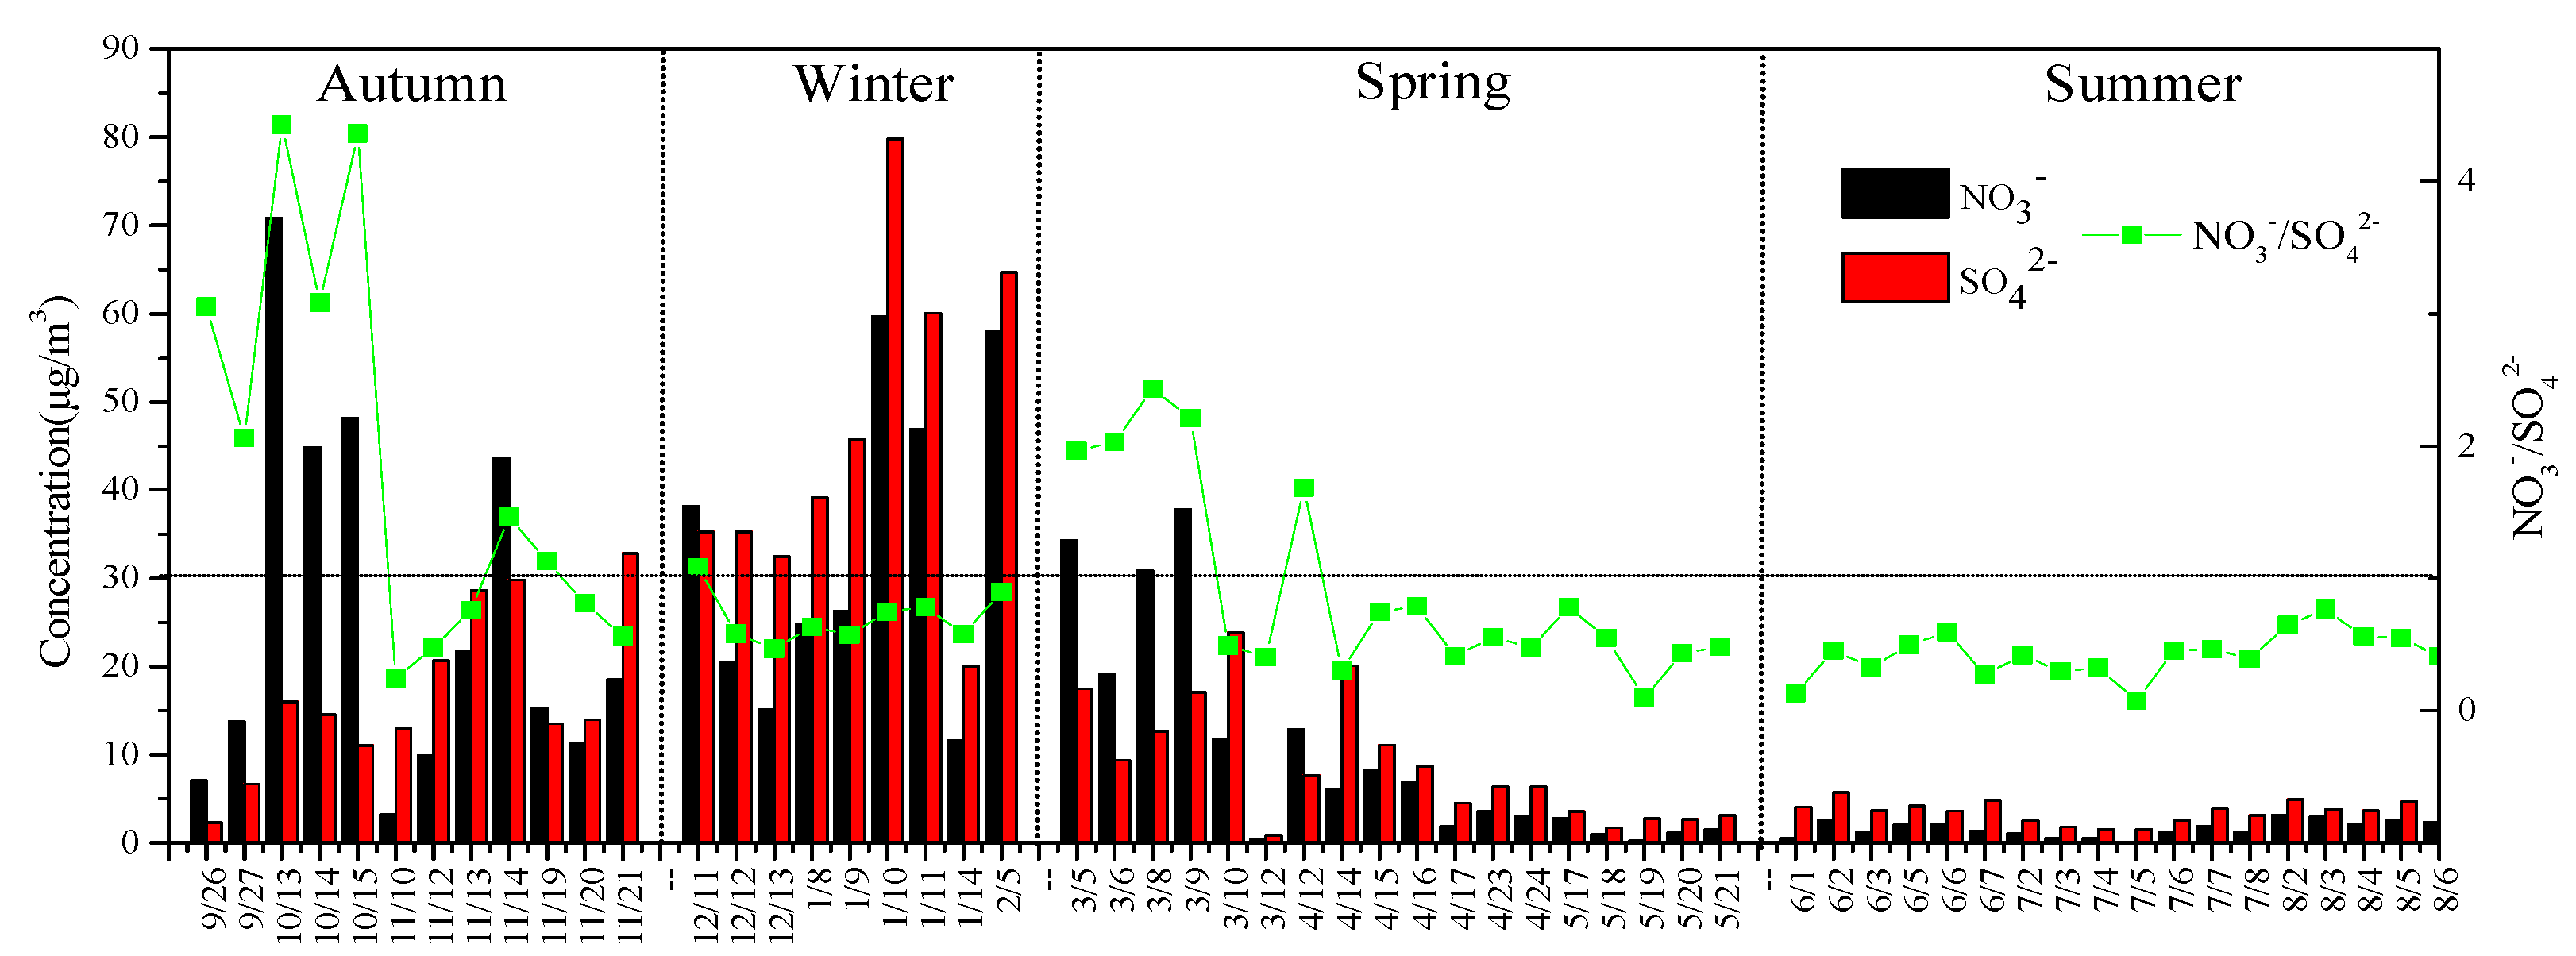
3.1.2. Water-Soluble Ion Concentration

The mass concentrations of the ten water-soluble ions (Table 1) detected during the sampling period ranged as follows from large to small: SO42− > NO3 > NH4+ > Ca2+ > Na+ > F > PO43− > Cl > K+ > Mg2+. In winter and summer, the percentages of WSIs in the PM2.5 mass concentration were 63.06% and 7.44%, respectively. Although the concentration of PM2.5 in winter was not the highest among the four seasons, the proportion of WSIs was much higher than that of other seasons. The average annual concentrations of secondary inorganic ions ([SNA]SO42−, NO3, and NH4+) were 13.58 µg/m3, 13.46 µg/m3, and 10.88 µg/m3, respectively. The mass concentrations of these three ions accounted for about 87.23% of the WSIs, while the primary ions accounted for less than 13%. This shows that these three secondary inorganic ions were the main components of the water-soluble ions. The seasonal variation of the primary ions was relatively stable, and the seasonal difference of the secondary ion was relatively obvious. The reason is that the concentration of SO2 and NO2 and the relative humidity of the atmosphere (Figure 2) were higher in winter than those in other seasons. The concentrations of Mg2+ and Ca2+ in the primary ions were higher in autumn and spring. Studies have shown that Mg2+ and Ca2+ are mainly derived from soil [20]. The highest K+ concentration in autumn was 2.3 times that in summer, and the highest concentration of Cl in winter was 6.2 times that in summer. The reason may be that K+ and Cl are biomass-burning markers [21], which may be related to the autumn harvest and natural gas heating of farms around Urumqi, and the low ground temperatures in autumn and winter, resulting in temperature inversion and a very stable atmospheric structure. Cl and K+ in the atmosphere are difficult to eliminate, resulting in higher concentrations in autumn and winter.
The ratio of NO3/SO42− in the atmospheric particulates was used to analyze the degree of influence of moving sources (such as motor vehicle and vessel exhaust) and stationary sources (such as coal-burning sources) in this area [22]. The ratio was greater than 1, and the contribution of moving sources was prominent; on the contrary, the contribution of stationary pollution emission sources was large. Figure 4 shows that the mean value of NO3/SO42− during the sampling period was 0.92 ± 0.60, and the seasonal variation was autumn (1.87) > spring (0.94) > winter (0.71) > summer (0.44), indicating that in the sampling period, except for autumn, the contribution of stationary pollution emission sources to water-soluble ions dominated. The ratio of NO3/SO42− in this study was similar to that of Lanzhou [23]. The NO3/SO42− seasonal variation ratio (autumn (1.78) > spring (1.73) > winter (1.02) > summer (0.35)), which was similar to the ratio of LuoHe City in the central region (autumn (2.46) > winter (1.80) > spring (0.60) > summer (0.40)) had some differences in the seasonal changes [24]. The ratio of NO3/SO42− can be seen during the sampling period. Atmospheric particulate matter is affected by mobile sources as well as stationary sources. Mobile sources dominated in autumn, and stationary sources dominated in spring, summer, and winter.

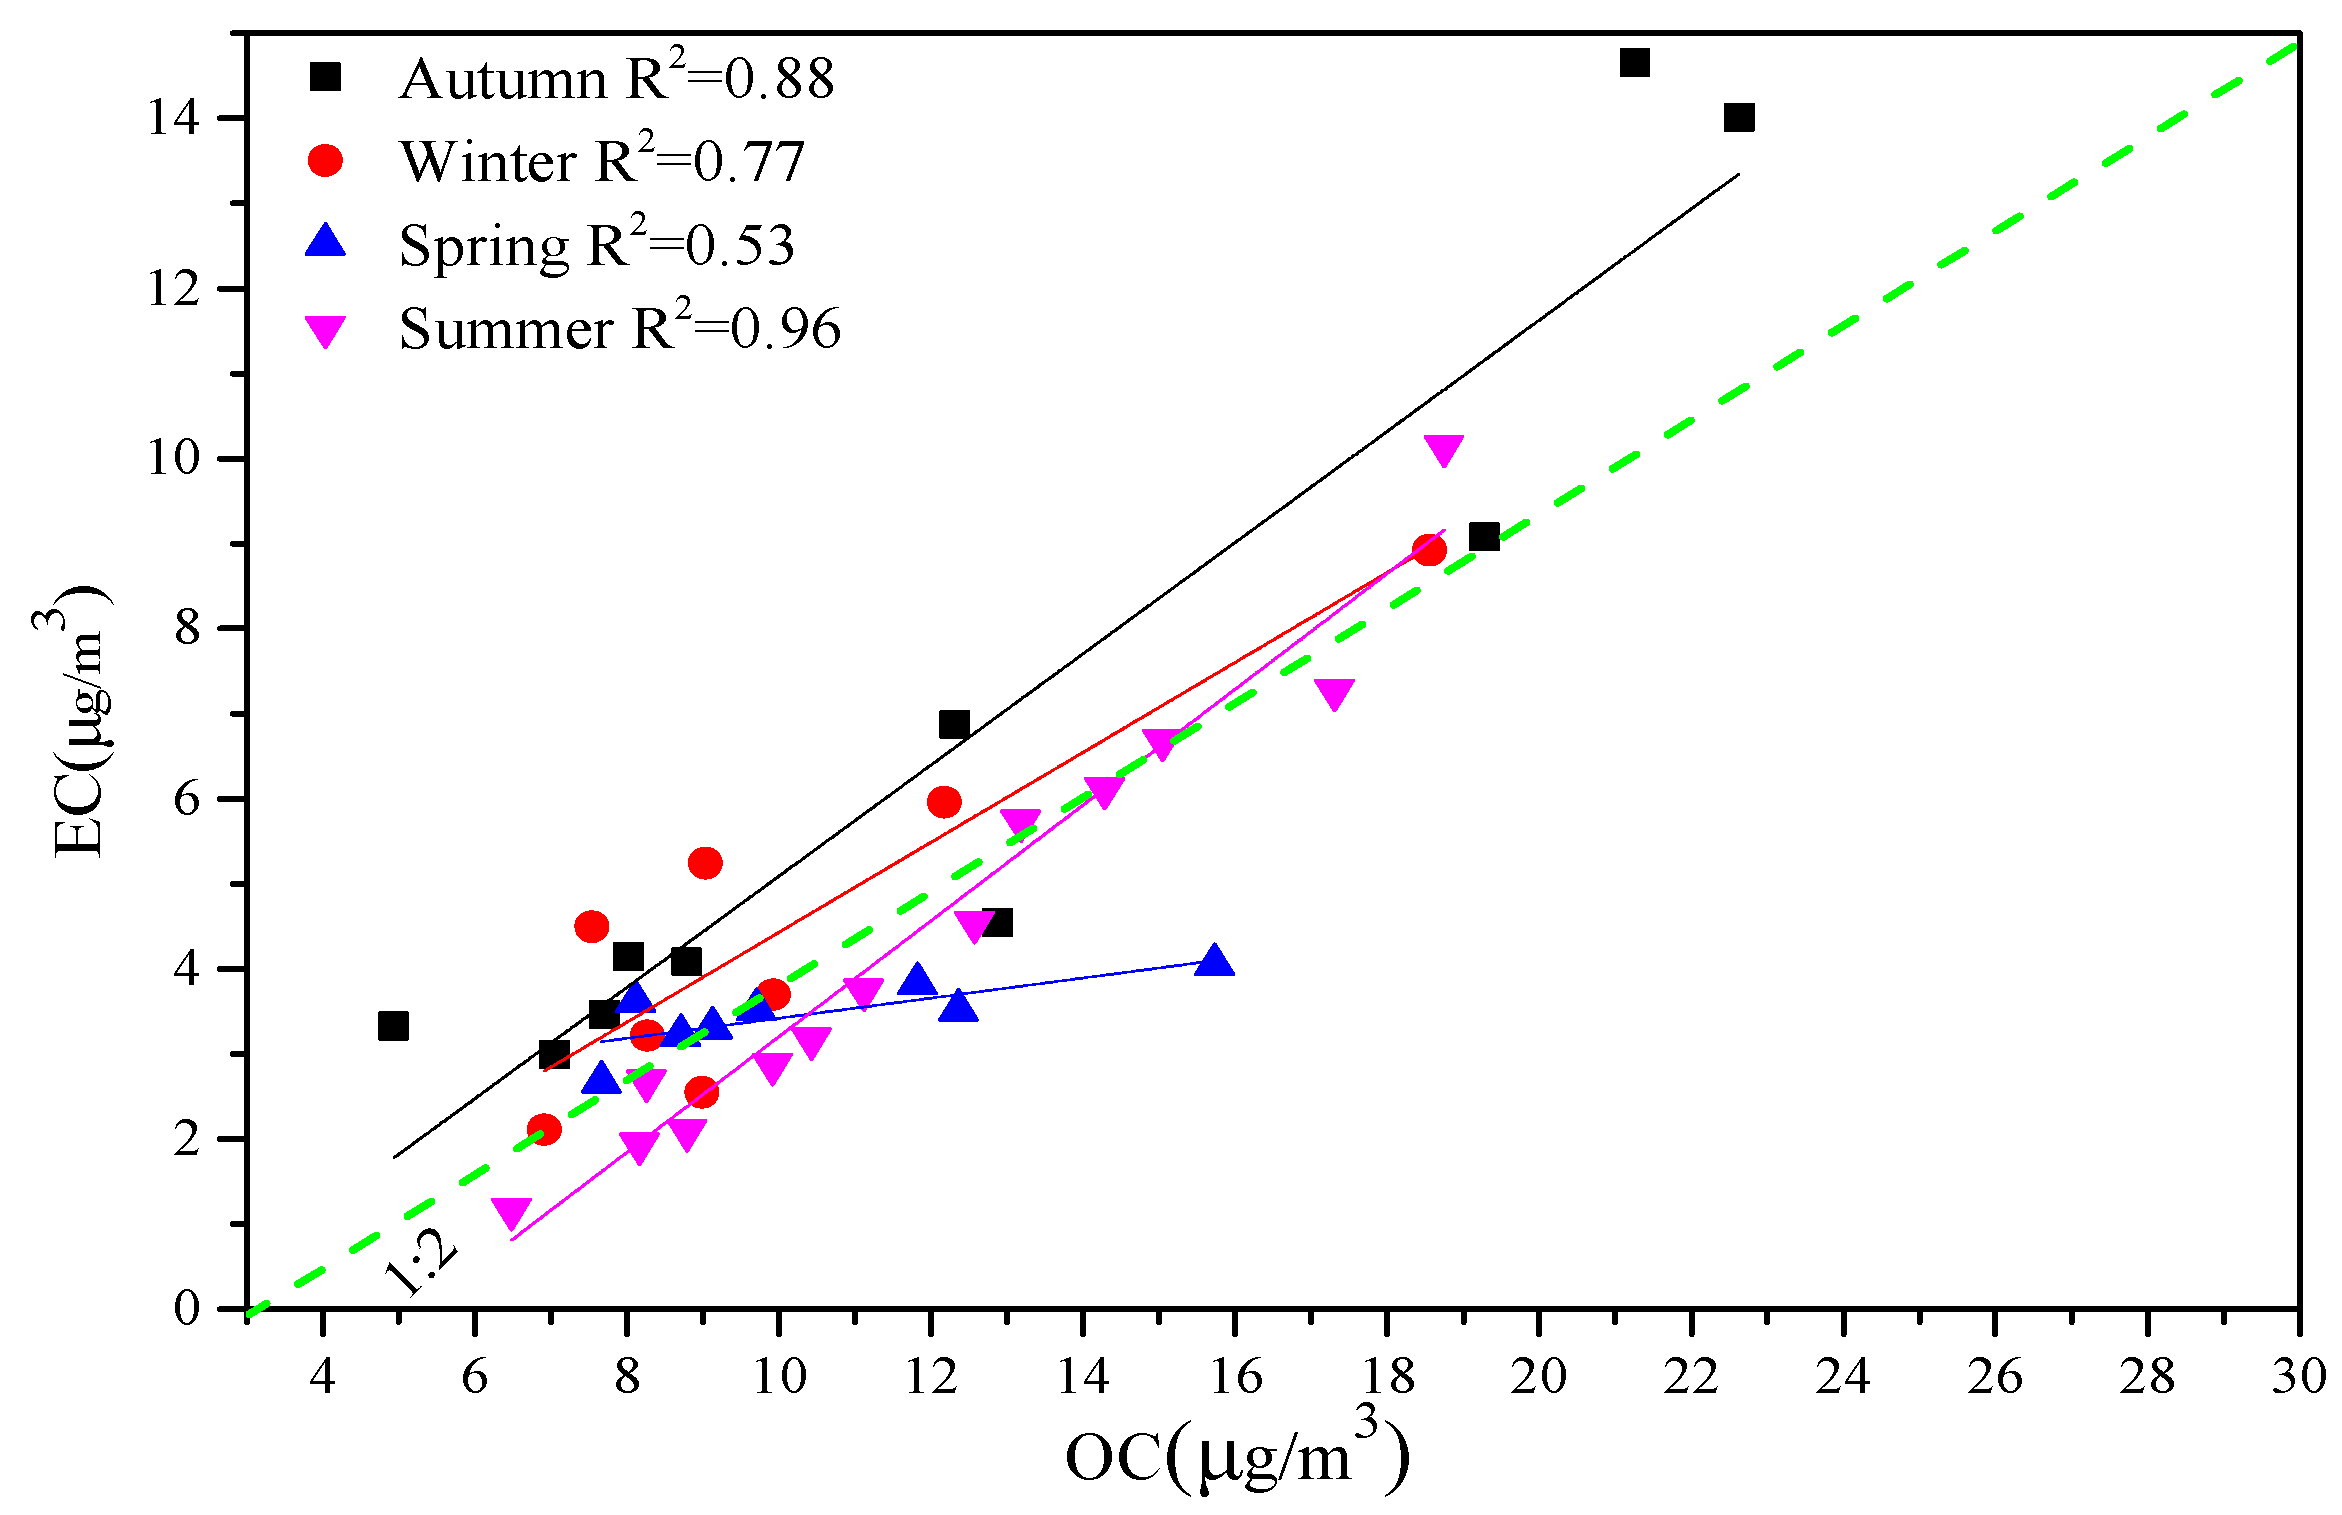
3.1.3. Concentrations of OC, EC, and Water-Soluble Organic Carbon

The OC and EC concentration changes in the PM2.5 are shown in Table 2. The annual average mass concentrations of OC and EC were 12.00 ± 4.4 µg/m3 and 5.00 ± 3.5 µg/m3, respectively, accounting for 8.11% and 3.40% of the PM2.5 mass concentration. The average mass concentrations of OC and EC in autumn were 13.39 ± 6.7 µg/m3 and 8.38 ± 5.9 µg/m3, which accounted for 9.18% and 5.07% of the PM2.5 mass concentration, respectively, and which accounted for significantly higher proportions than in the other seasons. This seasonal distribution was different from that of other cities in northwest China. For example, Lanzhou [25] had the highest OC and EC in winter, with mass concentrations of 35.4 ± 13.9 µg/m3 and 13.80 ± 5.4 µg/m3, respectively. This may be because the open burning of biomass in farmland around Urumqi in autumn increased the pollution of carbon components. The total carbonaceous aerosol (TCA) refers to all carbonaceous components in aerosols. The TCA cannot be analyzed directly through chemical detection, which is usually obtained by an empirical equation. The calculation equation is as follows:
[TCA] = [EC] + [OM]
[OM] = 1.6 × [OC]
In the equation, [OM] is the concentration of organic matter (OM). The average annual mass concentration of TCA was 24.20 ± 9.84 µg/m3, accounting for 16.24% of the PM2.5 mass concentration. It can be seen that carbonaceous aerosols are a significant part of the atmospheric fine particulate matter PM2.5 in Urumqi. The control of emissions is of great significance for the control of PM2.5 pollution. Studies have shown that [26] OC/EC > 2 will produce SOC. During the sampling period, the OC/EC ratios in winter, spring, and summer were all greater than 2, so there was the formation of SOC. Since SOC cannot be measured, the EC tracer method is usually used to calculate SOC concentration, and the calculation equation is as follows [27].
SOC = OC − (OC/EC)min × EC
The average annual SOC concentration was 8.10 ± 3.22 µg/m3, with the highest concentration in summer (8.96 ± 2.92 µg/m3), which may have been due to the sufficient sunshine and high temperatures in summer, which is conducive to the secondary transformation of VOCs in the air into particles and the generation of secondary organic aerosols [15]. Water-soluble organic carbon (WSOC) is a significant component of OC, and its source and composition are also relatively complex. The hygroscopicity has a significant influence on aerosol light absorption and atmospheric radiation, so people have gradually paid attention to it. WSOC also has obvious seasonal distribution characteristics. The seasonal distribution of the mass concentration of WSOC during the sampling period was winter (8.60 ± 3.00 µg/m3) > autumn (6.60 ± 2.64 µg/m3) > spring (4.30 ± 1.41 µg/m3) > summer (3.99 ± 1.52 µg/m3), and the annual average concentration was 5.38 ± 2.67 µg/m3. The concentration of WSOC in Lanzhou was comparable with the data of Chinese cities [28,29], but much higher than that of European cities, such as Barcelona (1.8 µg/m3), Amsterdam (1.5 µg/m3), and Ghent (1.6 µg/m3) [30]. The higher WSOC in winter may have been due to the increase in coal combustion, which led to an increase in WSOC emissions. Water-insoluble organic carbon (WIOC) (WIOC = OC − WSOC) had opposite seasonal variation to that of WSOC. Usually, WIOC comes from fossil fuel combustion emissions; the highest concentration was in summer (8.46 ± 3.27 µg/m3) and the lowest was in winter (2.62 ± 1.93 µg/m3).
A study [31] pointed out that the correlation between OC and EC can be used to study the sources of atmospheric PM2.5 and its evolution information. Carbon particles in the atmosphere generally include those from coal, motor vehicles, and biomass combustion. It can be seen from Figure 5 that the correlation between the OC and EC in spring (R2 = 0.53) was low, indicating that the sources of OC and EC were more complicated at this stage. The correlations of the other three seasons were autumn (R2 = 0.88), winter (R2 = 0.77), and summer (R2 = 0.96). The possible reasons include the weakening of the winter sunshine, poor diffusion conditions, and a large amount of coal and gas combustion during the heating period. Urumqi has a long heating period and lower temperatures in spring, resulting in higher OC and EC values. Strong sunshine and higher temperatures in summer are conducive to the formation of secondary organic aerosols.

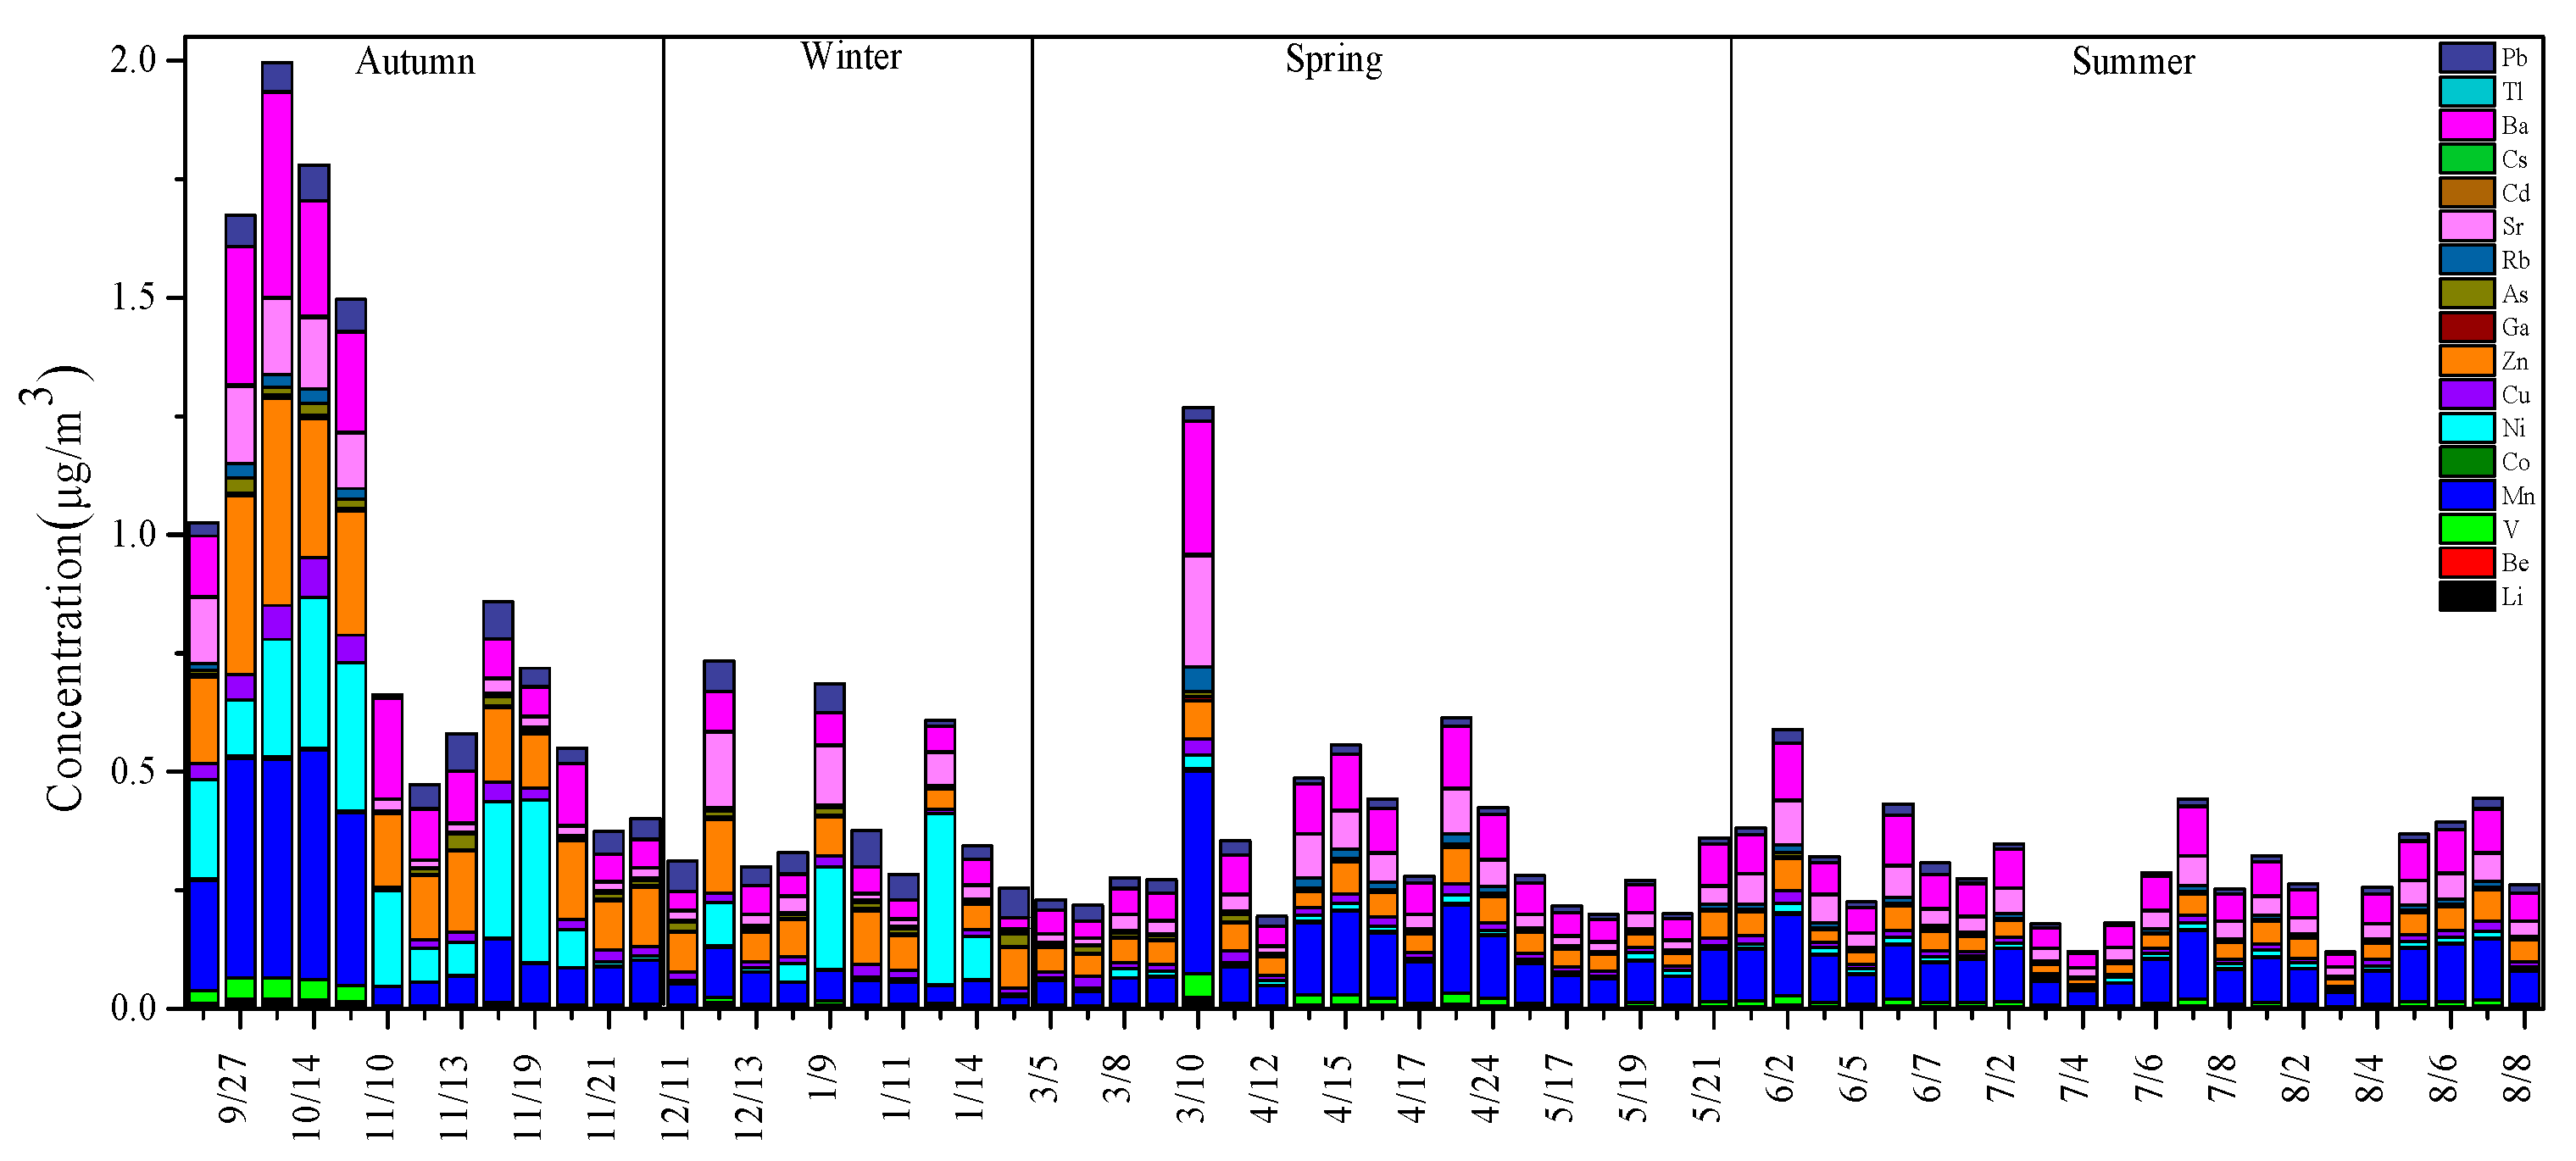
3.1.4. Metal Element Concentration
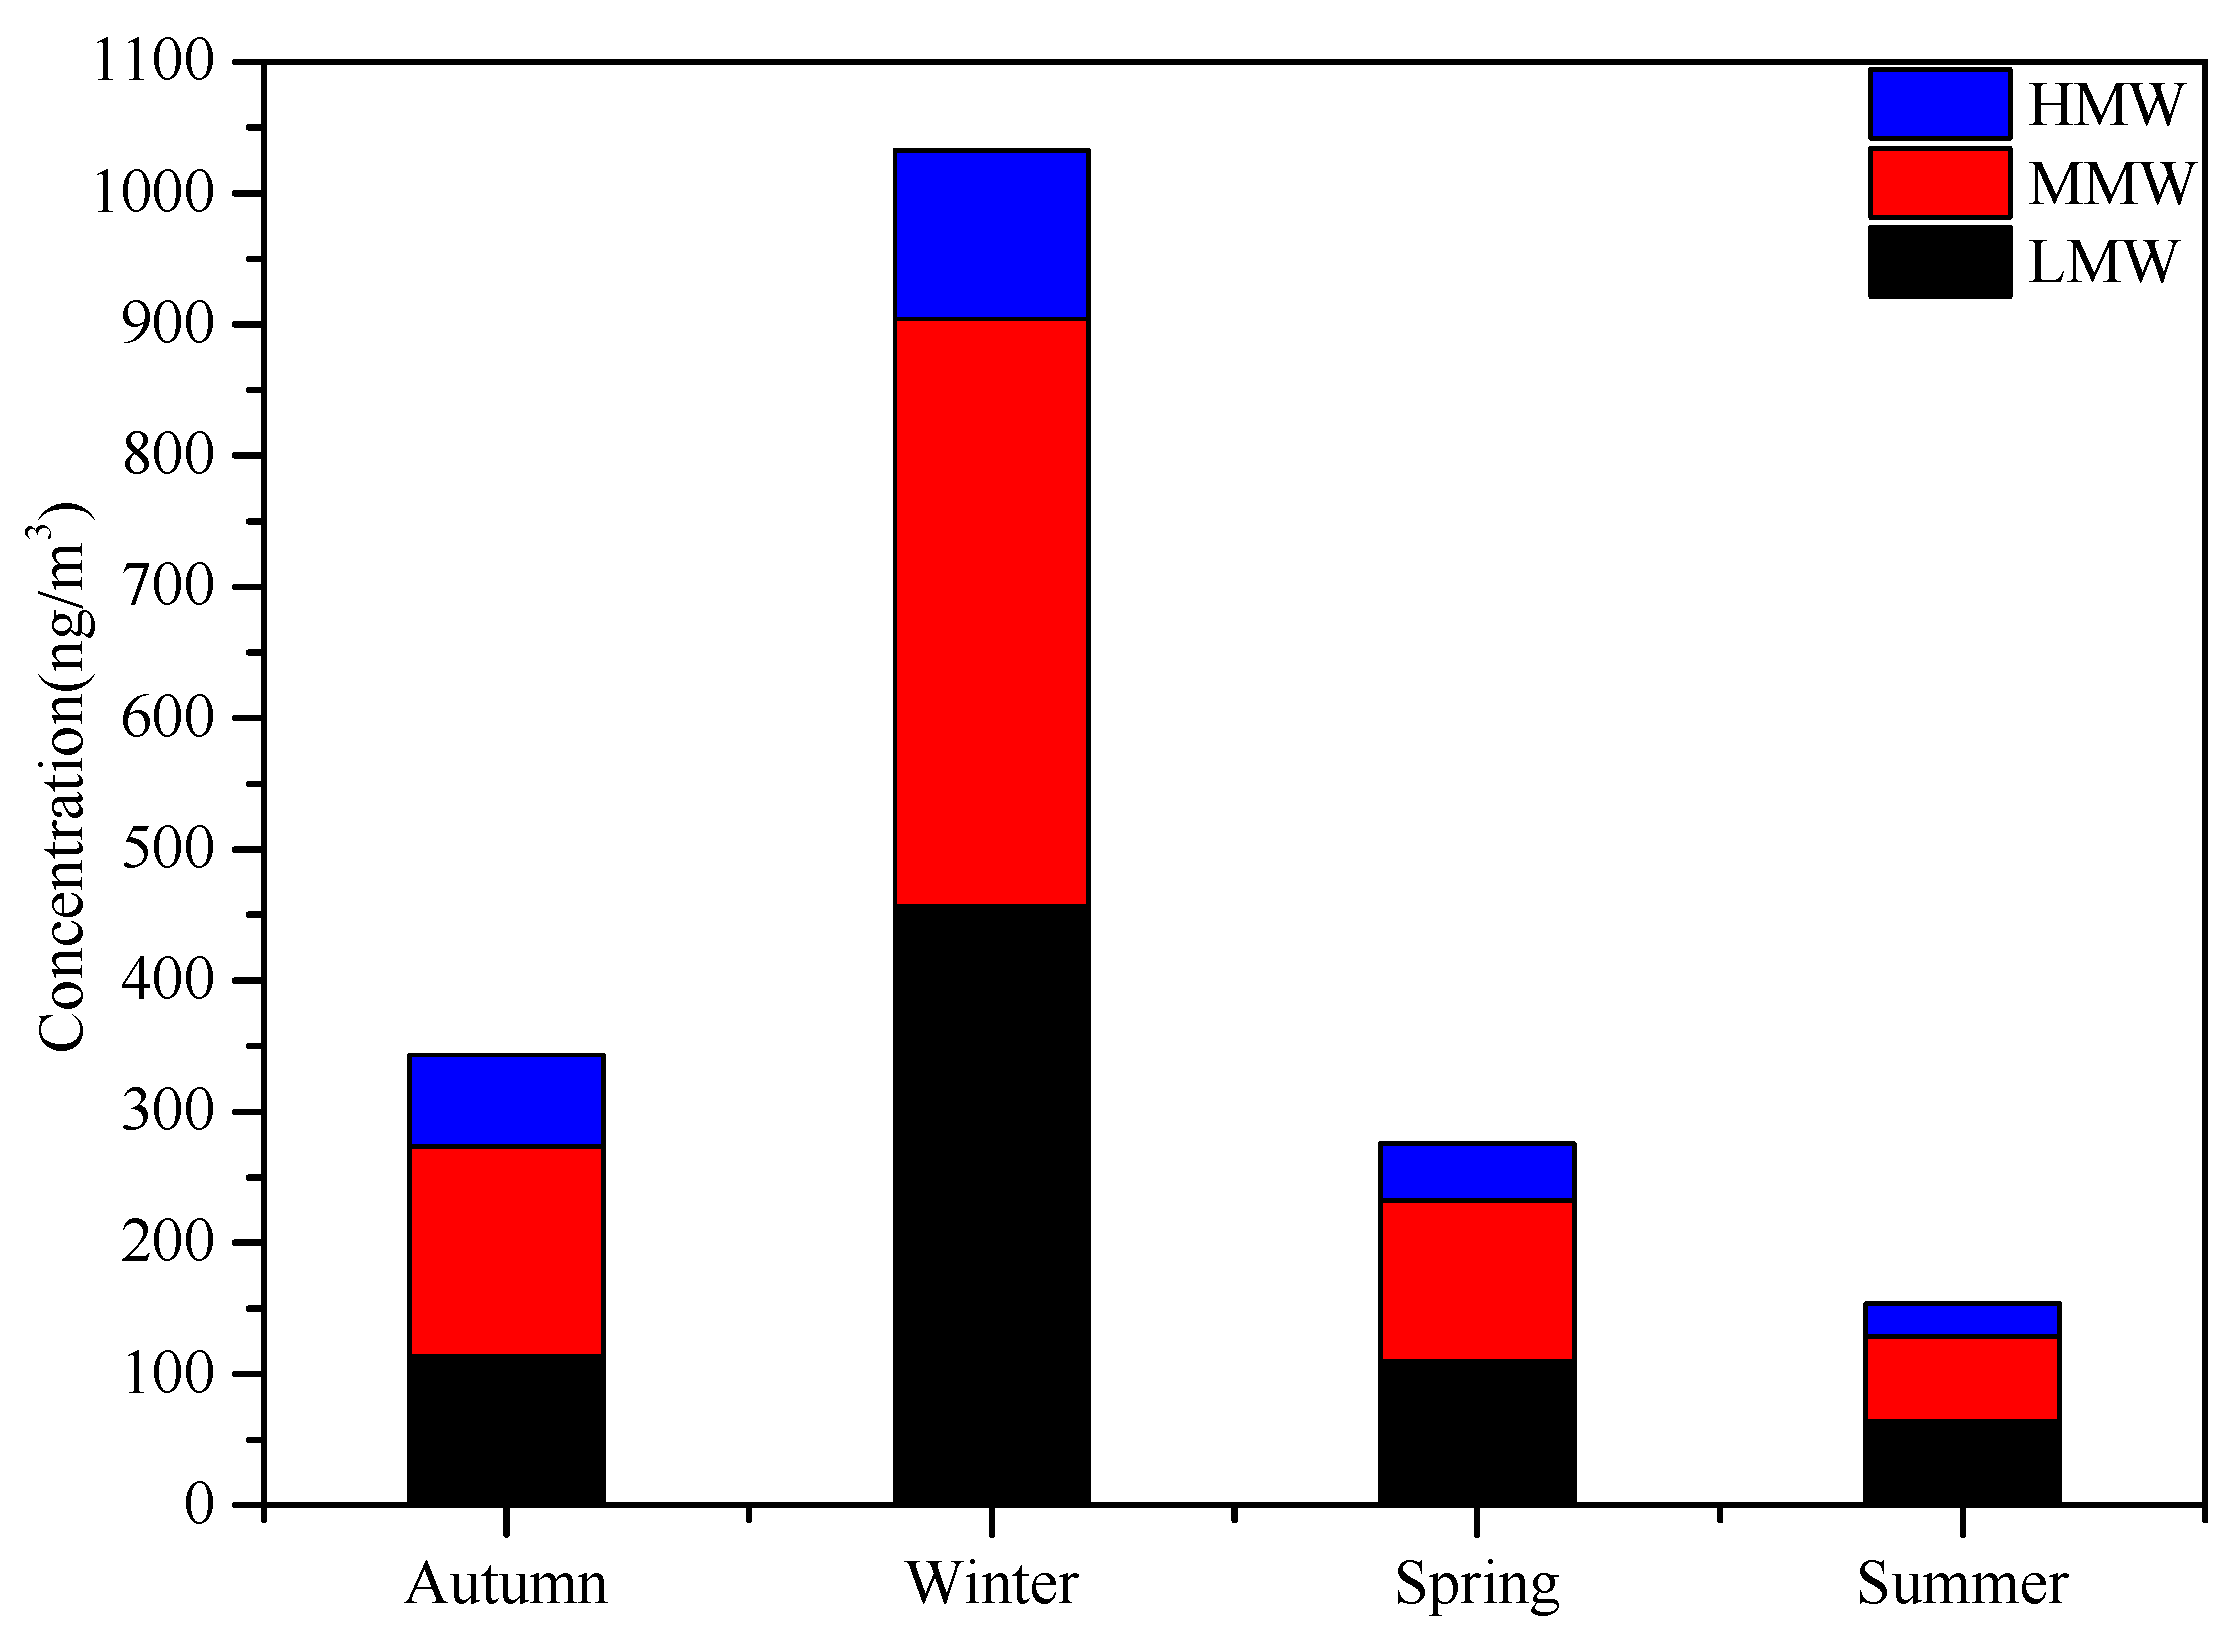
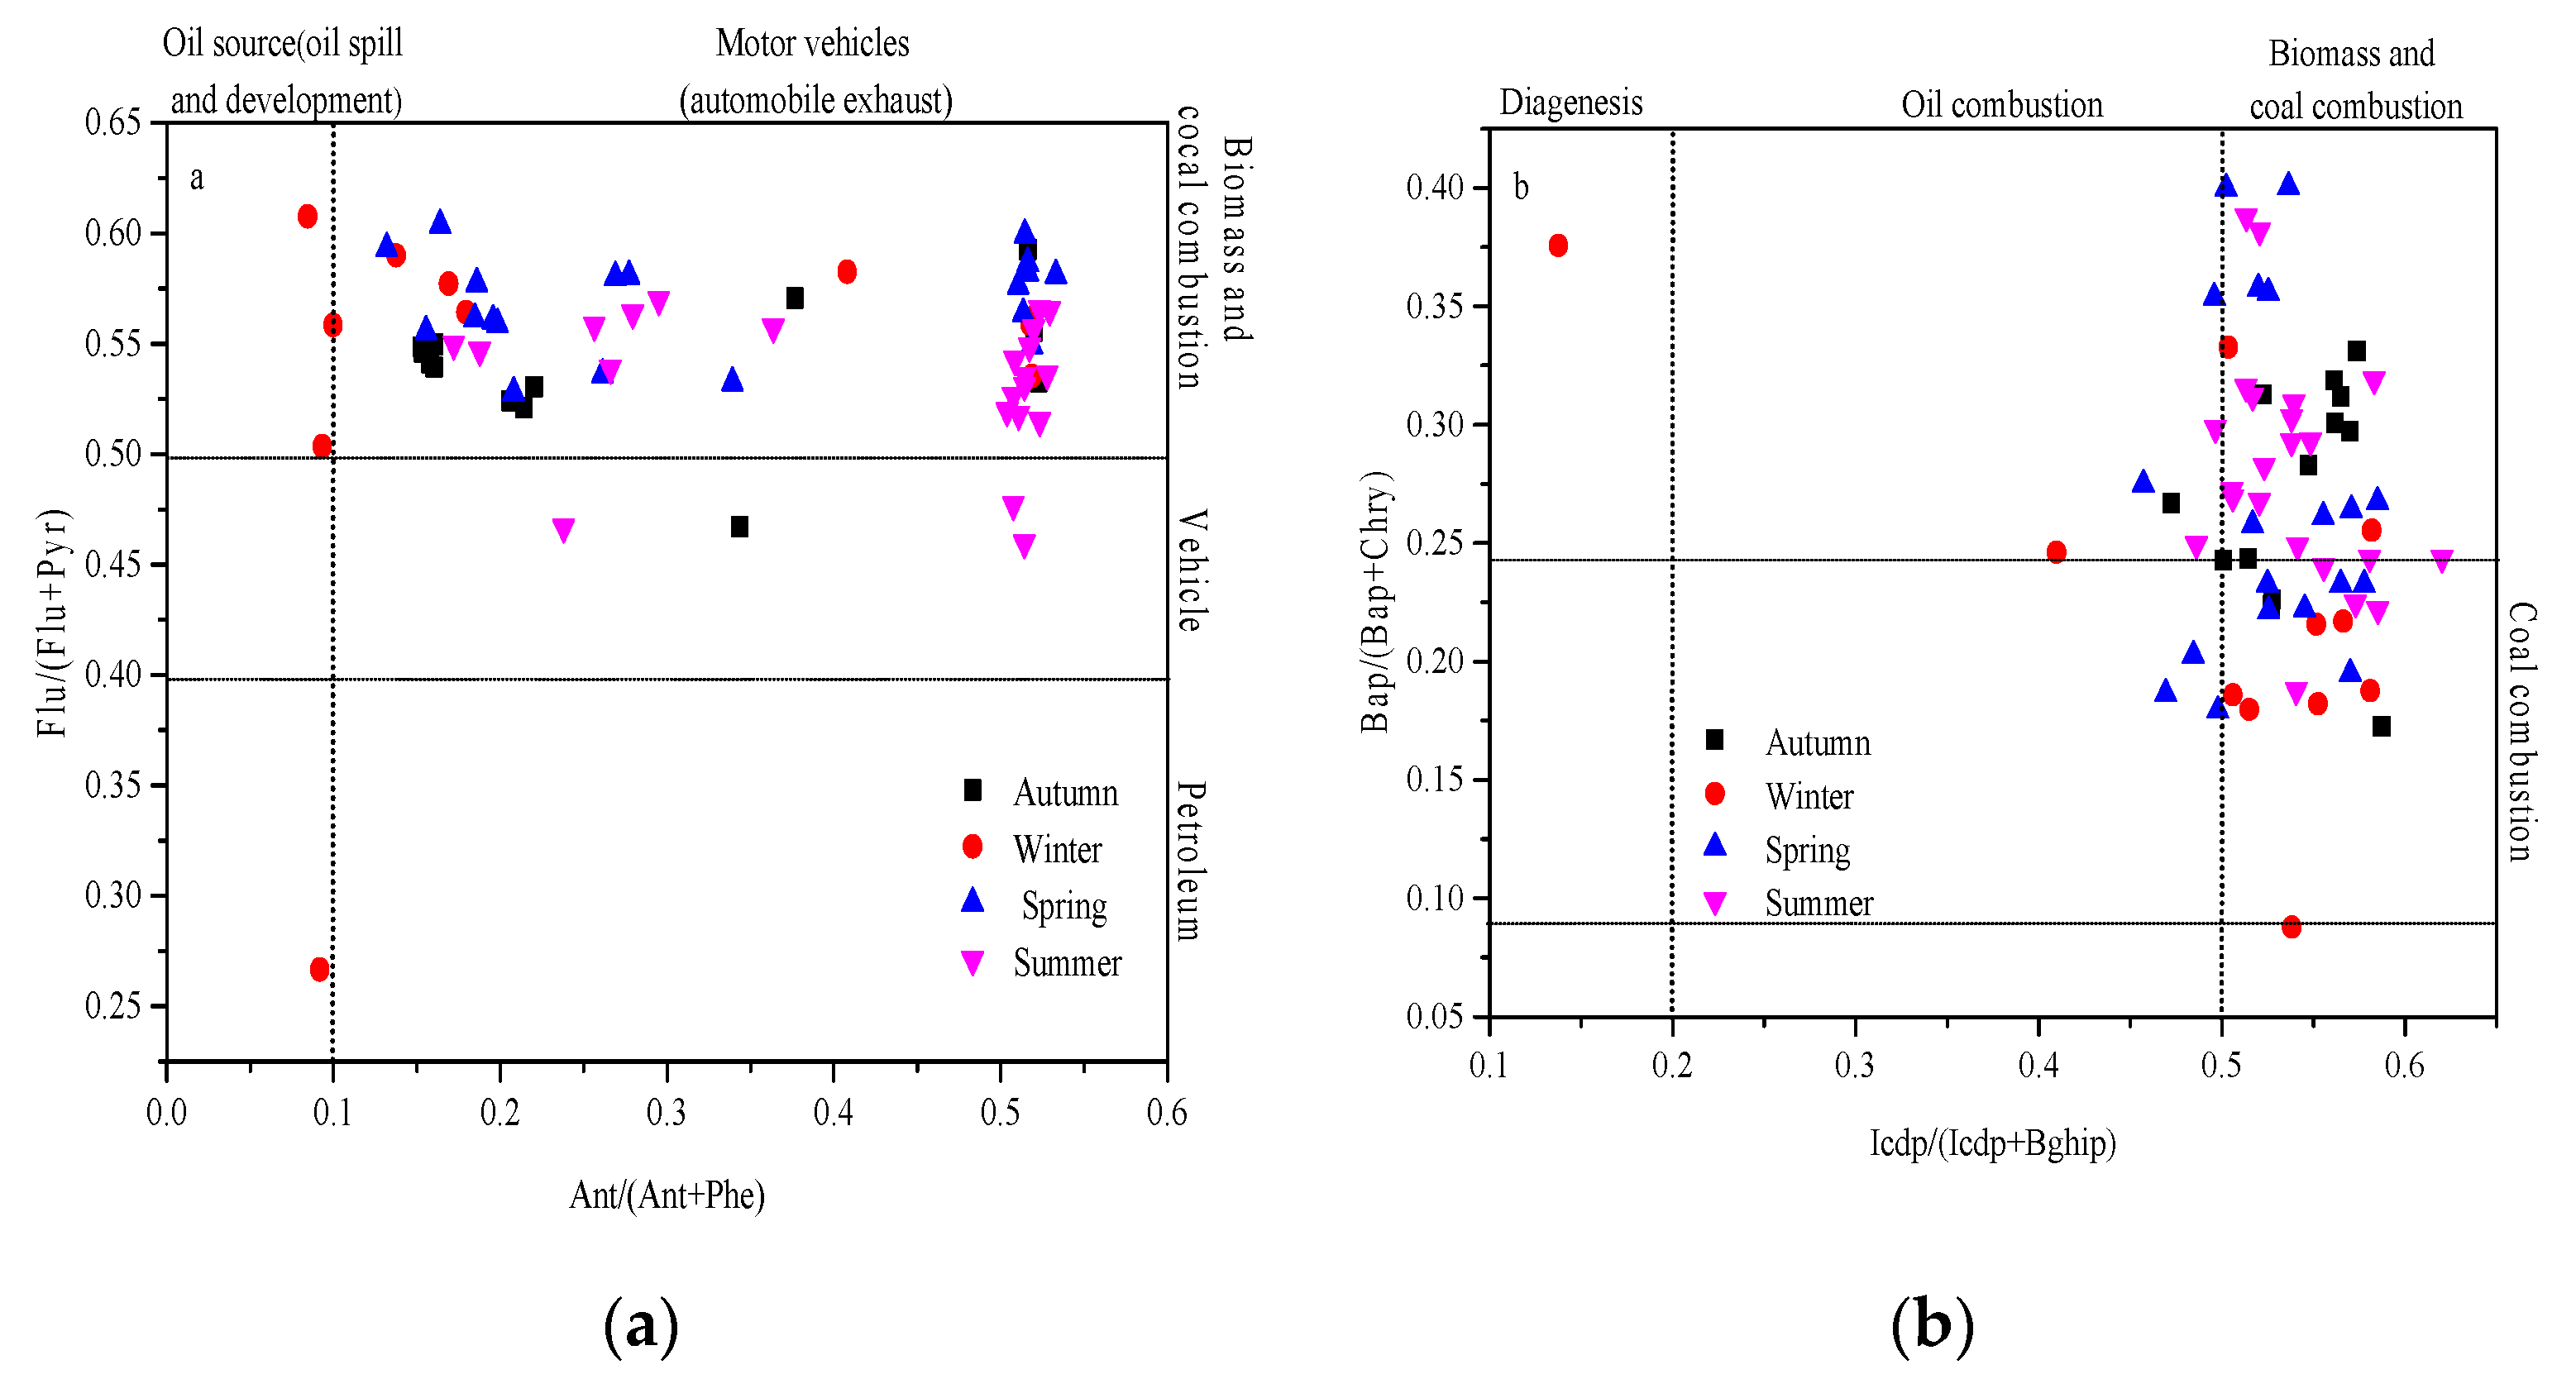
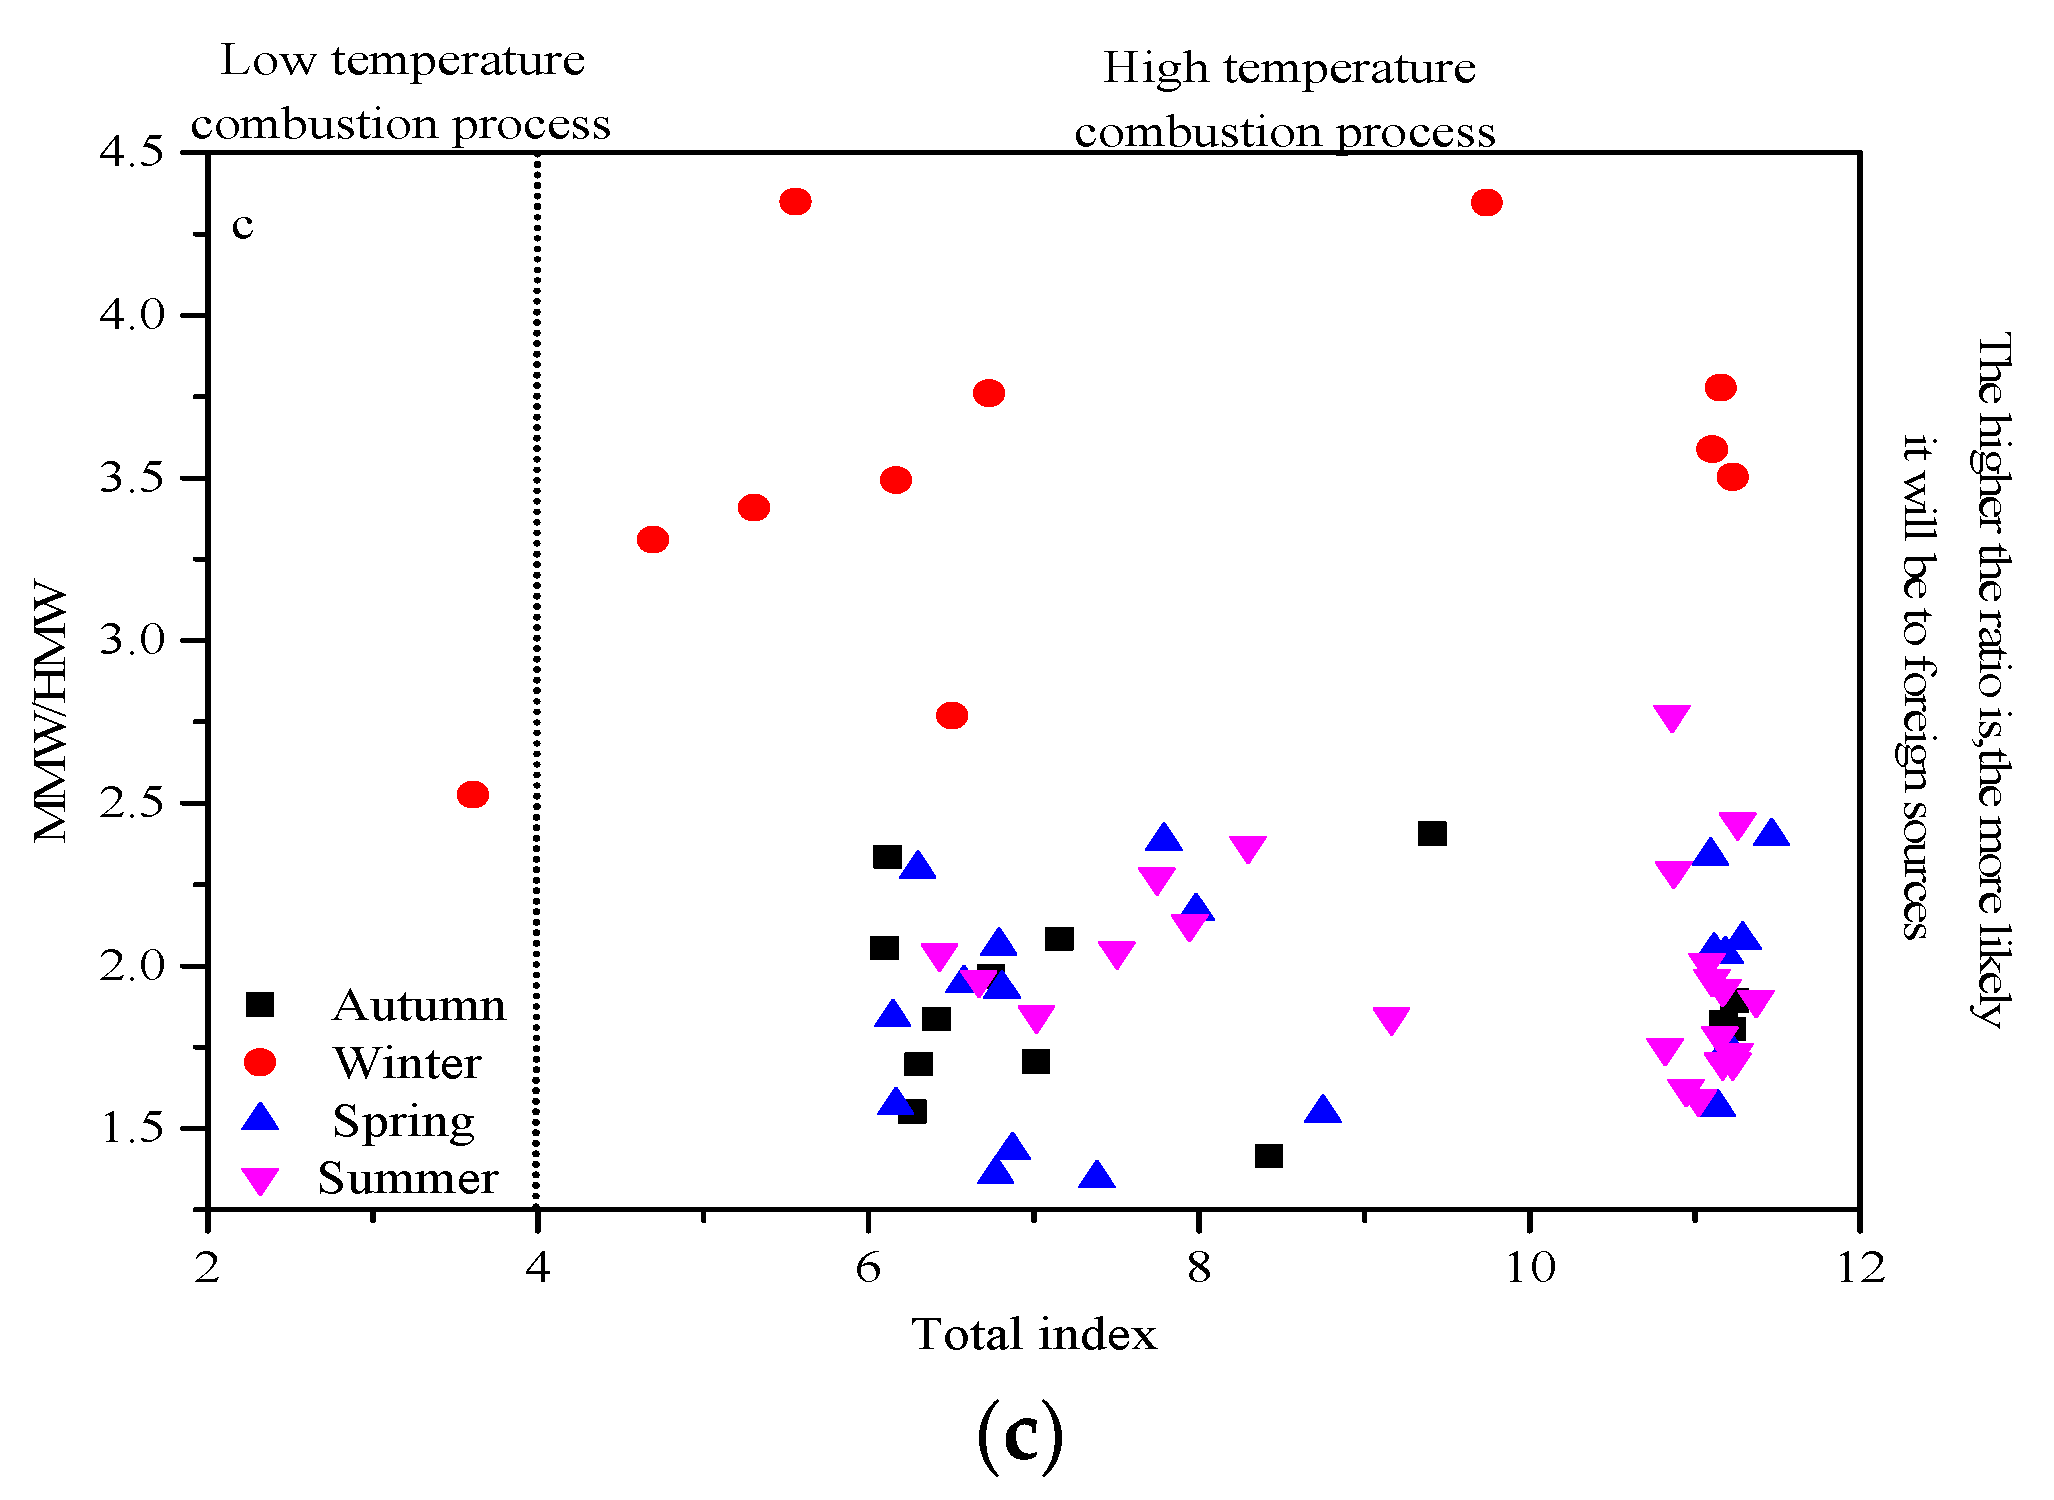
The metal elements in the atmosphere can cause various diseases in the human body and serious burdens on the chemical cycle of the ecosystem.
In this study, the concentration changes of 19 metal elements were detected, as shown in Figure 6. The highest concentrations of the Al and Fe elements appeared in autumn (Table 3), and their mass concentrations were 15.11 ± 10.1 µg/m3 and 8.33 ± 6.9 µg/m3, respectively. The highest values of the elements Mn, Zn, and As also appeared in autumn, with mass concentrations of 0.21 ± 0.18 µg/m3, 0.21 ± 0.10 µg/m3, and 0.016 ± 0.01 µg/m3, respectively. A study showed that [32] Zn comes from industrial emissions and traffic pollution such as brake pad wear. The mass concentration change of Ni was autumn (0.19 ± 0.11 µg/m3) > winter (0.08 ± 0.11µg/m3) > spring (0.01 ± 0.006 µg/m3) ˃ summer (0.01 ± 0.003 µg/m3). The source of Ni in PM2.5 is not unique [33]. Most Ni comes from coal-burning, and part of it comes from emissions from diesel vehicles. The main sources of Cu are motor vehicle emissions and the impact of industrial coal emissions [34]. The average annual mass concentration of Cu was 0.019 ± 0.014 μg/m3, and the highest mass concentration was 0.05 ± 0.02 μg/m3 in autumn.
The elements that are abundant in the earth’s crust, are subject to fewer anthropogenic pollution sources during migration, and have better chemical stability are usually selected as reference elements. The reference elements usually used in the world are Al, Ca, Fe, Cr, and Si [35]. In this study, Cr was selected as the reference element [36]. The background values of metal elements used in this study were selected from the background values of soil elements in China, and the concentration of A-layer soil in the Xinjiang region (http://www.chinacitywater.org/hysc/, accessed on 15 April 2022). As shown in Figure 7a, during the sampling period, the enrichment factors of Li, Be, V, Mn, Co, Ga, Rb, Sr, Cs, Ba, and Tl were between 0 and 2, and were affected by natural sources. From Figure 7b, it can be seen that there were obvious seasonal differences among the enrichment factors of Ni, Cu, Zn, Ag, Cd, and Pb. The enrichment factors of autumn, winter, and summer were greater than 2, and the enrichment degree was relatively high. Due to anthropogenic pollution, the enrichment factor of Pb was less than 2 in spring, and was mainly affected by natural sources. The enrichment factor of As in the four seasons was between 0.5 and 2, and had a natural source of influence. It can be seen from the figure that the Cd enrichment factor was very high in every season, mainly due to anthropogenic pollution. The enrichment factors of Al and Fe in all four seasons were both higher than 2, and were greatly affected by anthropogenic sources.

3.1.5. PAHs

Studies have shown that PAHs in the atmosphere mainly exist in the particulate phase and the gas phase, and 90% of high-ring PAHs are attached to the surface of the particulates, and they are easily inhaled into the lungs, causing great harm to human health [37]. In this experiment, [38] 16 types of PAHs listed under strict control by the U.S. Environmental Protection Agency (US EPA) were divided into low molecular weight (LMW) (2~3 ring aromatic hydrocarbons, including Nap, Acy, Ace, Flu, Phe, Ant, and Fla), middle molecular weight (MMW) (four-ring aromatic hydrocarbons, including Pyr, BaA, Chry, BbF, and BkF), and high molecular weight (HMW) (above five-ring aromatic hydrocarbons: BaP, IcdP, BghiP, and DahA) and are shown in Figure 8.
After analysis, the average annual mass concentration of ΣPAHs was 451.35 ng/m3, which was higher than the concentration of polycyclic aromatic hydrocarbons in Urumqi in 2010 (303.37 ng/m3) [7]. The highest mean value of the mass concentration of ΣPAHs in winter was 1032.66ng/m3, which is about 6.7 times that in summer (153.72 ng/m3). It was higher than the values in winter in Lanzhou [39] in 2013 (302 ng/m3) and winter in Beijing [40] in 2014 (63.88 ng/m3). Wang et al. [41] showed that the seasonal variation of PAHs was related to local meteorological conditions. Environmental temperatures, wind speed, and the height of the planetary boundary layer (PBL) were all lowest during winter and highest during summer in Urumqi. In the cold winter, atmospheric inversion stratification is not conducive to the diffusion of pollutants, and more PAHs are distributed into the particle phase. A large amount of biomass combustion emissions in winter and the lower photochemical degradation rate make the amount of PAHs in winter higher than in summer [42]. The mass concentration of MMW PAHs was the highest, and the annual average mass concentration was 198.59 ng/m3. This may be because the burning of fossil fuels and coal is a major source of emissions in the arid and semi-arid regions of northwest China.
The ratios of polycyclic aromatic isomers are widely used to explain the characteristics of specific sources [10]. When the Flu/(Flu+Pyr) ratio is <0.4, 0.4–0.5, >0.5, it respectively represents oil combustion, motor vehicle exhaust, biomass combustion, and coal combustion; an Ant/(Ant + Phe) ratio of <0.1, >0.1 represents petroleum and motor vehicle exhaust sources, respectively; an IcdP/(IcdP+BghiP) ratio of <0.2, 0.2–0.5, >0.5 respectively represents diagenesis, petroleum, biomass, and coal combustion sources; a Bap/(Bap + Chry) ratio of 0.7–0.24 represents coal combustion source. Figure 9a,b shows the ratios of IcdP/(IcdP + BghiP) and Bap/(Bap + Chry) and the ratios of Flu/(Flu + Pyr) and Ant/(Ant + Phe) in the four seasons during the sampling period, showing that PAHs mainly come from biomass, coal combustion, and vehicle exhaust sources. The ratio of MMW/HMW is often used to characterize whether PAHs come from a local input source or an external input source [43]. Mannino and Orecchio pointed out that a value greater than 4.0 indicates PAH sources of a high-temperature process (combustion), while a value lower than 4.0 indicates emissions from a low-temperature process (petroleum products). It can be seen from Figure 9c that the PAHs in Urumqi in winter were mainly imported from outside, and the other three seasons were mostly concentrated from local sources. The total index was basically greater than 4.0, indicating that the PAHs came from the high-temperature combustion process. In summary, Urumqi’s PAHs were derived from vehicle exhaust emissions, biomass, oil, and coal combustion, and tended to be imported in winter, and from local sources in the other seasons.

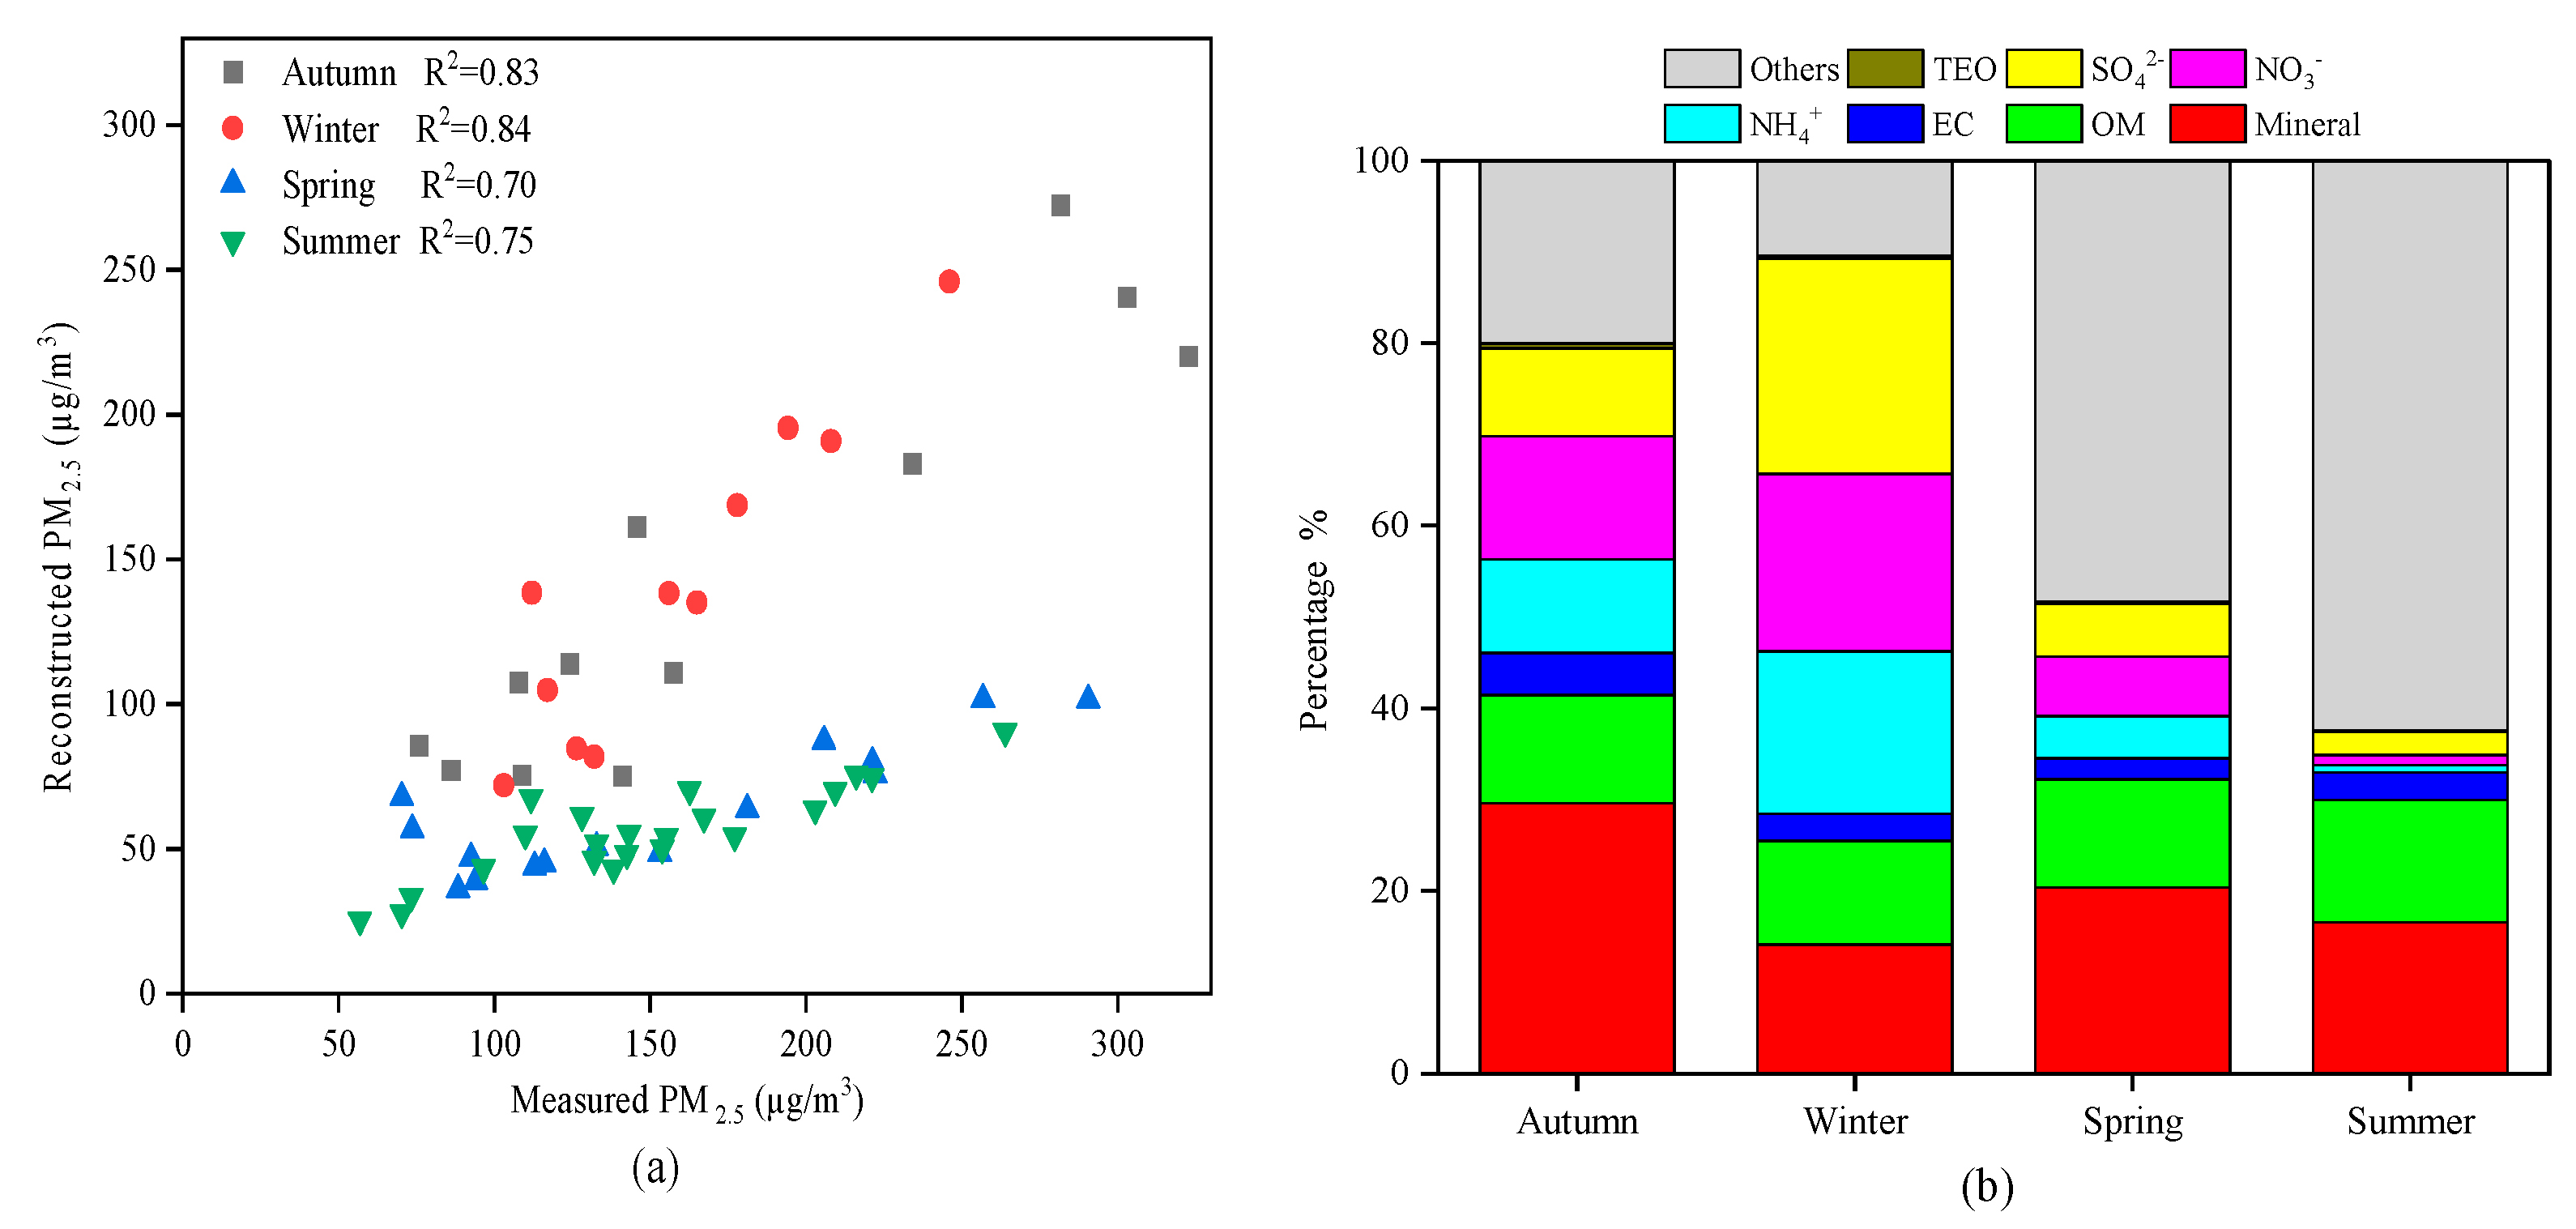
3.1.6. PM2.5 Mass Reconstruction

In this study, the measured components of PM2.5 were classified into minerals, SO42−, NO3, NH4+, EC, particulate organic matter (OM), trace element oxide (TEO), and other components, namely undetected components [19]. Mineral, OM, and TEO components were calculated by conversion factors with the following equation [18]:
Mineral = 2.20 × Al + 1.63 × Ca + 2.42 × Fe × 1.94 × Ti
OM = 1.6 × OC
TEO = 1.3 × [0.5 × (Sr + Ba + Mn + Co + Rb + Ni + V) +1.0 × (Cu + Zn + Mo + Cd + Tl + Pb + As + Se)]
Since Ca and Ti were not detected in this study, they were not calculated in the equation.
In order to screen the main pollutants in PM2.5 in different seasons and control the pollutants pertinently, a mass reconstruction of PM2.5 was carried out, as shown in Figure 10. The measured PM2.5 mass concentration was compared with the reconstructed PM2.5 mass concentration, as shown in Figure 10a, showing a good correlation (higher than 0.70) with one another in each season. The proportions of all components in the PM2.5 in the four seasons are shown in Figure 10b. The concentrations of SO42−, NO3, and NH4+ were the highest in winter and 9–22 times higher than those in summer. This was mainly due to the increase in coal burning for heating in Urumqi in winter, which led to a significant increase in the emissions of secondary aerosol precursors (the peak values of SO2 and NO2 both appeared in winter, Figure 2), and higher concentrations of SO42−, NO3, and NH4+ were caused by higher gas precursors. Minerals accounted for a significant proportion in autumn (29.59%) compared to the other three seasons, and minerals accounted for the lowest proportion in winter (14.09%). This may have been because it is easily blown into the air by wind in autumn in Urumqi, and the ground is covered by snow in winter, which reduces dust [18]. The proportions of OM in autumn (11.87%), winter (11.36%), and spring (11.84%) were basically the same, and the proportion of OM in summer (13.42%) was not much different. TEO accounted for less than 1% of the total mass concentration of particulate matter in the four seasons. The maximum undetermined component was 62.43% in summer, followed by 48.33% in spring. The minimum undetermined component was 10.41% in winter. This high degree of uncertainty may have been due to the PM2.5 mass bias caused by the evaporation of water-soluble components in the weighing environment, although the relative humidity was controlled. It may also have been due to the conversion factor and the conversion formula used when the OC was converted into organic matter, which may have led to errors.

3.2. PMF Source Apportionment

Positive matrix factorization (PMF, version 5.0) was used to input 35 chemical components into the calculation through multiple iterations. We examined a wide range of factor solutions (4–7). The recommended approach in a previous study was used to come to a suitable solution [44]. The optimal factor contributions were identified, and five factors were finally determined, as shown in Figure 11 and Figure 12.
The first factor was loaded with Na+ (56.2%), Mg2+ (81.9%), and Ca2+ (27.4%). A study showed that Mg2+ and Ca2+ are some of the most significant tracers of crustal minerals [45]. This factor is a source of dust and its contribution rate to the PM2.5 is 19.2%.
The second factor was loaded with Na+(40.7%), PO43− (32.5%), OC (21.2%), and EC (25.1%). A study reported that OC and EC were markers of biomass combustion [46], so the factor could be identified as the source of biomass combustion. The contribution of this factor to the PM2.5 was 10.2%.
The third factor was loaded with As (71.8%), Cd (55.0%), and Pb (60.2%). As may be derived from coal combustion [27]. The Cd element mainly comes from coal-burning and metallurgical industries, such as steel manufacturing and stainless steel production. It is inferred that this factor is a coal combustion source. This factor contributed 12.1% to the PM2.5.
The fourth factor was mainly loaded with V (50.4%), Mn (49.3%), Fe (50.0%), Co (44.8%), and Ba (46.4%). V is related to petroleum, based on the characteristics of metal elements along busy roads. The results show that V comes from the combustion of fossil fuels such as coal and petroleum [47], so the fourth factor was determined to be the source of vehicular transport, and its contribution rate was 12.1%.
The fifth factor was loaded with NH4+ (78.1%), Cl (69.3%), NO3 (84.2%), and SO42− (72.8%) mainly from secondary aerosols. NH4+, NO3, and SO42− are mostly composed of SO2 and NOX, and atmospheric oxidants are produced through photochemical reaction, which is affected by atmospheric conditions and emission sources [8]. The contribution rate of secondary ions to the PM2.5 was relatively large, with a contribution rate of 50.3%.

4. Conclusions

The following conclusions were obtained through the analysis of Urumqi atmospheric particulate matter composition and sources:
  • High concentrations of the gaseous pollutants SO2 and NO2 appeared in winter, and O3 had the highest concentration in summer. The mass concentration of WSIs in winter accounted for 63.06% of the PM2.5 mass concentration, which was the highest in the four seasons. SO42−, NO3, and NH4+ were the main water-soluble ions. according to the ratio of NO3/SO42−, the Urumqi stationary pollution emission source contribution was dominant.
  • The mass concentrations of OC and EC in autumn were higher than in other seasons, which may have been mainly caused by the open-air burning of biomass in surrounding farmland in autumn. The ratios of OC/EC in the three seasons of winter, spring, and summer were greater than 2, indicating the formation of SOC. The seasonal distribution of WSOC is as follows: winter (8.60 ± 3.00 µg/m3) > autumn (6.60 ± 2.64 µg/m3) > spring (4.30 ± 1.41 µg/m3) > summer (3.99 ± 1.52 µg/m3).
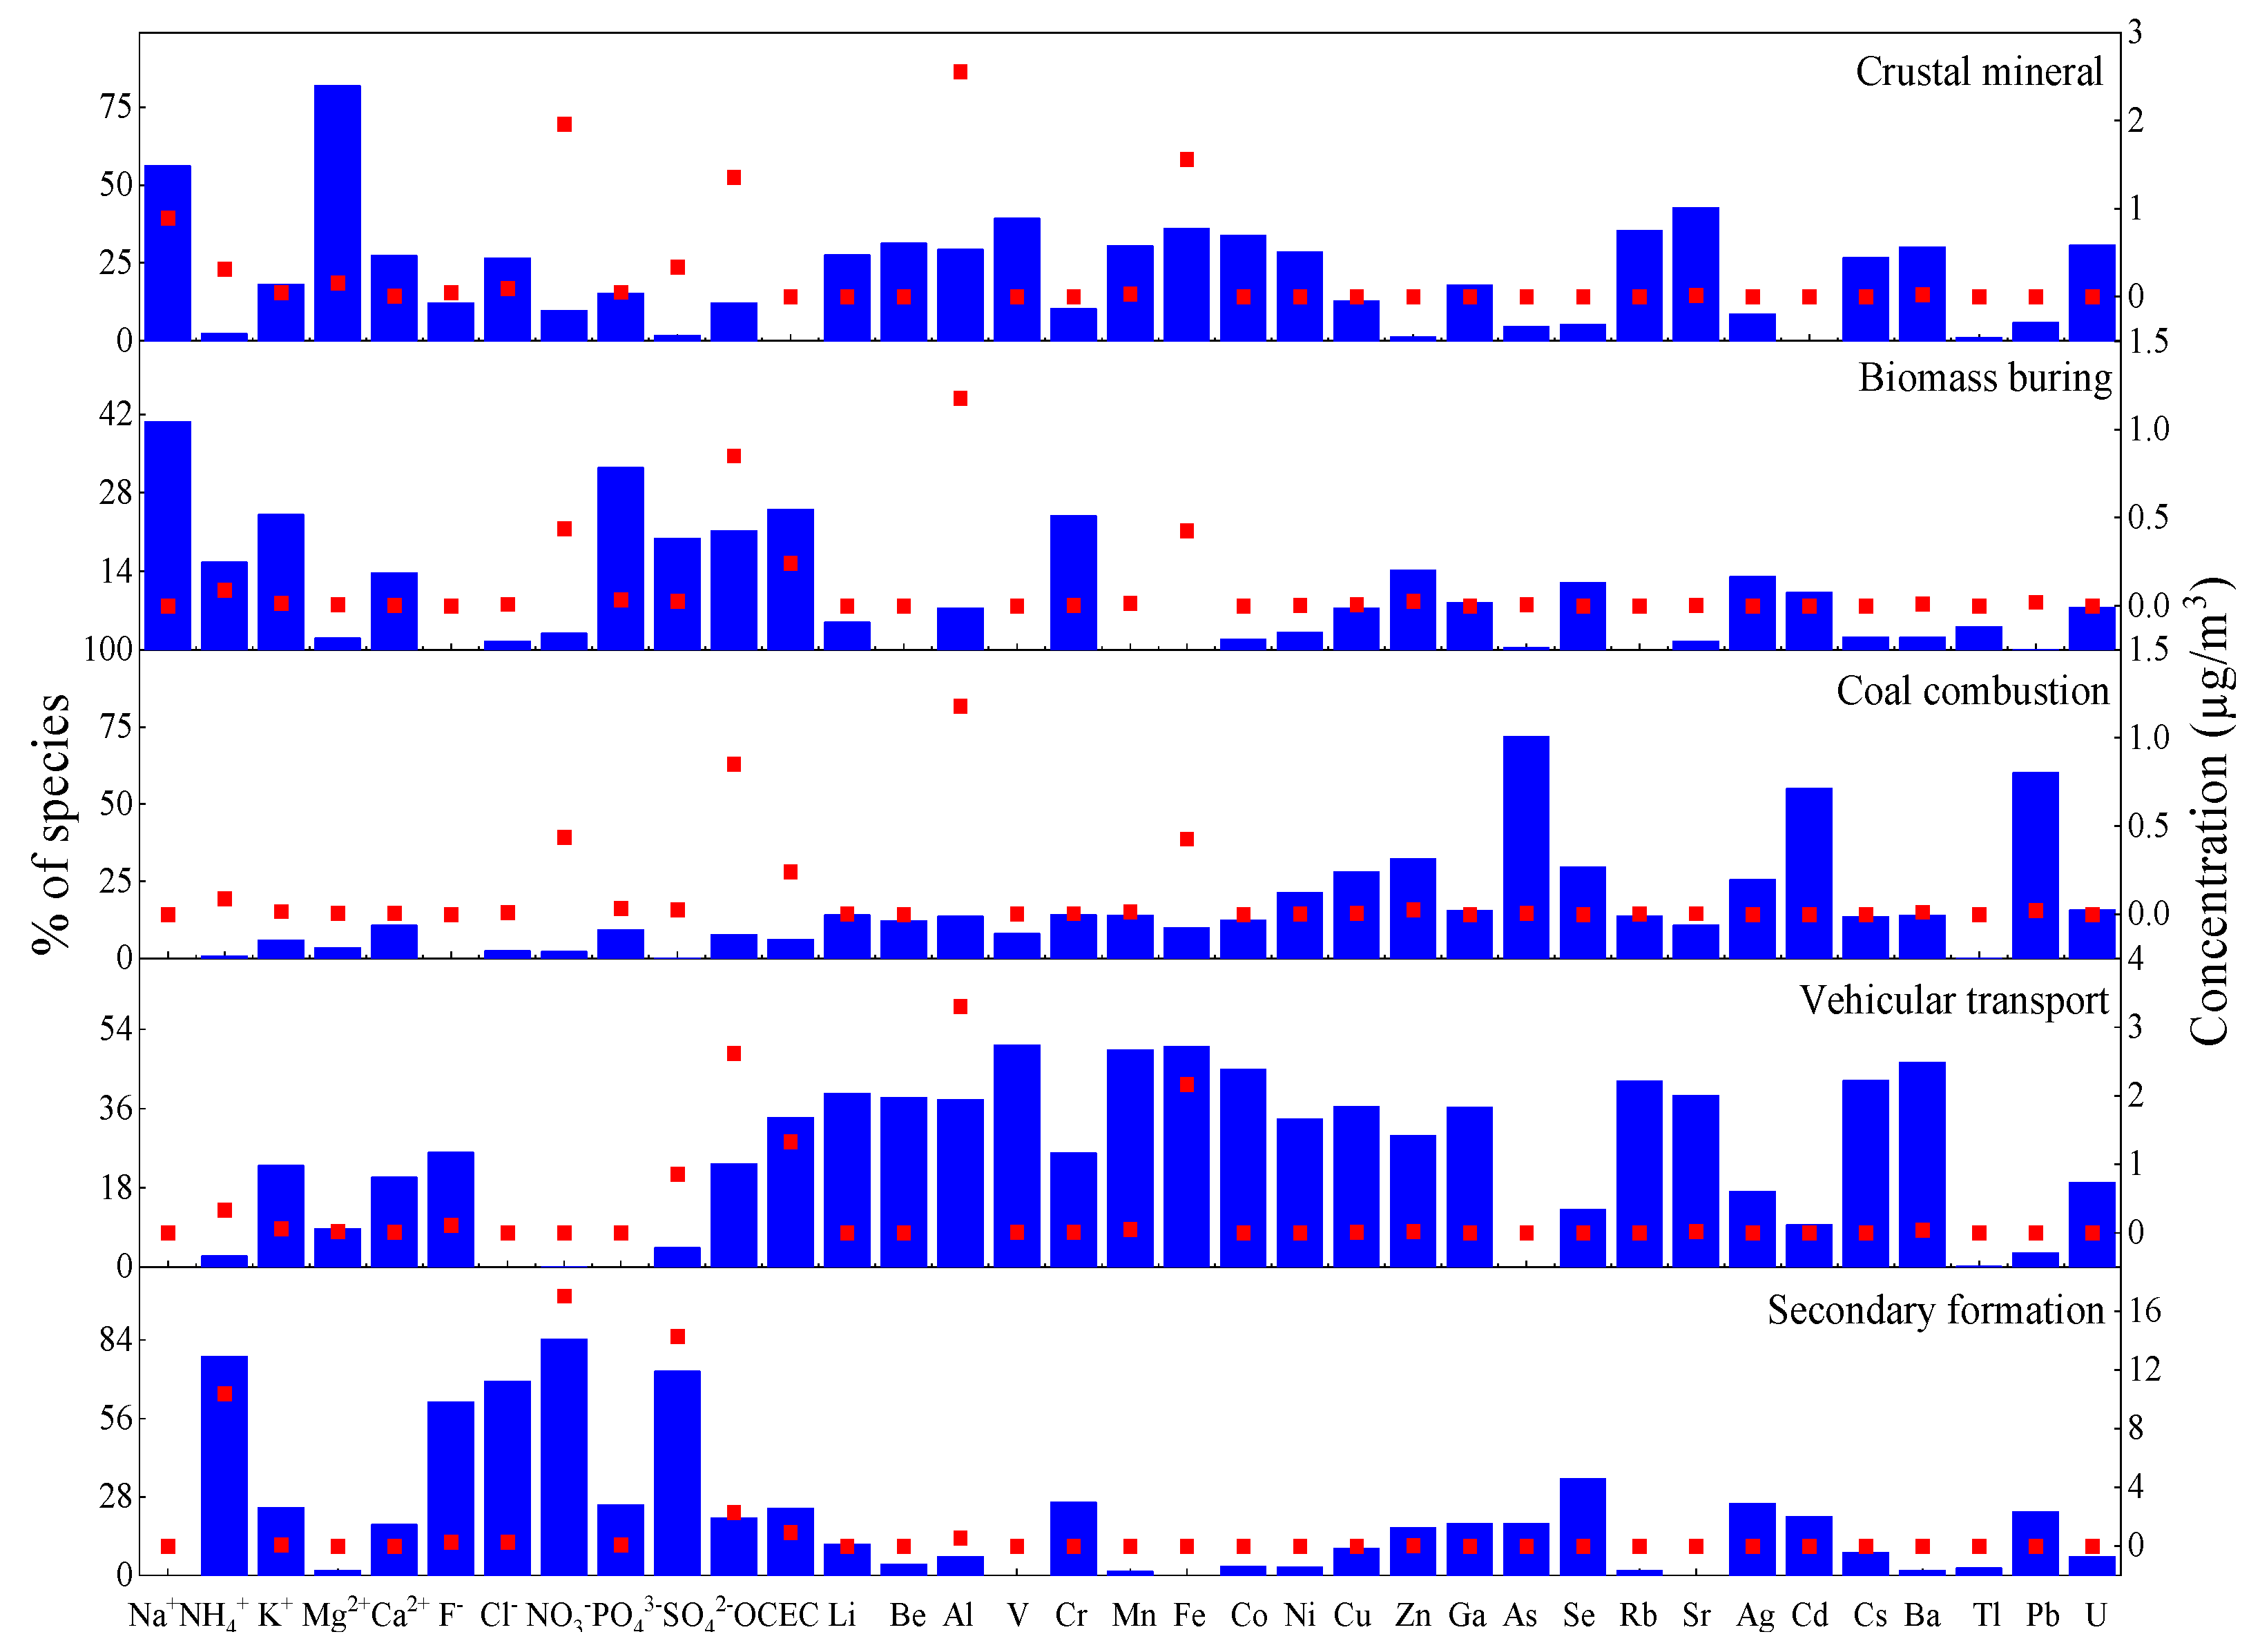
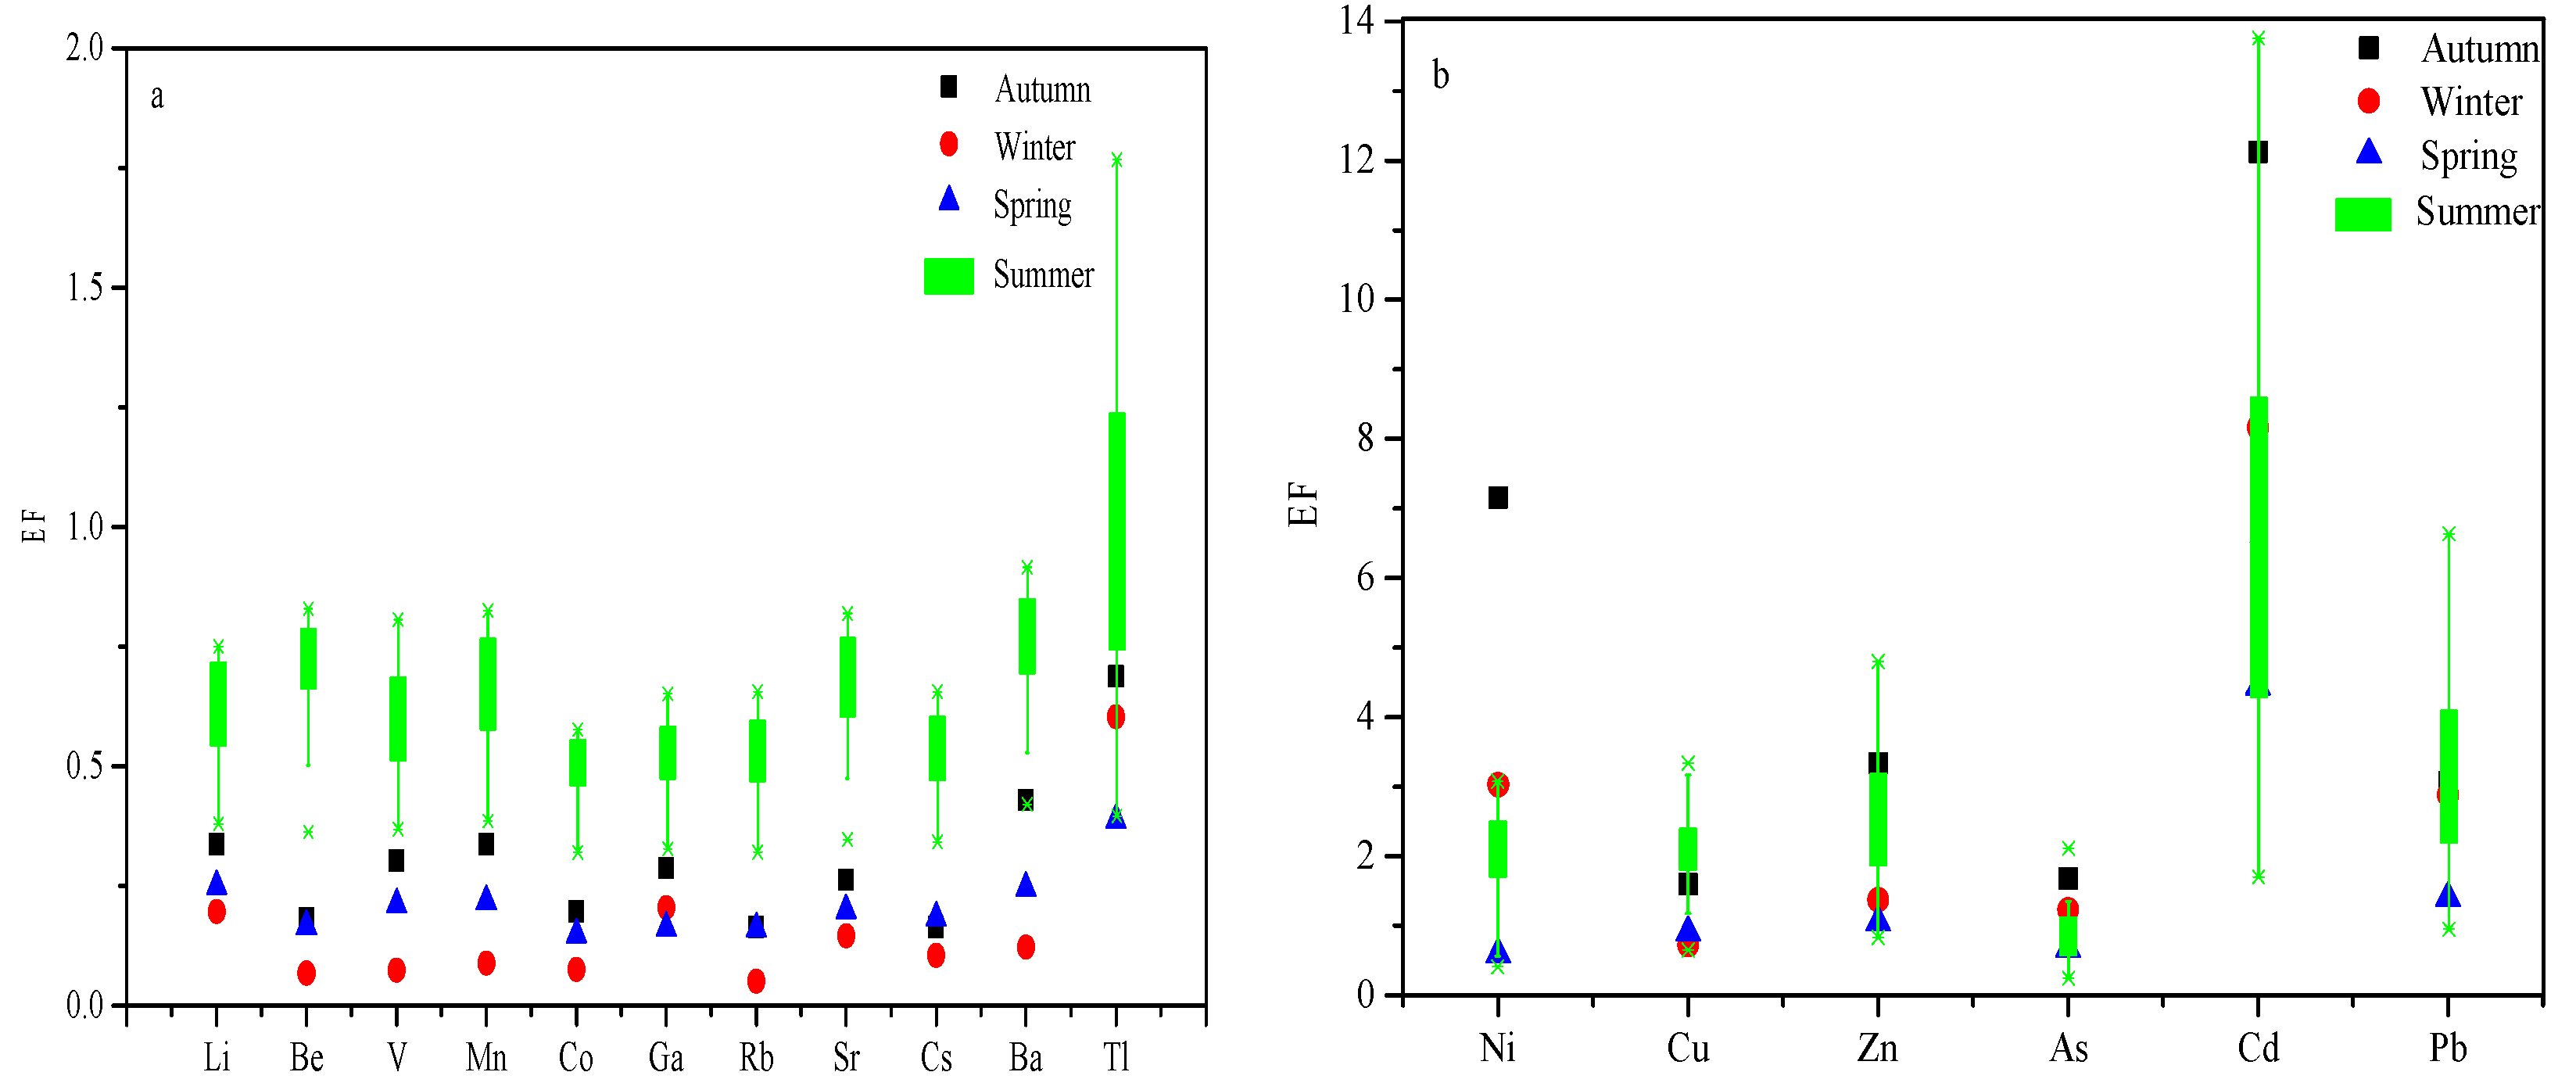
  • The seasonal distribution of metal elements in PM2.5 in Urumqi was: autumn > winter > spring > summer. Al and Fe were the most abundant elements in the PM2.5. There were seasonal differences in the enrichment factors of Ni, Cu, Zn, Cd, Pb, and especially Cd, which was high in every season, mainly due to anthropogenic sources.
  • The middle molecular weight polycyclic aromatic hydrocarbons in the PM2.5 accounted for the highest proportion of the atmosphere in Urumqi. The polycyclic aromatic hydrocarbon ratio method showed that the sources of Urumqi PAHs were motor vehicle exhaust emissions, biomass combustion, and oil and coal combustion. These sources tend to be imported sources and high-temperature combustion processes.
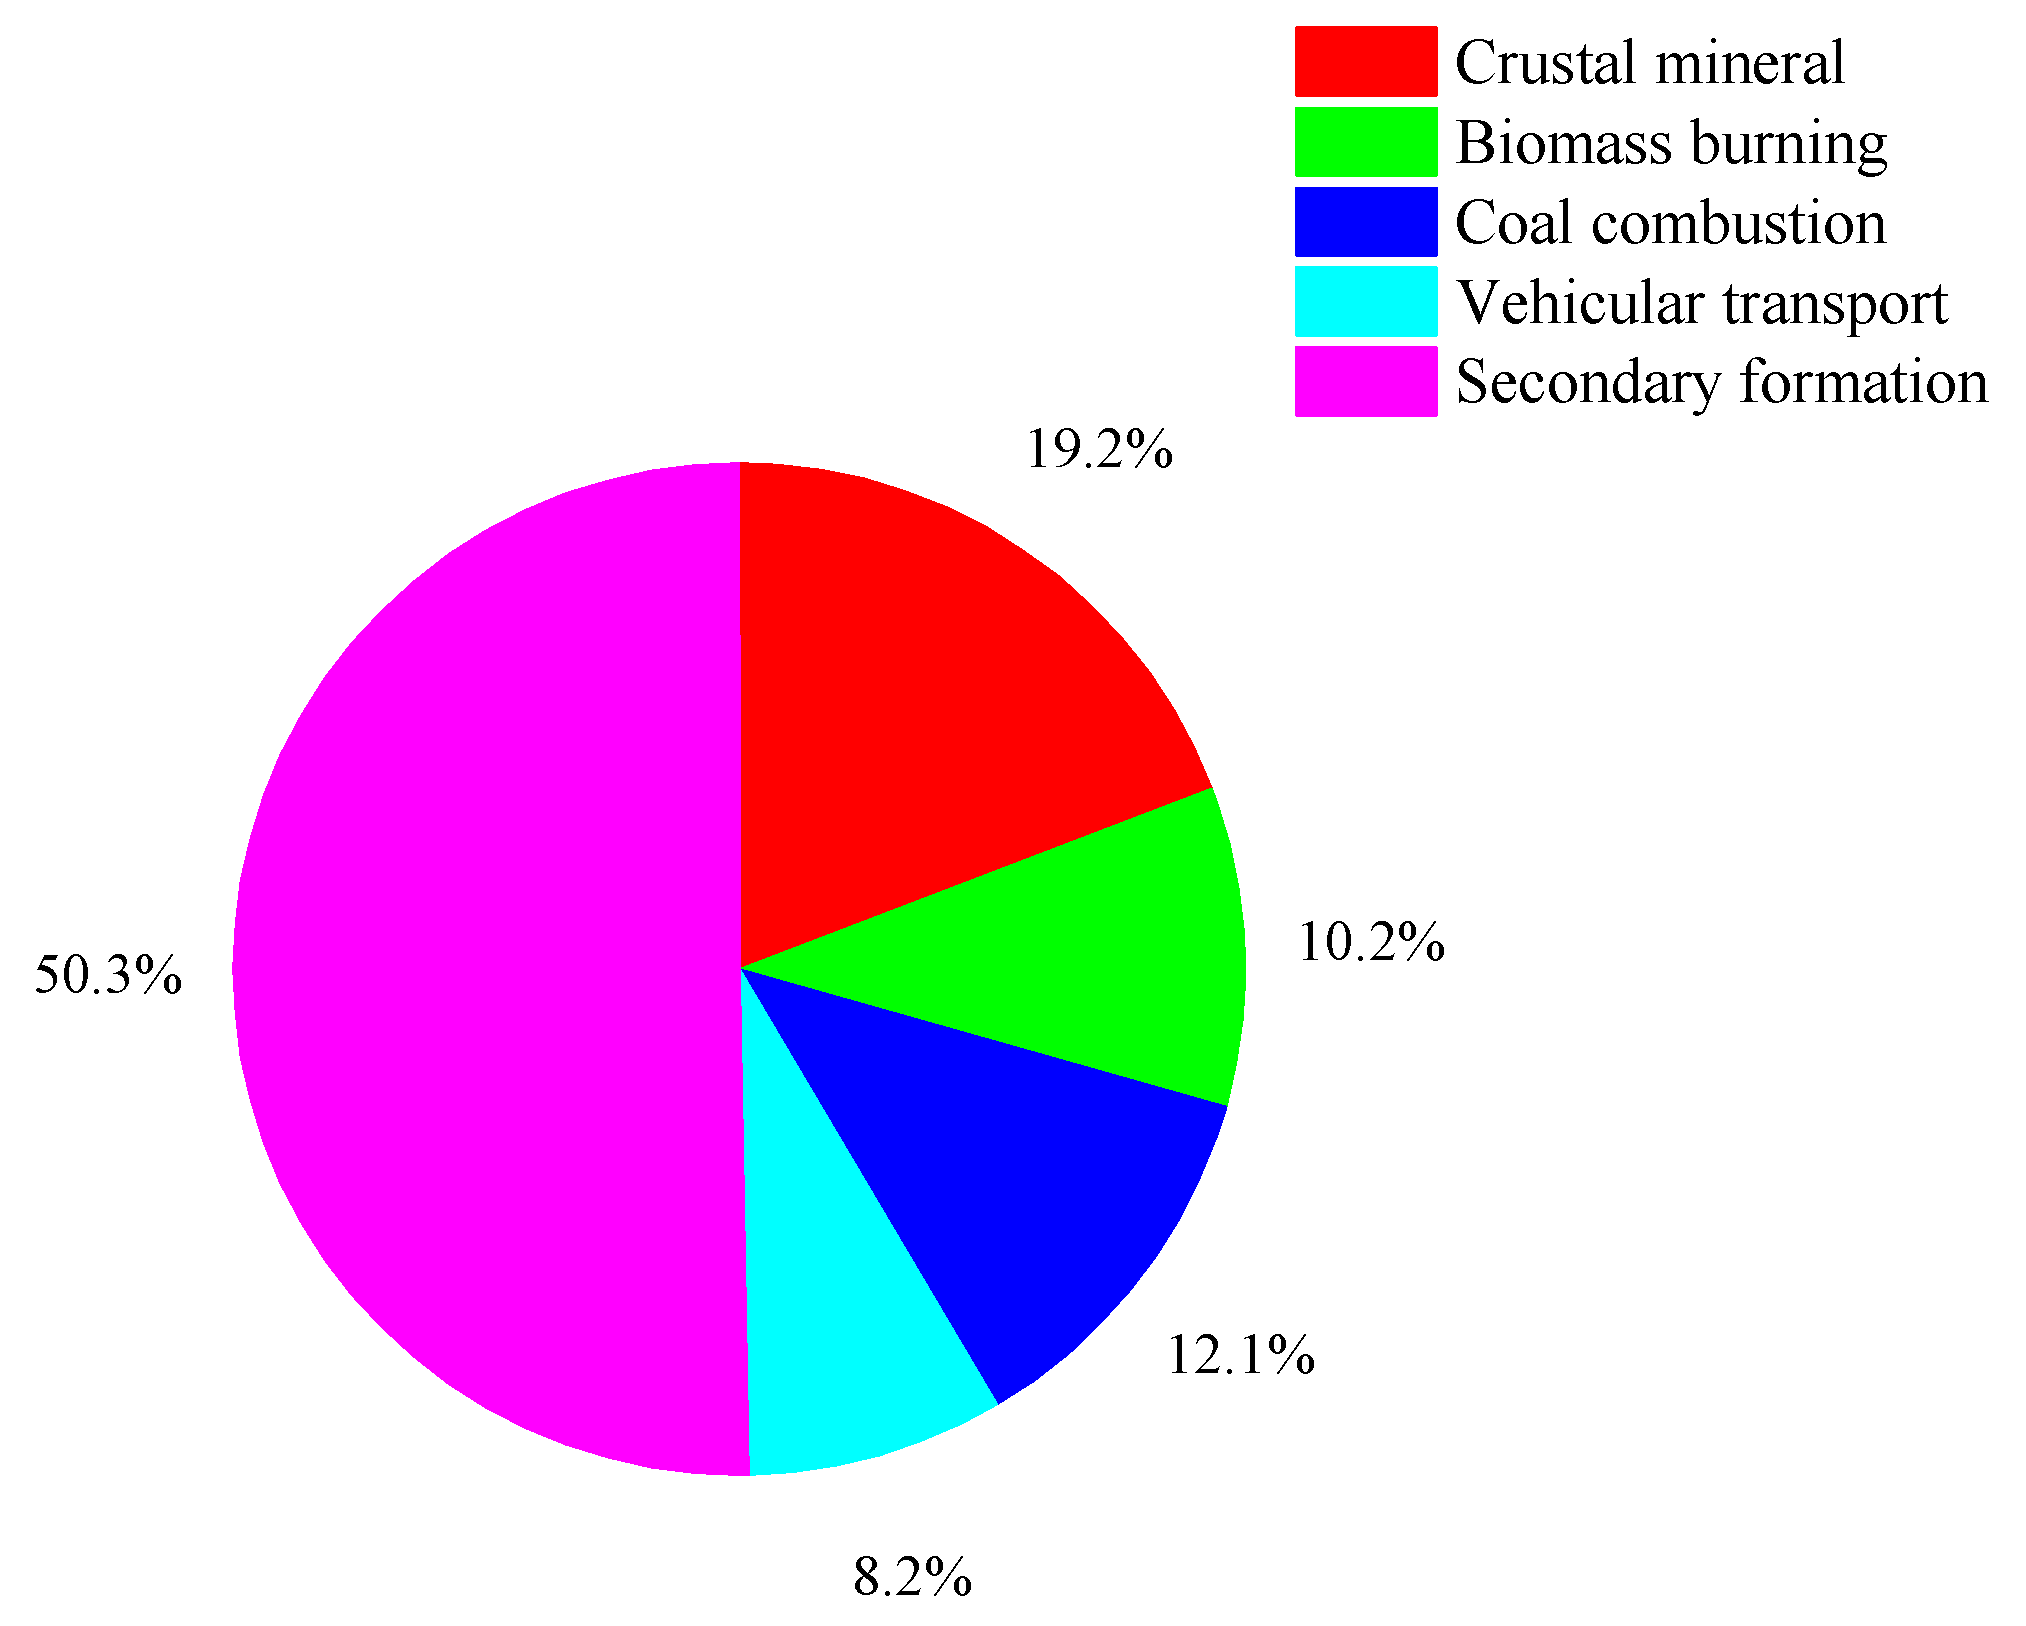
  • According to the PMF model, the main sources of atmospheric PM2.5 in Urumqi were crustal minerals, biomass combustion, coal combustion, vehicular transport, and secondary aerosols. Among them, the contribution rate of secondary aerosols was the highest, and the contribution rate of petroleum sources was the lowest.

Author Contributions

Conceptualization, K.L. and D.T.; methodology, B.G.; software, X.Z.; validation, D.T., B.G. and W.W.; formal analysis, A.A.; investigation, X.W.; resources, X.D.; data curation, K.L.; writing—original draft preparation, K.L.; writing—review and editing, K.L.; visualization, H.L.; supervision, Y.Z.; project administration, D.T.; funding acquisition, D.T. All authors have read and agreed to the published version of the manuscript.

Funding

This study was supported by the National Natural Science Foundation of China (41967050/41773127).

Institutional Review Board Statement

Not applicable.

Informed Consent Statement

Not applicable.

Data Availability Statement

Publicly available datasets were analyzed in this study.

Conflicts of Interest

The authors declare no conflict of interest.

References

  1. Fan, H.; Zhao, C.; Yang, Y. A comprehensive analysis of the spatio-temporal variation of urban air pollution in China during 2014–2018. Atmos. Environ. 2020, 220, 117066–117077. [Google Scholar] [CrossRef]
  2. Shiraiwa, M.; Ueda, K.; Pozzer, A.; Lammel, G.; Kampf, C.J.; Fushimi, A.; Enami, S.; Arangio, A.M.; Fröhlich-Nowoisky, J.; Fujitani, Y.; et al. Aerosol Health Effects from Molecular to Global Scales. Environ. Sci. Technol. 2017, 51, 13545–13567. [Google Scholar] [CrossRef] [PubMed]
  3. Li, H.; Wang, Q.; Yang, M.; Li, F.; Wang, J.; Sun, Y.; Wang, C.; Wu, H.; Qian, X. Chemical characterization and source apportionment of PM2.5 aerosols in a megacity of Southeast China. Atmos. Res. 2016, 181, 288–299. [Google Scholar] [CrossRef]
  4. Niu, X.; Ho, K.; Hu, T.; Sun, J.; Duan, J.; Huang, Y.; Lui, K.; Cao, J. Characterization of chemical components and cytotoxicity effects of indoor and outdoor fine particulate matter (PM2.5) in Xi’an, China. Environ. Sci. Pollut. Res. 2019, 26, 31913–31923. [Google Scholar] [CrossRef]
  5. Krall, J.R.; Adibah, N.; Babin, L.M.; Lee, Y.; Motti, G.; McCombs, M.; Mcwilliams, A.; Thornburg, J.; Pollack, A.Z. Estimating exposure to traffic-related PM2.5 for women commuters using vehicle and personal monitoring. Environ. Res. 2020, 187, 109644–109651. [Google Scholar] [CrossRef]
  6. Turap, Y.; Rekefu, S.; Wang, G.; Talifu, D.; Gao, B.; Aierken, T.; Shen, H.; Wang, X.M.; Tursun, Y.; Maihemuti, M.; et al. Chemical Characteristics and Source Apportionment of PM2.5 during Winter in the Southern Part of Urumqi, China. Aerosol Air Qual. Res. 2019, 19, 1325–1337. [Google Scholar] [CrossRef] [Green Version]
  7. Rekefu, S.; Talifu, D.; Gao, B.; Turap, Y.; Maihemuti, M.; Wang, X.M.; Abulizi, A. Polycyclic Aromatic Hydrocarbons in PM2.5 and PM2.5–10 in Urumqi, China: Temporal Variations, Health Risk, and Sources. Atmosphere 2018, 9, 412. [Google Scholar] [CrossRef] [Green Version]
  8. Zhang, X.; Ding, X.; Talifu, D.; Wang, X.M.; Abulizi, A.; Maihemuti, M.; Rekefu, S. Humidity and PM2.5 composition determine atmospheric light extinction in the arid region of northwest China. J. Environ. Sci. 2021, 100, 279–286. [Google Scholar] [CrossRef]
  9. Ren, Y.Q.; Wang, G.H.; Wang, C.; Wang, J.Y.; Li, J.J.; Zhang, L.; Han, Y.N.; Liu, L.; Cao, C.; Cao, J.J.; et al. Changes in concentration, composition and source contribution of atmospheric organic aerosols by shifting coal to natural gas in Urumqi. Atmos. Environ. 2017, 148, 306–315. [Google Scholar] [CrossRef]
  10. Shi, G.-L.; Feng, Y.C.; Wu, J.H.; Li, X. Source Identification of Polycyclic Aromatic Hydrocarbons in Urban Particulate Matter of Tangshan, China. Aerosol Air Qual. Res. 2009, 9, 309–315. [Google Scholar] [CrossRef] [Green Version]
  11. Mannino, M.R.; Orecchio, S. Polycyclic aromatic hydrocarbons (PAHs) in indoor dust matter of Palermo (Italy) area: Extraction, GC–MS analysis, distribution and sources. Atmos. Environ. 2008, 42, 1801–1817. [Google Scholar] [CrossRef]
  12. Tao, J.; Zhang, L.M.; Engling, G.; Zhang, R.J.; Yang, Y.H.; Cao, J.J.; Zhu, C.S.; Wang, Q.Y.; Luo, L. Chemical composition of PM2.5 in an urban environment in Chengdu, China: Importance of springtime dust storms and biomass burning. Atmos. Res. 2013, 122, 270–283. [Google Scholar] [CrossRef]
  13. Sutherland, R.A. Bed sediment-associated trace metals in an urban stream, Oahu, Hawaii. Environ. Geol. 2000, 39, 611–627. [Google Scholar] [CrossRef]
  14. Luo, L.N.; Bai, X.X.; Liu, S.H.; Wu, B.B.; Liu, W.; Lv, Y.Q.; Guo, Z.H.; Lin, S.M.; Zhao, S.; Hao, Y.; et al. Fine particulate matter (PM2.5/PM1.0) in Beijing, China: Variations and chemical compositions as well as sources. Environ. Sci. 2022, 121, 187–198. [Google Scholar] [CrossRef]
  15. Zhang, X.; Ding, X.; Wang, X.M.; Talifu, D.; Wang, G.; Zhang, Y.L.; Abulizi, A. Volatile Organic Compounds in a Petrochemical Region in Arid of NW China: Chemical Reactivity and Source Apportionment. Atmosphere 2019, 10, 641. [Google Scholar] [CrossRef] [Green Version]
  16. Song, W.; Chang, Y.H.; Liu, X.J.; Li, K.H.; Gong, Y.M.; He, G.X.; Wang, X.L.; Christie, P.; Zheng, M.; Dore, A.J.; et al. A multiyear assessment of air quality benefits from China’s emerging shale gas revolution: Urumqi as a case study. Environ. Sci. Technol. 2015, 49, 2066–2072. [Google Scholar] [CrossRef] [Green Version]
  17. Liu, H.; Talifu, D.; Ding, X.; Wang, X.M.; Abulizi, A.; Tursun, Y.; An, J.Q.; Wang, W.; Zhang, X.X.; Zhang, Y.Y. Particles liquid water and acidity determine formation of secondary inorganic ions in Urumqi, NW China. Atmos. Res. 2021, 260, 105622–105631. [Google Scholar] [CrossRef]
  18. Wang, Y.N.; Jia, C.H.; Tao, J.; Zhang, L.M.; Liang, X.X.; Ma, J.M.; Gao, H.; Huang, T.; Zhang, K. Chemical characterization and source apportionment of PM2.5 in a semi-arid and petrochemical-industrialized city, Northwest China. Sci. Total Environ. 2016, 573, 1031–1040. [Google Scholar] [CrossRef]
  19. Turap, Y.; Talifu, D.; Wang, X.M.; Abulizi, A.; Maihemuti, M.; Tursun, Y.; Ding, X.; Aierken, T.; Rekefu, S. Temporal distribution and source apportionment of PM2.5 chemical composition in Xinjiang, NW-China. Atmos. Res. 2019, 218, 257–268. [Google Scholar] [CrossRef]
  20. Wang, Y.; Li, J.H.; Wu, D.; Xu, H. Chemical composition and source apportionment of the ambient PM2.5 in Hangzhou, China. Particuology 2015, 18, 135–143. [Google Scholar]
  21. Zhang, Y.L.; Li, J.; Zhang, G.; Zotter, P.; Huang, R.J.; Wacker, L.; Szidat, S. Radiocarbon-Based Source Apportionment of Carbonaceous Aerosols at a Regional Background Site on Hainan Island, South China. Environ. Sci. Technol. 2014, 48, 2651–2659. [Google Scholar] [CrossRef] [PubMed]
  22. Xu, H.M.; Cao, J.J.; Huang, R.J.; Shen, Z.X.; Chen, L.W.; Ho, K.F.; Watson, J.G. Inter-annual variability of wintertime PM2.5 chemical composition in Xi’an, China: Evidences of changing source emissions. Sci. Total Environ. 2016, 545–546, 546–555. [Google Scholar] [CrossRef] [PubMed]
  23. Qiu, X.; Duan, L.; Cao, J.; Wang, S.L.; Chai, F.H.; Hu, J.; Zhang, J.Q.; Yang, Y. Chemical composition and source apportionment of PM10 and PM2.5 in different functional areas of Lanzhou, China. J. Environ. Sci. 2016, 40, 75–83. [Google Scholar] [CrossRef] [PubMed]
  24. Wang, N.; Zhao, X.Y.; Wang, J.; Yin, B.H.; Geng, C.M.; Niu, D.W.; Yang, W.; Li, W. Chemical Composition of PM2.5 and Its Impact on Inhalation Health Risk Evaluation in a City with Light Industry in Central China. Atmosphere 2020, 11, 340. [Google Scholar] [CrossRef] [Green Version]
  25. Tan, J.; Zhang, L.; Zhou, X.; Duan, J.; Li, Y.; Hu, J.; He, K. Chemical characteristics and source apportionment of PM2.5 in Lanzhou, China. Sci. Total Environ. 2017, 601–602, 1743–1752. [Google Scholar] [CrossRef] [PubMed]
  26. Wang, Q.; Zhang, L.M.; Zhou, X.M.; Duan, J.C.; Li, Y.; Hu, J.N.; He, K.B. Carbonaceous species in PM2.5 and PM10 in urban area of Zhengzhou in China: Seasonal variations and source apportionment. Atmos. Res. 2017, 191, 1–11. [Google Scholar] [CrossRef]
  27. Castro, L.M.; Pio, C.A.; Harrison, R.M.; Smith, D.J. Carbonaceous aerosol in urban and rural European atmospheres: Estimation of secondary organic carbon concentrations. Atmos. Environ. 1999, 33, 2771–2781. [Google Scholar] [CrossRef]
  28. Du, Z.Y.; He, K.B.; Cheng, Y.; Duan, F.K.; Ma, Y.L.; Liu, J.M.; Zhang, X.L.; Zheng, M.; Rodney, W. A yearlong study of water-soluble organic carbon in Beijing I: Sources and its primary vs. secondary nature. Atmos. Environ. 2014, 92, 514–521. [Google Scholar] [CrossRef]
  29. Xiang, P.; Zhou, X.M.; Duan, J.C.; Tan, J.H.; He, K.B.; Yuan, C.; Ma, Y.L.; Zhang, Y.X. Chemical characteristics of water-soluble organic compounds (WSOC) in PM2.5 in Beijing, China: 2011–2012. Atmos. Res. 2017, 183, 104–112. [Google Scholar] [CrossRef]
  30. Viana, M.; López, J.M.; Querol, X.; Alastuey, A.; García-Gacio, D.; Blanco-Heras, G.; López-Mahía, P.; Piñeiro-Iglesias, M.; Sanz, M.J.; Sanz, F.; et al. Tracers and impact of open burning of rice straw residues on PM in Eastern Spain. Atmos. Environ. 2008, 42, 1941–1957. [Google Scholar] [CrossRef]
  31. Chow, J.C.; Watson, J.G.; Lu, Z.Q.; Lowenthal, D.H.; Frazier, C.A.; Solomon, P.A.; Thullier, R.H.; Magliano, K. Descriptive analysis of PM2.5 and PM10 at regionally representative locations during SJVAQS/AUSPEX. Atmos. Environ. 1996, 30, 2079–2112. [Google Scholar] [CrossRef]
  32. Huang, X.; Olmez, I.; Aras, N.K.; Gordon, G.E. Emissions of trace elements from motor vehicles: Potential marker elements and source composition profile. Atmos. Environ. 1994, 28, 1385–1391. [Google Scholar] [CrossRef]
  33. Zhai, Y.; Liu, X.T.; Chen, H.M.; Xu, B.B.; Zhu, L.; Li, C.T.; Zeng, G.M. Source identification and potential ecological risk assessment of heavy metals in PM2.5 from Changsha. Sci. Total Environ. 2014, 493, 109–115. [Google Scholar] [CrossRef] [PubMed]
  34. Tian, H.; Cheng, K.; Wang, Y.; Zhao, D.; Lu, L.; Jia, W.X.; Hao, J.M. Temporal and spatial variation characteristics of atmospheric emissions of Cd, Cr, and Pb from coal in China. Atmos. Environ. 2012, 50, 157–163. [Google Scholar] [CrossRef]
  35. Khare, P.; Baruah, B.P. Elemental characterization and source identification of PM2.5 using multivariate analysis at the suburban site of North-East India. Atmos. Res. 2010, 98, 148–162. [Google Scholar] [CrossRef]
  36. Mcmurtry, G.M.; Wiltshire, J.C.; Kauahikaua, J.P. Heavy Metal Anomalies in Coastal Sediments of O’ahu, Hawai’i. Oceanogr. Lit. Rev. 1995, 49, 452–470. [Google Scholar]
  37. Yu, Q.Q.; Gao, B.; Li, G.H.; Zhang, Y.L.; He, Q.F.; Deng, W.; Huang, Z.H.; Ding, X.; Hu, Q.H.; Huang, Z.Z.; et al. Attributing risk burden of PM2.5-bound polycyclic aromatic hydrocarbons to major emission sources: Case study in Guangzhou, south China. Atmos. Environ. 2016, 142, 313–323. [Google Scholar] [CrossRef]
  38. Lammel, G.; Sehili, A.M.; Bond, T.; Feichter, J.; Grassl, H. Gas/particle partitioning and global distribution of polycyclic aromatic hydrocarbons—A modelling approach. Chemosphere 2009, 76, 98–106. [Google Scholar] [CrossRef] [Green Version]
  39. Wang, L.; Zhao, Y.; Yi, X.; Wang, Z.X.; Yi, Y.Y.; Huang, T.; Gao, H.; Ma, J.M. Spatial distribution of atmospheric PAHs and their genotoxicity in petrochemical industrialized Lanzhou valley, northwest China. Environ. Sci. Pollut. Res. 2017, 24, 12820–12834. [Google Scholar] [CrossRef]
  40. Zhang, Y.P.; Chen, J.; Yang, H.N.; Li, R.J.; Yu, Q. Seasonal variation and potential source regions of PM2.5-bound PAHs in the megacity Beijing, China: Impact of regional transport. Environ. Pollut. 2017, 231, 329–338. [Google Scholar] [CrossRef]
  41. Wang, W.; Ding, X.; Tursun, Y.; Tursun, Y.; Abulizi, A.; Wang, X.M.; Shao, L.Y.; Talifu, D.; An, J.Q.; Zhang, X.X.; et al. Distribution, sources, risks, and vitro DNA oxidative damage of PM2.5-bound atmospheric polycyclic aromatic hydrocarbons in Urumqi, NW China. Sci. Total Environ. 2020, 739, 139518–139530. [Google Scholar] [CrossRef] [PubMed]
  42. Liu, J.; Man, R.L.; Ma, S.X.; Li, J.S.; Wu, Q.; Peng, J.Y. Atmospheric levels and health risk of polycyclic aromatic hydrocarbons (PAHs) bound to PM2.5 in Guangzhou, China. Mar. Pollut. Bull. 2015, 100, 134–143. [Google Scholar] [CrossRef] [PubMed]
  43. Bootdee, S.; Chantara, S.; Prapamontol, T. Determination of PM2.5 and polycyclic aromatic hydrocarbons from incense burning emission at shrine for health risk assessment. Atmos. Pollut. Res. 2016, 7, 680–689. [Google Scholar] [CrossRef] [Green Version]
  44. Reff, A.; Eberly, S.; Bhave, P. Receptor modeling of ambient particulate matter data using positive matrix factorization: Review of existing methods. Air Waste Manag Assoc. 2007, 57, 146–154. [Google Scholar] [CrossRef] [Green Version]
  45. Cesari, D.; Donateo, A.; Conte, M.; Merico, E.; Giangreco, A.; Giangreco, F.; Contini, D. An inter-comparison of PM2.5 at urban and urban background sites: Chemical characterization and source apportionment. Atmos. Res. 2016, 174, 106–119. [Google Scholar] [CrossRef]
  46. Song, F.; Gao, Y. Size distributions of trace elements associated with ambient particular matter in the affinity of a major highway in the New Jersey–New York metropolitan area. Atmos. Environ. 2011, 45, 6714–6723. [Google Scholar] [CrossRef]
  47. Hsu, C.Y.; Chiang, H.C.; Lin, S.L.; Chen, M.J.; Lin, T.Y.; Chen, Y.C. Elemental characterization and source apportionment of PM10 and PM2.5 in the western coastal area of central Taiwan. Sci. Total Environ. 2016, 541, 1139–1150. [Google Scholar] [CrossRef]
Figure 1. Locations of the sampling sites in Urumqi.
Atmosphere 13 00781 g001
Figure 2. Time series of meteorological records and PM2.5 during the sampling time.
Atmosphere 13 00781 g002
Figure 3. The change trend of PM2.5 concentration in Urumqi since 2015.
Atmosphere 13 00781 g003
Figure 4. SO42−, NO3, and NO3/SO42− daily and seasonal changes.
Atmosphere 13 00781 g004
Figure 5. Correlation between OC and EC.
Atmosphere 13 00781 g005
Figure 6. The seasonal changes of metal concentrations in Urumqi.
Atmosphere 13 00781 g006
Figure 7. Seasonal enrichment factors of metals in PM2.5. (a) enrichment factors of Li, Be, V, Mn, Co, Ga, Rb, Sr, Cs, Ba, and T1 (b) enrichment factors of Ni, Cu, Zn, Ag, Cd, and Pb.
Atmosphere 13 00781 g007
Figure 8. Seasonal variation of different PAHs at sampling sites in Urumqi.
Atmosphere 13 00781 g008
Figure 9. Seasonal variations of ratios of Flu/(Flu+Pyr) versus Ant/(Ant+Phe) (a) and Bap/(Bap+Chry) versus Icdp/(Icdp+Bghip) (b) and MMW/HMW versus the total index (c) in Urumqi.
Atmosphere 13 00781 g009aAtmosphere 13 00781 g009b
Figure 10. Chemical mass components of PM2.5 in four seasons in Urumqi. (a) Comparison of the measured PM2.5 mass concentration with the reconstructed PM2.5 mass concentration, (b) proportions of all components in the PM2.5 in the four seasons.
Atmosphere 13 00781 g010
Figure 11. Source profile (%) of chemical components in PM2.5 in Urumqi.
Atmosphere 13 00781 g011
Figure 12. Distribution of different sources.
Atmosphere 13 00781 g012
Table 1. The seasonal and annual mean concentrations of water-soluble ions (mean ± SD; unit: µg/m3).
SpeciesAutumnWinterSpringSummerAnnual
Na+1.57 ± 0.90.98 ± 1.11.94 ± 1.72.59 ± 1.51.93 ± 1.5
NH4+18.45 ± 6.928.11 ± 12.76.90 ± 7.021.21 ± 0.710.88 ± 12.2
K+0.42 ± 0.30.24 ± 0.10.22 ± 0.10.18 ± 0.10.25 ± 0.2
Mg2+0.26 ± 0.20.13 ± 0.10.27 ± 0.20.21 ± 0.10.22 ± 0.1
Ca2+3.59 ± 4.00.21 ± 0.53.04 ± 3.50.84 ± 1.61.93 ± 3.0
F1.21 ± 0.80.64 ± 0.30.44 ± 0.40.11 ± 0.10.52 ± 0.5
Cl0.49 ± 0.30.68 ± 0.30.41 ± 0.40.11 ± 0.10.37 ± 0.3
NO324.45 ± 20.630.75 ± 19.19.65 ± 12.12.73 ± 1.413.46 ± 17.5
PO43−0.27 ± 0.20.50 ± 0.30.34 ± 0.10.50 ± 0.30.33 ± 0.2
SO42−17.34 ± 11.934.35 ± 25.411.83 ± 9.23.78 ± 1.313.58 ± 16.4
SNA60.24 ± 30.099.22 ± 53.625.16 ± 24.56.61 ± 2.937.9 ± 46.1
WSIs68.08 ± 32.399.62 ± 53.131.68 ± 25.711.04 ± 4.843.47 ± 52.2
Table 2. Concentrations of OC and EC in PM2.5 in Urumqi for four seasons and annually (mean ± SD; unit: µg/m3).
SpeciesAutumnWinterSpringSummerAnnual
OC13.39 ± 6.711.21 ± 3.710.99 ± 2.512.44 ± 4.212.00 ± 4.4
EC8.36 ± 5.94.73 ± 1.93.45 ± 1.14.46 ± 2.45.00 ± 3.5
TCA29.81 ± 15.622.67 ± 7.521.04 ± 4.624.38 ± 8.924.20 ± 9.8
OC/EC1.84 ± 0.52.55 ± 0.73.43 ± 1.33.22 ± 1.12.89 ± 1.2
SOC-7.52 ± 2.88.30 ± 2.38.96 ± 2.98.10 ± 3.2
WSOC6.60 ± 2.68.60 ± 3.04.30 ± 1.43.99 ± 1.55.38 ± 2.6
WIOC6.80 ± 7.12.62 ± 1.96.69 ± 2.48.46 ± 3.26.62 ± 4.4
Table 3. The seasonal Al and Fe concentrations and EF values.
SpeciesAutumnWinterSpringSummer
Concentration
(μg /m3)
Al15.11 ± 10.17.84 ± 3.98.25 ± 6.06.90 ± 2.2
Fe8.33 ± 6.92.07 ± 0.95.00 ± 4.53.87 ± 1.5
EFAl2979.58 ± 1538.41558.3 ± 623.12126.24 ± 889.95666.13 ± 1531.0
Fe306.83 ± 228.970.11 ± 24.2215.76 ± 122.1523.02 ± 153.7
Publisher’s Note: MDPI stays neutral with regard to jurisdictional claims in published maps and institutional affiliations.

