Article

Warm–Wet Climate Trend Enhances Net Primary Production of the Main Ecosystems in China during 2000–2021

1
State Key Laboratory of Severe Weather (LASW), Chinese Academy of Meteorological Science, Beijing 100081, China
2
School of Earth Science and Technology, Zhengzhou University, Zhengzhou 450001, China
3
Aerospace Information Research Institute, Chinese Academy of Sciences, Beijing 100094, China
4
College of Materials and Chemical Engineering, West Anhui University, Lu’an 237012, China
*
Authors to whom correspondence should be addressed.
Atmosphere 2022, 13(5), 738; https://doi.org/10.3390/atmos13050738
Submission received: 9 April 2022 / Revised: 1 May 2022 / Accepted: 4 May 2022 / Published: 5 May 2022

Abstract

:
A significant greening trend has been reported globally in recent decades. The greening indicates the improvement in net primary production (NPP) in vegetation. Adopting statistics-based regression models, we investigated the dynamics of NPP and its climatic drivers in main ecosystems (forest land, grass land, and unused land) over China during the period 2000–2021. The results confirmed an increasing NPP covering approximately 86% area in the main ecosystems. NPP exhibited an increase rate of 6.11 g C m−2 yr−1 in forest land, 4.77 g C m−2 yr−1 in grass land, and 1.25 g C m−2 yr−1 in unused land, respectively. Over the same period, warm–wet climate trend was observed covering approximately 90% of the main ecosystems. The warm–wet climate has had a positive effect rather than negative effect on NPP in the main ecosystems, judging by their significant positive correlation. Our results suggested that the increase in annual precipitation exerted much more important effect on the increasing NPP. The warm–wet climate trend contributes to the upward trend in NPP, even if variability in NPP might involve the influence of solar radiation, atmospheric aerosols, CO2 fertilization, nitrogen deposition, human intervention, etc.

1. Introduction

Most of the areas in terrestrial ecosystems exhibited increasing vegetation greenness based on satellite data in past decades. In China, the greening trend is very evident [1,2,3,4], and has been confirmed at regional and national scales [5,6], even though urban sprawl enhances local browning [7]. It is well known that the increasing vegetation greenness was accordant with the increase in net primary production (NPP). In China, a significant increase in NPP was discovered between 1982 and 2010 using the Carnegie–Ames–Stanford approach (CASA) [8]. However, there lacks the detailed information on how NPP changed in the main ecosystems in recent years.
The large-scale ecological conservation and restoration efforts in China provided basic conditions for the increase in NPP [9,10]. Some ecological restoration programs have been implemented in China since the 1980s. For example, the Three-North Shelter Forest Program was the largest afforestation program in the world (covering an area of 406.9 × 10⁴ km2). Vast man-made forests were established, covering 46.1 × 10⁶ ha based on official statistics [10]. The Grain for Green Program, launched in 1999, was the largest ecological restoration program in the world (covering 2279 counties and 25 provinces in China), causing forest coverage area to increase by 3.5% in the implementation area in the first phase from 1999 to 2012 [11,12]. Therefore, large-scale ecological restoration programs led to a positive effect on the main ecosystems [13,14,15,16]. Thus, human impacts on ecosystems played an important role [17].
It is generally accepted that ecosystems are very sensitive to climate change. However, climate change has been regarded as harmful for NPP in terrestrial ecosystems, because people are focused on the increasing climate risks [18,19,20,21]. An Intergovernmental Panel on Climate Change (IPCC) special report (Special Report on Global Warming of 1.5 °C) highlights that global warming would cause severe consequences for the natural environment. However, these understandings are one-sided because the beneficial effect of climate change on ecosystems is ignored. It is needed to clarify whether climate change contributes to the improvement in the main ecosystems in China.
This paper examined the long-term dynamics of NPP and its response to climate change in the main ecosystems over China, using satellite-derived data and observed data during the period 2000–2021. The main aims are to provide credible evidence for understanding the impacts of climate change on the dynamics of NPP, which will be important for developing adaptation strategies to deal with climate change.

2. Materials and Methods

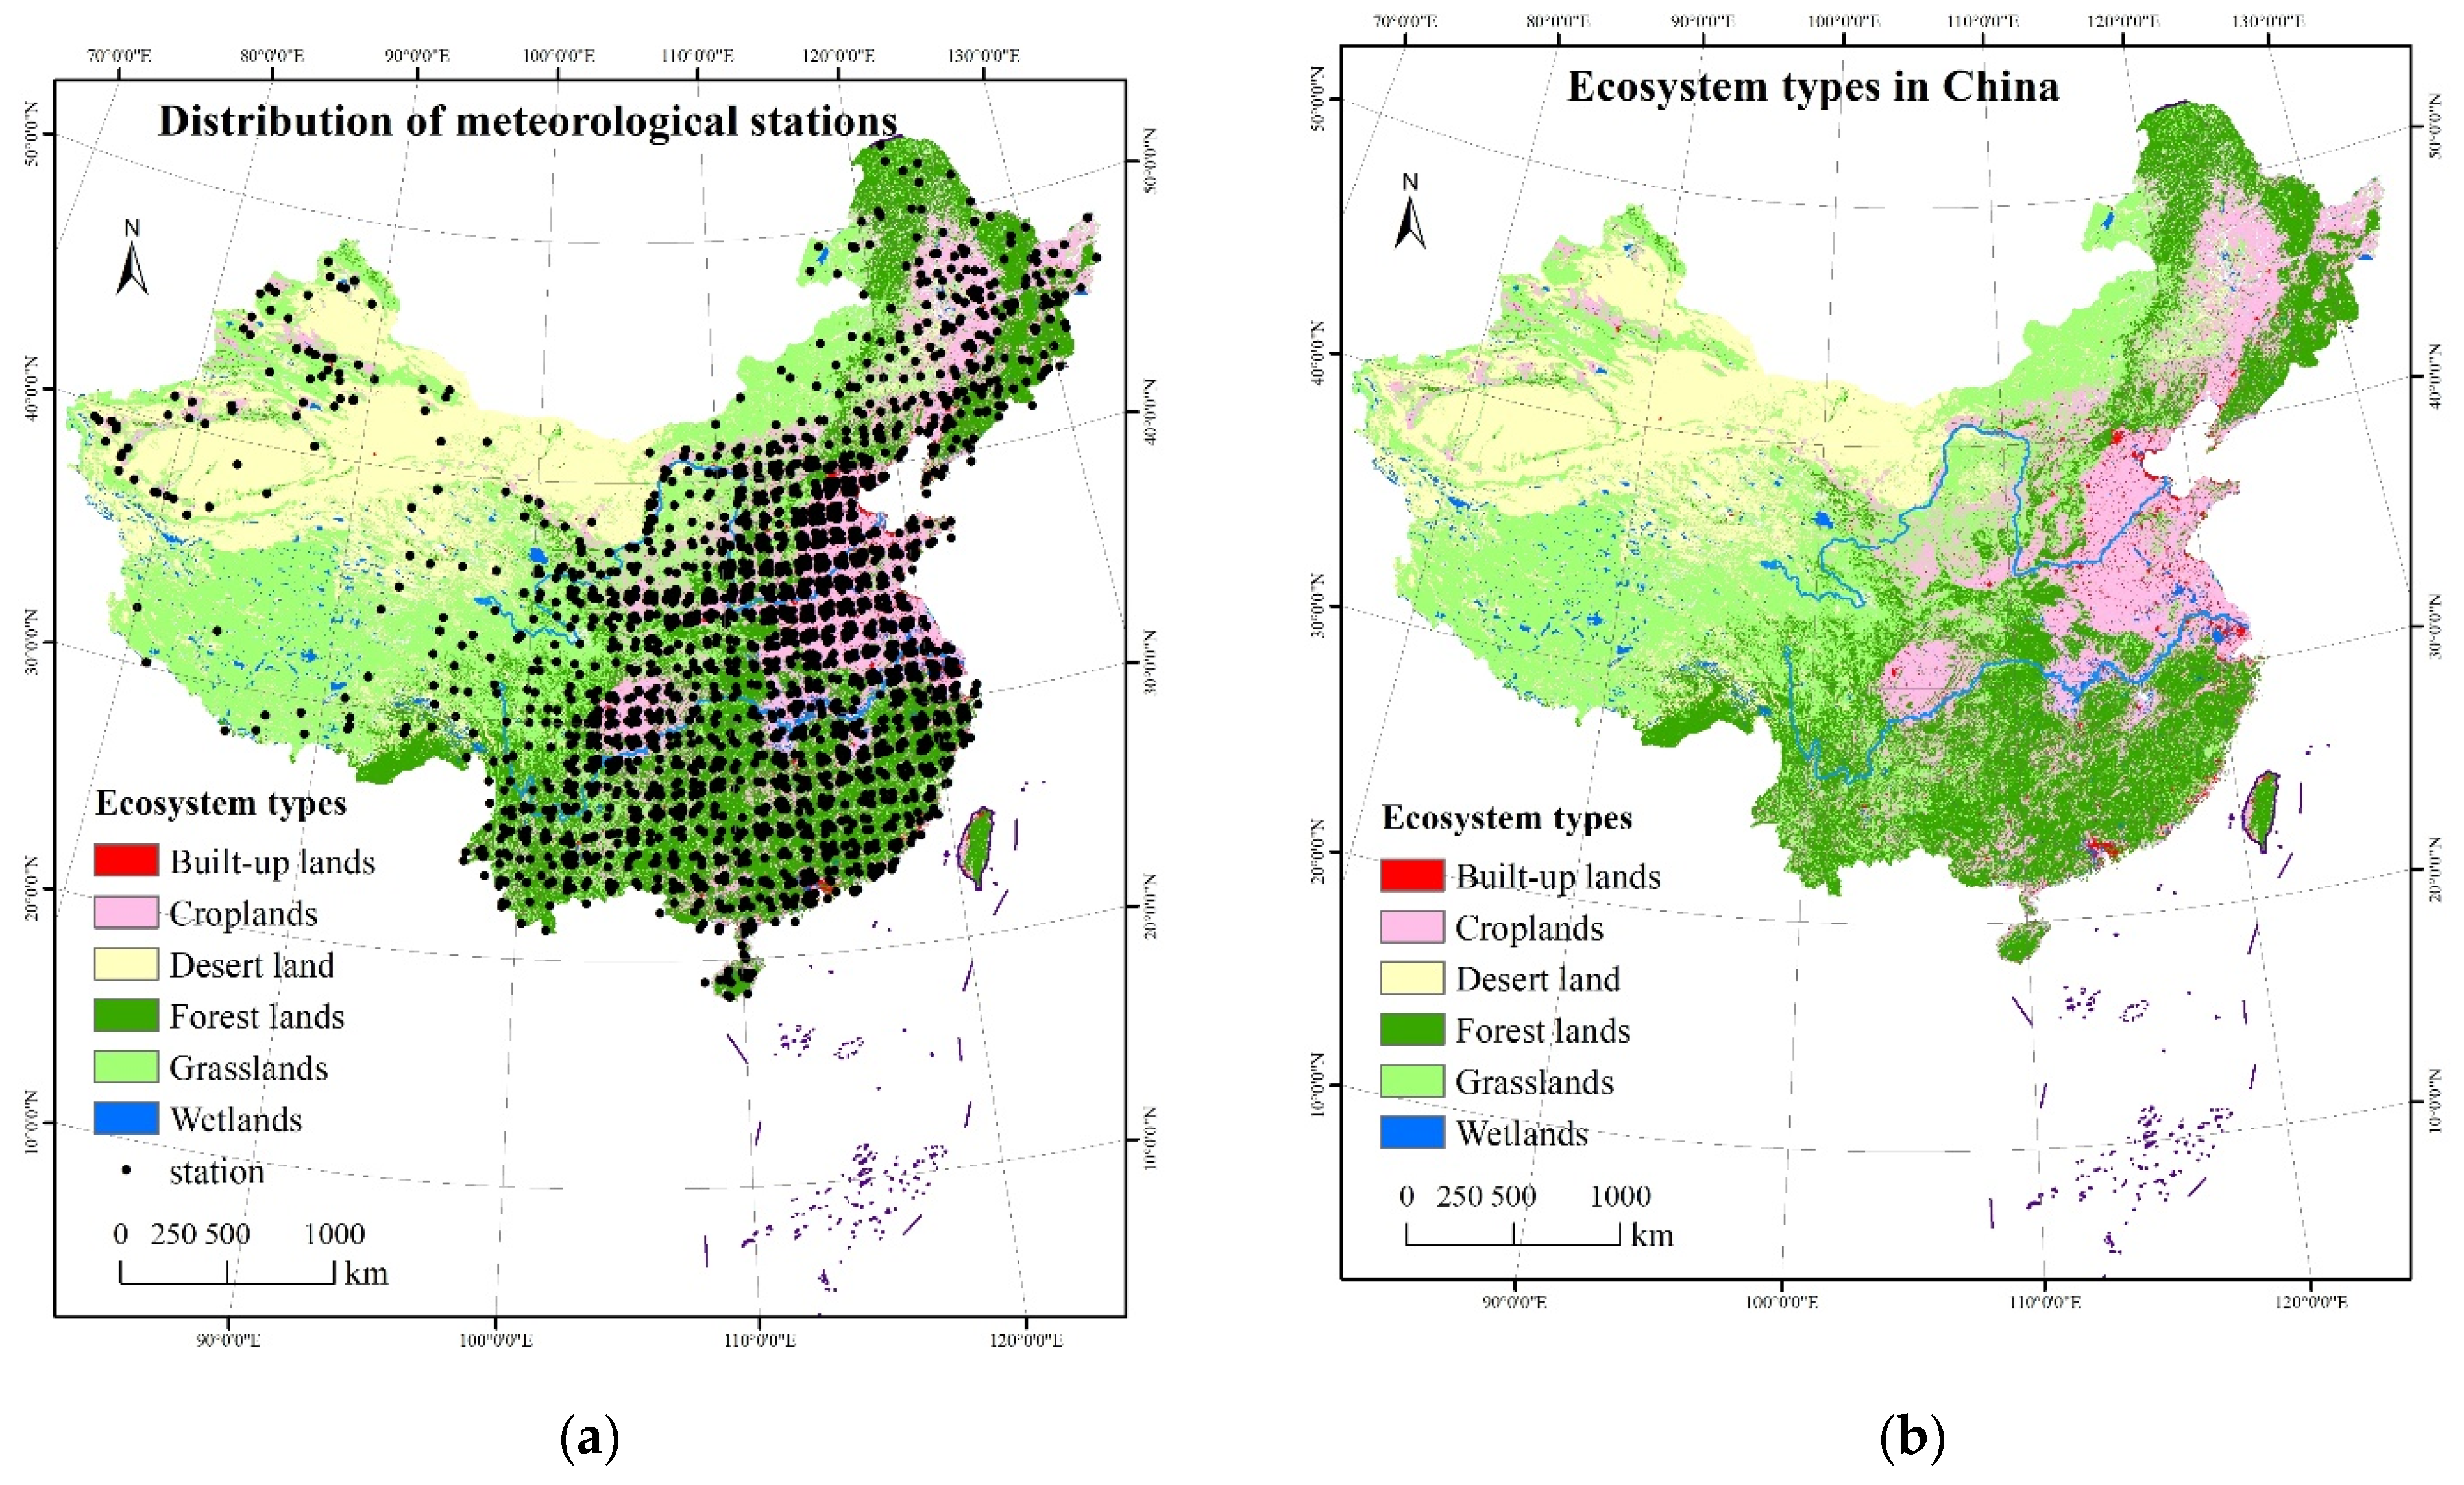
2.1. Data Processing

The datasets used in this study consist of time-series normalized difference vegetation index (NDVI), annual temperature, precipitation, land use/land cover over the period 2000–2021. Time-series data allowed us to examine the change trend in NPP and its driver factors. Climate data came from Meteorology Information Center of the Chinese National Bureau of Meteorology, Beijing (http://data.cma.cn/data/cdcindex.html, accessed on 8 April 2022). Climate data, including annual precipitation and annual air temperature from 2150 national meteorological stations (Figure 1a), were interpolated into grid cells with a spatial resolution of 1 km × 1 km.
NDVI derived from the 16-day spatial resolution 1 km × 1 km grid products of NASA’s moderate resolution imaging spectroradiometer (MODIS) sensors. To minimize the influence of noise (e.g., cloud, aerosols, solar elevation angle, ice and snow cover), the annual maximal NDVI in each grid cell was extracted from the time-series NDVI using the maximum value composite method.
To maintain the same spatial resolution, all climate data were interpolated into grid cells with a spatial resolution of 1 km × 1 km. Digital elevation model (DEM) with a spatial resolution of 90 m × 90 m was resampled into a spatial resolution of 1 km × 1 km.
The main ecosystems derived from the distribution map of land use types in 2010s, which was obtained from data center of resources and environment science, Chinese Academy of Sciences. The main ecosystems were mainly composed of forest land, grass land, and unused land (desert and bare land with sparse vegetation) (Figure 1b).

2.2. NPP Calculation

Models suitable for region conditions were used to acquire NPP, which is expressed as how much carbon is fixed per square meter in a year (g C m−2 yr−1). Fresh grass yield in grass land and unused land was obtained using the models of Xu et al., (2007) [22]. The models included six different statistical models for the six regions in China (Table 1), with higher precision. Fresh grass yield (t DM ha−1yr−1, DM is dry matter) was obtained from these models, then converted to dry grass yield using a dry–wet ratio coefficient of 0.31 [23], and then dry grass yield was converted into NPP (g C m−2 yr−1) using a conversion coefficient of 0.5 [24].
NPP in forests was calculated by adopting a statistics-based multiple regression model suitable for forests (Equation (1)) [25]. The multiple regression model was established using the long-term observations of annual NPP, NDVI, elevation, and average precipitation and temperature at approximately 1000 inventory sites in forest ecosystems. The accuracy of the model was checked with a fitting coefficient of R2 = 0.536 (p < 0.01), which indicated good performance in predicting NPP in forests.
N P P = 97.13 N D V I m a x + 0.022 P T + 0.128 P 9.136 T 0.027 A + 333.67
where NPP is NPP (g C m−2 yr−1) in forest, NDVImax is annual maximal NDVI (0 < NDVI ≤ 1), P is annual precipitation (mm), T is annual temperature (°C), and A is elevation (m).

2.3. Change Analysis

A pixel-based (1 km × 1 km grid cell) variable linear regression analysis method was performed to obtain the slope coefficients of the regression trend line for annual temperature, annual precipitation, annual NPP. The slope coefficient of the regression indicates increase or decrease trend for each pixel. If slope > 0, the variation in the environment variable exhibits an increasing trend, whereas if slope < 0, the variation in the environment variable exhibits a decreasing trend. The increase rate of NPP is expressed as how much additional carbon per square meter in a year (g C m−2 yr−1).

3. Results

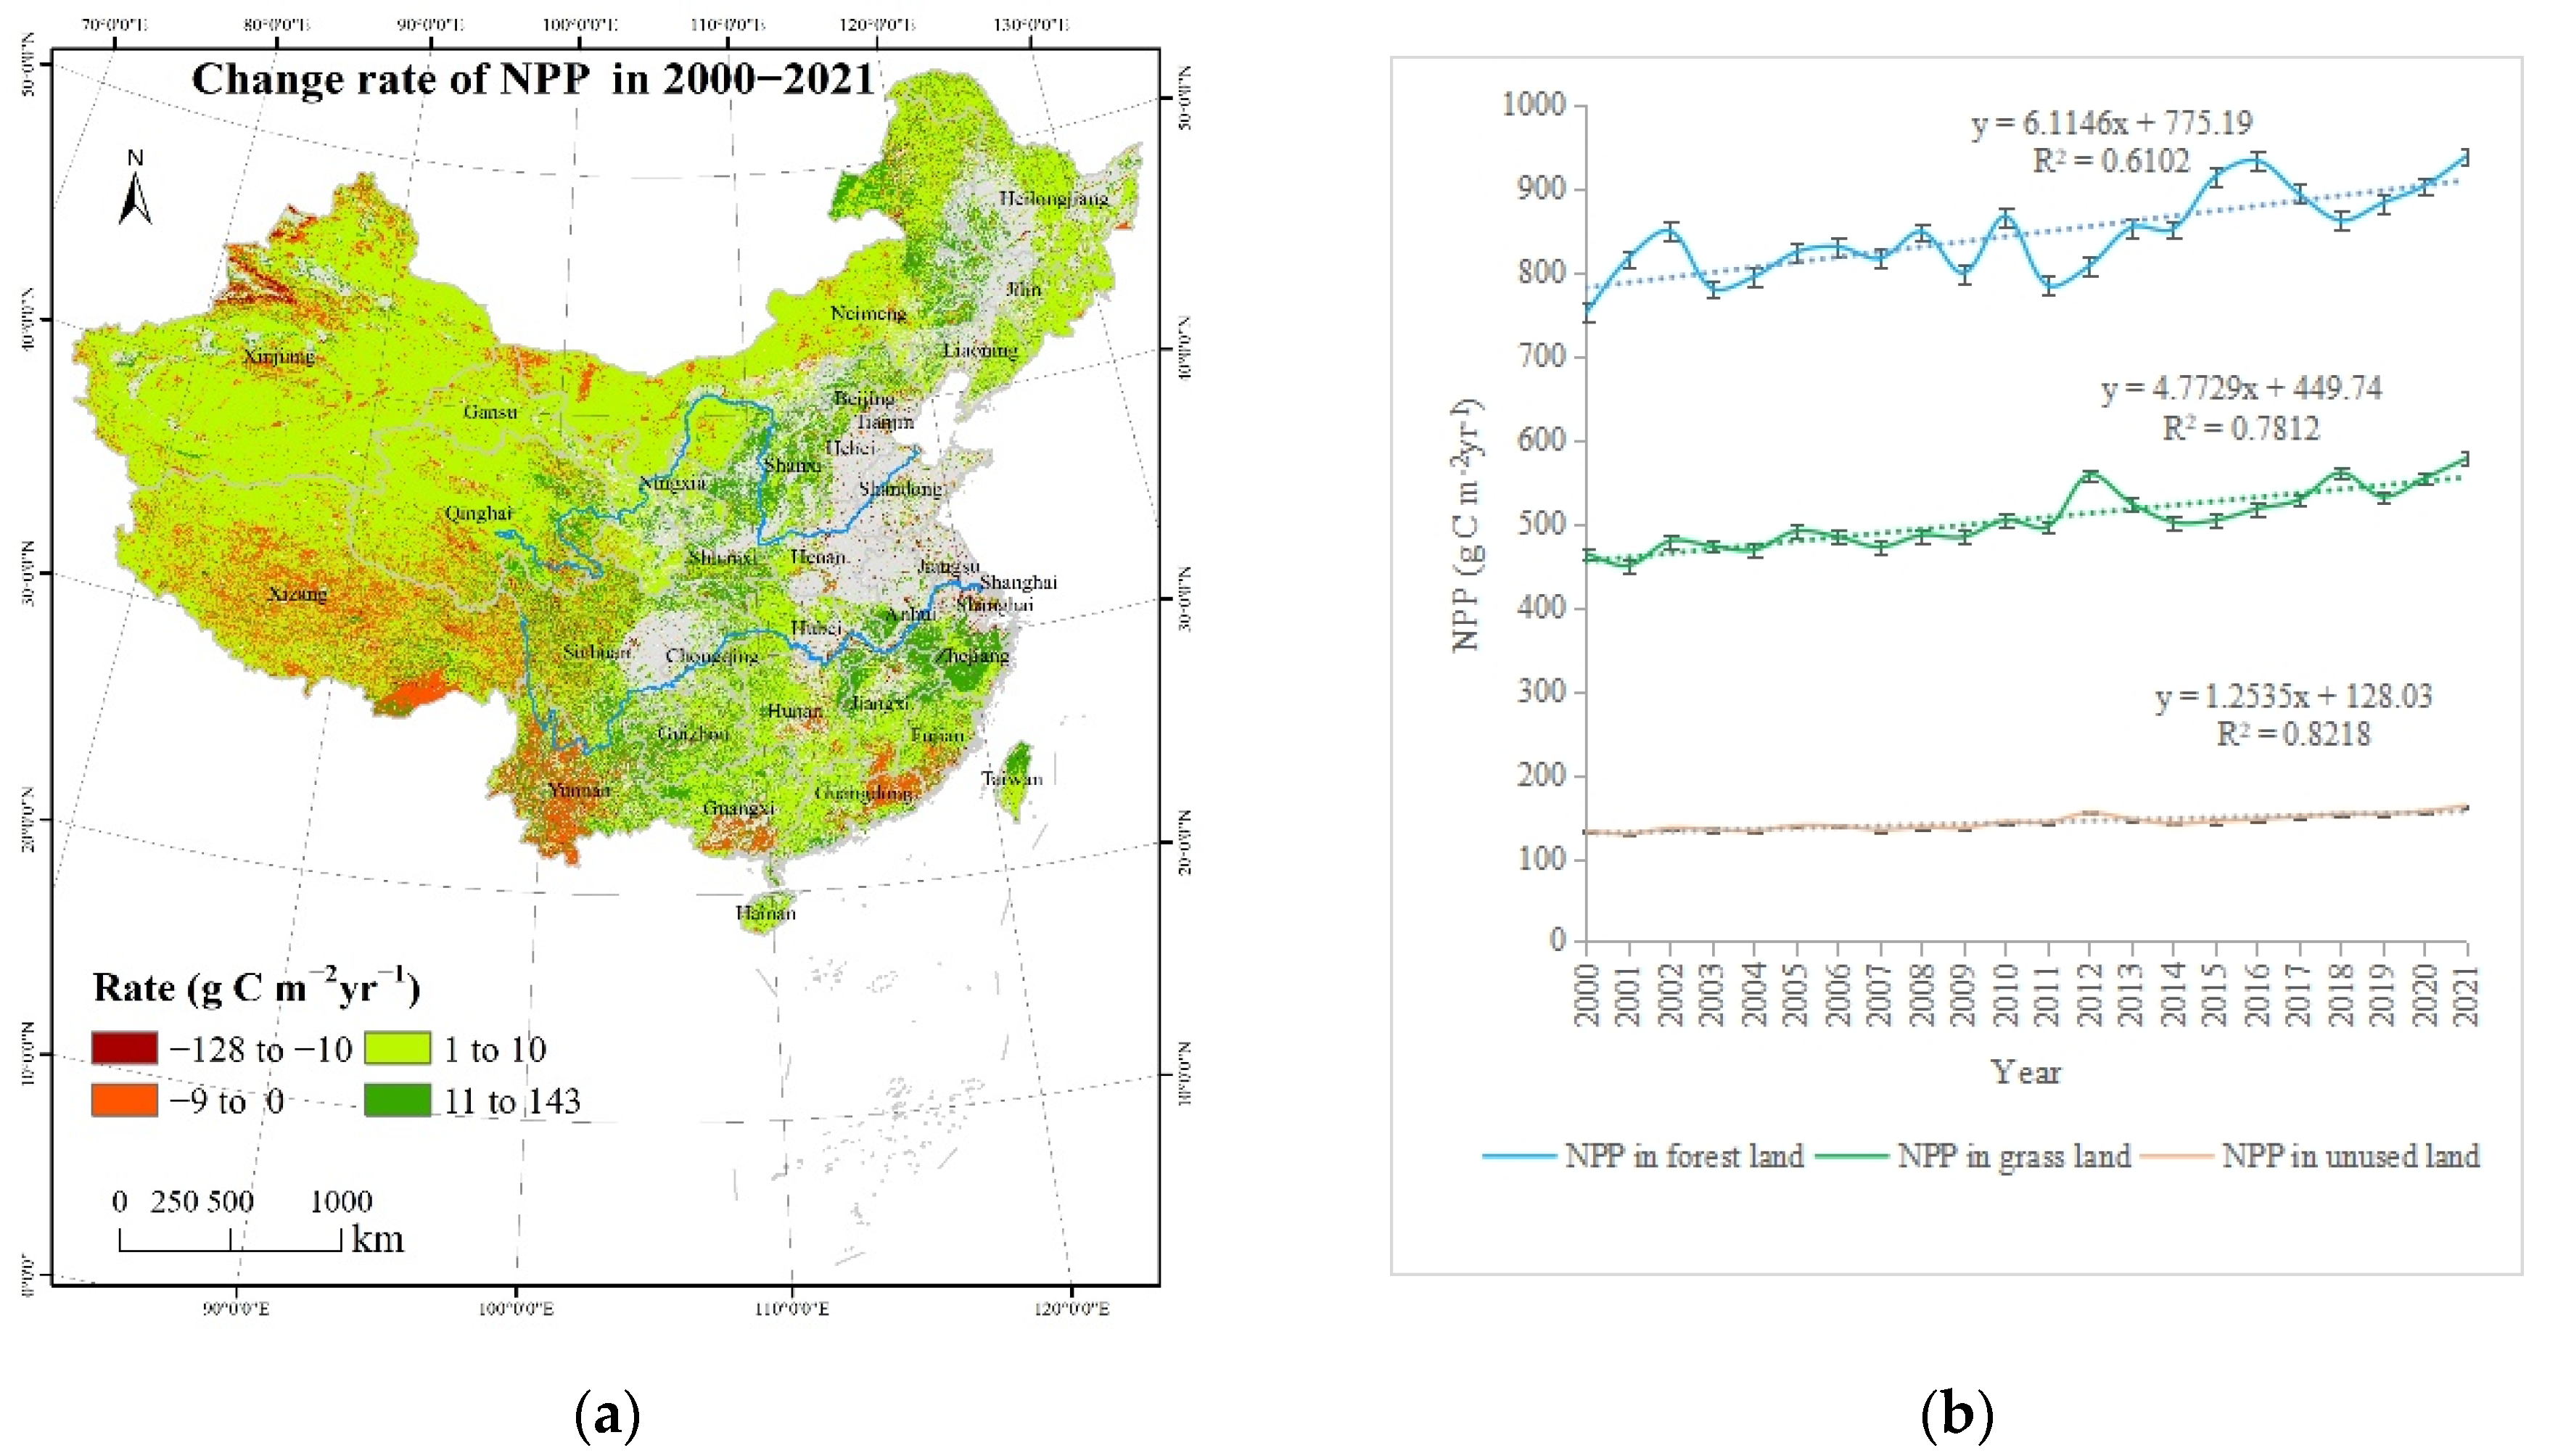
3.1. A Rapid Increase in NPP

The main ecosystems in China exhibited an obvious increase in NPP during the period 2000–2021. Approximately 86% area of the main ecosystems experienced a significant increase in NPP. The higher increase rate occurred in central and eastern China, where the increase rate of NPP was more than 10 g C m−2 yr−1 (Figure 2a).
Forest land had the highest NPP with an average of 845.5 ± 50.8 g C m−2 yr−1 over the period 2000–2021. NPP in forest land exhibited a noticeable increase rate of 6.11 g C m−2 yr−1 in spite of short-term fluctuations. Grass land had the higher NPP with an average 504.6 ± 30.1 g C m−2 yr−1 over the period 2000–2021. NPP in grass land exhibited an increase rate of 4.77 g C m−2 yr−1. Unused land had the smaller NPP with an average 142.4 ± 9.0 g C m−2 yr−1 over the period 2000−2021, and NPP in unused land exhibited a smaller increase rate of 1.25 g C m−2 yr−1 (Figure 2b).

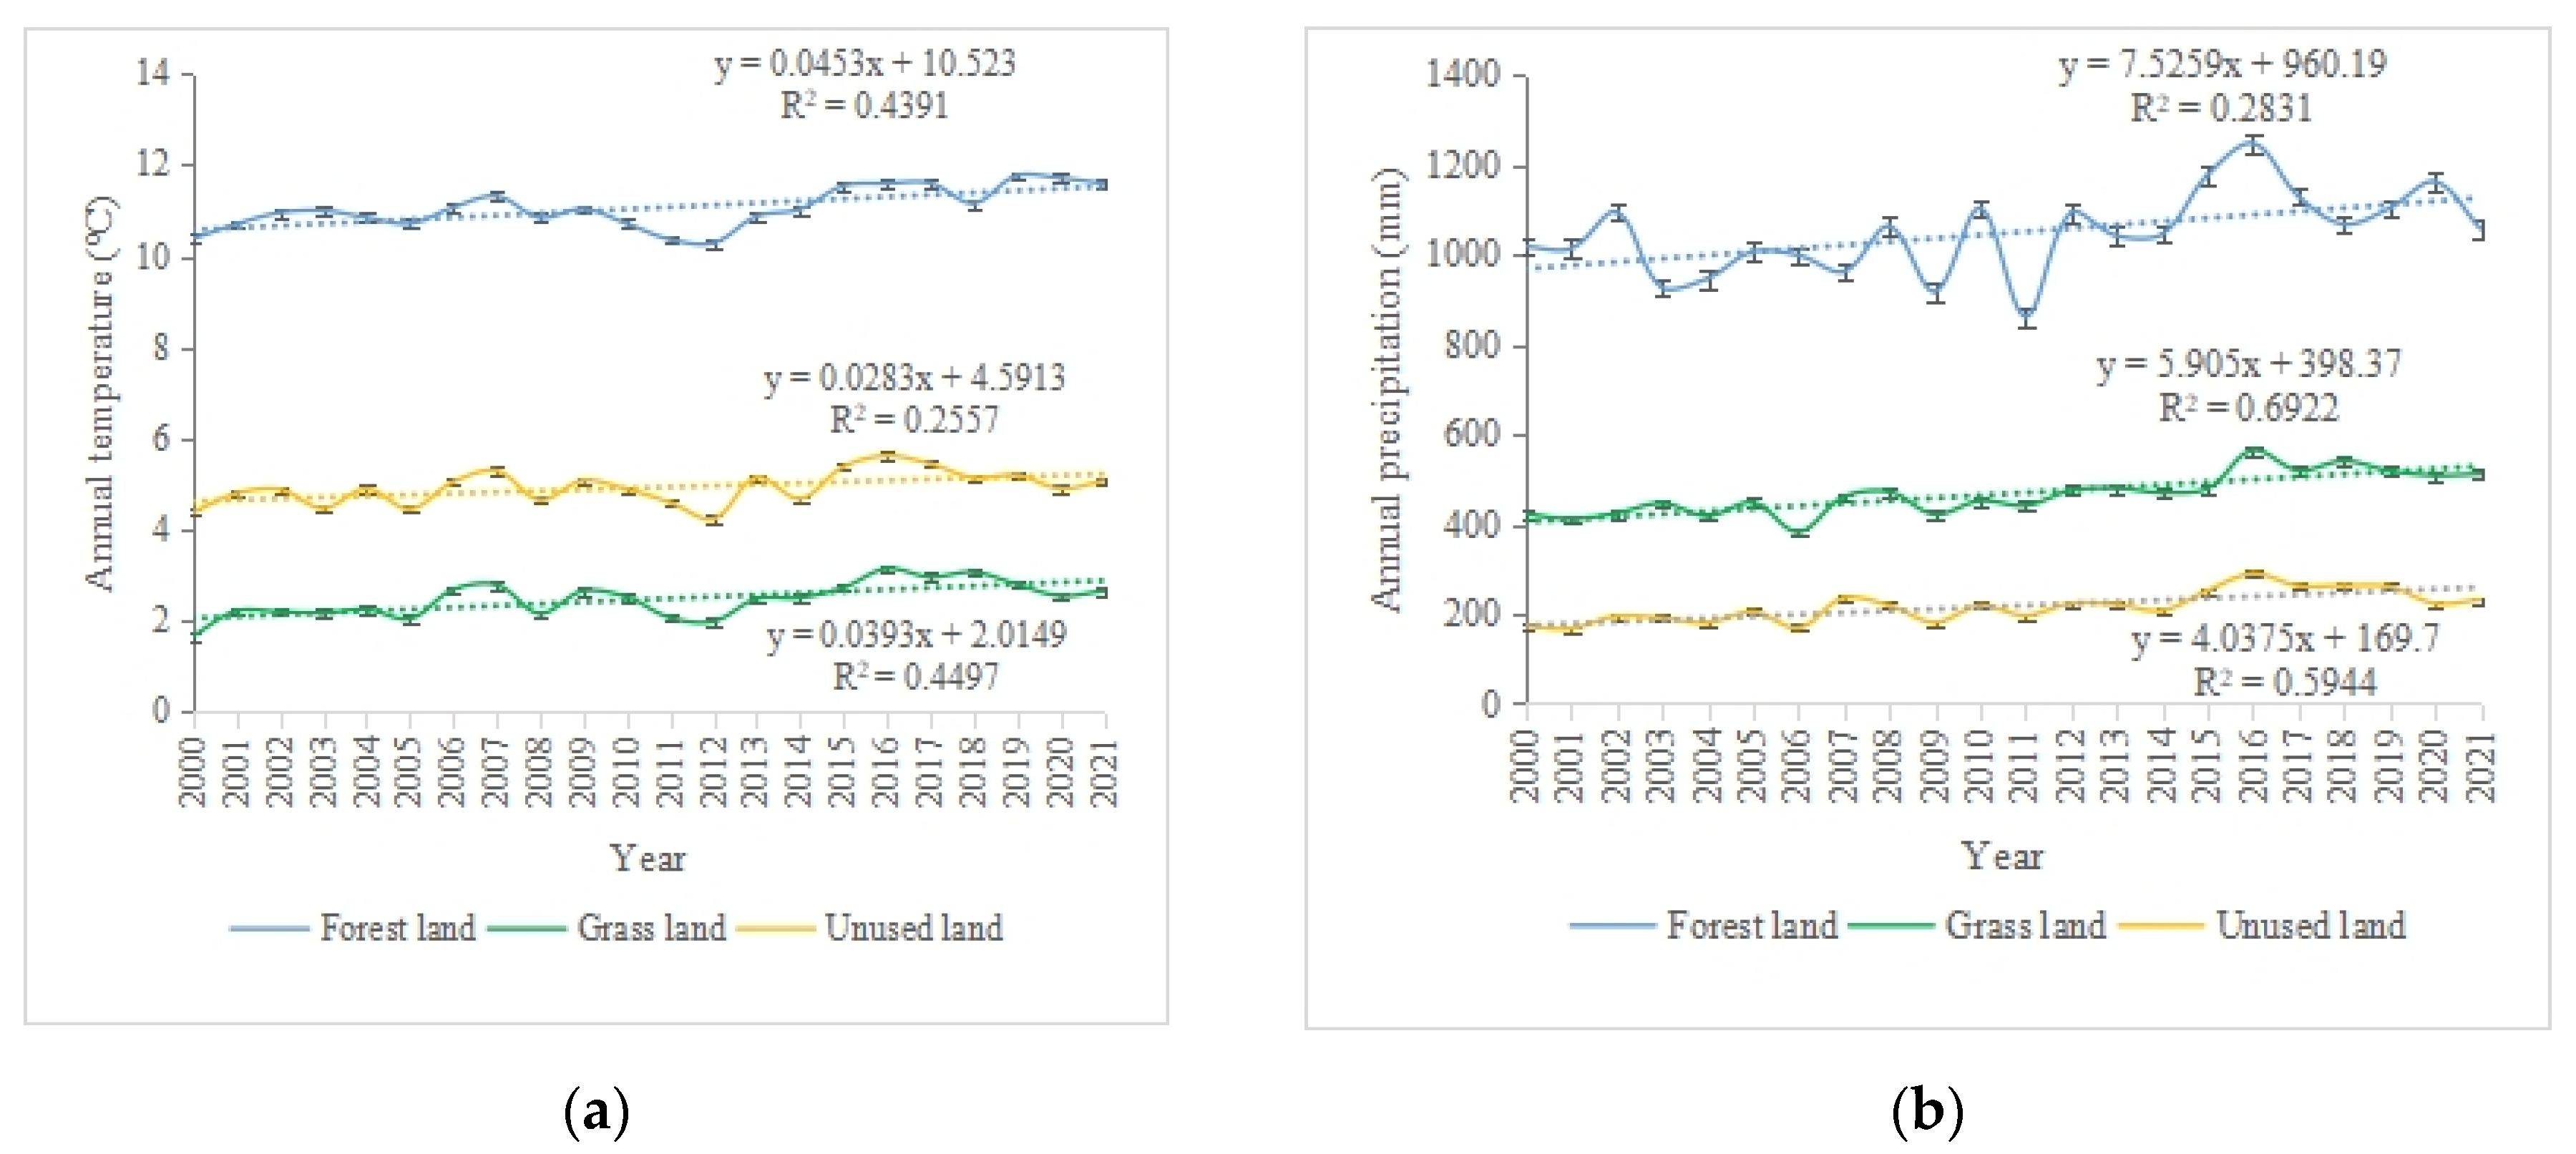
3.2. Warm–Wet Climate Trend

It was reported that the average annual precipitation across China significantly increased at rates of 11.4 mm/decade during 1961–2016 [26]. Our results also confirmed a trend towards a warm–wet climate over China during the period 2000–2021. Significant increases in temperature occupied 92% of the main ecosystems in China (p < 0.01) (Figure 3a). Warming rate in most ecosystems was larger than 0.2 °C per decade (the global warming rate was 0.2 °C per decade by the reports from IPCC 2018 [27]). Generally, there was an average warming rate of 0.453 ± 0.001 °C, 0.393 ± 0.037 °C, and 0.283 ± 0.006 °C per decade in forest land, grassland, and unused land, respectively (Figure 4a).
Approximately 90% of the main ecosystems exhibited an obvious increasing precipitation (p < 0.01) during the period 2000–2021, with an upward range of 0~52 mm yr−1. A significant increase in precipitation occurred especially in eastern and central China with an increase rate of 10~52 mm yr−1. Only 10% of the main ecosystems exhibited decreasing precipitation, with a decrease rate of −23~0 mm yr−1 over the same period (Figure 3b). Generally, the average increase rate in precipitation was 7.5 ± 2.9 mm yr−1, 5.9 ± 2.1 mm yr−1, and 4.0 ± 0.5 mm yr−1 in forest land, grassland, and unused land, respectively (Figure 4b).

3.3. Effect of Warm–Wet Climate on NPP

NPP is highly sensitive to climate changes. Our results confirmed that the increasing NPP was accompanied by a warm–wet climate trend in the main ecosystems during the period 2000–2021 (Figure 2a and Figure 3a,b). A significant increase in precipitation occurred in eastern and central China, where a significant increase in NPP also occurred over the same period (Figure 2a and Figure 3b). The long-term increase trends in NPP, precipitation, and temperature were similar, although their fluctuation curves did not match exactly (Figure 2b and Figure 4a,b). These co-occurring trends in NPP, precipitation, and temperature indicated a high possibility that the warm–wet climate trend had promoted the increase in NPP.
Pearson’s correlation, Spearman’s rho correlation, and Kendall’s tau-b correlation were used to examine the impact of climate change on vegetation dynamics. The results revealed a significant positive correlation between annual precipitation and NPP, with Pearson’s correlation coefficients of 0.797 (p < 0.01) in forest land, 0.756 (p < 0.01) in grass land, and 0.654 (p < 0.01) in unused land. A more significant positive correlation between annual precipitation and NPP was uncovered by Spearman’s rho correlation, with correlation coefficients of 0.810 (p < 0.01) in forest land, 0.834 (p < 0.01) in grass land, and 0.739 (p < 0.01) in unused land. Kendall’s tau-b correlation also confirmed a significant positive correlation between annual precipitation and NPP, with correlation coefficients of 0.662 (p < 0.01) in forest land, 0.619 (p < 0.01) in grass land, and 0.576 (p < 0.01) in unused land (Table 2).
A significant positive correlation between annual air temperature and NPP was also uncovered in forest land. There were Pearson’s correlation coefficients of 0.788 (p < 0.01), Spearman’s rho correlation coefficients of 0.715 (p < 0.01), and Kendall’s tau-b correlation coefficients of 0.506 (p < 0.01). However, there was a slight positive correlation between annual air temperature and NPP in grass land, with Pearson’s correlation coefficients of 0.434 (p < 0.05), Spearman’s rho correlation coefficients of 0.415 (p < 0.05), and Kendall’s tau-b correlation coefficients of 0.281(p < 0.05). A not very significant correlation was uncovered between air temperature and NPP in unused land (Table 2).
Judging by the significant positive correlations, the warm–wet climate trend has a positive effect on vegetation improvement. Increase in annual precipitation rather than the increase in air temperature exerted more effects on NPP, judging by the size of significant correlation coefficients. Therefore, warm–wet climate as an important climate driver benefits the increase in NPP in the main ecosystems over China, even if variability in NPP might involve the influence of solar radiation, atmospheric aerosols, CO2 fertilization, nitrogen deposition, human intervention, etc. [28].

4. Discussion

The IPCC special report worried about the severe consequences from climate change [29], but our results confirmed an evidenced increase in NPP in the main ecosystems over the period 2000–2021, which was quite accordant with the increase in greenness [8]. Although there was an increasing number of extreme climate events [21], the extreme climate events did not stop the long-term improvement in NPP, but only led to short-term fluctuation during the period 2000–2021. The noticeable increase in NPP in the main ecosystems provided evidence that the main ecosystems maintained a continuous improvement, and climate change did not lead to catastrophic consequences for natural ecosystems ultimately.
Our results revealed the warm–wet climate trend was accompanied by an increase in NPP. Correlation analysis confirmed a positive correlation between annual precipitation and NPP, and between air temperature and NPP in the main ecosystems. Our results agreed with previous studies. It was reported that inter-annual variability in NPP exhibits strong positive coherence with the variability in precipitation, and weak coherence with the variability in temperature in India [30]. NPP increased with the increase in temperature and precipitation in the Shiyang River Basin in China [31]. All the evidence indicated that climate change in precipitation and temperature were the major natural forces in promoting the improvement in NPP. The warm–wet climate trend might allow vegetation to flourish, and result in the increasing NPP, although the mechanism of their interaction is unclear.
Even if climate change was the major natural force in promoting the improvement in NPP, it is quite unreasonable to say that the increase in NPP is exclusively the consequence of the warmer–wetter climate trend. Conservation and restoration efforts from humans played an important role in the improvement in NPP. China has been looking forward to achieving “ecological civilization”. The implementation of large-scale ecological restoration programs, such as Three-North Shelter Forest Program, Grain to Green Program, Natural Forest Conservation Program, etc., have resulted in vast-area man-made forests being established, and the ecological environment has received the most extent of protection [16,32]. The long-term conservation and restoration efforts in China have contributed to a human-induced increase in NPP. For example, the NPP in China forests exhibited a significant increase from 45.12 Tg C in 2000 to 46.03 Tg C in 2010 due to the implementation of large-scale ecological restoration programs [33]. The Three-North Afforestation Program led to increasing biomass carbon storage; aerosols can also affect the primary productivity by affecting the photosynthesis [28]. Anthropogenic aerosols in North China increases primary productivity of the shaded leaves but reduces primary productivity of the sunlit leaves [34]. Thus, the observed improvement in NPP cannot be simply attributed to climatic force. We agreed with previous reports that vegetation improvement should be attributed to the combined effects of climate change and human activity [5].
However, the increase in NPP might suffer from multiple physical and biological drivers. Some factors such as changes in soil moisture conditions, atmospheric CO2 concentration, nitrogen deposition, as well as agricultural and land use polices may also affect the improvement in NPP [35,36].

5. Conclusions

Our results highlighted that the warm–wet climate trend enhances NPP in the main ecosystems. It is helpful for understanding the impact of climate change on ecosystems. NPP exhibited a noticeable increase covering approximately 86% area in the main ecosystems of China during the period 2000–2021. There was an average increase rate of 6.11 g C m−2 yr−1 in forest land, 4.77 g C m−2 yr−1 in grass land, and 1.25 g C m−2 yr−1 in unused land, respectively. Over the same period, warm–wet climate trend was observed covering approximately 90% of the main ecosystems. The warm–wet climate has had a positive effect rather than negative effect on NPP in the main ecosystems over China. The increase in annual precipitation exerted much more important effect on the increasing NPP. Although people are worried that climate change might cause catastrophic consequences to ecosystems, our results suggested that climate change did not result in a catastrophic collapse of ecosystems in China, but led to an improvement trend.

Author Contributions

Writing and original draft preparation, Y.J.; Conceptualization, G.Z. and J.Z.; Processed raw data, S.W. All authors have read and agreed to the published version of the manuscript.

Funding

This research was funded jointly by the Second Tibetan Plateau Comprehensive Research Project (2019QZKK0106), National Natural Science Foundation of China (42141007), Fundamental Research Funds of the Chinese Academy of Meteorological Sciences (2020Z004), and Inner Mongolia Autonomous Region Science and Technology Achievement Transformation Special Fund Project (2021CG0045).

Institutional Review Board Statement

Not applicable.

Informed Consent Statement

Not applicable.

Data Availability Statement

Climate data came from the Meteorology Information Center of the Chinese National Bureau of Meteorology (http://data.cma.cn/data/cdcindex.html, accessed on 8 April 2022). Normalized Difference Vegetation Index (NDVI) derived from NASA’s Moderate Resolution Imaging Spectroradiometer (MODIS) sensors.

Acknowledgments

The authors appreciate the insightful comments of two anonymous reviewers.

Conflicts of Interest

The authors declare no conflict of interest.

References

  1. Piao, S.; Yin, G.; Tan, J.; Cheng, L.; Huang, M.; Li, Y.; Liu, R.; Mao, J.; Myneni, R.B.; Peng, S.; et al. Detection and attribution of vegetation greening trend in China over the last 30 years. Glob. Chang. Biol. 2015, 21, 1601–1609. [Google Scholar] [CrossRef] [PubMed]
  2. Pan, N.; Feng, X.; Fu, B.; Wang, S.; Ji, F.; Pan, S. Increasing global vegetation browning hidden in overall vegetation greening: Insights from time-varying trends. Remote Sens. Environ. 2018, 214, 59–72. [Google Scholar] [CrossRef]
  3. Macias-Fauria, M. Satellite images show China going green. Nature 2018, 553, 411–413. [Google Scholar] [CrossRef] [PubMed] [Green Version]
  4. Chen, C.; Park, T.; Wang, X.; Piao, S.; Xu, B.; Chaturvedi, R.K.; Fuchs, R.; Brovkin, V.; Ciais, P.; Fensholt, R.; et al. China and India lead in greening of the world through land-use management. Nat. Sustain. 2019, 2, 122–129. [Google Scholar] [CrossRef]
  5. Zheng, K.; Wei, J.-Z.; Pei, J.-Y.; Cheng, H.; Zhang, X.-L.; Huang, F.-Q.; Li, F.-M.; Ye, J.-S. Impacts of climate change and human activities on grassland vegetation variation in the Chinese Loess Plateau. Sci. Total Environ. 2019, 660, 236–244. [Google Scholar] [CrossRef]
  6. Qian, C.; Shao, L.; Hou, X.; Zhang, B.; Chen, W.; Xia, X. Detection and attribution of vegetation greening trend across distinct local landscapes under China’s Grain to Green Program: A case study in Shaanxi Province. Catena 2019, 183, 104182. [Google Scholar] [CrossRef]
  7. Han, L.; Zhang, X.; Zhou, W.; Shen, M.; Huang, Y.; Li, W.; Qian, Y. Transformation of China’s urbanization and eco-environment dynamics: An insight with location-based population-weighted indicators. Environ. Sci. Pollut. Res. 2021, 28, 16558–16567. [Google Scholar] [CrossRef]
  8. Liang, W.; Yang, Y.; Fan, D.; Guan, H.; Zhang, T.; Long, D.; Zhou, Y.; Bai, D. Analysis of spatial and temporal patterns of net primary production and their climate controls in China from 1982 to 2010. Agric. For. Meteorol. 2015, 204, 22–36. [Google Scholar] [CrossRef]
  9. Lü, Y.; Zhang, L.; Feng, X.; Zeng, Y.; Fu, B.; Yao, X.; Li, J.; Wu, B. Recent ecological transitions in China: Greening, browning and influential factors. Sci. Rep. 2015, 5, 8732. [Google Scholar] [CrossRef]
  10. Zhu, J.J.; Zheng, X. The prospects of development of the Three-North Afforestation Program (TNAP): On the basis of the results of the 40-year construction general assessment of the TNAP. Chin. J. Ecol. 2019, 38, 1600–1610. [Google Scholar]
  11. Wang, B.; Gao, P.; Niu, X.; Sun, J. Policy-driven China’s Grain to Green Program: Implications for ecosystem services. Ecosyst. Serv. 2017, 27, 38–47. [Google Scholar] [CrossRef]
  12. Delang, C.O. The Second Phase of the Grain for Green Program: Adapting the Largest Reforestation Program in the World to the New Conditions in Rural China. Environ. Manag. 2019, 64, 303–312. [Google Scholar] [CrossRef]
  13. Feng, X.; Fu, B.; Lu, N.; Zeng, Y.; Wu, B. How ecological restoration alters ecosystem services: An analysis of carbon sequestration in China’s Loess Plateau. Sci. Rep. 2013, 3, 2846. [Google Scholar] [CrossRef] [PubMed]
  14. Zhao, A.; Zhang, A.; Lu, C.; Wang, D.; Wang, H.; Liu, H. Spatiotemporal variation of vegetation coverage before and after implementation of Grain for Green Program in Loess Plateau, China. Ecol. Eng. 2017, 104, 13–22. [Google Scholar] [CrossRef]
  15. Wang, H.; Liu, G.; Li, Z.; Ye, X.; Fu, B.; Lv, Y. Impacts of Drought and Human Activity on Vegetation Growth in the Grain for Green Program Region, China. Chin. Geogr. Sci. 2018, 28, 470–481. [Google Scholar] [CrossRef] [Green Version]
  16. Li, G.; Sun, S.B.; Han, J.C.; Yan, J.W.; Liu, W.B.; Wei, Y.; Lu, N.; Sun, Y.Y. Impacts of Chinese Grain for Green program and climate change on vegetation in the Loess Plateau during 1982–2015. Sci. Total Environ. 2019, 660, 177–187. [Google Scholar] [CrossRef] [PubMed]
  17. Mao, J.; Ribes, A.; Yan, B.; Shi, X.; Thornton, P.E.; Séférian, R.; Ciais, P.; Myneni, R.; Douville, H.; Piao, S.; et al. Human-induced greening of the northern extratropical land surface. Nat. Clim. Chang. 2016, 6, 959–963. [Google Scholar] [CrossRef]
  18. Lenton, T.M. Early warning of climate tipping points. Nat. Clim. Chang. 2011, 1, 201–209. [Google Scholar] [CrossRef]
  19. Watson, J.; Iwamura, T.; Butt, N. Mapping vulnerability and conservation adaptation strategies under climate change. Nat. Clim. Chang. 2013, 3, 989–994. [Google Scholar] [CrossRef]
  20. O’Neill, B.C.; Oppenheimer, M.; Warren, R.; Hallegatte, S.; Kopp, R.E.; Pörtner, H.O.; Scholes, R.; Birkmann, J.; Foden, W.; Licker, R.; et al. IPCC reasons for concern regarding climate change risks. Nat. Clim. Chang. 2017, 7, 28–37. [Google Scholar] [CrossRef] [Green Version]
  21. Xu, C.; McDowell, N.G.; Fisher, R.A.; Wei, L.; Sevanto, S.; Christoffersen, B.O.; Weng, E.; Middleton, R.S. Increasing impacts of extreme droughts on vegetation productivity under climate change. Nat. Clim. Chang. 2019, 9, 948–953. [Google Scholar] [CrossRef] [Green Version]
  22. Xu, B.; Yang, X.; Tao, W.; Qin, Z.; Liu, H.; Miao, J. Remote sensing monitoring upon the grass production in China. Acta Ecol. Sin. 2007, 27, 405–413. [Google Scholar] [CrossRef]
  23. Animal Husbandry Vet Bureau of Department of Agriculture P.R.C.; Animal Husbandry Vet Central Station of the China. China Grassland Resources; China Science and Technology Press: Beijing, China, 1996; pp. 353–358. [Google Scholar]
  24. Fang, J.Y.; Guo, Z.D.; Piao, S.L.; Chen, A.P. Estimation of terrestrial vegetation carbon sequestration in China from 1981 to 2000. Chin. Sci. 2007, 37, 804–812. [Google Scholar]
  25. Ji, Y.H.; Zhou, G.S.; Luo, T.X.; Dan, Y.; Zhou, L.; Lv, X.M. Variation of net primary productivity and its drivers in China’s forests during 2000–2018. For. Ecosyst. 2020, 7, 15. [Google Scholar] [CrossRef] [Green Version]
  26. Su, B.; Xiao, C.; Zhao, H.; Huang, Y.; Dou, T.; Wang, X.; Chen, D. Estimated changes in different forms of precipitation (snow, sleet, and rain) across China: 1961–2016. Atmospheric Res. 2022, 270, 106078. [Google Scholar] [CrossRef]
  27. IPCC. Summary for Policymakers. In Global Warming of 1.5 °C; IPCC: Geneva, Switzerland, 2018; pp. 6–7. [Google Scholar]
  28. Hari, M.; Tyagi, B. India’s Greening Trend Seems to Slow Down. What Does Aerosol Have to Do with It? Land 2022, 11, 538. [Google Scholar] [CrossRef]
  29. Ogunbode, C.A.; Doran, R.; Böhm, G. Exposure to the IPCC special report on 1.5 °C global warming is linked to perceived threat and increased concern about climate change. Clim. Chang. 2019, 158, 361–375. [Google Scholar] [CrossRef]
  30. Nayak, R.K.; Patel, N.R.; Dadhwal, V.K. Inter-annual variability and climate control of terrestrial net primary productivity over India. Int. J. Clim. 2013, 33, 132–142. [Google Scholar] [CrossRef]
  31. Zhang, X.L.; Xiao, W.H.; Wang, Y.C.; Wang, Y.; Wang, H.J.; Wang, Y.X.; Zhu, L.S.; Yang, R.X. Spatial-temporal changes in NPP and its relationship with climate factors based on sensitivity analysis in the Shiyang River Basin. J. Earth Syst. Sci. 2020, 129, 24. [Google Scholar] [CrossRef]
  32. Wang, F.; Pan, X.; Gerlein-Safdi, C.; Cao, X.; Wang, S.; Gu, L.; Wang, D.; Lu, Q. Vegetation restoration in Northern China: A contrasted picture. Land Degrad. Dev. 2020, 31, 669–676. [Google Scholar] [CrossRef]
  33. Viña, A.; McConnell, W.J.; Yang, H.; Xu, Z.; Liu, J. Effects of conservation policy on China’s forest recovery. Sci. Adv. 2016, 2, e1500965. [Google Scholar] [CrossRef] [PubMed] [Green Version]
  34. Feng, Y.; Chen, D.; Zhao, X. Impact of aerosols on terrestrial gross primary productivity in North China using an improved boreal ecosystem productivity simulator with satellite-based aerosol optical depth. GISci. Remote Sens. 2019, 57, 258–270. [Google Scholar] [CrossRef]
  35. Zhu, Z.; Piao, S.; Myneni, R.B.; Huang, M.; Zeng, Z.; Canadell, J.G.; Ciais, P.; Sitch, S.; Friedlingstein, P.; Arneth, A.; et al. Greening of the Earth and its drivers. Nat. Clim. Chang. 2016, 6, 791–795. [Google Scholar] [CrossRef]
  36. Piao, S.; Wang, X.; Park, T.; Chen, C.; Lian, X.; He, Y.; Bjerke, J.; Chen, A.; Ciais, P.; Tømmervik, H.; et al. Characteristics, drivers and feedbacks of global greening. Nat. Rev. Earth Environ. 2020, 1, 14–27. [Google Scholar] [CrossRef]
Figure 1. Locations of meteorological stations (a) with long-term observation data (2000–2021), and the distribution of the main ecosystem types (forest land, grass land, and unused land) (b) in China.
Atmosphere 13 00738 g001
Figure 2. Change rate of NPP at 1 km × 1 km grid cell (a), and the average change rate in forest land, grass land, and unused land (b) in 2000–2021.
Atmosphere 13 00738 g002
Figure 3. Warm–wet climate trend judging by the change rate of annual air temperature (a) and annual precipitation (b) for each 1 km × 1 km grid cell in the main ecosystems except for crop land (white color is crop land) over China in 2000–2021. Positive values denote an increasing trend; negative values denote a decreasing trend.
Atmosphere 13 00738 g003
Figure 4. Rising air temperature (a) and annual precipitation (b) in forest land, grass land, and unused land from the average value of 1 km × 1 km grid cells during the period 2000–2021.
Atmosphere 13 00738 g004
Table 1. Models calculating fresh grass yield (t DM ha−1yr−1) in six regions in China [22].
RegionsDistributionFormulaEstimated Precision
Northeast ChinaProvinces of Heilongjiang, Liaoning, Jilin, and eastern Inner Mongolia. Y = 385.362 × e 3.813 × N D V I 81 %
Northwest ChinaProvinces of Gansu, Ningxia, and most parts of Inner Mongolia. Y = 6381.86 × N D V I 521.52 75 %
The Loess PlateauProvince of Hebei, Shanxi, and Shannxi. Y = 18 , 377 × N D V I 2.0233 80 %
South ChinaProvince of Sichuan, Chongqing, Yunnan, Guizhou and Guangxi, etc. Y = 21 , 399 × N D V I 3.0498 81 %
XinjiangProvince of Xinjiang. Y = 409.91 × e 3.9099 × N D V I 79 %
The Tibet PlateauProvince of Qinghai, Tibet, and part of Sichuan. Y = 225.42 × e 4.4368 × N D V I 80 %
Table 2. Correlation between NPP and annual precipitation, annual temperature in the main ecosystems over China.
Pearson’s CorrelationSpearman’s rho CorrelationKendall’s tau-b Correlation
n = 22n = 22n = 22
Sig. (2-Tailed)Sig. (2-Tailed)Sig. (2-Tailed)
Precipitation in forestland0.797 **0.810 **0.662 **
Precipitation in grassland0.756 **0.834 **0.619 **
Precipitation in unused land0.654 **0.739 **0.576 **
Temperature in forestland0.788 **0.715 **0.506 **
Temperature in grassland0.434 *0.4150.281
Temperature in unused land0.2620.3380.221
** indicates statistically significant correlation at 0.01 confidence level (bilateral). * indicates statistically significant correlation at 0.05 confidence level (bilateral).
Publisher’s Note: MDPI stays neutral with regard to jurisdictional claims in published maps and institutional affiliations.

