Article

Long-Term (2017–2020) Aerosol Optical Depth Observations in Hohhot City in Mongolian Plateau and the Impacts from Different Types of Aerosol

1
State Key Laboratory of Atmospheric Boundary Layer Physics and Atmospheric Chemistry, Institute of Atmospheric Physics, Chinese Academy of Sciences, Beijing 100029, China
2
Laboratory for Supervision and Evaluation of Pollution Reduction and Carbon Reduction in Arid and Semi-Arid Regions, Inner Mongolia Autonomous Region Environmental Monitoring Central Station, Hohhot 010090, China
3
College of Earth and Planetary Sciences, University of Chinese Academy of Sciences, Beijing 100049, China
*
Author to whom correspondence should be addressed.
Atmosphere 2022, 13(5), 737; https://doi.org/10.3390/atmos13050737
Submission received: 7 April 2022 / Revised: 29 April 2022 / Accepted: 30 April 2022 / Published: 5 May 2022
(This article belongs to the Special Issue Applications of Remote Sensing for Studying Urban Air Quality)

Abstract

:
Aerosol optical depth (AOD) measurements for 2017–2020 in urban Hohhot of the Mongolian plateau, a transition zone between the depopulated zone and East Asian urban agglomeration, were analyzed for the first time. Results show that annual AOD500 and Ångström exponent α440-675 were 0.36 ± 0.09 and 1.11 ± 0.16 (2017), 0.41 ± 0.12 and 0.90 ± 0.28 (2018), 0.38 ± 0.09 and 1.13 ± 0.24 (2019), 0.38 ± 0.12 and 1.17 ± 0.22 (2020), respectively, representing a slightly polluted level with a mixed type of coarse dust aerosol and a fine urban/industrial aerosol. Throughout the year, depopulated-zone continental air flows predominated in Hohhot (i.e., NW-quadrant wind), accounting for 82.12% (spring), 74.54% (summer), 63.61% (autumn), and 100% (winter). The clean and strong NW-quadrant air flows induced by the south movement of a Siberian anticyclone resulted in a low 500-nm AOD of 0.30 ± 0.29, 0.20 ± 0.15, 0.24 ± 0.29, and 0.13 ± 0.08 from spring to winter. Meanwhile, the local emissions from Hohhot city, as well as anthropogenic urban/industrial aerosols transported by southern and western air masses, originating from southern urban agglomeration and western industrial cities (Baotou, Wuhai, etc.), contributed to the highest aerosol loading, with significant transformation rates of the secondary aerosols Sulfate-Nitrate-Ammonium (SNA) of 47.45%, 57.39%, 49.88%, and 45.16–47.36% in PM2.5 for each season. The extinction fraction of fine aerosols under these anthropogenic trajectories can be as high as 80%, and the largest fine aerosol size was around 0.2–0.25 μm. Dust aerosols were suspending in urban Hohhot all year, although at different levels for different seasons, and the extinction fraction of dust aerosol during sandstorms was generally higher than 70%.

1. Introduction

Atmospheric aerosols are the suspended liquid and solid particles released by natural sources (desert dust, sea salt, and volcanic sulfate) and anthropogenic activities (vehicle exhaustion, cooking, and industrial emissions) with diameters ranging from 10−3 to 102 μm [1,2]. Atmospheric aerosols play a crucial role in changing the earth–atmosphere radiance balance and energy budget, as well as affecting the climate directly by absorbing and scattering solar radiation (i.e., aerosol direct radiation forcing), whereas hydrophilic aerosols serve as cloud condensation nuclei (CCN) or ice nuclei (IN) and thus alter cloud properties, which indirectly impact the climate through cloud–radiation interactions, denoted as aerosol indirect radiation forcing [3,4]. As such, atmospheric aerosols have gradually become a major area of interest for all atmospheric and environmental experts [5,6,7,8].
When aiming at accurately assessing and predicting aerosol (in)direct radiation forcing, knowledge of their optical properties is a critical factor for climate models. Satellite-based remote-sensing products, such as the Moderate Resolution Imaging Spectro-radiometer (MODIS), Multi-angle Imaging Spectro-radiometer (MISR), Visible Infrared Imaging Radiometer Suite (VIIRS), and Clouds and the Earth’s Energy System (CERES), provide a global perspective on monitoring the spatial distributions of aerosols, however, there remain great uncertainties due to the influences of surface albedo and retrieval algorithms [9,10,11,12,13]. Ground-based remote sensing is more reliable compared with satellite observations. Many organizations have established their own aerosol networks in mainland China, such as CARSNET [14], CSHNET [15], and CARE-China [16]. These databases provide in-depth knowledge for assessing the climatic and environmental effects of aerosols over different regions of China [9,17,18,19,20,21,22,23,24,25,26,27,28]. For example, Ma et al. (2016) have reported their statistical analysis of the aerosol optical properties over a desert region of northwest China and found that the aerosol types were changing from single dust aerosols to a mix type of dust aerosols and anthropogenic aerosols due to the rapid development of tourism [22]. Su et al. (2018) found that the east slope of the Tibetan Plateau was seriously affected by the air mass originating from Southeast Asia during the dry season, with high concentrations of indicators for biomass burning sampled in Gongga Mountain. However, in the wet season, the oxidation of volatile organic compounds was the main source of aerosols that came from the Sichuan Basin [24]. Ma et al. (2021) analyzed the differences and uncertainties of aerosol radiative effects of Qianyanzhou, an urban–forest transition region, using multiple aerosol observation datasets. They found that the differences of the aerosol components and secondary compounds transformation led to significant aerosol radiative forcing (ARF) uncertainties [26]. In addition to these representative backgrounds, the aerosol properties of numerous typical cities were also studied, including Tangshan (Beijing-Tianjin-Hebei) [29], Shanghai (The Yangtze River Delta) [30], Nanjing (The Yangtze River Delta) [31], Wuhan (Central China region) [32], Changsha (Central China region) [33], Shenyang (Northeast China region) [25], Yinchuan (Northwest China region) [34], and Kunming (Southwest China region) [35].
The Mongolian plateau, a transition zone between the depopulated zone and east Asian urban agglomeration, is an important ecological equilibrium development center. During the past decades, the Inner Mongolian Autonomous Region experienced a very rapid development of industrialization and urbanization. The value of industrial output was around 166.40 billion RMB in 2020, and the urban population proportion reached 67.48%, which increased a percentage of 11.95% as compared to that of 2010. Increasing human activities have potentially had a great impact on the local environment and climate. However, due to a lack of ground-based observations, there are no studies in the literature that have focused on analyzing the aerosol properties of this region. It is thus very urgent and necessary to study the aerosol optical depth in Mongolia to improve our knowledge of the regional aerosol–climate interactions.
This manuscript is organized as follows: Section 2 describes the observational site, instrument and methodology; Section 3 shows the main results; and Section 4 gives the conclusions and outlooks.

2. Site, Instrument and Methodology

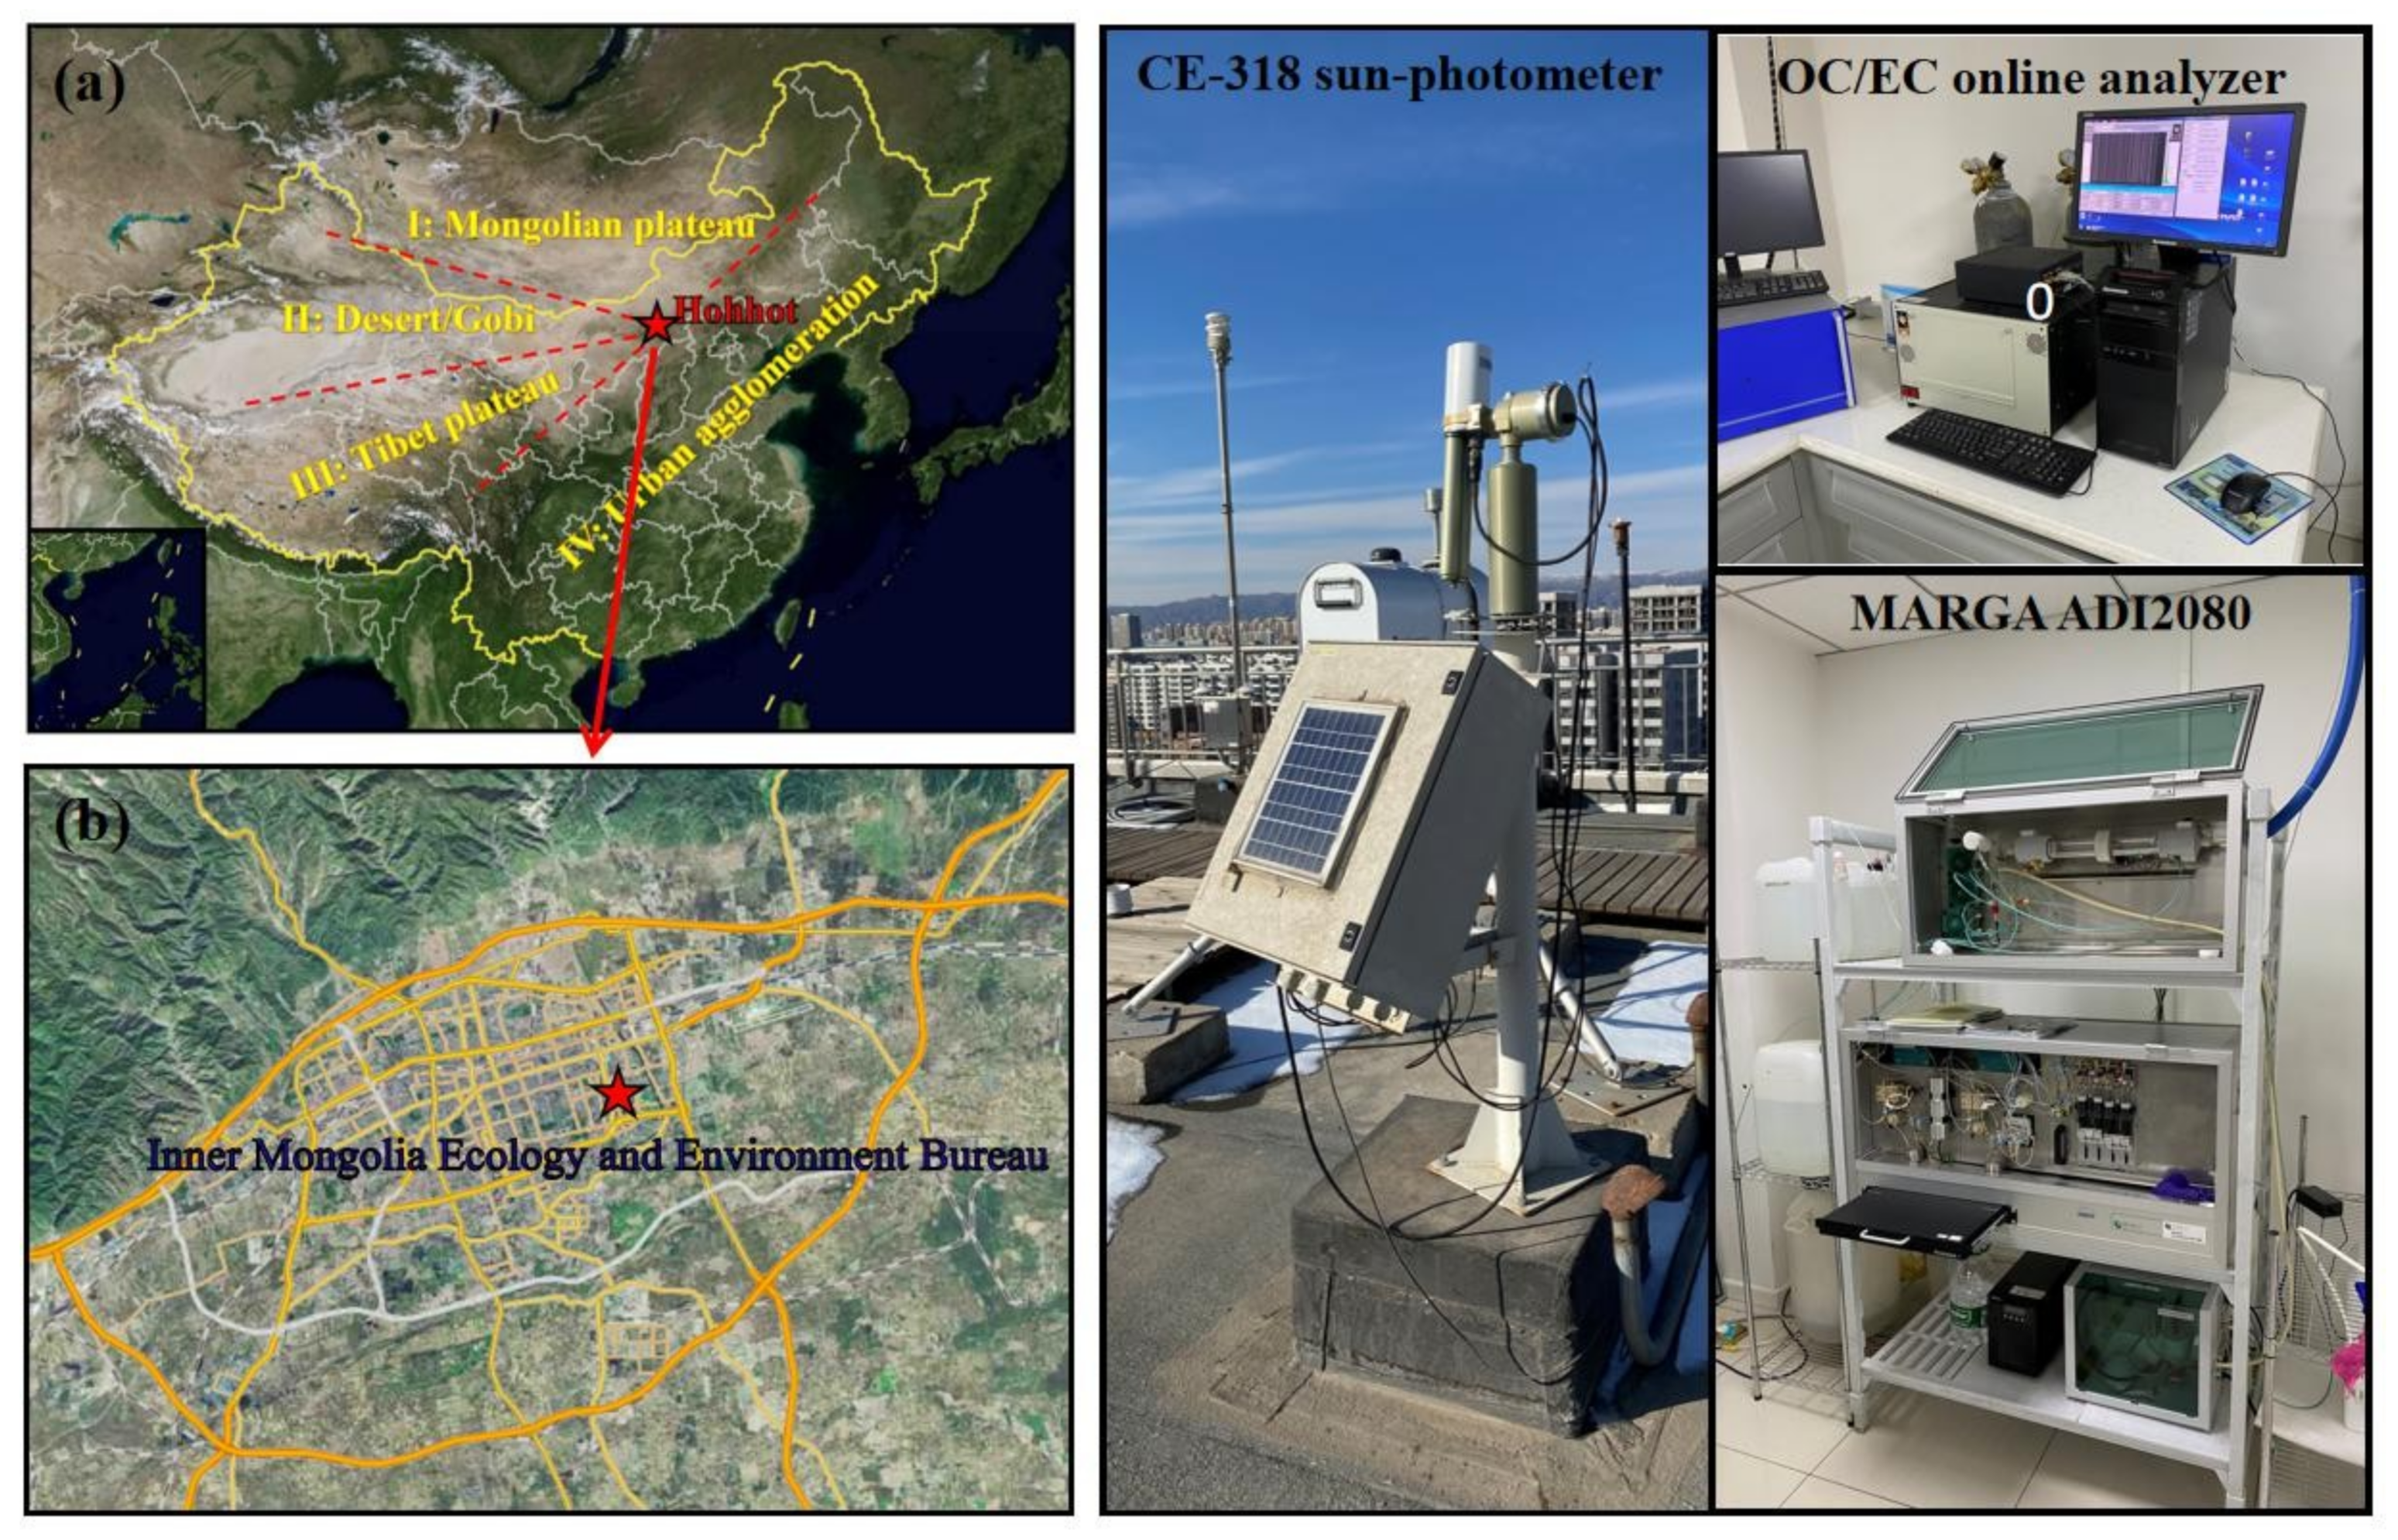
2.1. Site Description

The Hohhot site (40.48° N, 111.41° E; 1040 m above sea level) is set at the roof top (16 floors or equally 50 m above the ground) of the Inner Mongolia Ecology and Environment Bureau. Hohhot is located in the Mongolian plateau, a transition zone between the depopulated desert zone and east Asian urban agglomeration. According to the geographical distribution, it can be delineated as four different geographical backgrounds, shown in Figure 1a. Zone I, north of Hohhot, is the Mongolian Plateau and the Central Siberian plateau; Zone II, West of Hohhot, comprises Xinjiang and Gansu provinces, and the central Asia Kazakhstan, an arid and semi-arid region with a vast desert and Gobi; Zone III, southwest of Hohhot, is the Tibetan Plateau; and zone IV is the east-Asia urban agglomeration with extremely high anthropogenic emissions.

2.2. CIMEL Sun-Photometer

The instrument used to observe aerosol optical depth is an automatic CIMEL sun-photometer (CIMEL Electronique CE-318), the same instrument used for the Aerosol Robotic Network (AERONET). The CE-318 sun-photometer has a 1.2° full field-of-view, and 8 wavelengths (340, 380, 440, 500, 675, 870, 1020, and 1640 nm) to retrieve AOD. The uncertainty of the output optical depth is about 0.01–0.02 according to [36]. For the retrieval of AOD, the Beer–Lambert–Bouguer law is programmed into the instrument:
I ( λ ) = I 0 ( λ ) R 2 exp ( m r ( θ ) p p 0 τ r ( λ ) m O 3 ( θ ) τ O 3 ( λ ) m a ( θ ) τ a ( λ ) )
where, I(λ) is the measured irradiance at λ wavelength; I0(λ) is the calibration constant; R is the Earth–Sun distance; θ is the solar zenith angle; mr(θ), mO3(θ), and ma(θ) are the molecular scattering, ozone absorption and aerosol extinction air masses of the respective Rayleigh scattering optical depth τr(λ), ozone absorption optical depth τO3(λ), and aerosol optical depth τa(λ) (or AOD); p and p0 are the actual and standard atmospheric pressures, respectively.
Therefore, τa(λ) can be calculated as:
τ a ( λ ) = 1 m a ( θ ) ln E 0 ( λ ) E ( λ ) R 2 m r ( θ ) p p 0 τ r ( λ ) m O 3 ( θ ) τ O 3 ( λ )
where, Eλ is the output voltage signal detected by the instrument and E0,λ is the calibration coefficient. mr(θ) [37], mO3(θ) [38], ma(θ) [39] are calculated according to
m a ( θ ) = sin ( e ) + 0.0548 × ( e + 2.65 ) 1.452 1
m r ( θ ) = sin ( e ) + 0.50572 × ( e + 6.07995 ) 1.6364 1
m O 3 ( θ ) = R + h ( R + h ) 2 ( R + h ) 2 × cos 2 ( e )
where, e is the solar elevation angle; R = 6370 km, i.e., the mean Earth radius; r is the station height above sea level and h is the height of ozone layer of 22 km.
Rayleigh scattering optical depth is calculated using the following method [40]:
τ r ( λ ) = 0.00864 × λ 3.916 + 0.074 λ + 0.050 / λ × p 1013.5
The ozone absorption optical depth is:
τ O 3 ( λ ) = a O 3 ( λ ) × O 3 × m O 3
where, aO3(λ) is the absorption coefficient of ozone, O3 is the quantity in atmosphere with unit of Dobson.
Based on the theory of aerosol Junge distribution, Ångström (1964) proposed a relationship between wavelength λ and τa(λ) [41]:
τ a ( λ ) = β λ α
where, β is the turbidity coefficient. For any two wavelengths, the Ångström exponent α can be estimated using a log-linear fitting formula:
α = ln ( τ aer , λ 1 ) ln ( τ aer , λ 2 ) / ln ( λ 1 ) ln ( λ 2 )
The Ångström exponent α is an indicator of particle size. The larger the value is, the smaller the particle size is, and vice versa.

2.3. MARGA System

An online MARGA (Metrohm MARGA ADI2080, Herisau, Switzerland) equipped with a PM2.5 cyclone was employed to measure the mass concentration of water-soluble inorganic ions (WSIIs: SO42−, NO3, NH4+, Cl, K+, Na+, Mg2+, and Ca2+) in the aerosol phase at a time resolution of one hour. This instrument has three kinds of boxes, including a flow-control box, a sample box, and a detector box. The ambient airflow is pumped into the sample box at a rate of 1 m3 h−1. Then, the aerosols in the air are collected with a steam jet aerosol collector, and finally the hourly mass concentration of water-soluble ions is estimated by an automatic ion chromatography (IC) system in the detector box. The MARGA was calibrated using an internal standard solution (LiBr), and the detecting limits for SO42−, NO3, NH4+, K+, Cl, Na+, Ca2+, Mg2+, were 0.04, 0.05, 0.05, 0.09, 0.01, 0.05, 0.09, 0.06 μg m−3, respectively.
Quality assurance and quality control of the MARGA system includes the following steps. Firstly, a National Institute of Standards and Technology (NIST) traceable primary standard (DryCal DC-LITE flowmeter, Bios International Corporation, Butler, NJ, USA) was used to measure and verify the flow rate of the atmospheric inlet every week. Secondly, the inlets and air sampling tubing were cleaned weekly with double deionized water and dried with zero-grade air. Thirdly, a liquid blank was analyzed by running the MARGA with the air pumps disconnected and the denuder inlets sealed, which means that the MARGA was only sampling the absorption solution. With the air pumps disconnected and the denuder inlets sealed, an external standard test was also conducted by replacing the absorption solution with a known liquid standard containing SO42−, NH4+, and NO3. This was to verify the analytical accuracy as controlled by the internal lithium bromide (LiBr) standard [42,43].

2.4. OC/EC Online Analyzer

Carbonaceous aerosols, including organic carbon (OC) and elemental carbon (EC) were analyzed by an OC/EC online analyzer (RT-4, Sunset Laboratory Inc., Portland, OR, USA) using thermo-optical transmission method and a 2.5-μm inlet. PM2.5 were sampled on a round 16-mm quartz filter with a flow rate of 8 L m−1. After a 30-min collection, the oven of the instrument was purged with helium gas. The temperature of the oven was increased in multiple programmed steps based on an RT-quartz thermal protocol [44] in which the variation coefficients for TC, OC and EC are smaller than the other two commonly-used thermal protocols of NIOSH 5040 and Fast-TC under different air quality degrees [45]. Particulate organic carbon was then thermally volatilized and oxidized to carbon dioxide (CO2), and then quantified with a non-dispersive infrared detector. The oven was cooled off prior to the second stage, when the oven was purged with a mixture of 5% oxygen in helium; the sample was again heated incrementally. During this stage, all of the remaining carbon was oxidized to CO2, which was detected using the non-dispersive infrared detector. For charring correction, a He–Ne laser beam monitored the sample transmittance during the whole heating process. The split point between OC and EC was determined when the laser signal returned to the initial value [44]. Calibration of OC/EC analyzer was strictly performed according to the Standard Operating Procedure [46], with a daily and Bi-weekly diagnosis of hardware problem flags and sucrose injections, and monthly, quarterly, and semi-annually maintenance, such as Denuder filter replacing, cyclone and Inlet tubing cleaning, and leak and flow check, etc. For the post-processing and quality control of OC/EC measurements, we eliminated those measurements with a laser correction value lower than 0.90 to ensure data quality. The estimation of organic material (OM), according to the literature of [47,48,49,50], can be calculated through:
OM = 1.6 × OC

2.5. TrajStat Model

The Trajectory Statistics (TrajStat) model is a software that has been gradually developed by the users of NOAA HYSPLIT [51]. The HYSPLIT module (http://ready.arl.noaa.gov/HYSPLIT.php, accessed on 1 April 2022) for the calculation and statistical analysis of trajectories was embedded into a geographic information systems (GIS) technique (MapWindow open-source team, 2007). This kind of user-friendly GUI interface makes it more intuitive and visual for users to cluster the backward/forward trajectories and estimate the potential sources of air pollution (i.e., potential source contribution function PSCF and concentration weighted trajectory CWT). Statistical analysis of the backward trajectory cluster groups a large number of backward trajectories based on the speed and direction of the air mass movement. For the set-up and initialization of TrajStat, an archive dataset of the 1° × 1° Global Data Assimilation System (GDAS) data for 2017–2020 downloaded from the National Centers for Environmental Prediction (NCEP) (https://www.ready.noaa.gov/archives.php, accessed on 1 April 2022) was used to calculate a 72-h backward trajectory. The starting height was set to 1000 m and the endpoint was the Inner Mongolian Ecologic and Environmental Bureau.

2.6. Wing Framework Methodology

The spectral variation of α provides further information about the aerosol size distribution. Gobbi et al. (2007) have developed a wing-curve framework and used it to clarify mixtures of polluted aerosols with dust aerosol, to distinguish aerosol growth from cloud contamination, and to observe aerosol humidification [52]. This α-δα framework is constructed with Ångström exponent α440-870 (x label) and Ångström exponent differences δα = α440-675α675-870 (y label) using a refractive index of m = 1.4 − 0.001i, in which the calculations of α440-870, α440-675, and α675-870 are based on the pairs of (AOD440, AOD870), (AOD440, AOD675), and (AOD675, AOD870), respectively. δα is defined as a measurement of the α curvature dα/dλ. This α-δα coordinate visually converts (α440-870, δα) to the size of fine aerosols and the contribution of fine aerosols to aerosol extinctions. The solid black lines denote seven sizes of fine particles (Rf) (i.e., 0.05 μm, 0.10 μm, 0.15 μm, 0.20 μm, 0.30 μm, 0.40 μm, and 0.50 μm); the dashed blue lines are the fixed extinction fraction (η) of fine aerosols to the total aerosol extinctions (i.e., 1%, 10%, 30%, 50%, 70%, 90% and 99%), in which, η is determined using Mie calculations at the reference points of fine mode (Rf) and coarse mode (Rc) radii, assuming that aerosol bimodal size distributions are characterized with lognormal function. In order to avoid errors larger than 30%, only the datasets of AOD670 > 0.15 (AOD670 was calculated by a linear interpolation of AOD500 and AOD675) were used for analysis in this study [52].

3. Results

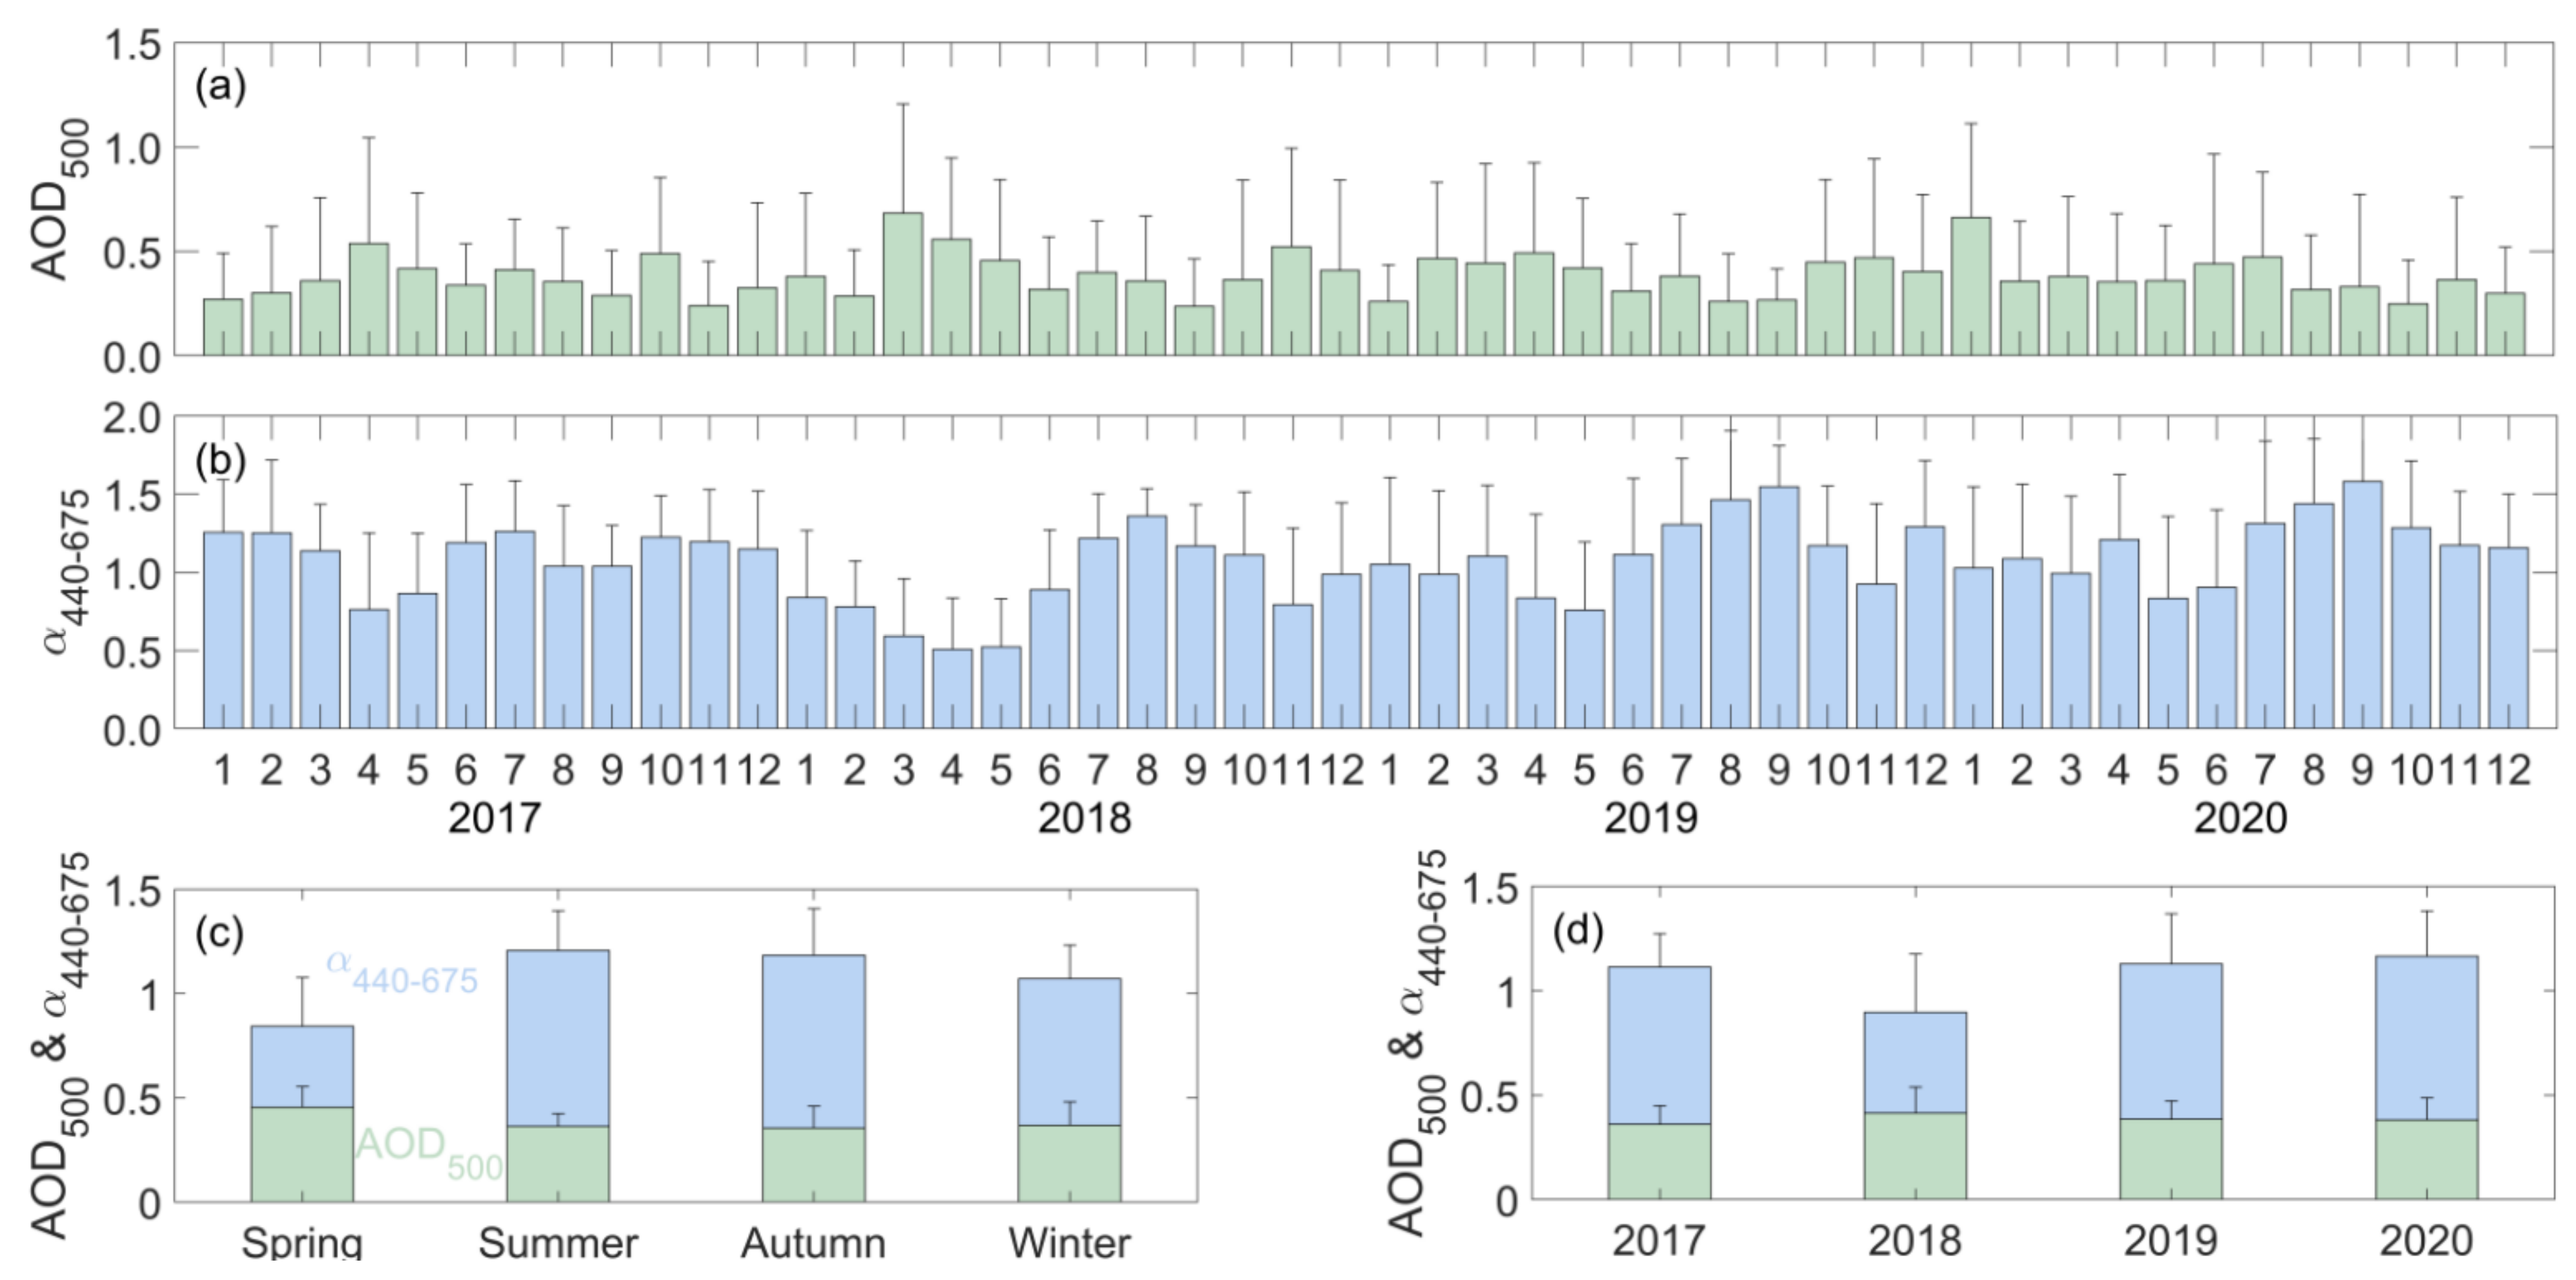
3.1. Statistical Analysis of AOD500 and α440-675

Figure 2 shows the monthly, seasonal, and annual mean values of AOD500 and Ångström exponent α440-675. Annual AOD500 values in Hohhot during 2017–2020 were 0.36 ± 0.09 (2017), 0.41 ± 0.12 (2018), 0.38 ± 0.09 (2019), and 0.38 ± 0.12 (2020), respectively, representing a slightly polluted level. The level of AOD500 was lower than the typical industrial cities of Anshan (0.70) [14], Shenyang (0.61 ± 0.13) [25], and Lanzhou (0.80) [14]. Compared with the Inner Mongolian cities of Xilinhot (0.26) and Zhurihe (0.24), the pollution in Hohhot was more severe because of its special geographic location and advanced economies. Annual α440-675 were 1.11 ± 0.16 (2017), 0.90 ± 0.28 (2018), 1.13 ± 0.24 (2019), and 1.17 ± 0.22 (2020), demonstrating a mixed type of coarse-mode dust aerosol and fine-mode urban/industrial aerosol dominating Hohhot city.
The highest seasonal mean AOD500 during 2017–2020 was 0.45 ± 0.10 in spring, followed by winter (0.37 ± 0.11), summer (0.36 ± 0.06), and autumn (0.36 ± 0.10). This is owing to the contribution of frequent spring dust storms. Seasonal order of α440-675 was summer (1.21 ± 0.19) > autumn (1.18 ± 0.22) > winter (1.07 ± 0.16) > spring (0.84 ± 0.23). The lowest α440-675 in spring also corresponded to the coarse-mode dust aerosol, whereas the highest value in summer was mainly associated with the intensity of new particle formation under strong solar radiation and a high temperature environment, as well as less atmospheric humidity vapors in the deep inland zone, a place for which the East Asian monsoon has only a negligible influence.

3.2. Backward Trajectory Clusters

Seasonal clustering revealed that spring, summer, autumn, and winter air masses consisted of three, four, three and five types, respectively. As shown in Figure 3, the NW-quadrant air masses dominated the air flows of Hohhot throughout the whole year, occupying 82.12% in spring (i.e., Type-1 and Type-2), 74.54% in summer (i.e., Type-1, Type-2, and Type-3), 63.61% in autumn (i.e., Type-1 and Type-3), and 100% in winter. The attributes of different air masses of spring, summer, autumn, and winter are summarized in Table 1.
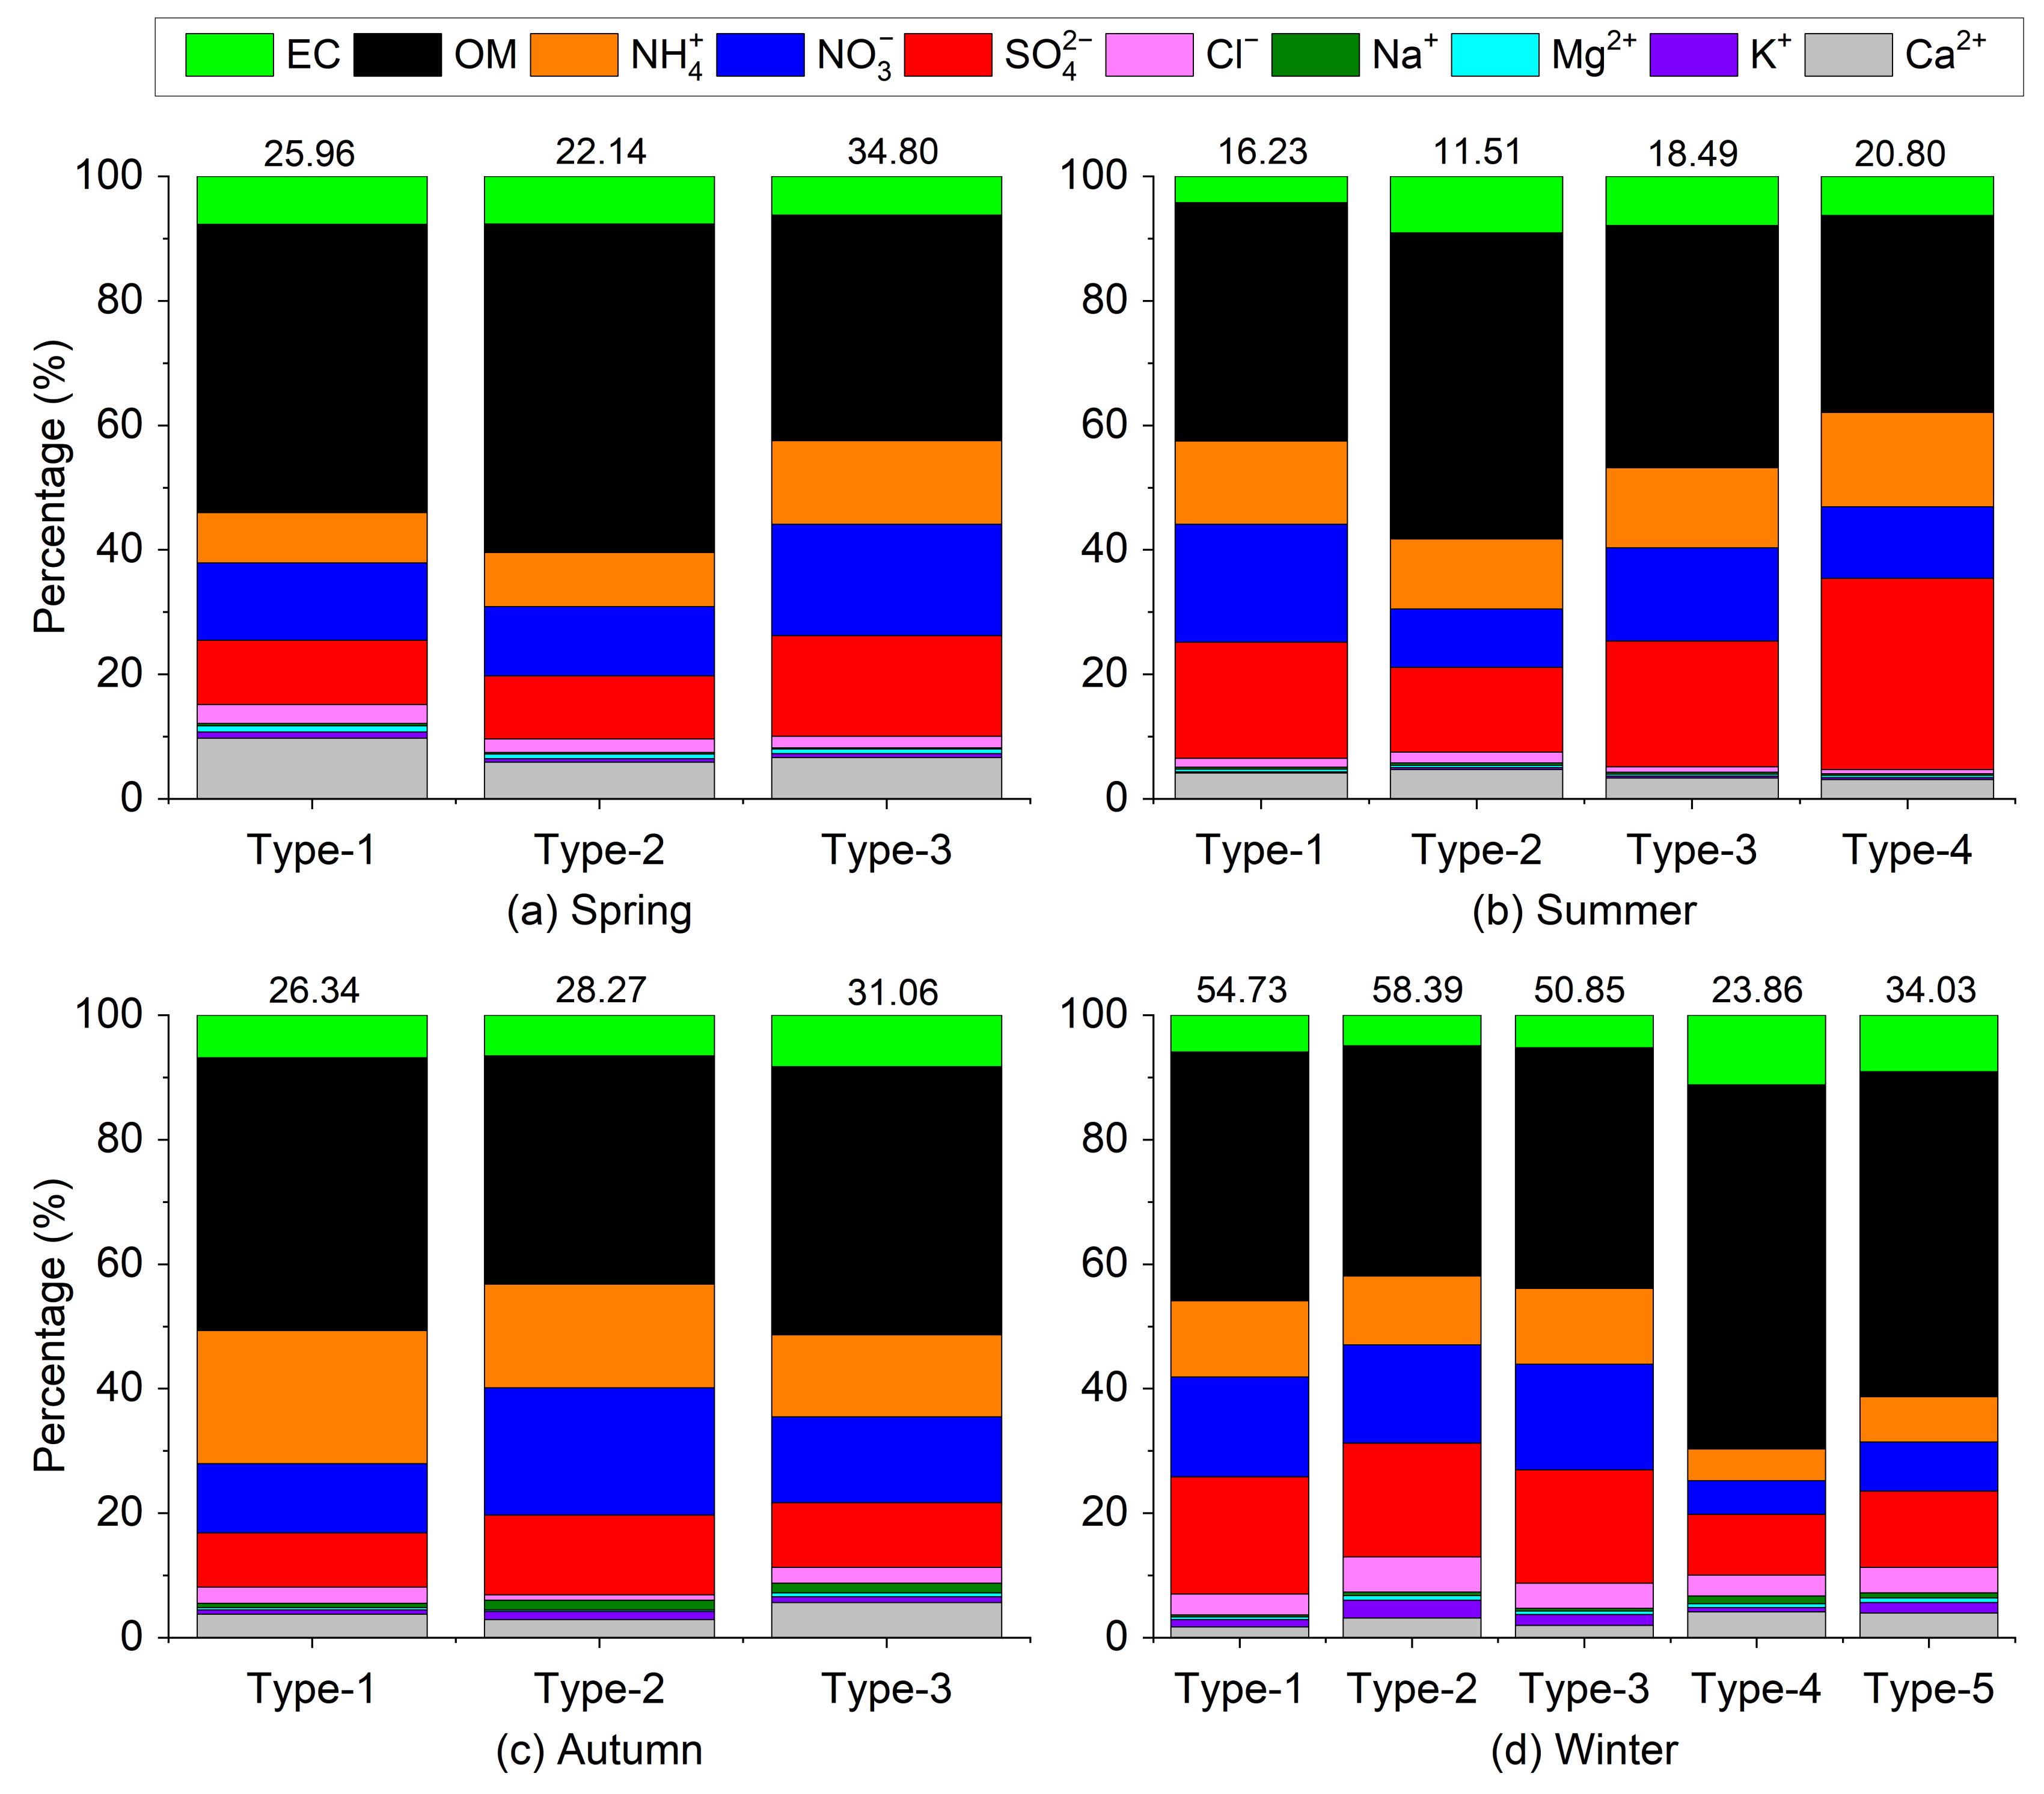
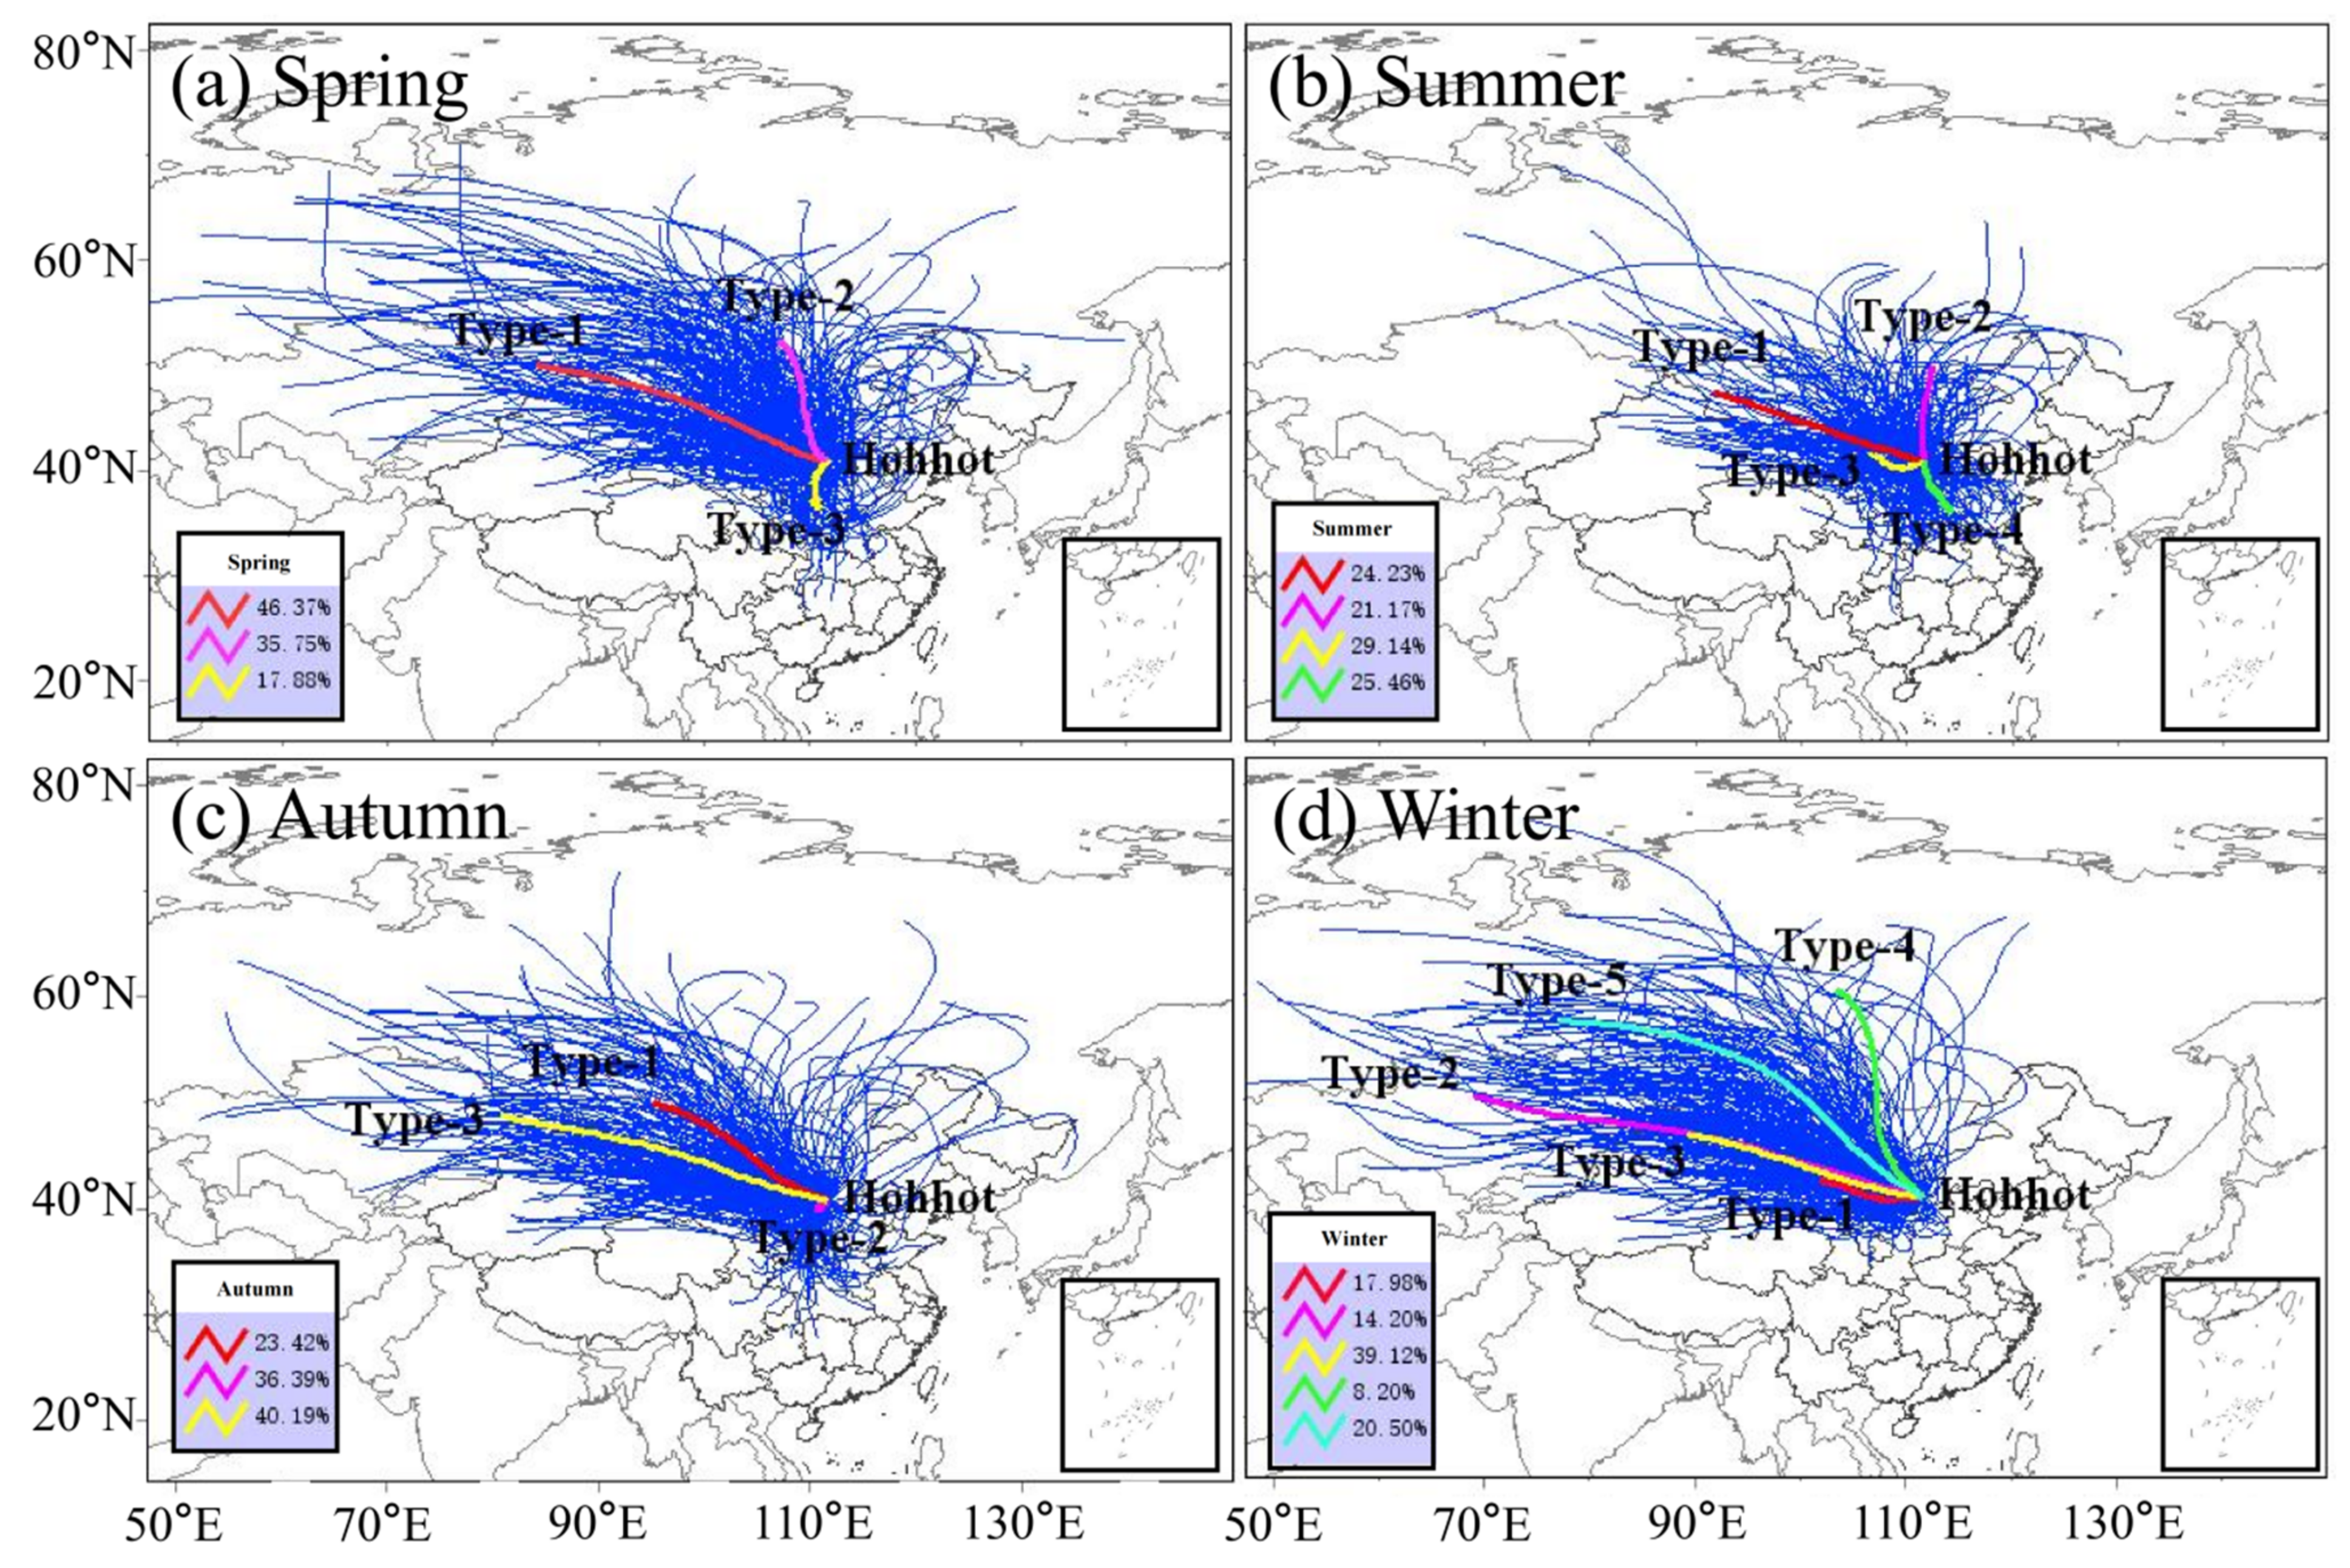
  • For spring, Type-1 trajectory, i.e., northwest air mass from long-range transport, came from Kazakhstan/Xinjiang Province (Zone II: Desert/Gobi, Figure 1), accounted for 46.37% of the total trajectories. This type of trajectory carried dust aerosols when passing through the Desert/Gobi areas, resulting in a relatively coarse mode of 0.73 ± 0.47 of α440-675, a slightly polluted scenario of 0.45 ± 0.40 of AOD500, and a seasonal highest Ca2+ fraction of 12% (Figure 4), the main component of dust aerosols. Type-2 trajectory, a north air mass from medium-range transport, originated from the Mongolian plateau, accounted for 35.75%. AOD500 under the influence of the north clean air mass was 0.30 ± 0.29. The Type-3 trajectory, i.e., the south air mass from short-range transport, was from Shanxi province. Although Type-3 has the lowest frequency of 17.88%, as well as the weakest wind speed in comparison with the other two air masses (2.36 m s−1 < 2.87 m s−1 < 2.95 m s−1), the highest aerosol loadings of 0.78 ± 0.46 of AOD500 and SO42− fraction of 18% were observed. The explanation is that the severe anthropogenic emissions accompanied by the fast urbanization and industrialization over zone IV (Figure 1a), especially for the SO2 emitted from the serried steel/coal enterprises in Shanxi Province, were transported to Hohhot city and led to heavy haze pollution. In consideration of PM2.5 values estimated by the sum of ionic composition and carbonaceous aerosols, concentrations were 34.80 μg m−3 (Type-3) > 25.96 μg m−3 (Type-1) > 22.14 μg m−3 (Type-2), which was consistent with the order of AOD500.
  • For summer, the four types of air masses occurred with similar frequency of 24.23%, 21.17%, 29.14%, and 25.46%. AOD500 values under the control of Type-1 (Northwest air mass from long-range transport), Type-2 (North air mass from medium-range transport), and Type-3 (Northwest air mass from short-range transport) were 0.29 ± 0.17, 0.20 ± 0.15, and 0.31 ± 0.19. The corresponding PM2.5 concentrations were 16.23 μg m−3, 11.51 μg m−3, and 18.49 μg m−3, respectively. Similar with spring, the south air mass of Type-4 with the lowest wind speed comparing with the other three air masses (1.98 m s−1 < 2.24 m s−1 < 2.49 m s−1 < 2.06 m s−1) also resulted in a polluted scenario of 0.65 ± 0.42 of AOD500. SO42− concentrations in Type-1, Type-2, Type-3, and Type-4 were 21%, 16%, 24%, and 31%, respectively. It is observed that the summertime SO42− fractions for the four trajectories were higher than the other seasons. The strong solar radiation and high temperature were catalysts to promote the transformation of SO2 to SO42− and the reason for the highest fraction of 31% in south air mass Type-4 (Figure 4b) was the same as that of Type-3 of spring.
  • For autumn, the Type-1 trajectory, i.e., Northwest air mass from medium-range transport, originated from Mongolia and accounted for 23.42%; Type-3 trajectory, i.e., West air mass from long-range transport, came from Kazakhstan and had a frequency of 40.19%. The local air masses of Type-2 occupied 36.29% and the AOD500 of 0.46 ± 0.41 was more severe in comparison with Type-1 (0.24 ± 0.29) and Type-3 (0.33 ± 0.35) due to the high local anthropogenic emissions of Hohhot city. This is also evidenced from the largest fraction of 20% of NO3 (Type-2: 20% > Type-3: 14% > Type-1: 11%) (Figure 4c).
  • For winter, the west group trajectories of Type-1, Type-2, and Type-3, originated from Inner Mongolia, Kazakhstan, and Xinjiang province, respectively, and had a total frequency of 71.30% (17.98% + 14.20% + 39.12%). Slightly polluted scenarios of AOD500 of 0.52 ± 0.43, 0.50 ± 0.40, and 0.40 ± 0.35, PM2.5 of 54.73 μg m−3, 58.39 μg m−3, and 50.85 μg m−3, and similar chemical composition proportion (Figure 4d) were observed for these three types of air masses. Wintertime coal combustion for home heating was very common in rural villages of Inner Mongolia, in conjunction with the heavy industries in Baotou, Wuhan, located to the west of Hohhot, the severe emission of SO2 transported by the west group trajectories led to high proportions of SO42− of 21% (Type-1), 20% (Type-2), and 20% (Type-3). The Type-4 trajectory, i.e., North air mass from long-range transport, had the lowest frequency of 8.20% and the highest wind speed of 3.19 m s−1, under which, the aerosol loading was as low as 0.13 ± 0.08 and the surface PM2.5 was 23.86 μg m−3; Type-5 trajectory, i.e., Northwest air mass from long-range transport, accounts for 20.50% and the aerosol loading of AOD500 of 0.19 ± 0.13 and surface PM2.5 of 34.03 μg m−3 were also very low. The fraction of organic matter (OM) accounts for 44% and 42% in these two trajectories.
The inconsistency of seasonal AOD500 and surface PM2.5 concentration needs to be clarified herein. It is observed that the surface PM2.5 concentration in winter is higher than the other three seasons, differing from the order of AOD500. The possible reason for this distinction is that the definition of AOD500 is the vertical integration of aerosol extinction profiles. Under transport scenarios, the peak of an extinction profile may occur at an altitude of several hundred meters, resulting in a non-linearity of the surface PM2.5 and AOD500. The same explanation is also applied to interpret the difference in autumn. Nevertheless, analysis of the proportion of chemical composition was a good way, to some extent, to differentiate the influence of different air masses.
From the above, it is concluded that the southern air masses transported a large number of anthropogenic pollutants to Hohhot in spring and summer, causing severe regional pollution. In addition, the local air mass in autumn and west air masses in winter are also accompanied with high aerosol loading as compared with the other air flows. Whereas in the control of northwest and north air flows in autumn and winter seasons, the good air quality in Hohhot was associated with the southern movement of the Siberian anti-cycle, and the air quality was also better under the influence of northwest/north air masses in spring and summer.

3.3. Wing Framework Methodology for Aerosol Type Classification

In spring (Figure 5a), it is obvious that high AOD670 values larger than 1.00 are mainly associated with high fraction of >70% of coarse mode components {δα > 0, η < 30%}. This is also evidenced from Figure 6a that the Ca2+ species account for a very high fraction in the WSIIs in this section of {δα > 0, η < 30%}. There are some high AOD670 values in summer (Figure 5b), autumn (Figure 5c), and winter (Figure 5d) also falling into η < 30%, illustrating that dust events occurred throughout the year. In general, with the increase of Rf, or along the dashed lines, there is an observed increase of AOD670 levels simultaneously (Figure 5). This indicates that larger fine mode particles could contribute to higher aerosol extinction. A few points of slightly-to-middle AOD670 values (0.40 < AOD670 < 1.00) lie in the fine mode growth wing of {1.0 < α440-870 < 1.5, δα < 0, η > 50%} [53]. Unlike the eastern coastal cities of Beijing [54], Nanjing [55], and Shanghai [53], Hohhot city is scarcely affected by the summer monsoon, therefore, the points in the fine mode growth wing are not linked to the hygroscopic property of aerosols, but to the secondary transformation and coagulation growth of aging fine particles. More evidence is from Figure 7, the fractions of SNA to the WSIIs of the fine particle growth wing points are generally higher than 80%, demonstrating a very high transformation rate of secondary aerosols. It is also noted that there exist some low Ca2+ (Figure 6b) and SNA (Figure 7b) fraction points in fine particle growth wing in summer, which is caused by the air stagnation.
Figure 8 and Figure 9 show the wing framework for different trajectory clusters in different Ca2+/WSIIs and SNA/WSIIs levels. The high Ca2+/WSIIs of >40% distributed in the domain of {δα > 0, η < 30%} mainly occurred in the Type-1 trajectory in spring, demonstrating the dust pollution in this air mass. However, there were also dust events appearing in other transport trajectories, but with less frequency and strength (20% < Ca2+/WSIIs < 40%). The highest fine model aerosol extinctions (η) were around 30%. For SNA/WSIIs, the high frequencies of high SNA/WSIIs points of >80% appeared in the control of southern air masses (52.46% in Type-3 of spring; 70.42% of Type-4 of summer), local air mass (74.55% of Type-2 of autumn), and western air masses (60% of Type-3 of summer; 39.00% of Type-3 of autumn; 25.45%, 31.11%, 30.25% of Type-1, Type-2, Type-3 of winter) in each season, indicating a very high formation rate of secondary aerosols in these trajectories. The corresponding extinction fraction of fine aerosols under these trajectories can be as high as 80%, and the largest fine mode aerosol size was around 0.2–0.25 μm.

4. Conclusions

Through analysis of a four-year aerosol optical dataset (2017–2020) and the corresponding PM2.5 components of urban Hohhot, in-depth knowledge of the aerosol optical depth and origins of different type of aerosols for the Mongolian city was gained for the first time. The conclusions were:
(1)
The air quality in Hohhot city was slightly polluted during the years 2017–2020, with a mixed type of coarse-mode dust aerosol and fine-mode urban/industrial aerosol. Significant seasonal characteristics were observed for the aerosol optical depth. The aerosol loading in spring was higher than that of summer, autumn, and winter due to the frequent dust events.
(2)
Throughout the year, depopulated-zone continental air flows originating from NW-quadrant were dominant over Hohhot. The clean and strong NW-quadrant air flows induced by the southern movement of the Siberian anticyclone resulted in low aerosol loading, while the local emissions, as well as southern and western transport of anthropogenic fine-mode urban/industrial aerosol in the four seasons, contributed to the high aerosol loading associated with significant transformation of secondary aerosols.
(3)
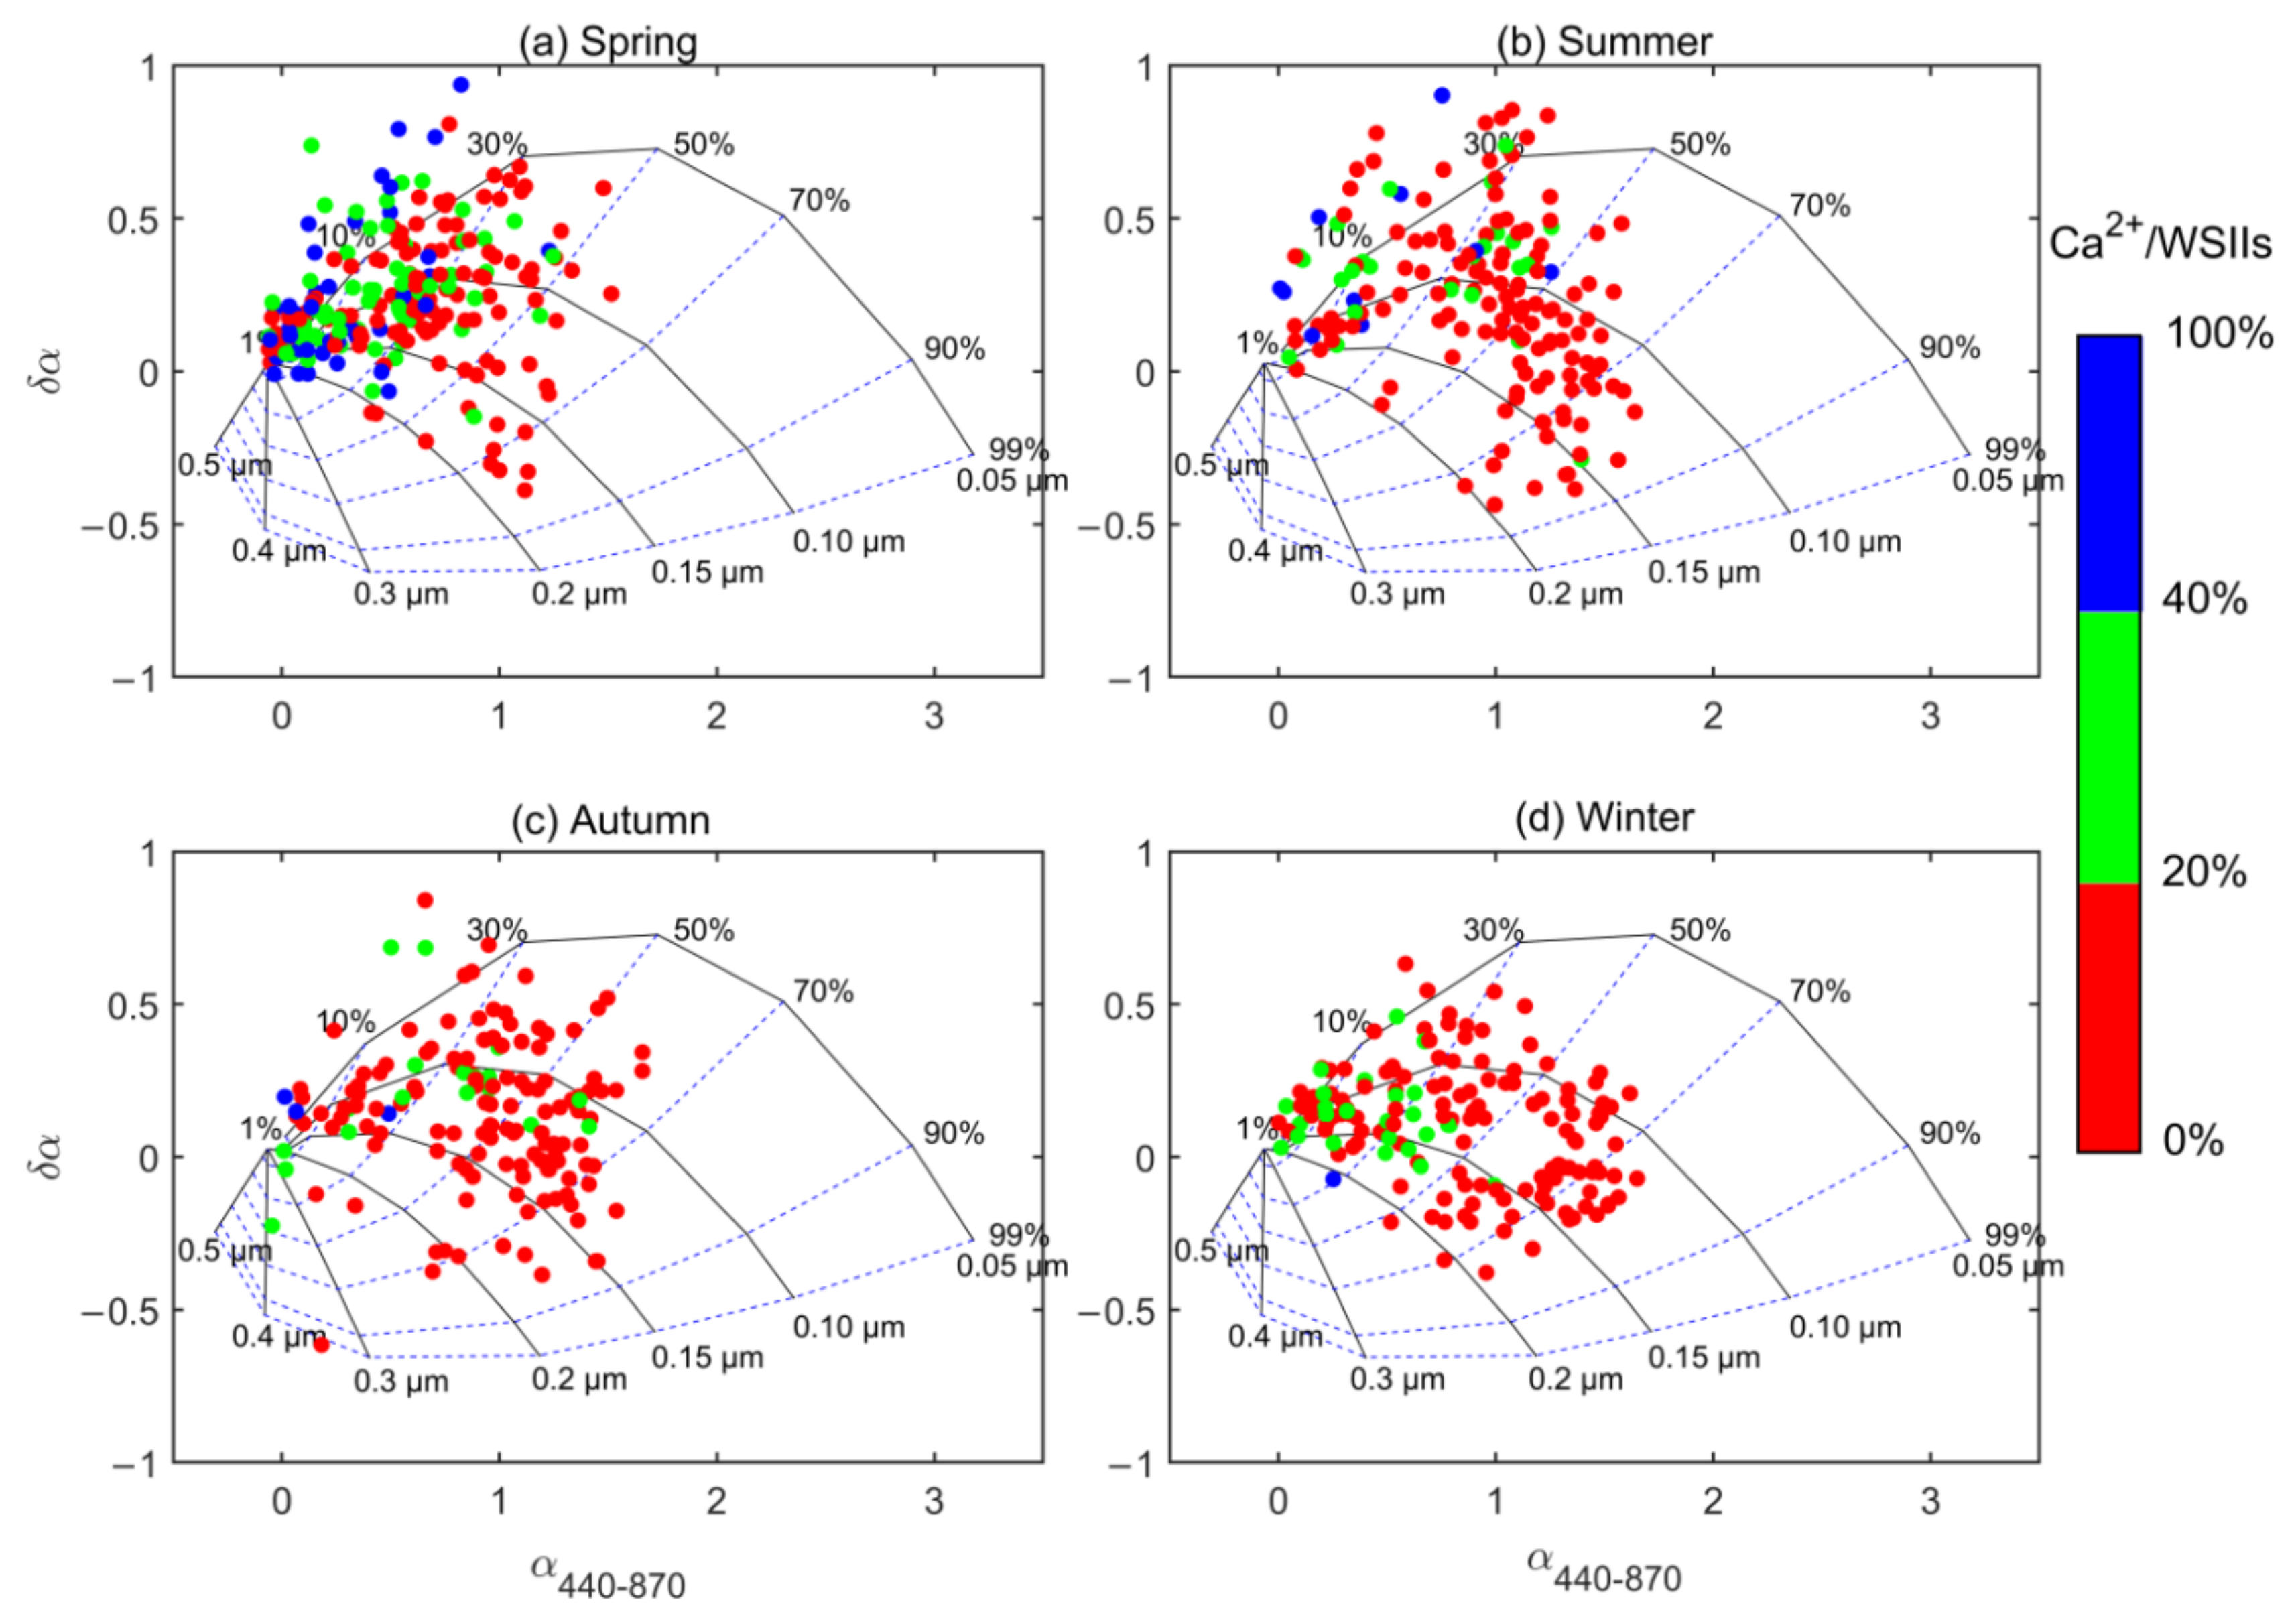
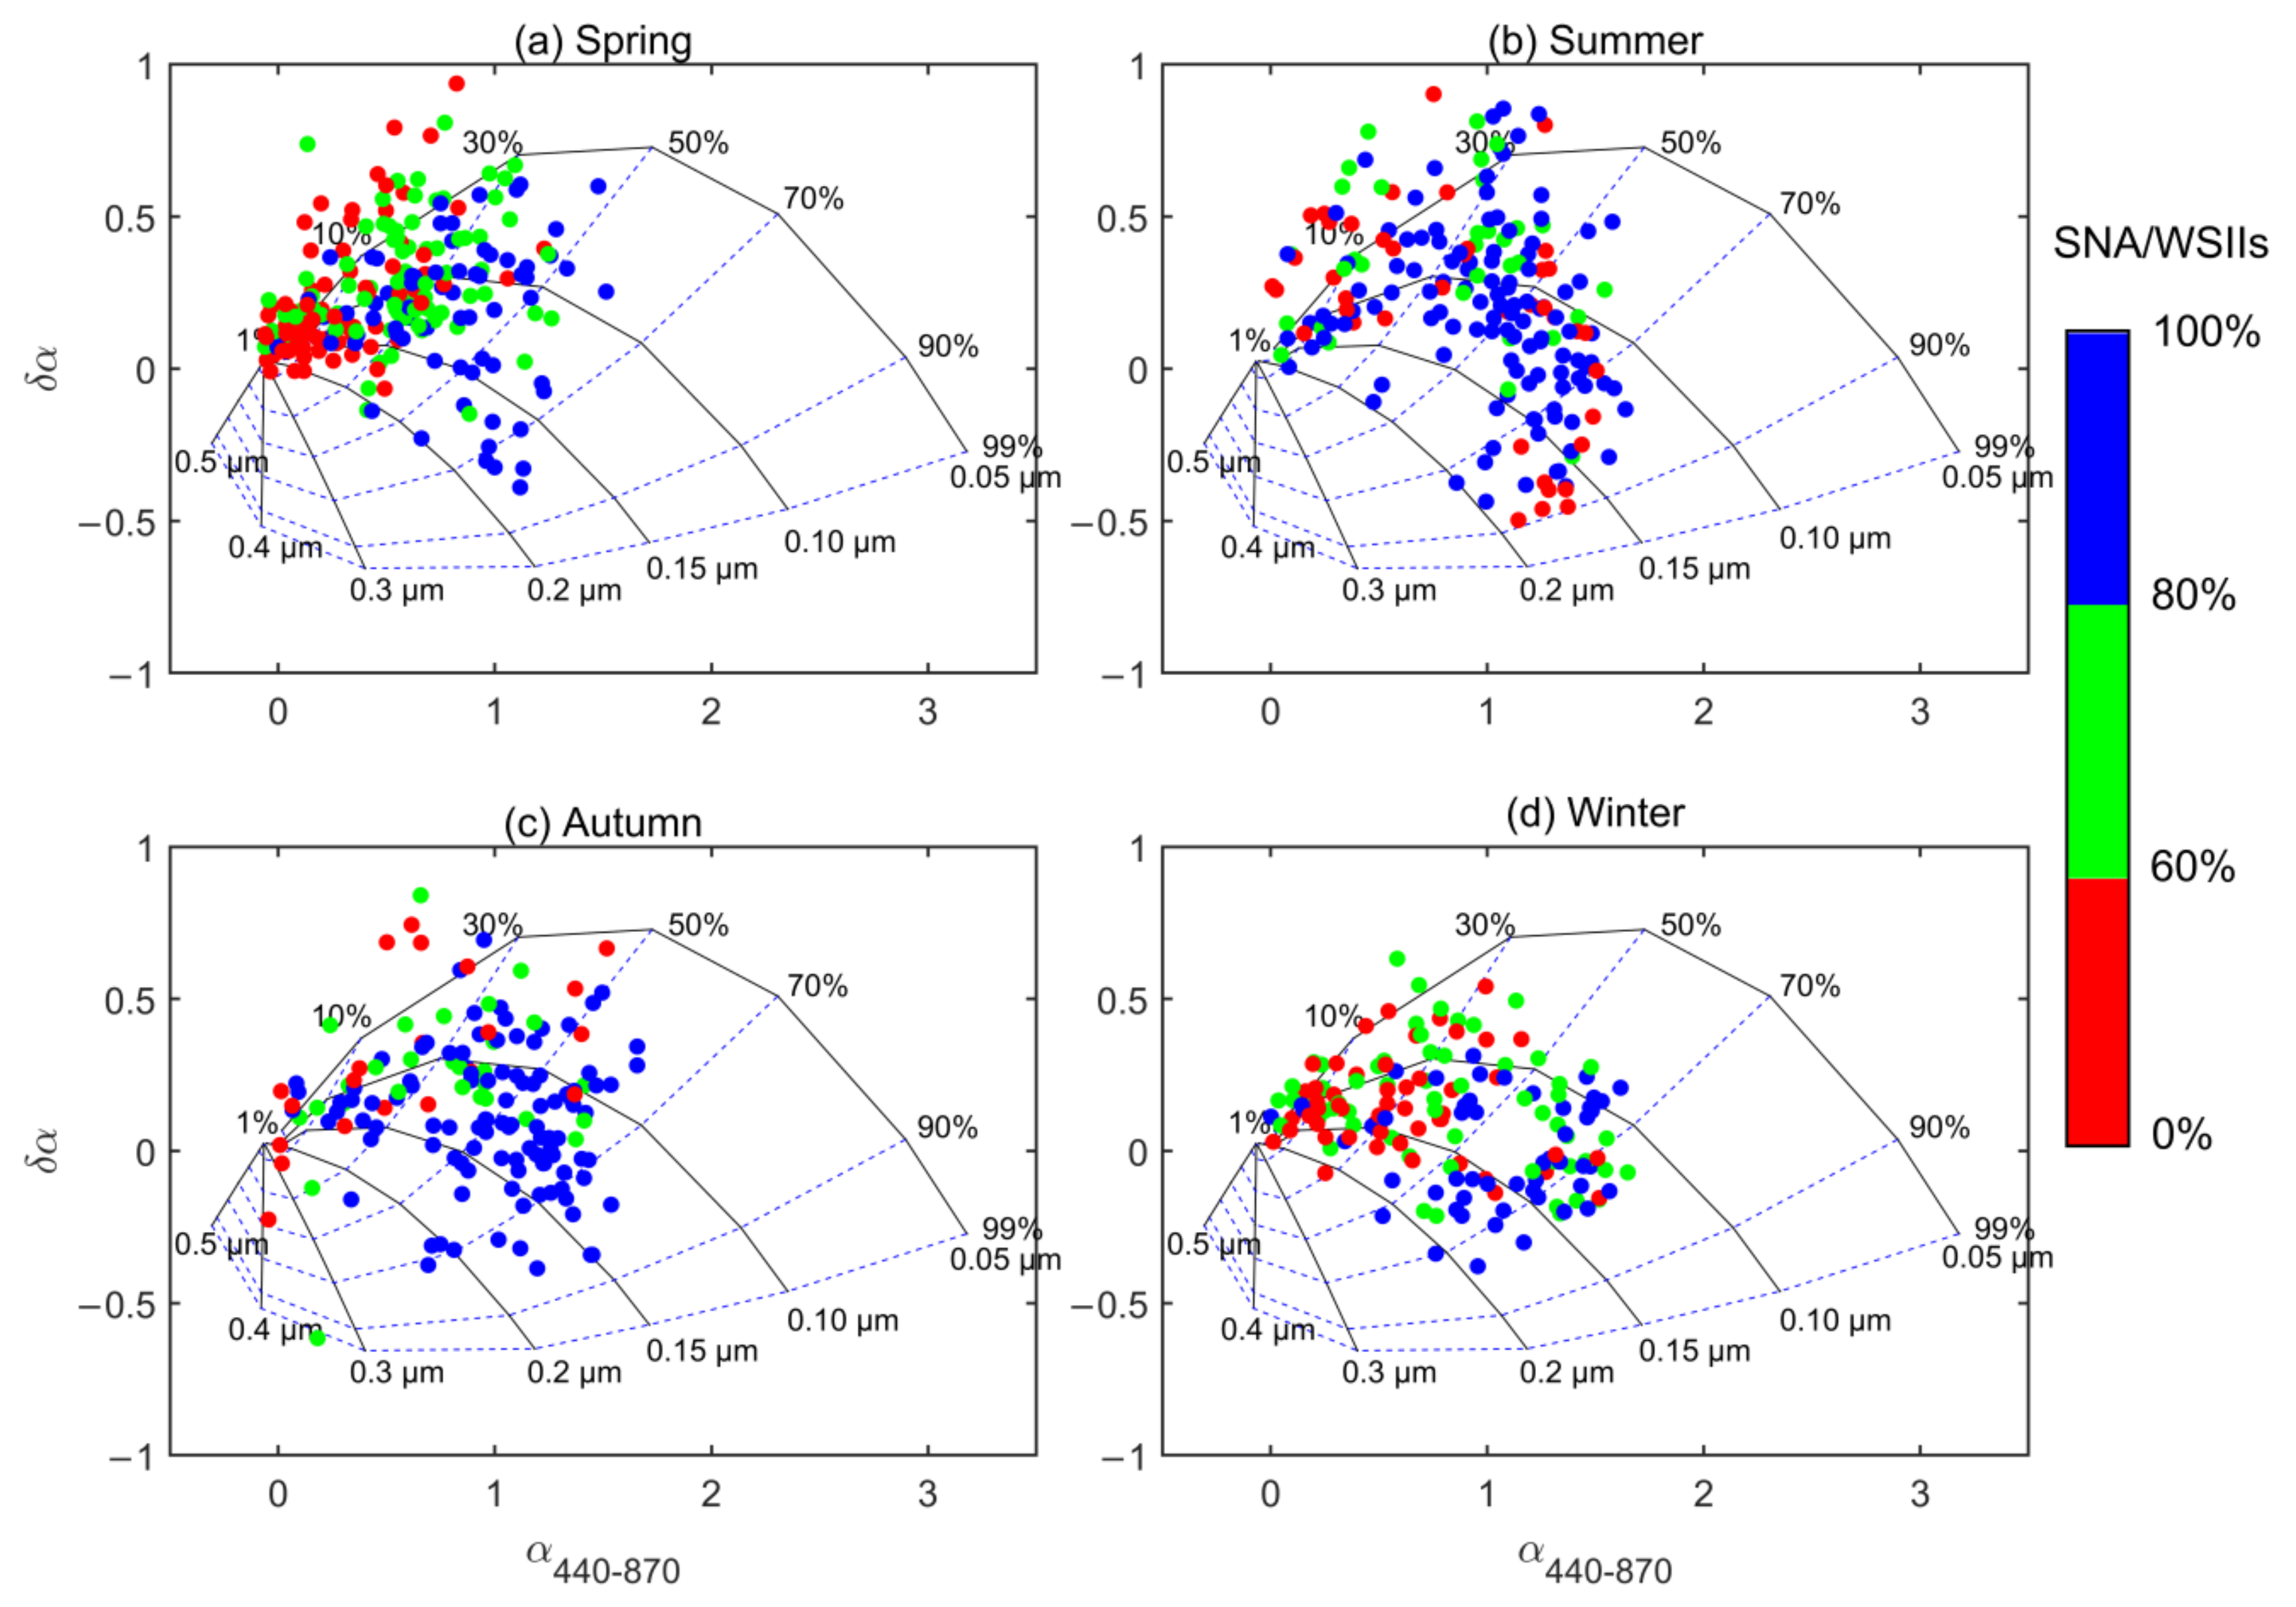
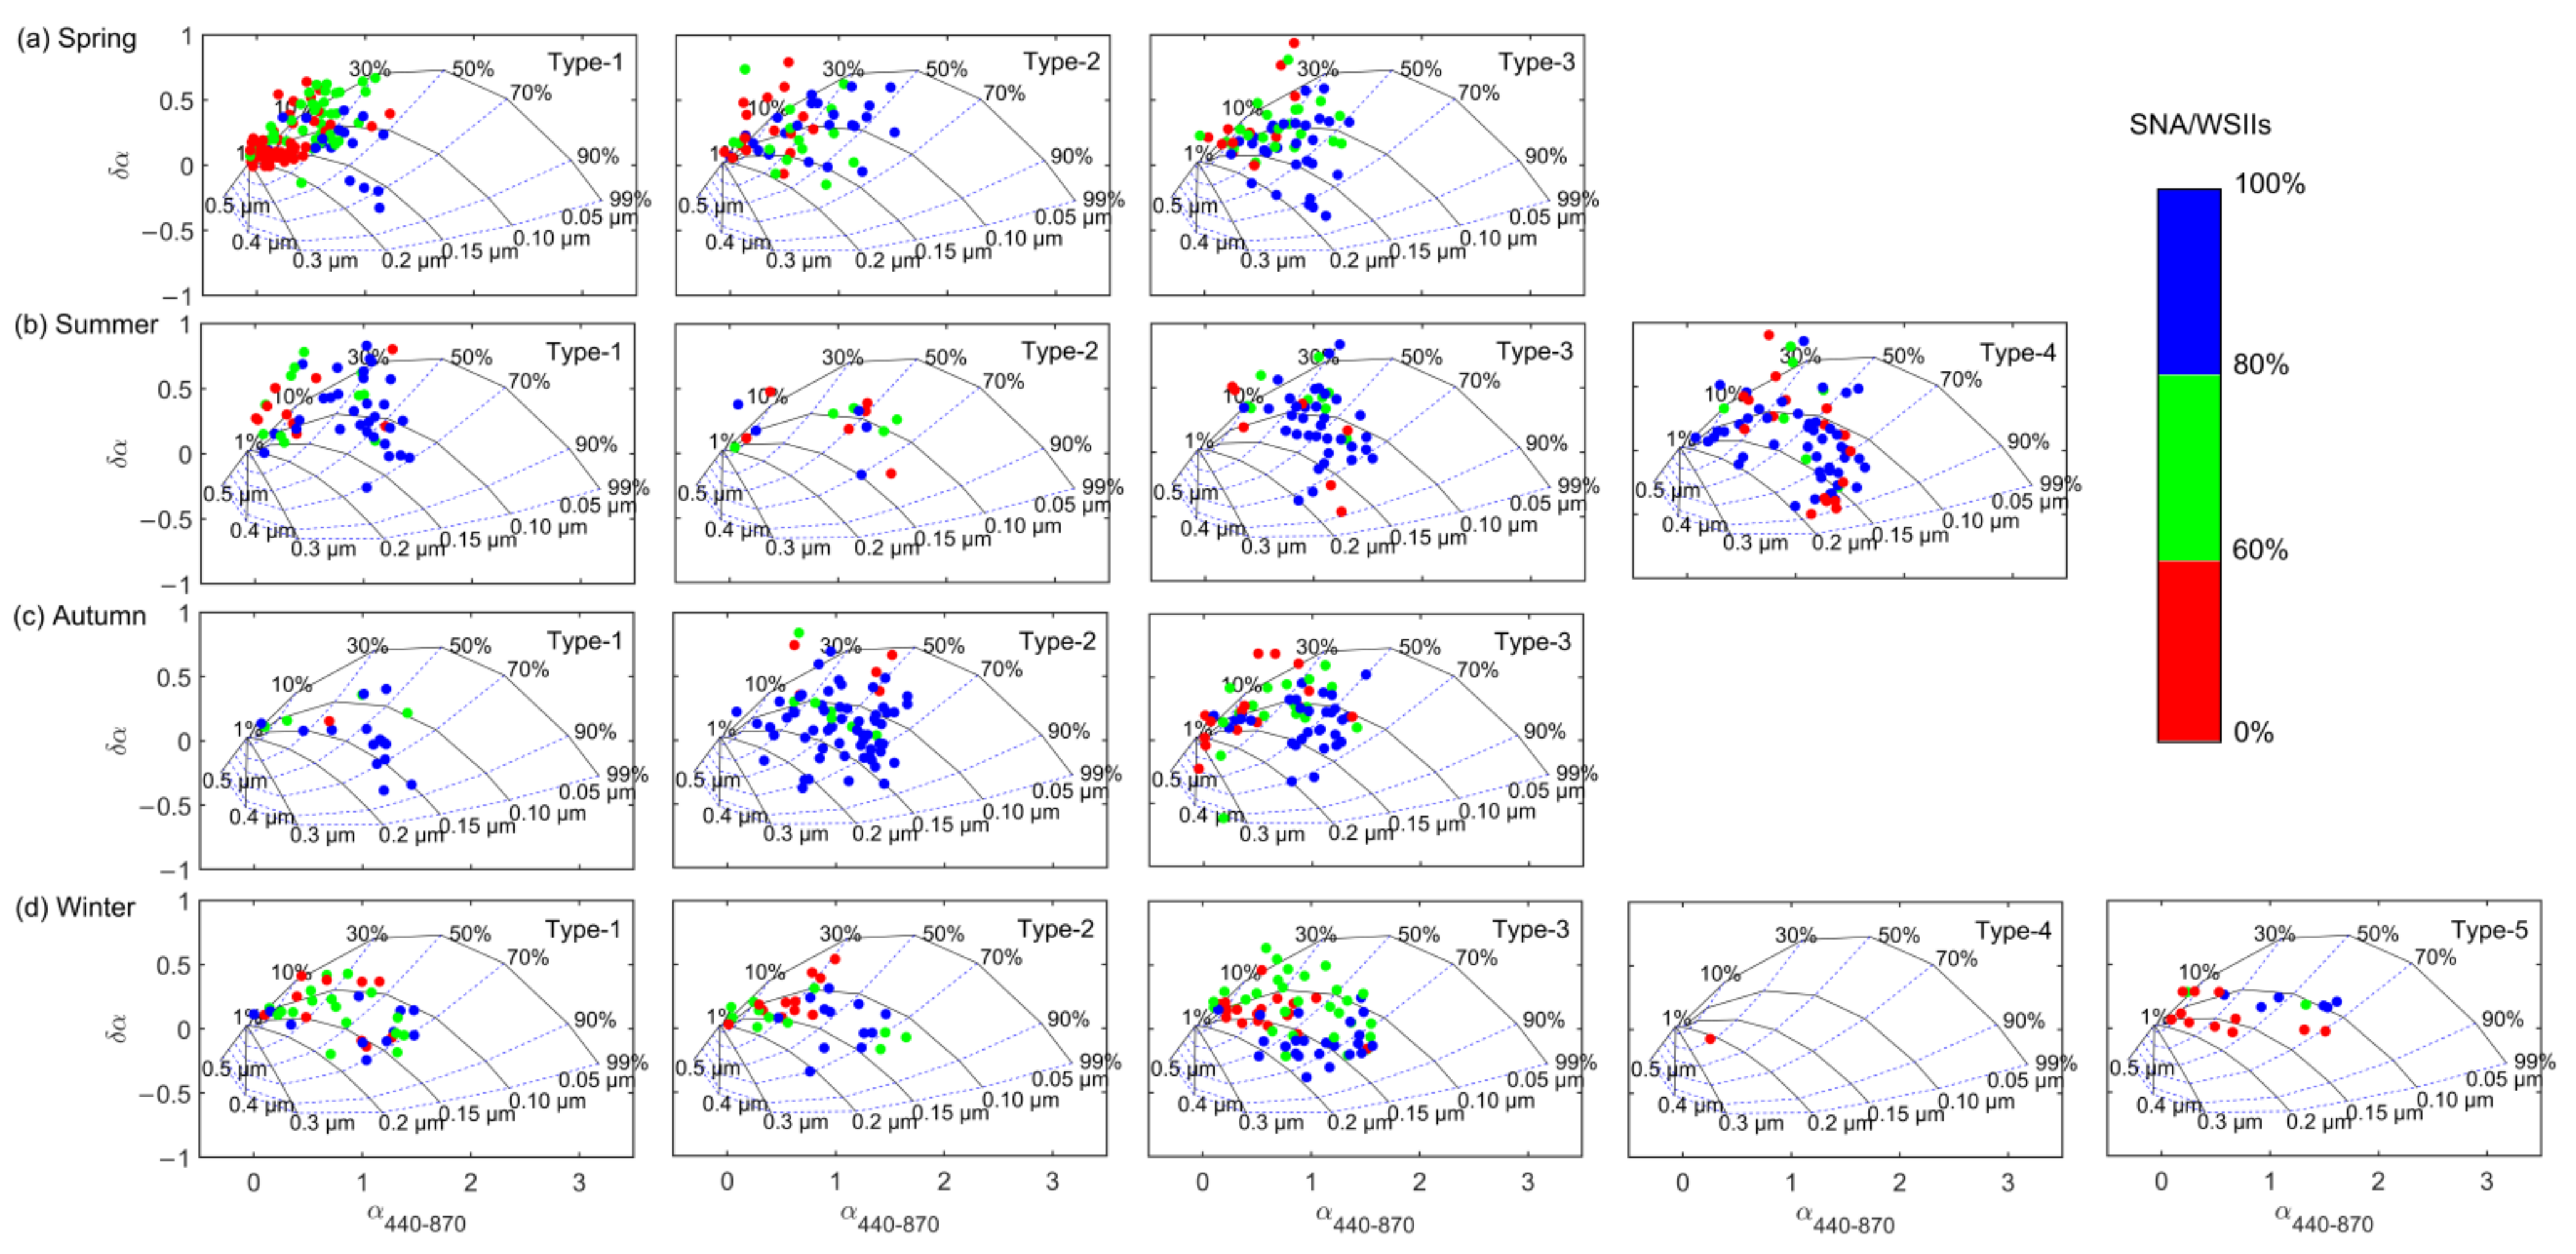
Dust aerosols suspended in urban Hohhot all year and larger fine mode particles contributed to higher aerosol extinction. Severe dust storms accompanied with high Ca2+/WSIIs of >40% distributed in the domain of {δα > 0, η < 30%} mainly occurred in the Type-1 trajectory in spring, while the dust events appearing in other trajectories appeared to be less frequent and weaker (20% < Ca2+/WSIIs < 40%).

Author Contributions

Conceptualization, J.X.; methodology, Y.M. (Yongjing Ma); software, Y.M. (Yongjing Ma); validation, Y.M. (Yongjing Ma), Y.M. (Yining Ma) and J.X.; formal analysis, J.X. and Y.M. (Yongjing Ma); investigation, J.X. and Y.M. (Yongjing Ma); resources, Y.R. and Y.T.; data curation, Y.R. and Y.T.; writing—original draft preparation, J.X. and Y.M. (Yongjing Ma); writing—review and editing, Z.W., X.P., L.W., Y.R. and Y.T.; visualization, Y.M. (Yongjing Ma); supervision, J.X.; project administration, J.X., L.W. and Y.M. (Yongjing Ma); funding acquisition, J.X., L.W. and Y.M. (Yongjing Ma). All authors have read and agreed to the published version of the manuscript.

Funding

This research was funded by the major science and technology project of Inner Mongolia Autonomous Region (2020ZD0013), the National Natural Science Foundation of China (42061130215), the Royal Society (NAF\R1\201354), and the China Postdoctoral Science Foundation (2021M700140).

Data Availability Statement

Please contact to [email protected] for data requirement.

Acknowledgments

This study was supported by the major science and technology project of Inner Mongolia Autonomous Region (2020ZD0013), the National Natural Science Foundation of China (42061130215), the Royal Society (NAF\R1\201354), and the China Postdoctoral Science Foundation (2021M700140).

Conflicts of Interest

The authors declare no conflict of interest.

References

  1. Zheng, Z.F.; Zhao, C.; Lolli, S.; Wang, X.D.; Wang, Y.T.; Ma, X.Y.; Li, Q.C.; Yang, Y.J. Diurnal Variation of Summer Precipitation Modulated by Air Pollution: Observational Evidences in the Beijing Metropolitan Area. Environ. Res. Lett. 2020, 15, 094053. [Google Scholar] [CrossRef]
  2. Zong, L.; Yang, Y.J.; Gao, M.; Wang, H.; Wang, P.; Zhang, H.L.; Wang, L.L.; Ning, G.C.; Liu, C.; Li, Y.B.; et al. Large-scale synoptic drivers of co-occurring summertime ozone and PM2.5 pollution in eastern China. Atmos. Chem. Phys. 2021, 21, 9105–9124. [Google Scholar] [CrossRef]
  3. Che, H.Z.; Yang, Z.F.; Zhang, X.Y.; Zhu, C.Z.; Mac, Q.L.; Zhou, H.G.; Wang, P. Study on the aerosol optical properties and their relationship with aerosol chemical compositions over three regional background stations in China. Atmos. Environ. 2009, 43, 1093–1099. [Google Scholar] [CrossRef]
  4. Dubovik, O.; Smirnov, A.; Holben, B.N.; King, M.D.; Kaufman, Y.J.; Eck, T.F. Accuracy assessments of aerosol optical properties retrieved from Aerosol Robotic Network (AERONET) Sun and sky radiance measurements. J. Geophys. Res. 2000, 105, 9791–9806. [Google Scholar] [CrossRef] [Green Version]
  5. Stocker, T.F.; Qin, D.; Plattner, G.-K.; Tignor, M.M.H.L.; Simon, A.K.; Boschung, J.; Nauels, A.; Xia, Y.; Bex, B.; Midgley, B.M. IPCC 2013: Climate Change 2013: The Physical Science Basis. Contribution of Working Group I to the Fifth Assessment Report of the Intergovernmental Panel on Climate Change; Cambridge University Press: Cambridge, UK, 2013. [Google Scholar]
  6. Zhao, D.D.; Xin, J.Y.; Gong, C.S.; Quan, J.N.; Wang, Y.S.; Tang, G.Q.; Ma, Y.X.; Dai, L.D.; Wu, X.Y.; Liu, G.J.; et al. The impact threshold of the aerosol radiative forcing on the boundary layer structure in the pollution region. Atmos. Chem. Phys. 2021, 21, 5739–5753. [Google Scholar] [CrossRef]
  7. Ma, Y.J.; Ye, J.H.; Xin, J.Y.; Zhang, W.Y.; Vilà-Guerau de Arellano, J.; Wang, S.G.; Zhao, D.D.; Dai, L.D.; Ma, Y.X.; Wu, X.Y.; et al. The Stove, Dome, and Umbrella Effects of Atmospheric Aerosol on the Development of the Planetary Boundary Layer in Hazy Regions. Geophy. Res. Lett. 2020, 47, e2020GL087373. [Google Scholar] [CrossRef]
  8. Ma, Y.J.; Xin, J.Y.; Wang, Z.F.; Tian, Y.L.; Wu, L.; Tang, G.Q.; Zhang, W.Y.; Vilà-Guerau de Arellano, J.; Zhao, D.D.; Jia, D.J.; et al. How do aerosols above the residual layer affect the planetary boundary layer height? Sci. Total Environ. 2022, 814, 151953. [Google Scholar] [CrossRef]
  9. Kong, L.B.; Xin, J.Y.; Zhang, W.Y.; Wang, Y.S. The empirical correlations between PM2.5, PM10 and AOD in the Beijing metropolitan region and the PM2.5, PM10 distributions retrieved by MODIS. Environ. Pollut. 2016, 216, 350–360. [Google Scholar] [CrossRef]
  10. Wang, L.L.; Xin, J.Y.; Wang, Y.S.; Li, Z.Q.; Liu, G.R.; Li, J. Evaluation of the MODIS aerosol optical depth retrieval over different ecosystems in China during EAST-AIRE. Atmos. Environ. 2007, 41, 7138–7149. [Google Scholar] [CrossRef]
  11. Wang, L.L.; Wang, Y.S.; Xin, J.Y.; Li, Z.Q.; Wang, X.Y. Assessment and comparison of three years of Terra and Aqua MODIS aerosol. Atmos. Res. 2010, 97, 229–240. [Google Scholar] [CrossRef]
  12. Wang, H.; Li, J.W.; Gao, Z.Q.; Yim, S.H.L.; Shen, H.F.; Ho, H.C.; Li, Z.Y.; Zeng, Z.L.; Liu, C.; Li, Y.B.; et al. High-Spatial-Resolution Population Exposure to PM2.5 Pollution Based on Multi-Satellite Retrievals: A Case Study of Seasonal Variation in the Yangtze River Delta, China in 2013. Remote Sens. 2019, 11, 2724. [Google Scholar] [CrossRef] [Green Version]
  13. Tian, P.F.; Cao, X.J.; Zhang, L.; Sun, N.X.; Sun, L.; Logan, T.; Shi, J.S.; Wang, Y.; Ji, Y.M.; Lin, Y.; et al. Aerosol vertical distribution and optical properties over China from long-term satellite and ground-based remote sensing. Atmos. Chem. Phys. 2017, 17, 2509–2523. [Google Scholar] [CrossRef] [Green Version]
  14. Che, H.Z.; Zhang, X.Y.; Xia, X.A.; Goloub, P.; Holben, B.; Zhao, H.; Wang, Y.; Zhang, X.-C.; Wang, H.; Blarel, L.; et al. Ground-based aerosol climatology of china: Aerosol optical depths from the china aerosol remote sensing network (CARSNET) 2002–2013. Atmos. Chem. Phys. 2015, 15, 7619–7652. [Google Scholar] [CrossRef] [Green Version]
  15. Xin, J.Y.; Wang, Y.S.; Li, Z.Q.; Wang, P.C.; Hao, W.M.; Bryce Nordgren, L.; Wang, S.G.; Liu, G.R.; Wang, L.L.; Wen, T.X.; et al. Aerosol optical depth (AOD) and Ångström exponent of aerosols observed by the chinese sun hazemeter network from August 2004 to September 2005. J. Geophys. Res. 2007, 27, 1703–1711. [Google Scholar] [CrossRef]
  16. Xin, J.Y.; Wang, Y.S.; Pan, Y.P.; Ji, D.S.; Liu, Z.R.; Wen, T.X.; Wang, Y.H.; Li, X.R.; Sun, Y.; Sun, J.; et al. The campaign on atmospheric aerosol research network of china: Care-china. Bull. Am. Meteorol. Soc. 2015, 96. [Google Scholar] [CrossRef]
  17. Chen, J.S.; Xin, J.Y.; An, J.L.; Wang, Y.S.; Liu, Z.R.; Chao, N.; Meng, Z. Observation of aerosol optical properties and particulate pollution at background station in the Pearl River Delta region. Atmos. Res. 2014, 143, 216–227. [Google Scholar] [CrossRef]
  18. Xin, J.Y.; Wang, L.L.; Wang, Y.S.; Li, Z.Q.; Wang, P.C. Trends in aerosol optical properties over the Bohai Rimin Northeast China from 2004 to 2010. Atmos. Environ. 2011, 45, 6317–6325. [Google Scholar] [CrossRef]
  19. Xin, J.Y.; Zhang, Q.; Gong, C.S.; Wang, Y.S.; Du, W.P.; Zhao, Y.F. Aerosol direct radiative forcing over Shandong Peninsula in East Asia from 2004 to 2011. Atmos. Ocean Sci. Lett. 2014, 7, 74–79. [Google Scholar]
  20. Zhao, H.J.; Che, H.Z.; Ma, Y.J.; Xia, X.A.; Wang, Y.F.; Wang, P.; Wu, X.C. Temporal variability of the visibility, particulate matter mass concentration and aerosol optical properties over an urban site in Northeast China. Atmos. Res. 2015, 166, 204–212. [Google Scholar] [CrossRef]
  21. Ma, Y.J.; Xin, J.Y.; Zhang, W.Y.; Wang, Y.S. Optical properties of aerosols over a tropical rain forest in Xishuangbanna, South Asia. Atmos. Res. 2016, 178, 187–195. [Google Scholar] [CrossRef]
  22. Ma, Y.J.; Xin, J.Y.; Ma, Y.N.; Kong, L.B.; Zhang, K.Q.; Zhang, W.Y.; Wang, Y.S.; Wang, X.Q.; Zhu, Y.F. Optical properties and source analysis of aerosols over a desert area in Dunhuang, Northwest China. Adv. Atmos. Sci. 2017, 34, 1017–1026. [Google Scholar] [CrossRef]
  23. Ma, Y.N.; Xin, J.Y.; Zhang, W.Y.; Liu, Z.R.; Ma, Y.J.; Kong, L.B.; Wang, Y.S.; Deng, Y.; Lin, S.H.; He, Z.M. Long-term variations of the PM2.5 concentration identified by MODIS in the tropical rain forest, Southeast Asia. Atmos. Res. 2018, 219, 140–152. [Google Scholar] [CrossRef]
  24. Su, H.J.; Xin, J.Y.; Ma, Y.J.; Liu, Z.R.; Wen, T.X.; Wang, S.G.; Fan, G.Z.; Li, W.; Wang, L.; He, Z.M.; et al. Effects of transport on aerosols over the eastern slope of the Tibetan Plateau: Synergistic contribution of Southeast Asia and the Sichuan Basin. Atmos. Ocean Sci. Lett. 2018, 11, 425–431. [Google Scholar] [CrossRef] [Green Version]
  25. Zhao, D.D.; Xin, J.Y.; Gong, C.S.; Wang, X.; Ma, Y.J.; Ma, Y.N. Trends of aerosol optical properties over the heavy industrial zone of northeastern Asia in the past decade (2004–2015). J. Atmos. Sci. 2018, 75, 1741–1754. [Google Scholar] [CrossRef]
  26. Ma, Y.N.; Xin, J.Y.; Zhang, W.Y.; Gong, C.S.; Wen, T.X.; Wu, X.Y.; Wang, Y.S.; Wang, L.L.; Wu, F.K.; Ding, X. Uncertainties of simulated aerosol direct radiative effect induced by aerosol chemical components: A measurement-based perspective from urban-forest transition region in east china. J. Geophys. Res. 2021, 126, e2020JD033688. [Google Scholar] [CrossRef]
  27. Ren, X.B.; Xin, J.Y.; Wu, J.S.; Gong, C.S.; Gao, W.K.; Zhao, D.D.; Ma, Y.J. The relationship between PM 2.5 pollution and aerosol radiative forcing in a heav y industrial city, Taiyuan, in China. Atmos. Res. 2021, 267, 105935. [Google Scholar] [CrossRef]
  28. Shao, P.; Xin, J.Y.; Zhang, X.L.; Gong, C.S.; Ma, Y.J.; Wang, Y.S.; Wang, S.G.; Hu, B.; Ren, X.B.; Wang, B.Y. Aerosol optical properties and their impacts on the co–occurrence of surface ozone and particulate matter in Kunming City, on the Yunnan–Guizhou Plateau of China. Atmos. Res. 2021, 266, 105963. [Google Scholar] [CrossRef]
  29. Zhang, K.Q.; Ma, Y.J.; Xin, J.Y.; Liu, Z.R.; Ma, Y.N.; Gao, D.D.; Wu, J.S.; Zhang, W.Y.; Wang, Y.S.; Shen, P.K. The aerosol optical properties and PM2.5 components over the world’s largest industrial zone in tangshan, north china. Atmos. Res. 2018, 201, 226–234. [Google Scholar] [CrossRef]
  30. He, Q.S.; Li, C.C.; Geng, F.H.; Yang, H.Q.; Li, P.R.; Li, T.T.; Li, D.W.; Pei, Z. Aerosol optical properties retrieved from Sun photometer measurements over Shanghai, China. J. Geophys. Res. 2012, 117, D16204. [Google Scholar] [CrossRef] [Green Version]
  31. Na, K.; Kumar, K.R.; Yu, X.N.; Yin, Y. Column-integrated aerosol optical properties and direct radiative forcing over the urban-industrial megacity Nanjing in the Yangtze River Delta, China. Environ. Sci. Pollut. Res. 2016, 23, 17532–17552. [Google Scholar]
  32. Wang, L.C.; Gong, W.; Xia, X.A.; Zhu, J.; Li, J.; Zhu, Z.M. Long-term observations of aerosol optical properties at Wuhan, an urban site in Central China. Atmos. Environ. 2014, 101, 94–102. [Google Scholar] [CrossRef]
  33. Wu, X.Y.; Xin, J.Y.; Zhang, W.Y.; Gong, C.S.; Ma, Y.N.; Ma, Y.J.; Wen, T.X.; Liu, Z.R.; Tian, S.L.; Wang, Y.S.; et al. Optical, Radiative and Chemical Characteristics of Aerosol in Changsha City, Central China. Adv. Atmos. Sci. 2020, 37, 1310–1322. [Google Scholar] [CrossRef]
  34. Mao, J.D.; Sheng, H.J.; Zhao, H.; Zhou, C.Y. Observation Study on the Size Distribution of Sand Dust Aerosol Particles over Yinchuan, China. Adv. Meteorol. 2015, 2014, 1–7. [Google Scholar] [CrossRef]
  35. Zhu, J.; Xia, X.A.; Che, H.Z.; Wang, J.; Zhang, J.; Duan, Y. Study of aerosol optical properties at Kunming in southwest China and long-range transport of biomass burning aerosols from North Burma. Atmos. Res. 2015, 169, 237–247. [Google Scholar] [CrossRef]
  36. Eck, T.F.; Holben, B.N.; Reid, J.S.; Dubovik, O.; Smirnov, A.; O’Neill, N.T.; Slutsker, I.; Kinne, S. Wavelength dependence of the optical depth of biomass burning, urban, and desert dust aerosols. J. Geophys. Res. 1999, 104, 31333–31349. [Google Scholar] [CrossRef]
  37. Kasten, F. A new table and approximate formula for relative optical air mass. Arch. Meteorol. Geophys. Bioclimatol. 1966, 14, 206–233. [Google Scholar] [CrossRef]
  38. Kasten, F.; Young, A.T. Revised optical air mass tables and approximation formula. Appl. Opt. 1989, 28, 4735–4738. [Google Scholar] [CrossRef]
  39. Komhyr, W.D.; Mateer, C.L.; Hudson, R.D. Operations handbook—Ozone observations with a Dobson Spectrophotometer. In WMO Global Ozone Research and Monitoring Project 1980, Report No.6; WMO: Geneva, Switzerland, 1980. [Google Scholar]
  40. Fröhlich, C.; Shaw, G.E. New determination of Rayleigh scattering in the terrestrial atmosphere. Appl. Opt. 1980, 19, 1773–1775. [Google Scholar] [CrossRef]
  41. Ångström, A. The parameters of atmospheric turbidity. Tellus 1964, 16, 64–75. [Google Scholar] [CrossRef] [Green Version]
  42. Rumery, I.C.; Cowen, K.A.; Walker, J.T.; Kelly, T.J.; Hanft, E.A.; Mishoe, K.; Roers, C.; Proost, R.; Beachley, G.M.; Lear, G.; et al. Anassessment of the performance of the Monitor for AeRosols and Gases in ambient air (MARGA): A semi-continuous method for soluble compounds. Atmos. Chem. Phys. 2014, 14, 5639–5658. [Google Scholar]
  43. Chen, X.; Walker, J.T.; Geron, C. Chromatography related performance of the Monitor for AeRosols and Gases in ambient air (MARGA): Laboratory and field-based evaluation. Atmos. Meas. Tech. 2017, 10, 3893–3908. [Google Scholar] [CrossRef] [PubMed] [Green Version]
  44. Birch, M.E.; Cary, R.A. Elemental carbon-based method for monitoring occupational exposures to particulate diesel exhaust. Aerosol Sci. Technol. 1996, 25, 221–241. [Google Scholar] [CrossRef]
  45. Pang, B.; Ji, D.S.; Liu, Z.R.; Zhu, B.; Wang, Y.S. Comparison of Monitoring Methods of Organic Carbon and Element Carbon in Atmospheric Fine Particles. Environ. Sci. 2016, 37, 1230–1239. [Google Scholar]
  46. Standard Operating Procedure (SOP) For the Analysis of Organic and Elemental Carbon (OC/EC) Using the Sunset Laboratory Semi-Continuous Carbon Aerosol Analyzer. Available online: https://www.epa.gov/sites/default/files/2019-05/documents/sunset_sop_draft030212.pdf#:~:text=This%20Standard%20Operating%20Procedure%20%28SOP%29%20describes%20the%20operation%20in%20fine%20particulate%20matter%20%28PM%202.5%20ThePM%202.5 (accessed on 26 April 2022).
  47. Ram, K.; Sarin, M.M. Day–night variability of EC, OC, WSOC and inorganic ions in urban environment of Indo-Gangetic Plain: Implications to secondary aerosol formation. Atmos. Environ. 2011, 45, 460–468. [Google Scholar] [CrossRef]
  48. Huang, X.J.; Liu, Z.R.; Liu, J.Y.; Hu, B.; Wen, T.X.; Tang, G.Q.; Zhang, J.K.; Wu, F.K.; Ji, D.S.; Wang, L.L.; et al. Chemical characterization and source identification of PM2.5 at multiple sites in the Beijing-Tianjin-Hebei region, China. Atmos. Chem. Phys. 2017, 17, 12941–12962. [Google Scholar] [CrossRef]
  49. Wang, Y.; Wen, Y.P.; Cui, Y.; Guo, L.L.; He, Q.S.; Li, H.Y.; Wang, X.M. Substantial changes of chemical composition and sources of fne particles during the period of COVID-19 pandemic in Taiyuan, Northern China. Air Qual. Atmos. Health 2022, 15, 47–58. [Google Scholar] [CrossRef]
  50. Cao, J.J.; Lee, S.C.; Chow, J.C.; Watson, J.G.; Ho, K.F.; Zhang, R.J.; Jin, Z.D.; Shen, Z.X.; Chen, G.C.; Kang, Y.M.; et al. Spatial and seasonal distributions of carbonaceous aerosols over China. J. Geophys. Res. 2007, 112, D22S11. [Google Scholar] [CrossRef] [Green Version]
  51. Wang, Y.Q.; Zhang, X.Y.; Draxler, R.R. Trajstat: Gis-based software that uses various trajectory statistical analysis methods to identify potential sources from long-term air pollution measurement data. Environ. Model. Softw. 2009, 24, 938–939. [Google Scholar] [CrossRef]
  52. Gobbi, G.P.; Kaufman, Y.J.; Koren, I.; Eck, T.F. Classification of aerosol properties derived from AERONET direct sun data. Atmos. Chem. Phys. 2007, 7, 8713–8726. [Google Scholar] [CrossRef] [Green Version]
  53. Cheng, T.T.; Xu, C.; Duan, J.Y.; Wang, Y.F.; Leng, C.P.; Tao, J.; Che, H.Z.; He, Q.Q.; Wu, Y.F.; Zhang, R.J.; et al. Seasonal variation and difference of aerosol optical properties in columnar and surface atmospheres over Shanghai. Atmos. Environ. 2015, 123, 315–326. [Google Scholar] [CrossRef]
  54. Wang, P.; Che, H.Z.; Zhang, X.C.; Song, Q.L.; Wang, Y.Q.; Zhang, Z.H.; Dai, X.; Yu, D.J. Aerosol optical properties of regional background atmosphere in Northeast China. Atmos. Environ. 2010, 44, 4404–4412. [Google Scholar] [CrossRef]
  55. Li, S.; Wang, T.; Xie, M.; Han, Y.; Zhuang, B. Observed aerosol optical depth and angstrom exponent in urban area of Nan, China. Atmos. Environ. 2015, 123, 350–356. [Google Scholar] [CrossRef]
Figure 1. (a) The geophysical location of Hohhot city, marked with red star. Four zones are divided with the north section of zone I of Mongolian plateau, the northwest section of zone II of Desert/Gobi, the southwest section of zone III of Tibet plateau, and the east-Asia section of zone IV of urban agglomeration. (b) Map of Hohhot city. The right three panels are the CEMIL sun-photometer, OC/EC online analyzer, and MARGA ADI2080.
Atmosphere 13 00737 g001
Figure 2. Statistics for mean values and standard deviations of AOD500 (light green) and Ångström exponent α440-675 (light blue). Monthly variation of (a) AOD500 and (b) α440-675; (c) seasonal and (d) yearly variation of AOD500 and α440-675.
Atmosphere 13 00737 g002
Figure 3. Seasonal backward-trajectory clustering of Hohhot city. (a) Spring, (b) Summer, (c) Autumn, and (d) Winter. The blue lines denote the trajectories at 12:00 (local time) for each AOD-observed day in each season.
Atmosphere 13 00737 g003
Figure 4. The accounting proportion of different chemical compositions of different air masses in (a) spring, (b) summer, (c) autumn, and (d) winter. The numerical values above each bar denote the sum of ionic composition and carbonaceous aerosols with unit of μg m−3.
Atmosphere 13 00737 g004
Figure 5. Ångström exponent (α440-870) as a function of Ångström exponent difference (δα = α440-675α675-870) for (a) spring, (b) summer, (c) autumn, and (d) winter. The AOD670 is used for analysis and different color dots denote different AOD sections, as shown in the right color bar. Only cloud-screened data with AOD670 > 0.15 were used.
Atmosphere 13 00737 g005
Figure 6. Same as Figure 5, but for different Ca2+/WSIIs level.
Atmosphere 13 00737 g006
Figure 7. Same as Figure 5. But for different SNA/WSIIs (SNA: major components of WSIIs of sulfate, nitrate and ammonium) levels.
Atmosphere 13 00737 g007
Figure 8. Same as Figure 5, but for different trajectory clusters in different Ca2+/WSIIs levels.
Atmosphere 13 00737 g008
Figure 9. Same as Figure 5, but for different trajectory clusters in different SNA/WSIIs levels.
Atmosphere 13 00737 g009
Table 1. Attributes of different air masses and the corresponding AOD500, α440-675, and wind speed (WS) mean values in different seasons.
Type-1Type-2Type-3Type-4Type-5
SpringOriginKazakhstan/Xinjiang ProvinceMongoliaShaanxi Province--
Direction/
distance
Northwest/LongNorth/MediumSouth/Short--
Percentage46.37%35.75%17.88%--
AOD5000.45 ± 0.400.30 ± 0.290.78 ± 0.46--
α440-6750.73 ± 0.471.02 ± 0.480.72 ± 0.36--
WS (m s−1)2.95 ± 0.962.87 ± 1.042.36 ± 0.68
SummerOriginMongoliaMongoliaInner MongoliaShanxi and Henan Provinces-
Direction/distanceNorthwest/LongNorth/MediumNorthwest/ShortSouth/Short-
Percentage24.23%21.17%29.14%25.46%-
AOD5000.29 ± 0.170.20 ± 0.150.31 ± 0.190.65 ± 0.42-
α440-6751.08 ± 0.481.37 ± 0.471.27 ± 0.381.14 ± 0.39-
WS (m s−1)2.24 ± 0.682.49 ± 0.862.06 ± 0.641.98 ± 0.47
AutumnOriginMongoliaInner MongoliaKazakhstan--
Direction/
distance
Northwest/MediumLocalWest/Long--
Percentage23.42%36.29%40.19%--
AOD5000.24 ± 0.290.46 ± 0.410.33 ± 0.35--
α440-6751.32 ± 0.401.26 ± 0.401.01 ± 0.44--
WS (m s−1)2.16 ± 0.831.91 ± 0.612.42 ± 1.05
WinterOriginInner MongoliaKazakhstanXinjiang ProvinceRussiaRussia
Direction/
distance
West/ShortWest/LongWest/MediumNorth/LongNorthwest/Long
Percentage17.98%14.20%39.12%8.20%20.50%
AOD5000.52 ± 0.430.50 ± 0.400.40 ± 0.350.13 ± 0.080.19 ± 0.13
α440-6751.07 ± 0.480.89 ± 0.431.09 ± 0.441.21 ± 0.421.11 ± 0.45
WS (m s−1)1.63 ± 0.581.94 ± 0.791.79 ± 0.723.19 ± 1.372.48 ± 1.11
Publisher’s Note: MDPI stays neutral with regard to jurisdictional claims in published maps and institutional affiliations.

