Comparative Analysis of SCMOC and Models Rainstorm Forecasting Performance in Qinling Mountains and Their Surrounding Areas

Abstract
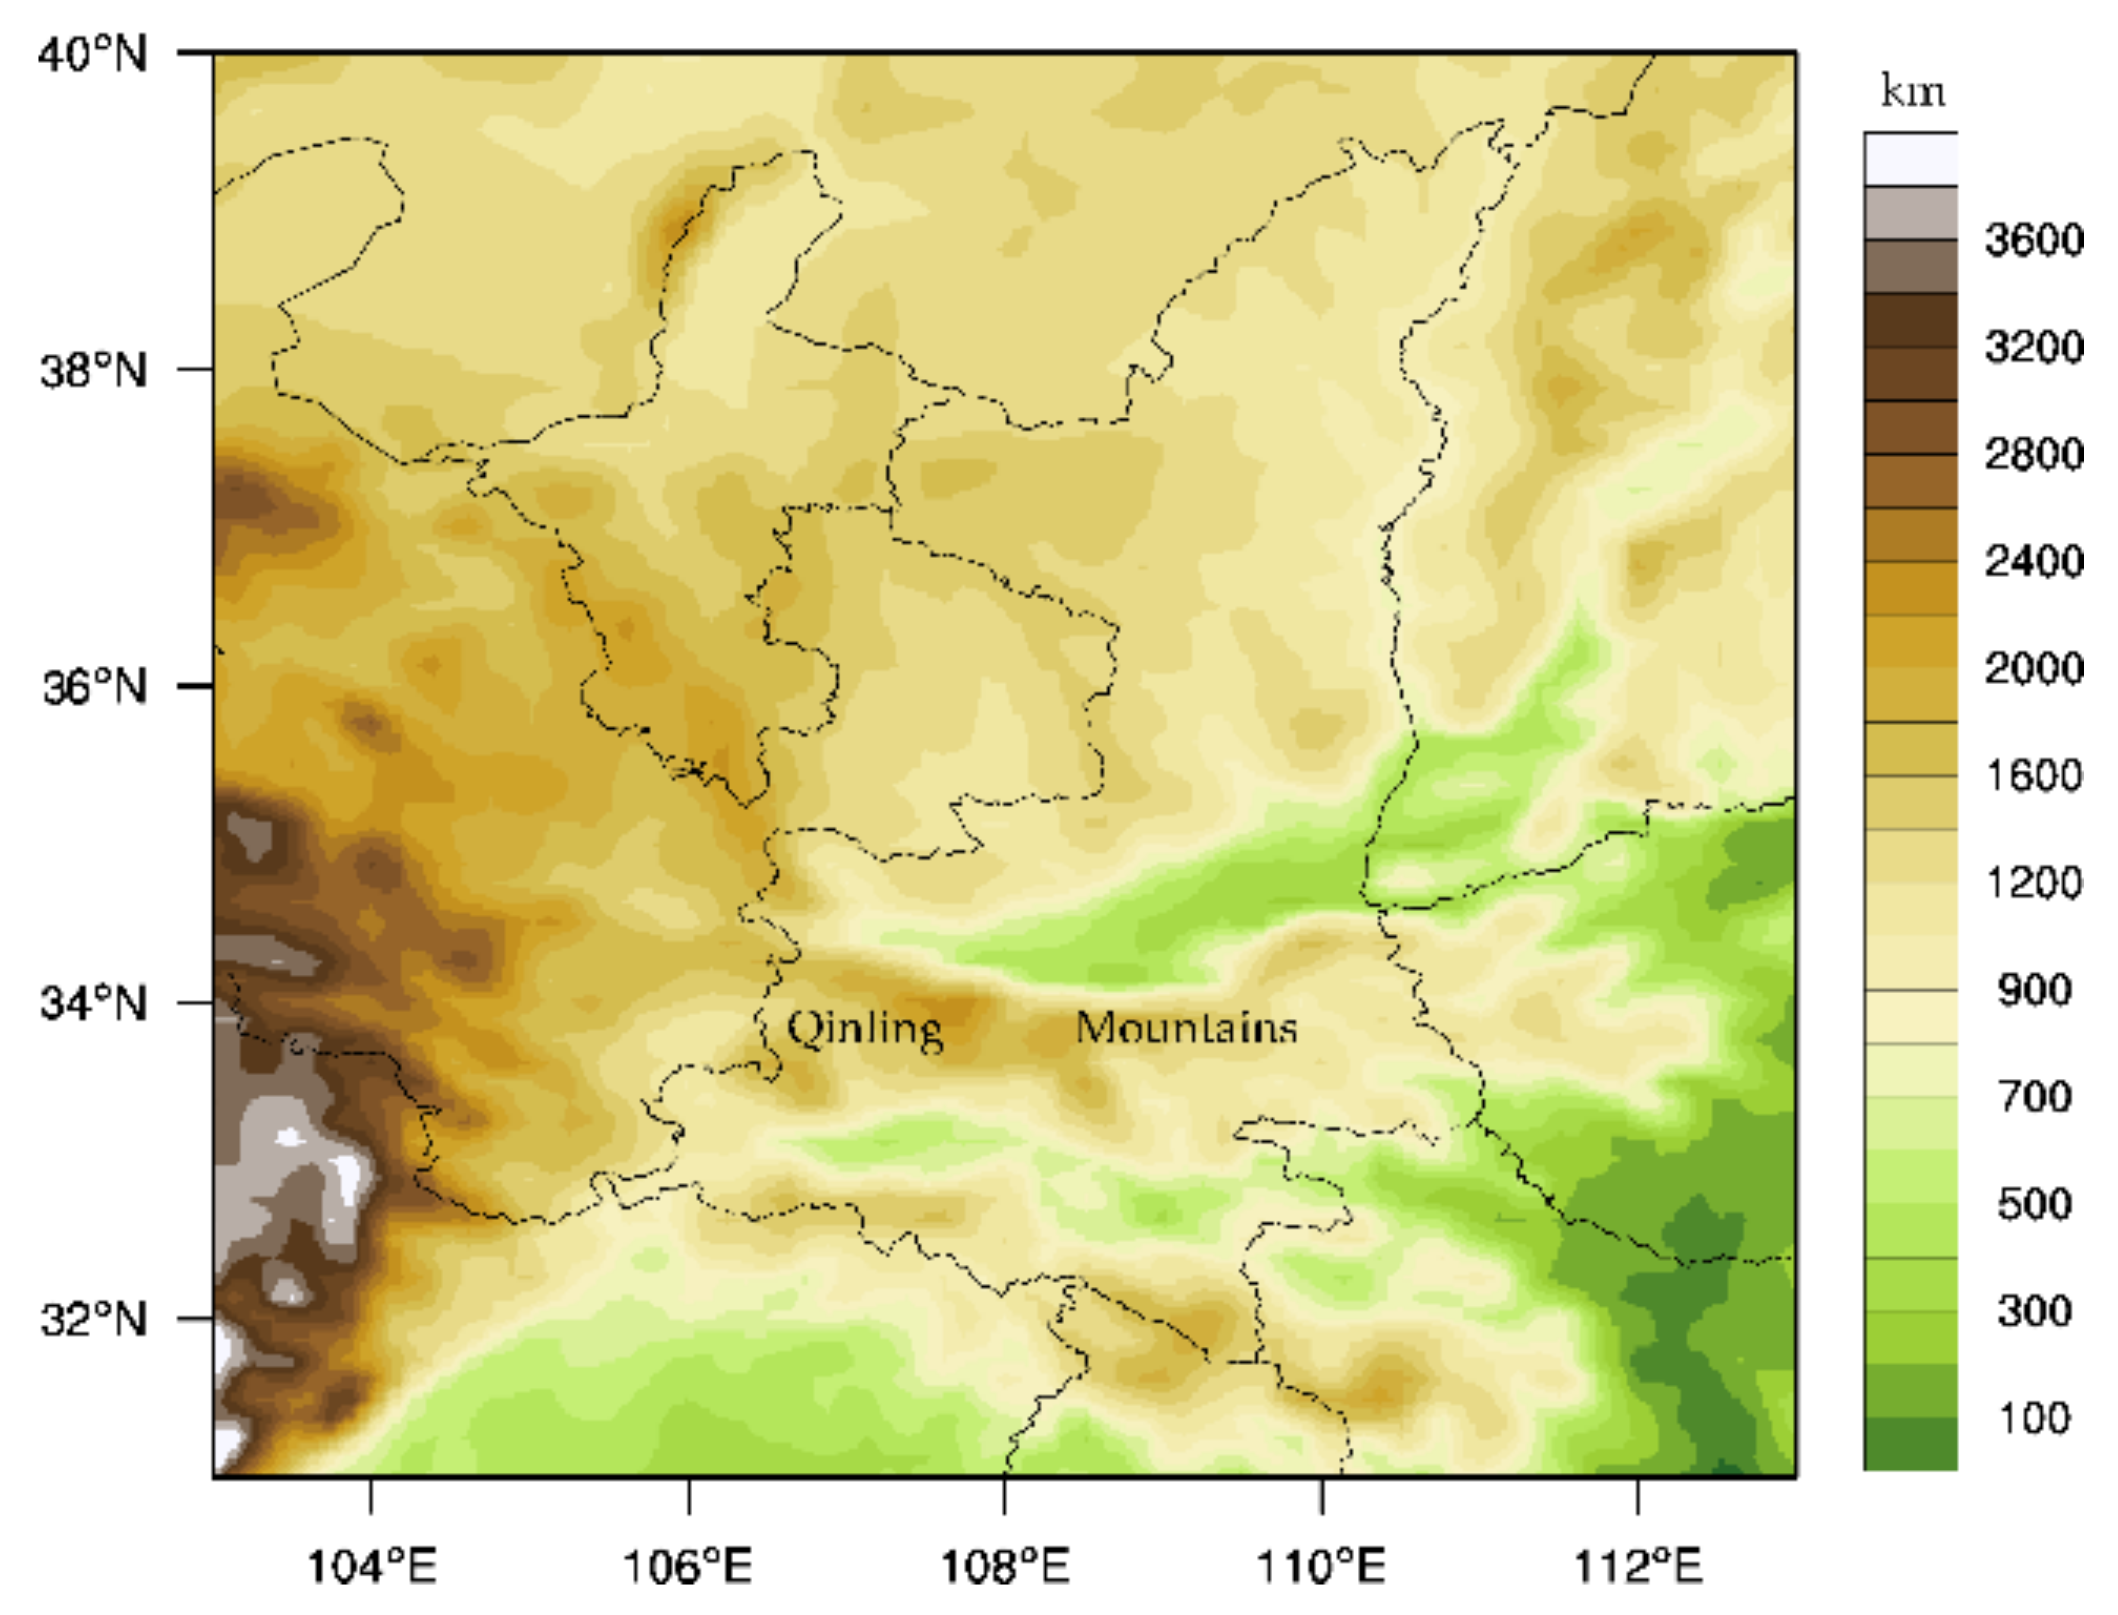
:1. Introduction
2. Data and Methods
2.1. Data
2.2. Methods
3. Results
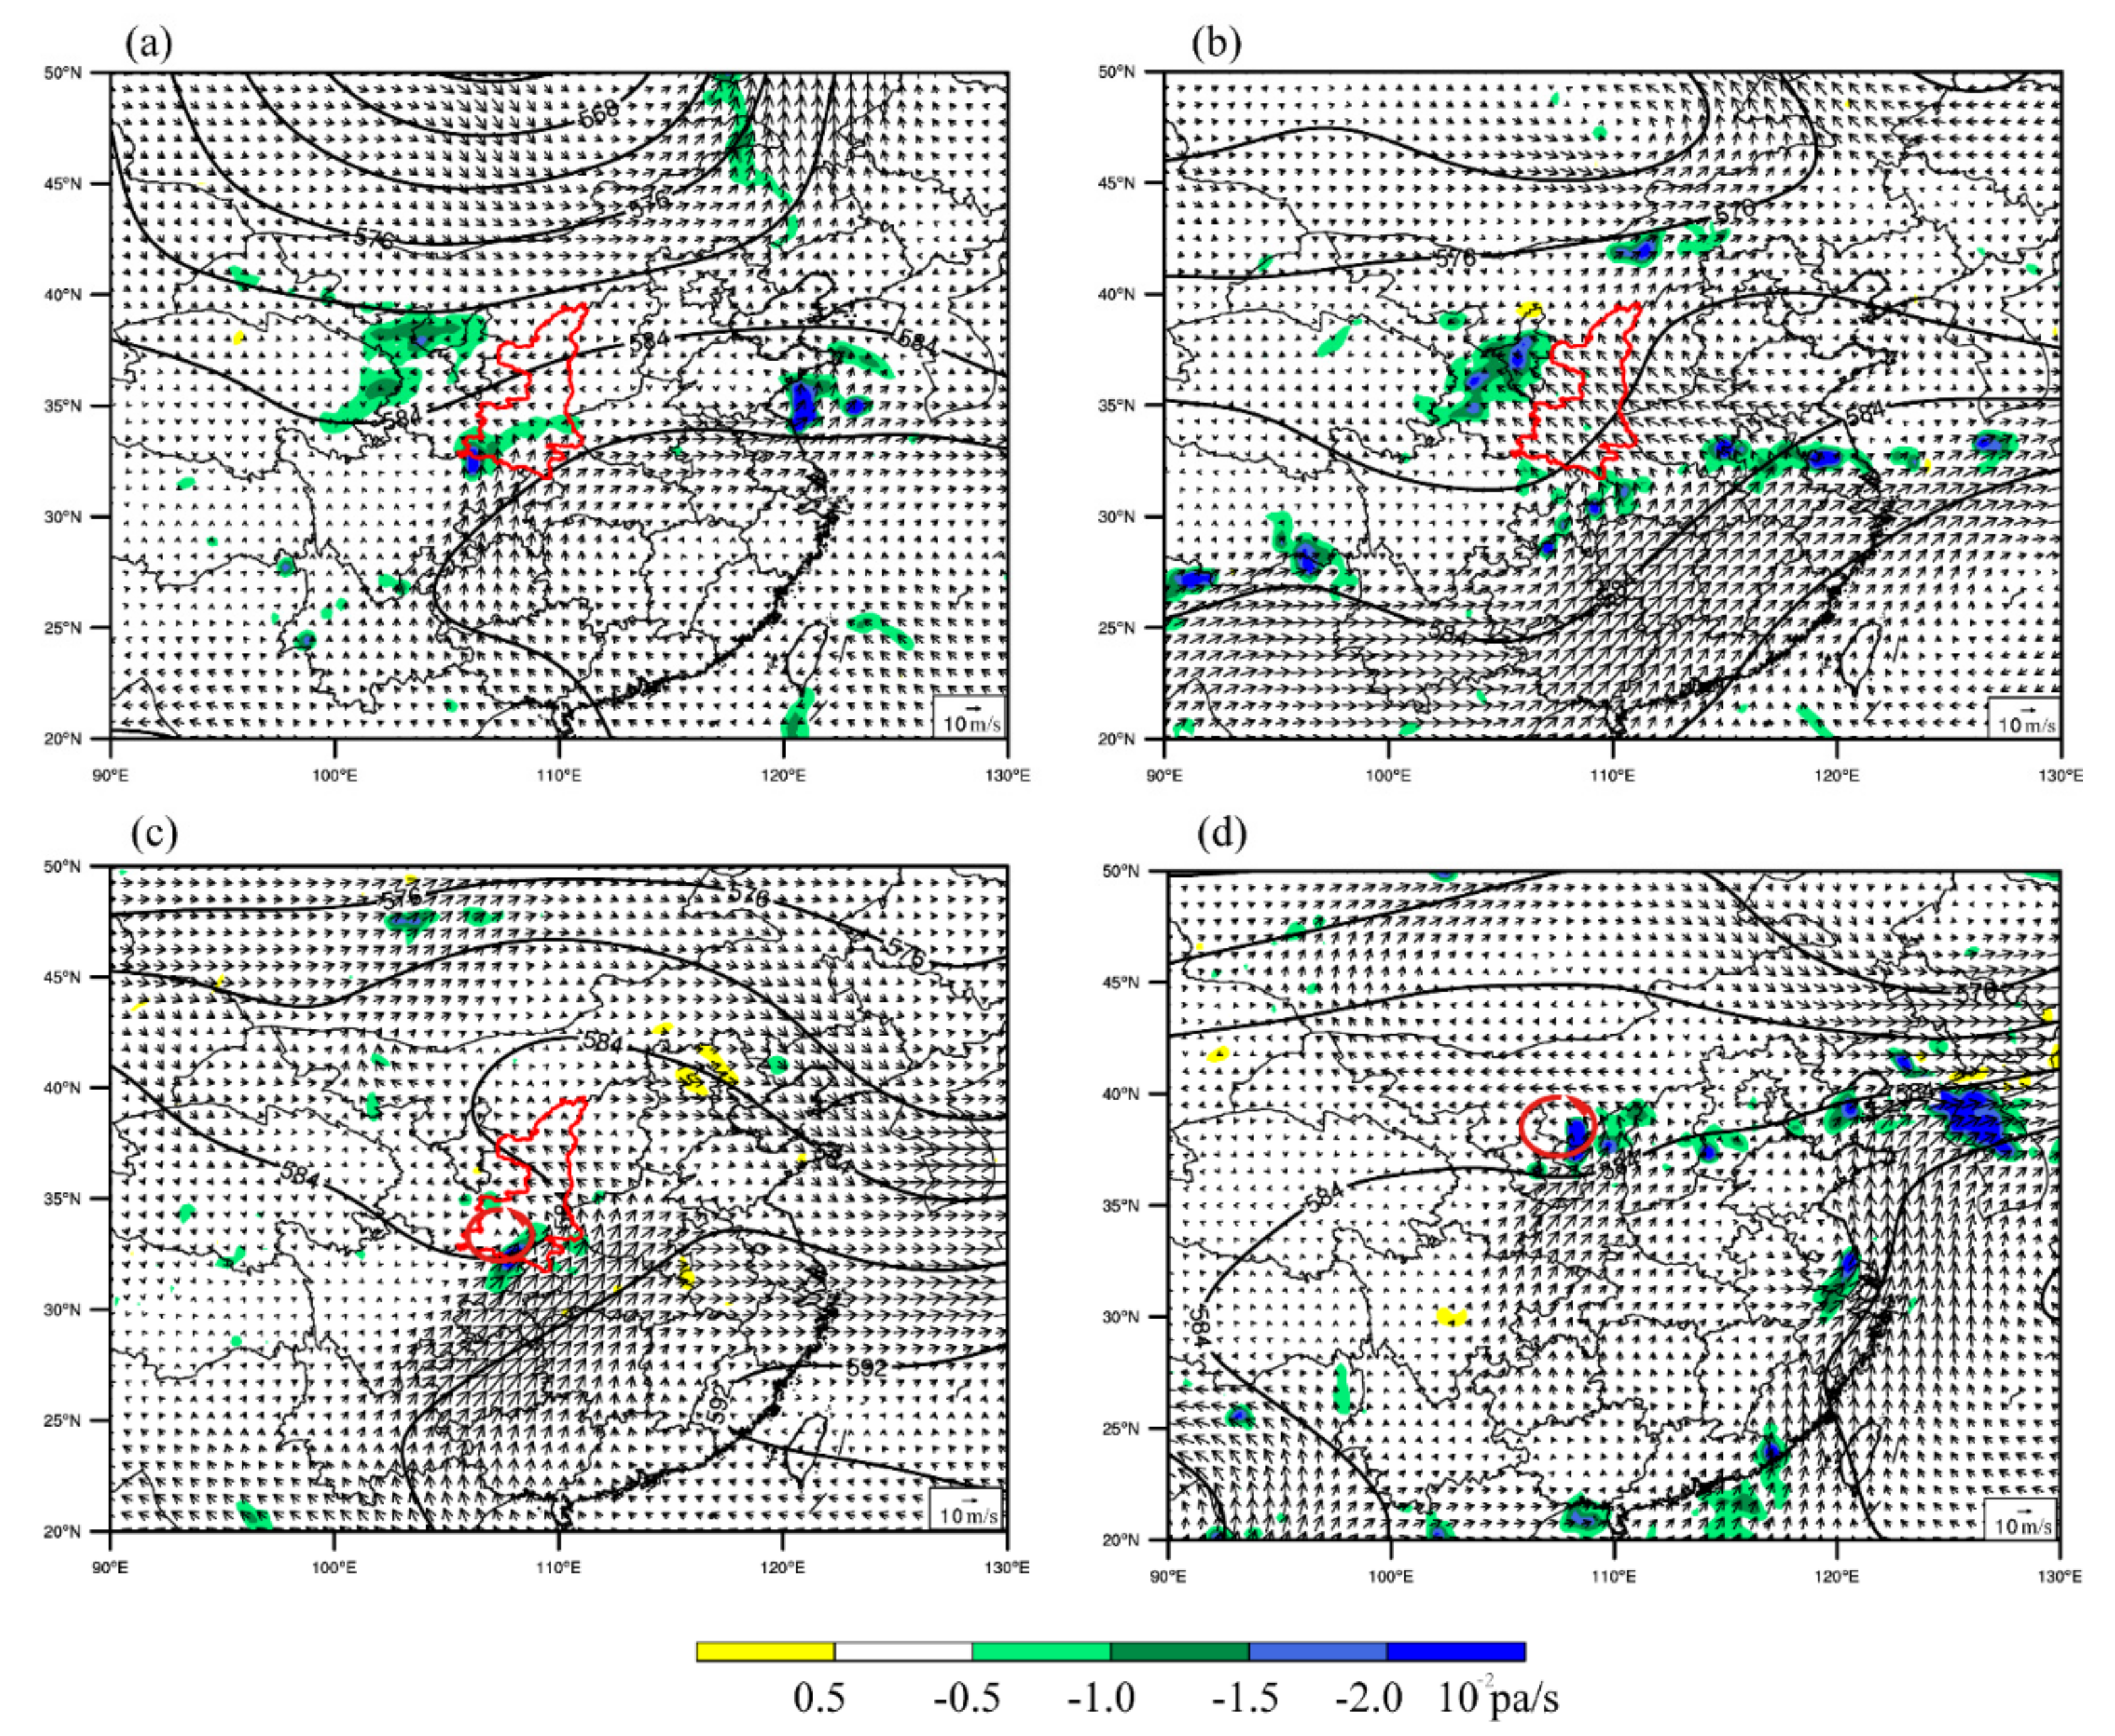
3.1. Rainstorm Weather Circulation Situation Classification
3.2. Verification of Results
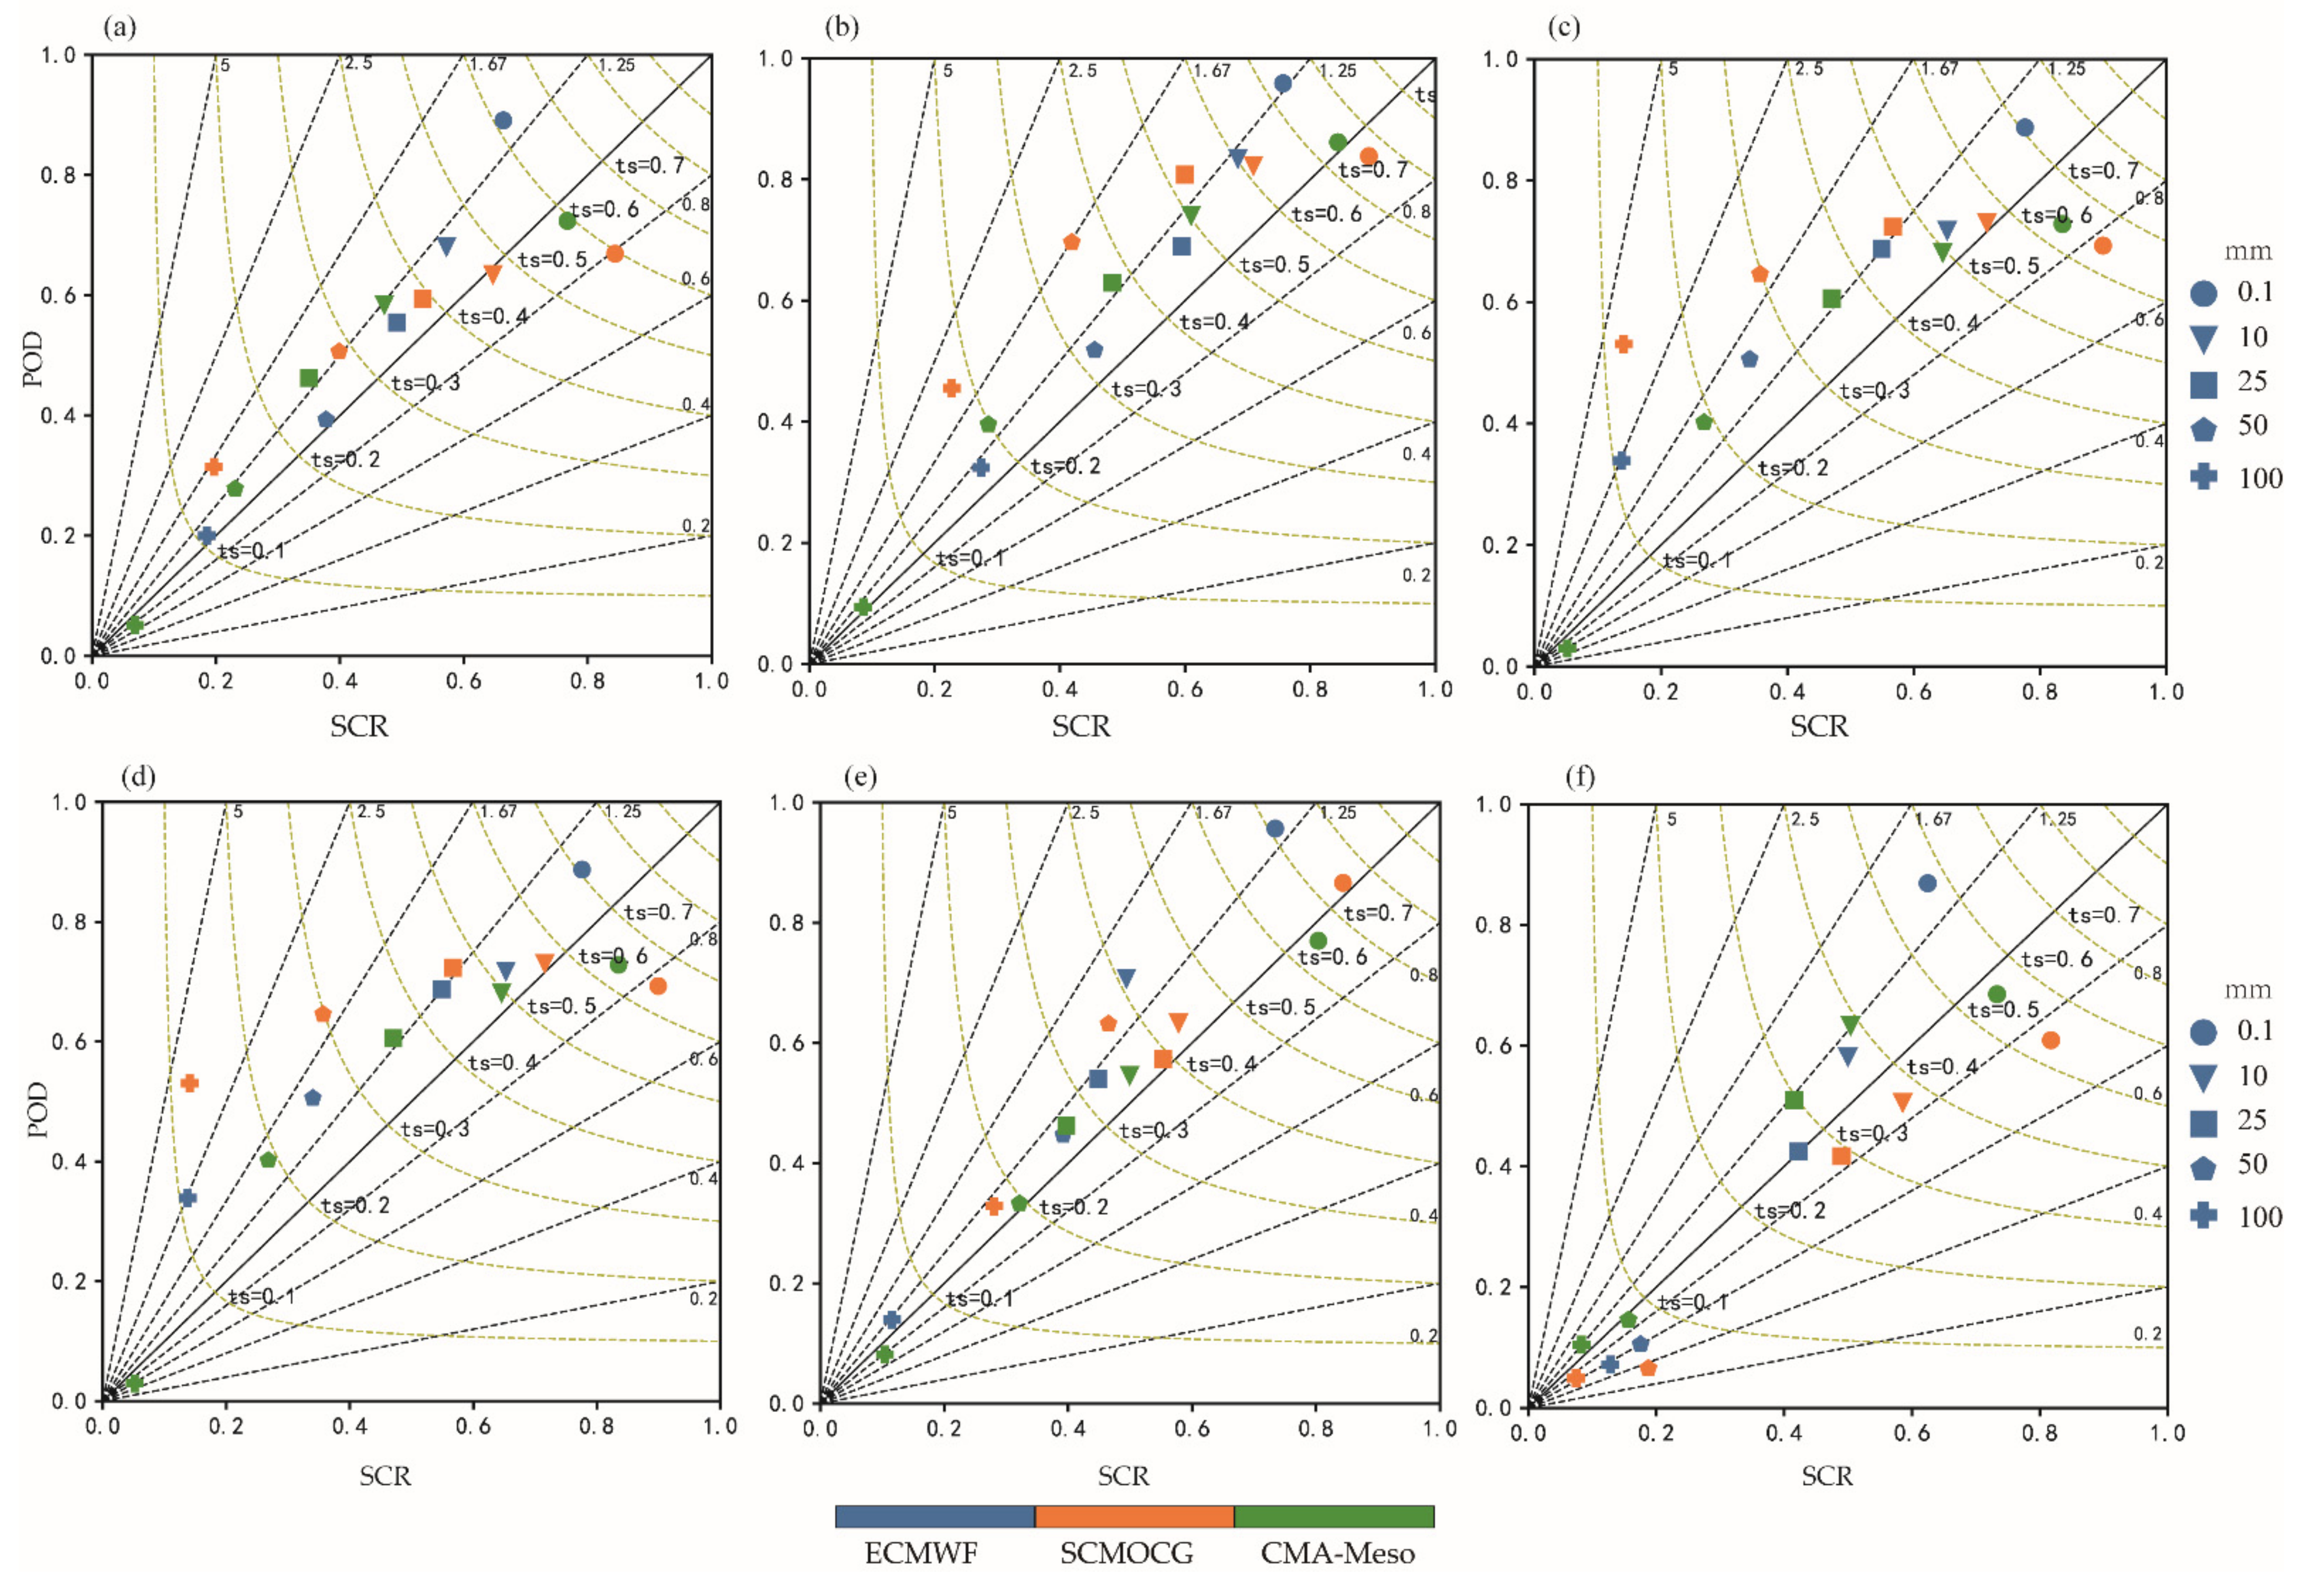
3.2.1. Classical Verification
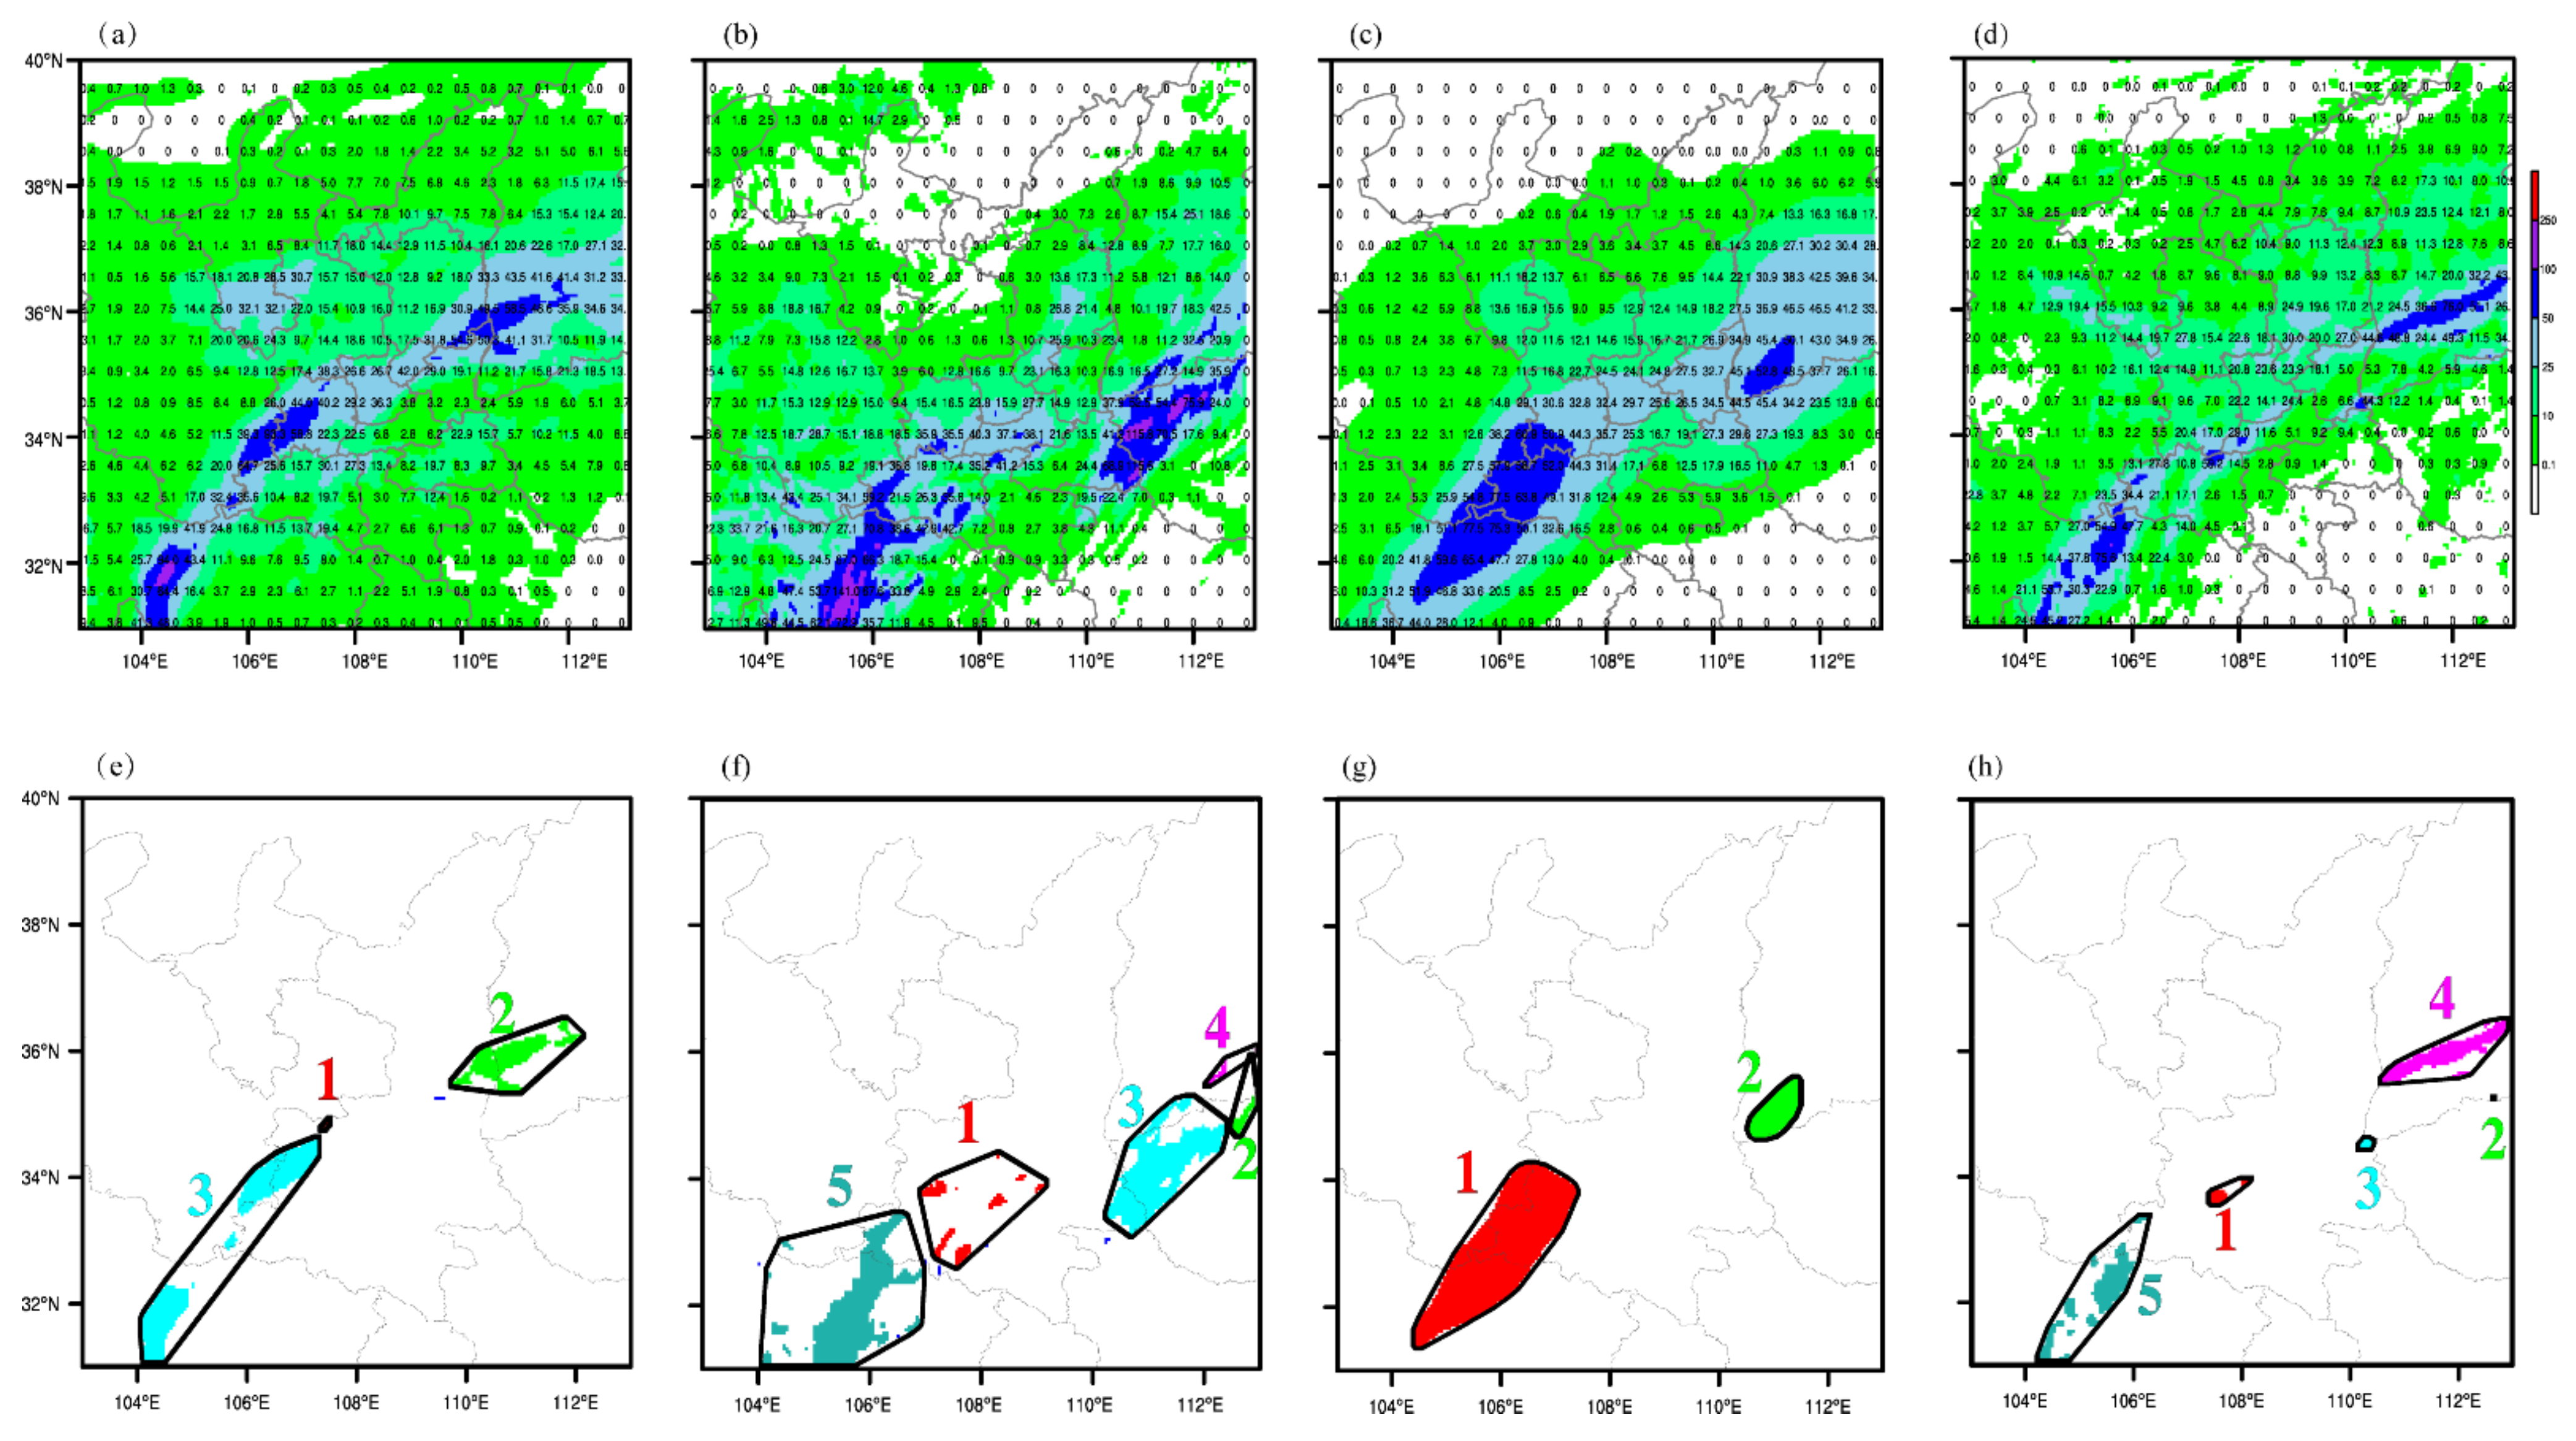
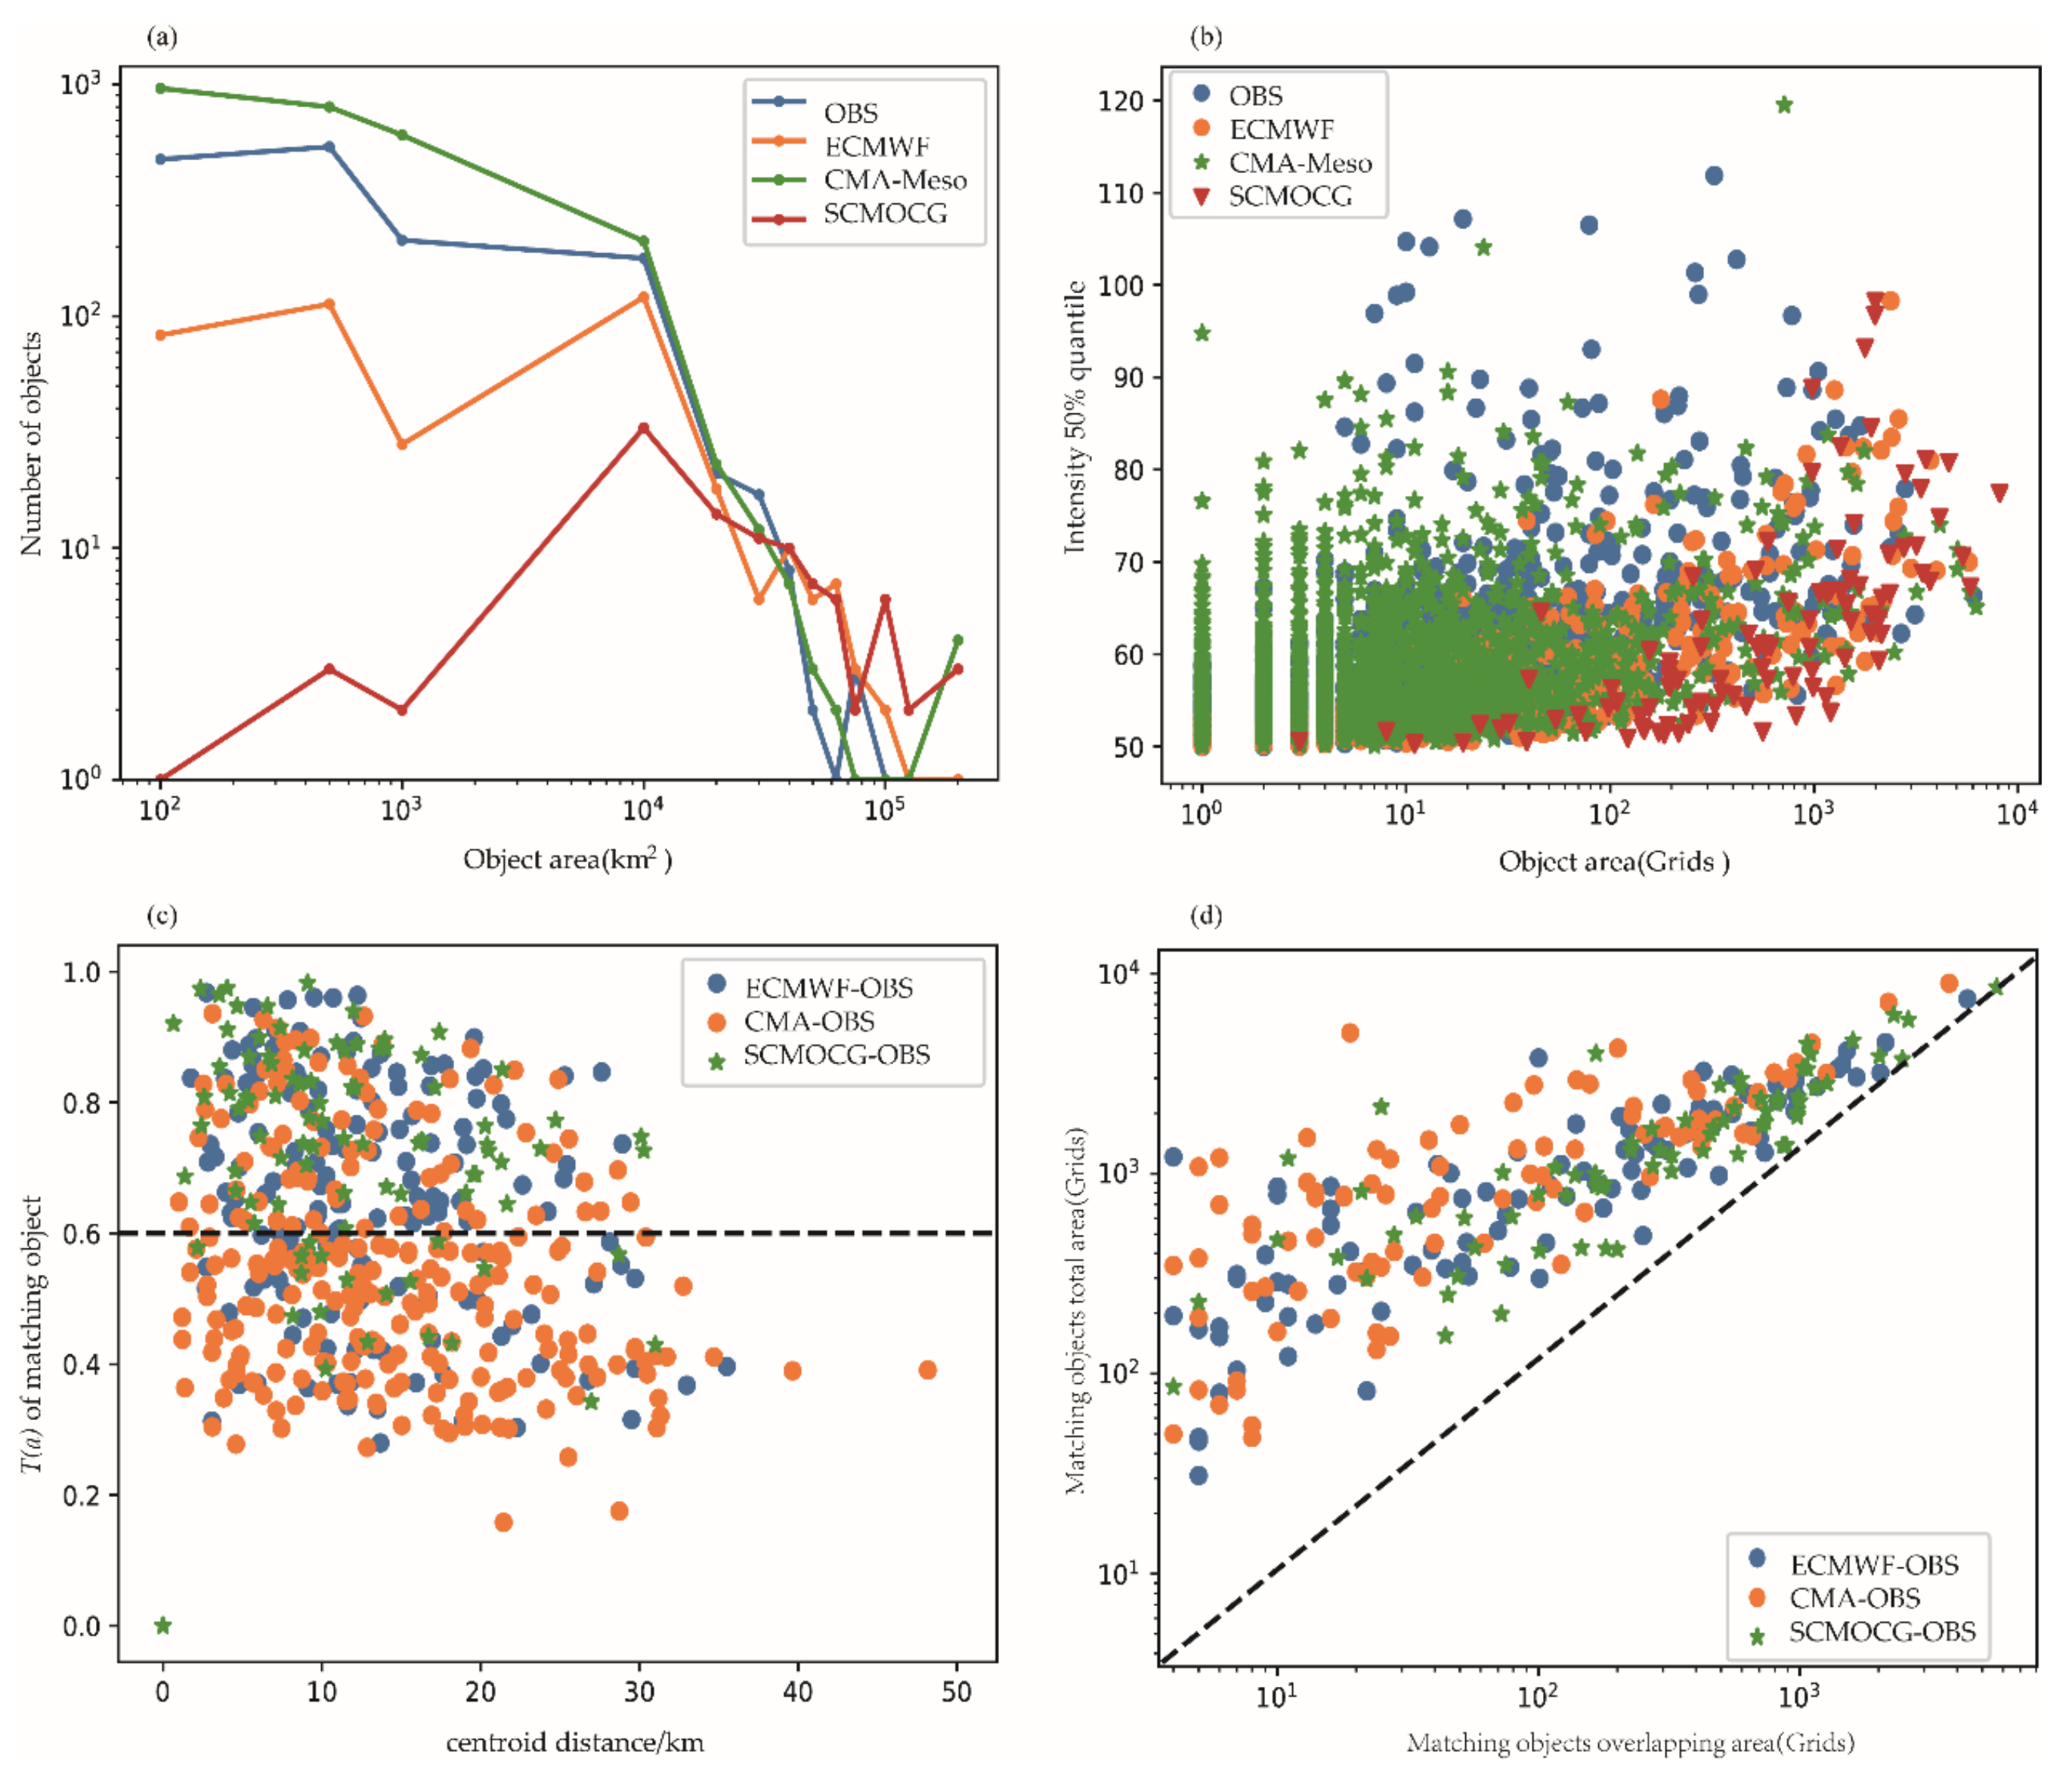
3.2.2. MODE Spatial Verification
4. Conclusions and Discussion
- (1)
- The overall rainstorm circulation situation in Qinling and their surrounding areas can be divided into FGXFC, XFC, XNW, DWQB, and RST. FGXFC rainstorm is the most important circulation situation in Qinling and their surrounding areas, accounting for 34%, and the other four account for 22%, 18%, 9%, and 18%, respectively.
- (2)
- Comprehensive graph verification shows that SCMOC rainstorm has a high TS score and POD, which has obvious advantages over ECMWF and CMA-Meso, but SCMOC rainstorm Bias is slightly larger. In different rainstorm circulation situations, POD of SCMOC for FGXFC rainstorm is the highest, SCR is slightly lower than that of ECMWF, and the missed risk is greater than that of ECMWF. POD, SCR, and TS scores of SCMOC for XFC, XNW, and DWQB rainstorm are consistently better than the other two products. However, for RST rainstorm, POD and SCR of SCMOC are low and its forecast ability is weak.
- (3)
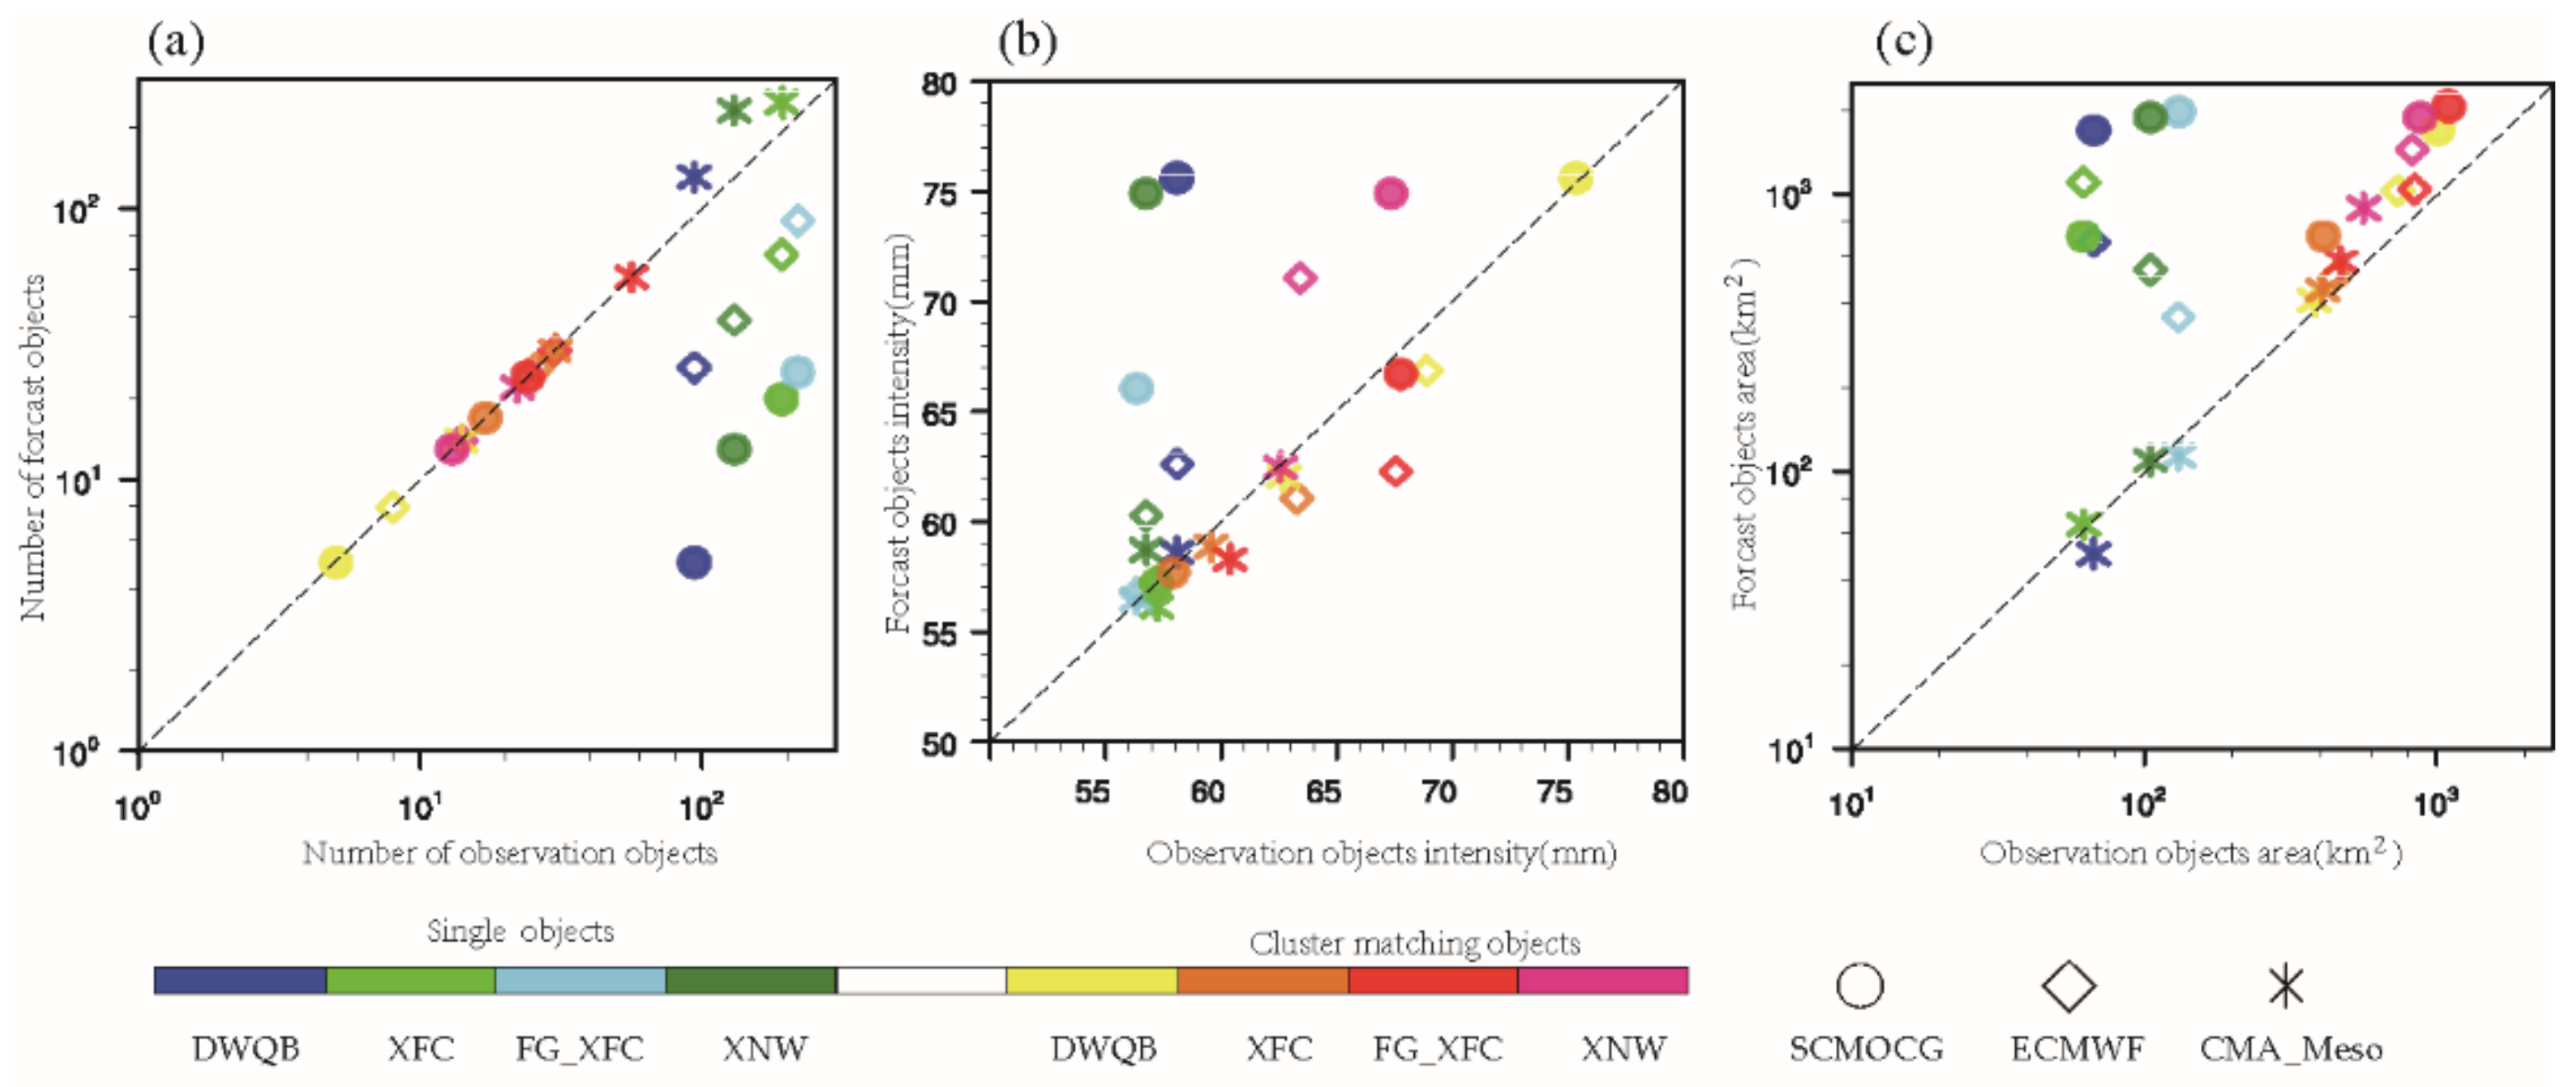
- The MODE verification shows that the number of ECMWF and SCMOC independent objects is significantly less than that of observation, and the CMA-Meso is significantly more. The forecast area of SCMOC regional rainstorm objects is significantly larger, scattered rainstorm objects are not reported, and CMA-Meso independent object forecasts are more. The median maximum interest of the cluster objects ECMWF, SCMOC, and CMA-Meso is 0.662, 0.74, and 0.53, respectively, and SCMOC performs the best. However, the area of ECMWF and SCMOC forecast objects is larger than that of observation, especially SCMOC. CMA-Meso rainstorm object has the best intensity match with the observation, followed by ECMWF. The main characteristics of SCMOC are that the 50% quantile intensity is low, the maximum intensity is high, and the dispersion of rainstorm intensity is larger than that of observation.
- (4)
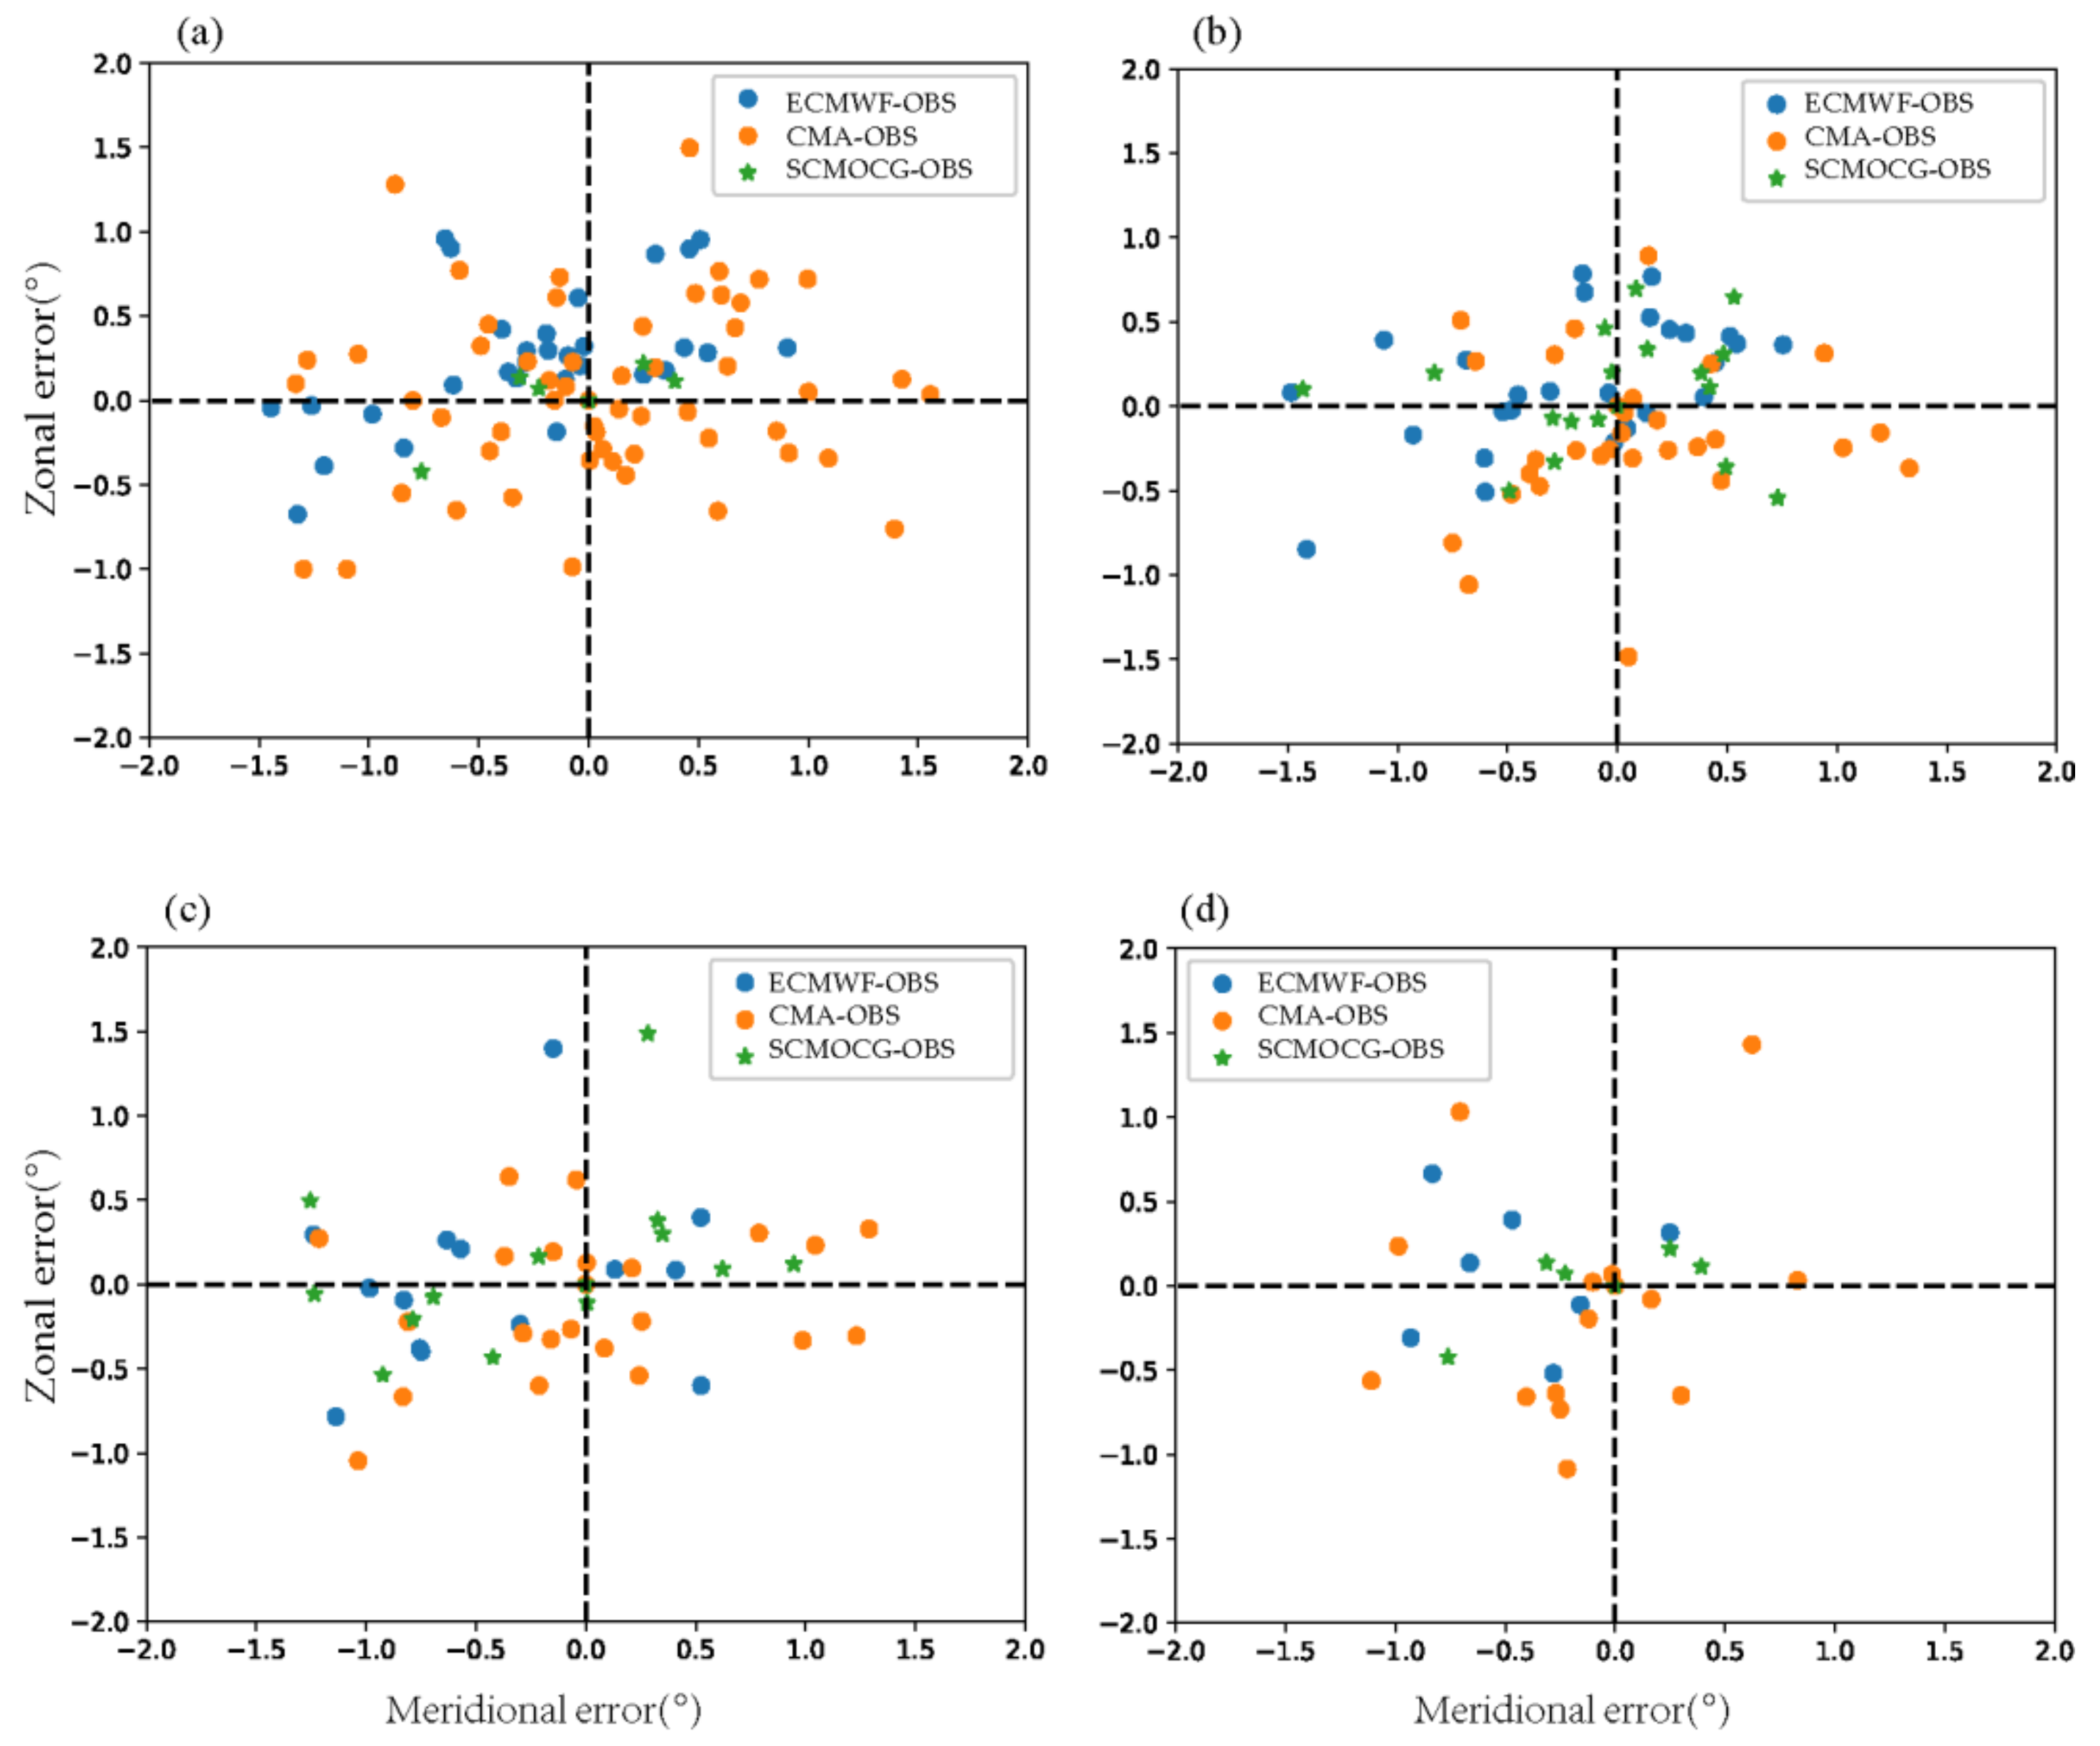
- Overall, the SCMOC spatial position error is the smallest, followed by ECMWF. The rainstorm forecast position of FGXFC and XFC of ECMWF is obviously west and north, and the rainstorm position error of DWQB is mainly west. Relatively speaking, the regularity of the XNW rainstorm position error distribution is lower than that of the other three circulation situations. The CMA-Meso longitude and latitude position errors are higher than those of SCMOC and ECMWF in all four circulation situations. SCMOC has good spatial location forecast of FGXFC, XFC, and DWQB rainstorm, but it has the risk of missing small rainstorm objects. The position of the ECMWF rainstorm forecast is relatively west and north of the observation.
Author Contributions
Funding
Institutional Review Board Statement
Informed Consent Statement
Data Availability Statement
Acknowledgments
Conflicts of Interest
Appendix A

| ECMWF | SCMOC | CMA-Meso | |
|---|---|---|---|
| Bias | 1.06 | 1.26 | 1.20 |
| RMSE | 9.02 | 9.7 | 10.1 |
| TS | 0.25 | 0.28 | 0.15 |
References
- Zhang, C.; Ren, Y.; Cao, L.; Wu, J.; Zhang, S.; Hu, C.; Zhujie, S. Characteristics of dry-wet climate change in China during the past 60 years and its trends projection. Atmosphere 2022, 13, 275. [Google Scholar] [CrossRef]
- Bi, B.G.; Liu, Y.W.; Li, Z.C. Study on Influence of the mechanical forcing of mesoscale topography on the extremely heavy rainfall in southern shaanxi on 8~9 June 2002. Plateau Meteorol. 2006, 25, 485–494. (In Chinese) [Google Scholar]
- Mu, J.L.; Shen, Y.; Li, Z.C. The environmental conditions and mesoscale system of a heavy rainfall over the central Shaanxi Plain on 8–9 August 2007. Trans. Atmos. Sci. 2014, 37, 591–604. (In Chinese) [Google Scholar]
- Wang, X.L.; Ren, Y. Analysis of precipitation differences and their local causes in the last 50 years around the Qinling mountains. Clim. Environ. Res. 2012, 17, 911–918. (In Chinese) [Google Scholar]
- Pan, L.J.; Zhang, H.F.; Cheng, X.T.; Zou, T. Dominant modes of summer precipitation in Qinling and surrounding area. Trans. Atmos. Sci. 2018, 41, 377–387. (In Chinese) [Google Scholar] [CrossRef]
- Fang, J.G.; Bai, A.J.; Tao, J.L. Analysis of Continuous Rainfall in Shaanxi in 2003 Autumn with Circulation Features. J. Appl. Meteor. Sci. 2005, 16, 509–517. (In Chinese) [Google Scholar]
- Dai, J.; Yu, X.; Rosenfeld, D. The suppression of aerosols to the orographic precipitation in the Qinling Mountains. Chin. J. Atmos. Sci. 2008, 32, 1319–1332. (In Chinese) [Google Scholar]
- Zhang, H.F.; Pan, L.J.; Lu, S. Variation Characteristics of Precipitation and Air Temperature from 1901 to 2012 in Shaanxi, China. J. Desert Res. 2015, 35, 1674–1682. (In Chinese) [Google Scholar]
- Chakraborty, A. The skill of ECMWF medium-range forecasts during the year of tropical Convection. Mon. Wea. Rev. 2010, 138, 3787–3805. [Google Scholar] [CrossRef]
- Clark, M.; Gangopadhyay, S.; Hay, L. The Schaake Shuffle: A Method for Reconstructing Space-Time Variability in Forecasted Precipitation and Temperature Fields. J. Hydrometeorol. 2004, 5, 243–262. [Google Scholar] [CrossRef] [Green Version]
- Darby, L.S.; White, A.B.; Gottas, D.A. An evaluation of integrated water vapor, wind, and precipitation forecasts using water vapor flux observations in the western United States. Weather. Forecast. 2019, 34, 1867–1888. [Google Scholar] [CrossRef]
- Diez, S.J.; Del, M.J. Long-term rainfall prediction using atmospheric synoptic patterns in semi-arid climates with statistical and machine learningmethods. J. Hydrol. 2020, 586, 124789. [Google Scholar] [CrossRef]
- Scheuerer, M.; Hamill, T.M. Statistical postprocessing of ensemble precipitation forecasts by fitting censored shifted gamma distributions. Mon. Weather. Rev. 2015, 143, 4578–4596. [Google Scholar] [CrossRef]
- Bauer, P.; Thorpe, A.; Brunet, G. The quiet revolution of numerical weather prediction. Nature 2015, 525, 47–55. [Google Scholar] [CrossRef]
- Ji, L.R. Some highlights and their implication in the early rogress of umerical weather prediction—A review. Adv. Meteorol. Sci. Technol. 2011, 1, 40–43. [Google Scholar]
- Yu, Z.; Chen, Y.J.; Ebert, E.; Davidson, N.E.; Xiao, Y.; Yu, H.; Duan, Y. Benchmark rainfall verification of landfalltropical cyclone forecasts by operational ACCESS-TC over China. Meteorol. Appl. 2020, 27, e1842. [Google Scholar] [CrossRef]
- Mass, C.F.; Ovens, K.W.; Colle, B.A. Does increasing horizontal resolution produce more skillful forecasts? Bull. Amer. Meteor. Soc. 2002, 83, 407–430. [Google Scholar] [CrossRef]
- Bochenek, B.; Ustrnul, Z. Machine learning in weather prediction and climate analyses—Applications and perspectives. Atmosphere 2022, 13, 180. [Google Scholar] [CrossRef]
- Sun, M.; Kim, G.; Lei, K.; Wang, Y. Evaluation of technology for the analysis and forecasting of precipitation using cyclostationary EOF and regression method. Atmosphere 2022, 13, 500. [Google Scholar] [CrossRef]
- Boukabara, S.; Krasnopolsky, V.; Stewart, J.Q. Leveraging modern artificial intelligence for remote sensing and NWP: Benefits and challenges. Bull. Amer. Meteor. Soc. 2019, 100, ES473–ES491. [Google Scholar] [CrossRef]
- Davis, C.A.; Brown, B.G.; Bullock, R.G. Object-based verification of precipitation forecasts, Part I: Methodology and application to mesoscale rain areas. Mon. Weather Rev. 2006, 134, 1772–1784. [Google Scholar] [CrossRef] [Green Version]
- Davis, C.A.; Brown, B.G.; Bullock, R.; Halley-Gotway, J. The Method for Object-based Diagnostic Evaluation (MODE) applied to WRF forecasts from the 2005 NSSL/SPC Spring Program. Weather 2009, 24, 1252–1267. [Google Scholar]


| Classification | Number of Cases | Subtropical High Location | Influence System | Rainstorm Location | ||
|---|---|---|---|---|---|---|
| 500 hPa | 700 hPa | 850 hPa | ||||
| GXFC | 25 | Jianghan and southern Huanghuai | A low vortex in northern Inner Mongolia, Xinjiang | Shear line, southwest warm and humid air flow | Convergence line | South of 700 hPa shear line, rainstorm in warm area |
| XFC | 16 | Jiangnan and southern China | Westerly trough | Shear line, 700 hPa easterly flow | Convergence line | Near 700 hPa shear line |
| XNW | 13 | Jianghan Region | Trough of Qinghai Tibet developing and moving eastward | Cyclonic circulation | Southwest vortex | Central and Southern Shaanxi |
| DWQB | 7 | Eastern coastal area of Jiangnan | Westerly trough moving eastward | Cyclonic circulation | Vortex | Near 700 hPa vortex |
| RST | 13 | - | - | Shear line | Convergence line and high-energy region | Locally dispersed rainstorm |
| Match Object Number | Centroid Distance (km) | Forecast/Observation Area (km2) | Forecast/Observation Intensity in the 90% Quartile (mm) | Axial Angle Deviation (°) | T(a) | |
|---|---|---|---|---|---|---|
| ECMWF | F1-O1 | 21.99 | 6/8 | 51.71/58.71 | 21.99 | 0.458 |
| F2-O4 | 19.75 | 301/26 | 58.32/74.54 | 19.75 | 0.806 | |
| F3-O5 | 18.38 | 580/295 | 94.26/84.27 | 18.38 | 0.707 | |
| CMA-Meso | F1-O1 | 5.91 | 126/36 | 60.95/72.96 | 3.42 | 0.5528 |
| F2-O2 | 3.83 | 44/1 | 64.34/50.14 | 72.40 | 0.3484 | |
| F3-O3 | 19.25 | 702/17 | 107.12/78.85 | 31.27 | 0.3427 | |
| F4-O4 | 11.81 | 22/268 | 56.01/74.54 | 12.78 | 0.4728 | |
| F5-O5 | 9.11 | 781/295 | 106.98/84.27 | 2.21 | 0.680 | |
| SCMOC | F1-O5 | 14.49 | 1414/237 | 76.02/86.10 | 5.78 | 0.660 |
| F2-O4 | 20.29 | 217/277 | 52.75/76.31 | 13.69 | 0.764 | |
| Precipitation Products | Number of Objects | Object Area (Number of Grid Points) | Intensity (mm) | ||||
|---|---|---|---|---|---|---|---|
| Minimum | Maximum | Average | 50% Quantile | 75% Quantile | Maximum | ||
| Observed | 1377 | 1 | 6044 | 68.39 | 57.30 | 62.46 | 242.87 |
| ECMWF | 427 | 1 | 5739 | 229.37 | 58.2 | 64.52 | 245.96 |
| CMA-Meso | 2214 | 1 | 6232 | 51.87 | 57.0 | 60.82 | 238.43 |
| SCMOC | 103 | 3 | 5129 | 1181.67 | 50.52 | 65.68 | 305.92 |
Publisher’s Note: MDPI stays neutral with regard to jurisdictional claims in published maps and institutional affiliations. |
© 2022 by the authors. Licensee MDPI, Basel, Switzerland. This article is an open access article distributed under the terms and conditions of the Creative Commons Attribution (CC BY) license (https://creativecommons.org/licenses/by/4.0/).
Share and Cite
Pan, L.; Zhang, H.; Liu, J.; Gao, X.; Qi, C. Comparative Analysis of SCMOC and Models Rainstorm Forecasting Performance in Qinling Mountains and Their Surrounding Areas. Atmosphere 2022, 13, 705. https://doi.org/10.3390/atmos13050705
Pan L, Zhang H, Liu J, Gao X, Qi C. Comparative Analysis of SCMOC and Models Rainstorm Forecasting Performance in Qinling Mountains and Their Surrounding Areas. Atmosphere. 2022; 13(5):705. https://doi.org/10.3390/atmos13050705
Chicago/Turabian StylePan, Liujie, Hongfang Zhang, Jing Liu, Xingxing Gao, and Chunjuan Qi. 2022. "Comparative Analysis of SCMOC and Models Rainstorm Forecasting Performance in Qinling Mountains and Their Surrounding Areas" Atmosphere 13, no. 5: 705. https://doi.org/10.3390/atmos13050705
APA StylePan, L., Zhang, H., Liu, J., Gao, X., & Qi, C. (2022). Comparative Analysis of SCMOC and Models Rainstorm Forecasting Performance in Qinling Mountains and Their Surrounding Areas. Atmosphere, 13(5), 705. https://doi.org/10.3390/atmos13050705