Article

Spring 2020 Atmospheric Aerosol Contamination over Kyiv City

by
Chenning Zhang
1,
Valery Shulga
1,2,
Gennadi Milinevsky
1,3,4,5,6,*,
Vassyl Danylevsky
3,7,
Yuliya Yukhymchuk
3,6,
Volodymyr Kyslyi
8,
Ivan Syniavsky
3,
Mikhail Sosonkin
3,
Philippe Goloub
6,
Olena Turos
9,
Andrii Simon
5,10,
Vasyl Choliy
5,
Tetiana Maremukha
9,
Arina Petrosian
9,
Vladyslav Pysanko
5,
Anna Honcharova
11,
Dmitry Shulga
2,
Natallia Miatselskaya
12 and
Varvara Morhuleva
9
1
International Center of Future Science, College of Physics, Jilin University, Changchun 130012, China
2
Department of Millimeter Radio Astronomy, Institute of Radio Astronomy, National Academy of Sciences of Ukraine, 01601 Kyiv, Ukraine
3
Department for Atmospheric Optics and Instrumentation, Main Astronomical Observatory, 03143 Kyiv, Ukraine
4
Department of Atmosphere Physics and Geospace, National Antarctic Scientific Center, 01601 Kyiv, Ukraine
5
Physics Faculty, Taras Shevchenko National University of Kyiv, 01601 Kyiv, Ukraine
6
Laboratoire d’Optique Amosphérique (LOA), Universitée des Sciences et Technologies de Lille, 59655 Villeneuve d’Ascq, France
7
Astronomical Observatory, Taras Shevchenko National University of Kyiv, 01601 Kyiv, Ukraine
8
V. Lashkaryov Institute of Semiconductor Physics, National Academy of Sciences of Ukraine, 03028 Kyiv, Ukraine
9
Laboratory of Air Quality, Marzeiev Institute for Public Health, National Academy of Medical Science of Ukraine, 02660 Kyiv, Ukraine
10
National Center of Junior Academy of Sciences of Ukraine, 04119 Kyiv, Ukraine
11
Education and Research Institute of Ecology, V.N. Karazin Kharkiv National University, 61000 Kharkiv, Ukraine
12
Institute of Physics, National Academy of Sciences of Belarus, 220072 Minsk, Belarus
*
Author to whom correspondence should be addressed.
Atmosphere 2022, 13(5), 687; https://doi.org/10.3390/atmos13050687
Submission received: 27 February 2022 / Revised: 17 April 2022 / Accepted: 22 April 2022 / Published: 25 April 2022
(This article belongs to the Section Air Pollution Control)

Abstract

:
Extraordinarily high aerosol contamination was observed in the atmosphere over the city of Kyiv, Ukraine, during the March–April 2020 period. The source of contamination was the large grass and forest fires in the northern part of Ukraine and the Kyiv region. The level of PM2.5 load was investigated using newly established AirVisual sensor mini-networks in five areas of the city. The aerosol data from the Kyiv AERONET sun-photometer site were analyzed for that period. Aerosol optical depth, Ångström exponent, and the aerosol particles properties (particle size distribution, single-scattering albedo, and complex refractive index) were analyzed using AERONET sun-photometer observations. The smoke particles observed at Kyiv site during the fires in general correspond to aerosol with optical properties of biomass burning aerosol. The variability of the optical properties and chemical composition indicates that the aerosol particles in the smoke plumes over Kyiv city were produced by different burning materials and phases of vegetation fires at different times. The case of enormous PM2.5 aerosol contamination in the Kyiv city reveals the need to implement strong measures for forest fire control and prevention in the Kyiv region, especially in its northwest part, where radioactive contamination from the Chernobyl disaster is still significant.

1. Introduction

Aerosol particle emissions from vegetation fires have large impacts on both climate and air quality [1]. Biomass burning plays an important role in the climate system. It is well-documented that forest, grass, and peat fire aerosols can be transported over long distances and influence aerosol content and properties, and air quality in populated regions. For example, large wildfires in the European part of the Russian Federation, which occurred in the summer of 2010, greatly influenced the air pollution in the densely populated Moscow city and region [2,3]; the atmosphere contamination was observed overall in neighboring countries [4,5,6]. The aerosols from the wildfire in Canada that occurred during 2–7 July 2013 were observed over Central and Eastern Europe [7].
Forest, grass, and peat fires produce so-called biomass burning (BB) aerosols that are composed of organic aerosols, black carbon, and a small fraction of inorganic materials [8]. The properties of aerosol particles in smoke from vegetation burning are various. The mixture of substances in a particle and the mixture of different types of particles in the smoke plume determine the microphysical and optical properties of aerosol observed at the observational site. The type of burning vegetation (trees, crown or stem of a tree, grass, peat etc.), meteorological conditions, and time of the smoke transport to the observational site (aerosol age) specify the size, structure, chemical composition, and optical properties of the smoke particles [3,4,5,6,7,9,10,11,12]. To estimate the separate effect of each factor and the effect in combinations of factors, special studies and experiments have been performed, e.g., [13,14,15]. Physical, chemical, and optical properties of BB aerosols can change rapidly when they disperse in the atmosphere. Particle emissions from biomass burning are dominated by an accumulation mode, with a volume median diameter of 0.25–0.3 μm range (count median diameter of 0.10–0.15 μm) depending on age, fuel, and combustion efficiency [8]. The particle size distribution of the BB aerosols influences Particulate Matter (PM): the PM2.5 and PM10 concentrations, which are the air quality factor [16].
As several special studies have stressed the negative impact of fine particles on the human health (see, e.g., [17,18]), it is essential to accurately identify and quantify specific air particulate matter pollution by the BB aerosol, especially in urban areas. In situ PM2.5 (particulate matter aerosols that are smaller than 2.5 μm in diameter) concentration measurements are a common technique to estimate the air pollution in different regions of the globe [9,19,20,21], particularly using low-cost instruments for air quality monitoring networks [22,23]. To study PM2.5 contamination, remote sensing measurements [24,25,26,27], modeling [20,28], and a synergy of different techniques [29] are used. Particularly, simulation of the air mass transport is required to estimate the wildfire aerosols influence on the air quality, which depends on the meteorological parameters [30,31].
The city of Kyiv and its regions are impacted by numerous local aerosol pollution sources and by aerosol transport from remote sources, mostly wild and human-made forest and peat fires, and grass burn. The most dangerous grass and forest fires take place in radioactivity-contaminated areas like the Chernobyl Exclusion Zone (ChEZ) [32]. These fire advection events release biomass-burning particles, which can include radioactive elements that spread long distances through air mass transport. The increased aerosol optical depth was observed at the Kyiv AERONET/PHOTONS site in April–May every year. It is mainly caused by agricultural burn and forest/peat fires, which govern a seasonal feature of aerosol properties over the Ukrainian rural and urban–industrial areas [33]. The air mass transport potentially influences on the seasonal and local variations of aerosols content and properties based on the Kyiv AERONET site data has been considered in [33,34], including the 3-D back-trajectories and cluster analysis to determine the prevailing directions of air mass transport and possible aerosol origin, as well as GEOS-Chem modeling [35,36,37].
Aerosol particles are usually concentrated in the planetary boundary layer (PBL) from the surface to a height of a few kilometers during such events. For example, lidar measurements of the aerosol altitude distribution over Kyiv during a similar case of air pollution from forest fires in early September 2015 revealed aerosol particles from the surface and up to 4–5 km [38]. The satellite CALIOP lidar data analysis in July–August 2010 during large-scale forest fires in the European part of Russia showed that the products of aerosol fires over Ukraine were observed from the surface to altitudes of about 6 km [6].
The purpose of this paper is to examine the case of high aerosol pollution in the Kyiv city during the March–April 2020 period. The methods and measurement techniques used are described in Section 2. The observation results are presented and discussed in Section 3 followed by conclusions in Section 4.

2. Materials and Methods
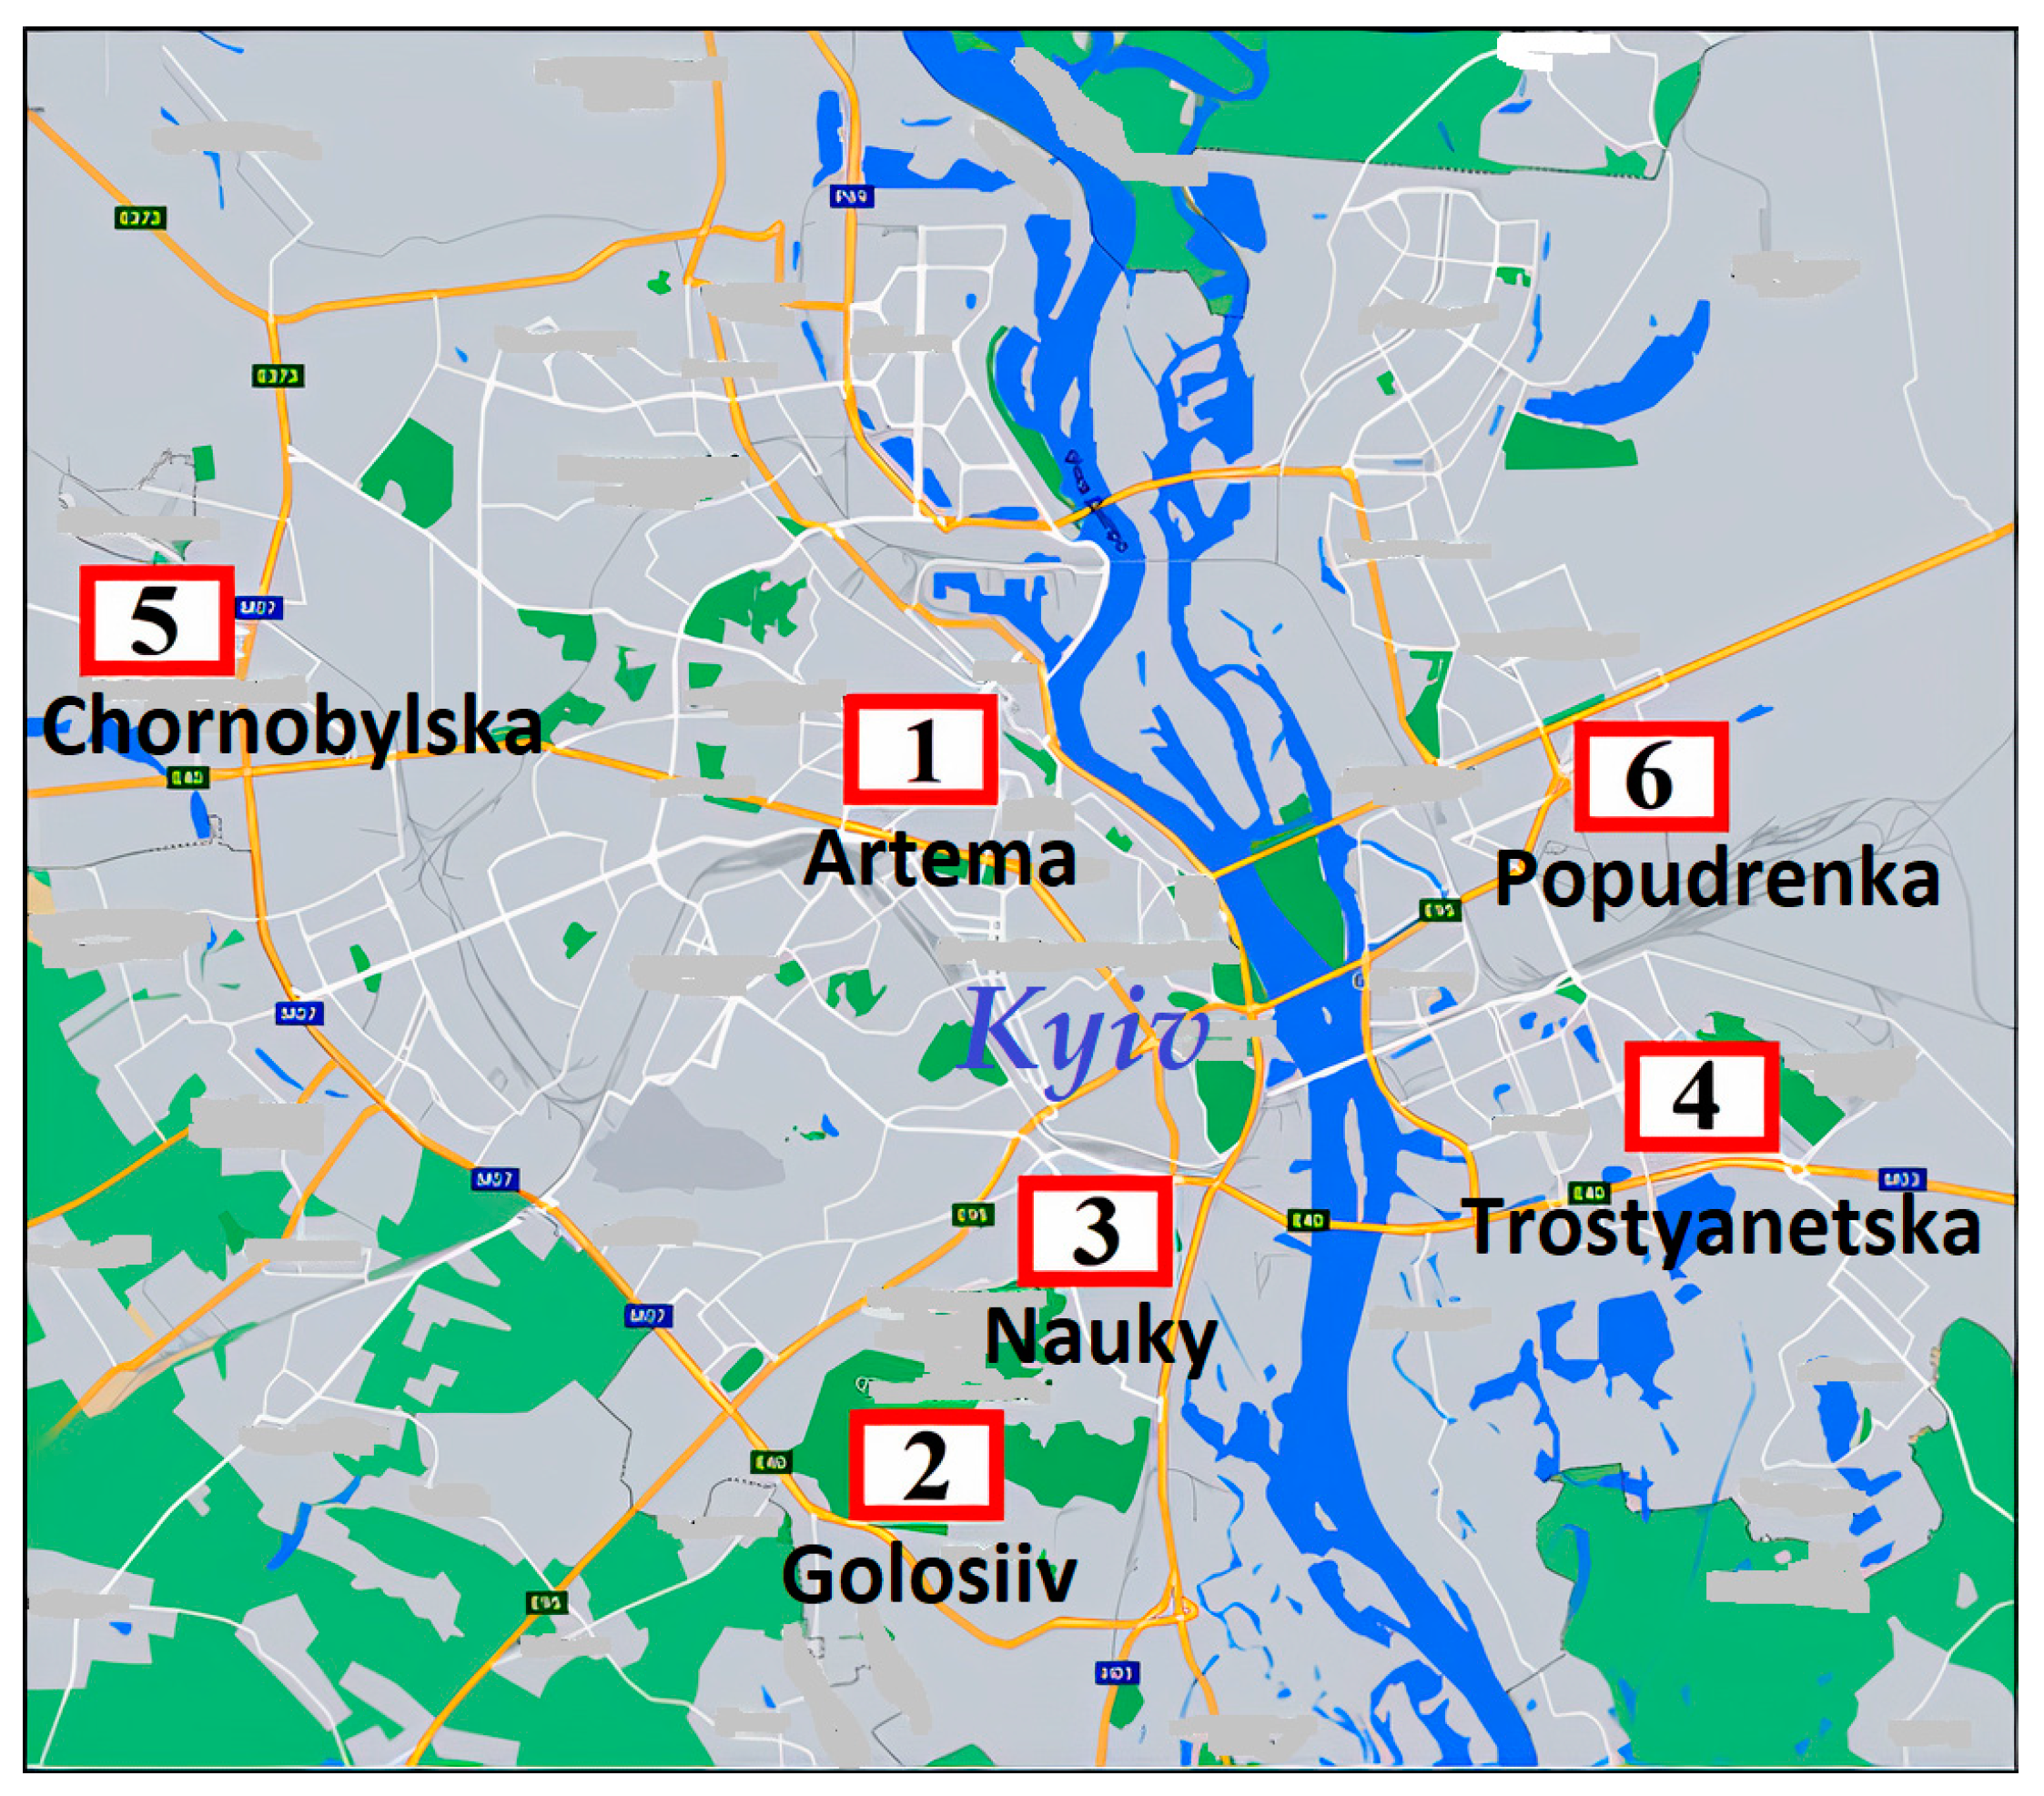
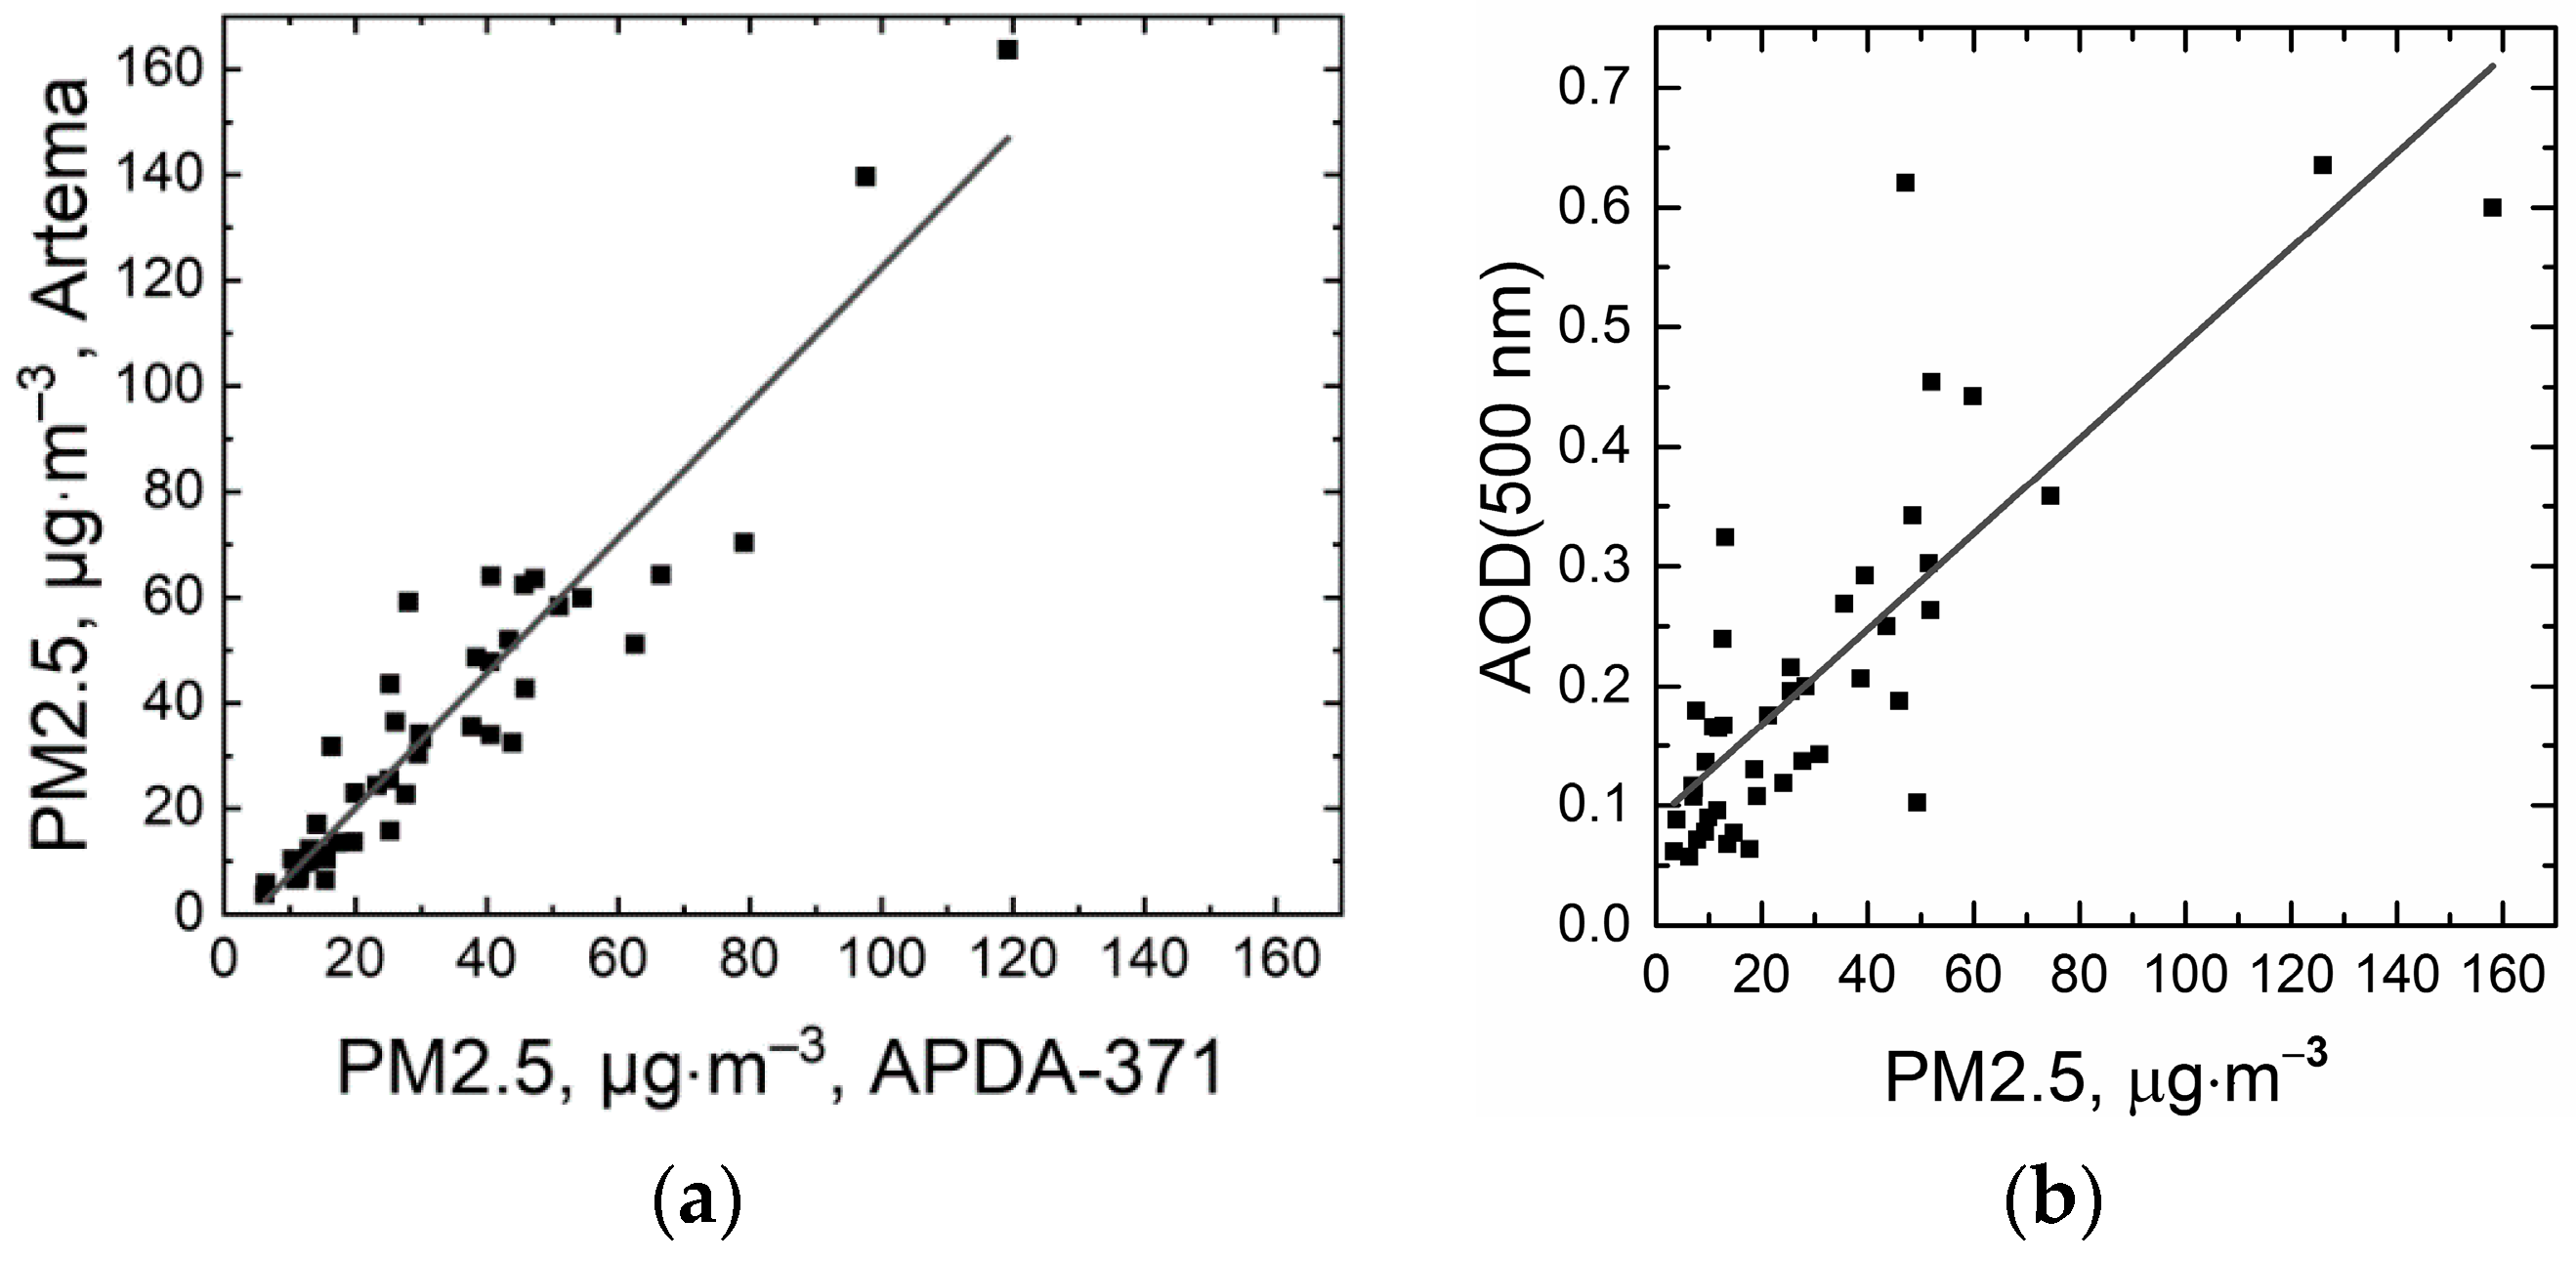
In this work, we used a data set of PM2.5 mass concentration from five sensors of the AirVisual network along with the APDA-371 HORIBA standardized analyzer. We used the ground-based observations of the aerosol optical depth (AOD) and other aerosol parameters with the AERONET Kyiv site sun-photometer CE318 CIMEL Electronique, Paris, France [39,40]. The HYSPLIT back-trajectories algorithm [41,42] was applied to derive the transport of aerosol particles. To identify fire locations and smoke plumes, we used fire maps with large coverage area provided by the Zoom Earth maps [43] and satellite remote sensing measurements from MODIS and VIIRS instruments [44].

2.1. In Situ Data

For in situ PM measurements, AirVisual stations are distributed all over the Kyiv city with the purpose to cover as much of the city territory as possible (Figure 1). Five stations of the AirVisual network were established at the beginning of 2020. These AirVisual stations are Artema Street, Golosiiv, Nauky Avenue, Trostyanetska, and Chornobylska Street. The Golosiiv AirVisual station is located on the roof of the same building as the Kyiv sun-photometer AERONET/PHOTONS site. The main sensor of the network is an AirVisual Pro smart air quality monitor with advanced laser technology that provides highly accurate readings of fine particles at PM2.5 with 2.5 μm aerodynamic diameter down to 0.3 μm [45].
The AirVisual Pro device, IQAir, Staad, Switzerland, is equipped with a specially designed optical sensor AVPM25b for aerosol concentration measurements, which allows determining the concentration of PM1, PM2.5 and PM10 in the range from 0 to 1000 µg m−3 with measuring accuracy ±10%. Using WiFi, the device can transmit the measurements to an environmental pollution map [46], which displays data from AirVisual devices located in different regions of the world.
The Popudrenka station, which operates in accordance with European Union and United States Environmental Protection Agency (EPA) regulations, belongs to the O.M. Marzeiev Institute for Public Health of the National Academy of Medical Sciences of Ukraine (50.459° N, 30.634° E). The sampling site meets the requirements of the location representativeness when the sensor is placed out of the local sources of pollution and is free from aerodynamic turbulence. Measurements of PM2.5 mass concentrations are performed using the HORIBA APDA-371 Air Pollution Dust Analyzer, HORIBA, Ltd., Kyoto, Japan, which is used to justify the AirVisual Pro data. The Popudrenka station provides automatic continuous measurement of PM2.5 mass concentrations with long-term stability using the industry-certified principle of the beta ray attenuation method. The measurement accuracy of the method is ±5%.

2.2. AERONET Sun-Photometer Data

The ground-based network of the automatic sun-photometers AERONET (AErosol RObotic NETwork) [39,40] consists of several hundreds of observational sites located all over the globe and allows obtaining long-term series of aerosol parameters averaged in the atmosphere column at each observational site. The CIMEL CE318 sun-photometers of various models are the principal instruments of the network. The measurements are performed in the spectral bands 440, 500, 675, 840, and 1020 nm. The AERONET Version 3 (V3) retrieval algorithm [47,48] is used to determine AOD and other aerosol columnar properties from sun-photometer measurements [47,48,49].
The AERONET data are useful to study the local aerosol behavior and seasonal dynamics. For the purposes of the paper, we used the data of the Kyiv AERONET site, which has continuously operated by authors since 2008 in the southwest part of the city of Kyiv [33,50,51]. The Kyiv AERONET site is located on the roof of the building where the Golosiiv Air Visual sensor is installed (see Figure 1, station 2) [51]. The site operates in Golosiiv forest in 10 km southward from the city center. We used level 1.5 of AERONET data, which is tested and corrected for the cloud impact under the standardized V3 algorithm for processing observational data [48,49]. Although sun-photometer data have not yet been corrected for possible changes in sun-photometer calibration, experience with sun-photometer shows that significant changes in sun-photometer parameters over a period of 2 months are very unlikely. In the present study, we considered daily averages of AOD at 500 nm, Ångström exponent (AE) values computed using the 440–870 nm spectral channels, particles columnar size distribution, single-scattering albedo (SSA), and complex refractive index (RI). Analysis of the previous observations showed that typical AOD values at wavelengths 500 nm at the Kyiv site do not exceed 0.2–0.3 [6,33,50].
The Ångström exponent is determined as AE = −d ln (AODλ)/d ln λ and varies with the choice of wavelengths [52]. In general, the AE can be calculated from two or more wavelengths using a least-squares fit. The AERONET algorithm defines AE in the range of 440–870 nm. The Ångström exponent contains information on the size of the particles and determines the dominant aerosol mode (coarse or fine) [49,52,53]. Single-scattering albedo is defined as the ratio of the AOD caused by the scattering feature to the AOD caused by total extinction (scattering and absorption) property of the particle. SSA depends on the complex refractive index of the aerosol particle. The microphysical and chemical properties of aerosol particles determine the complex RI. Particularly, the absorption properties of the aerosol particles determine the imaginary part of the RI. The nature and basic chemical composition can be assumed using the information on these two parameters.
Parameters of the aerosol particles columnar size distribution include the volume effective (Reff) and the volume median (RMed) radius of the particles, and the geometric standard deviation (STD) of the particle radius r from the RMed for lognormal radius distribution. Uncertainties regarding the volume median radius and geometric standard deviation of particle radius from volume median radius (i.e., uncertainties of the modal radius and width of the particle size distribution) retrieved by V3 AERONET algorithm depend on the total particle AOD (440 nm) [49]. A special procedure for the STD estimation of aerosol particle parameters was created by AERONET team [48]. The procedure considers the uncertainties in the sun-photometer radiometric calibration, AOD (440 nm) measurements, solar spectral irradiance, and surface reflectance, which results in 27 distinct combinations of the perturbed input parameters to the inversion procedure algorithm.
In the AERONET algorithm, the particle volume size distribution is determined using the bimodal lognormal model, which consists of fine and coarse modes [47,48]. The minimum of the two-modal size distribution is a boundary between fine and coarse modes that lies in the particle diameter range of 1 to 2 μm. The fine-mode AOD is determined by the spectral discrimination algorithm from spectral AOD measurements [53] using the bimodal lognormal model of aerosol particle size distribution.

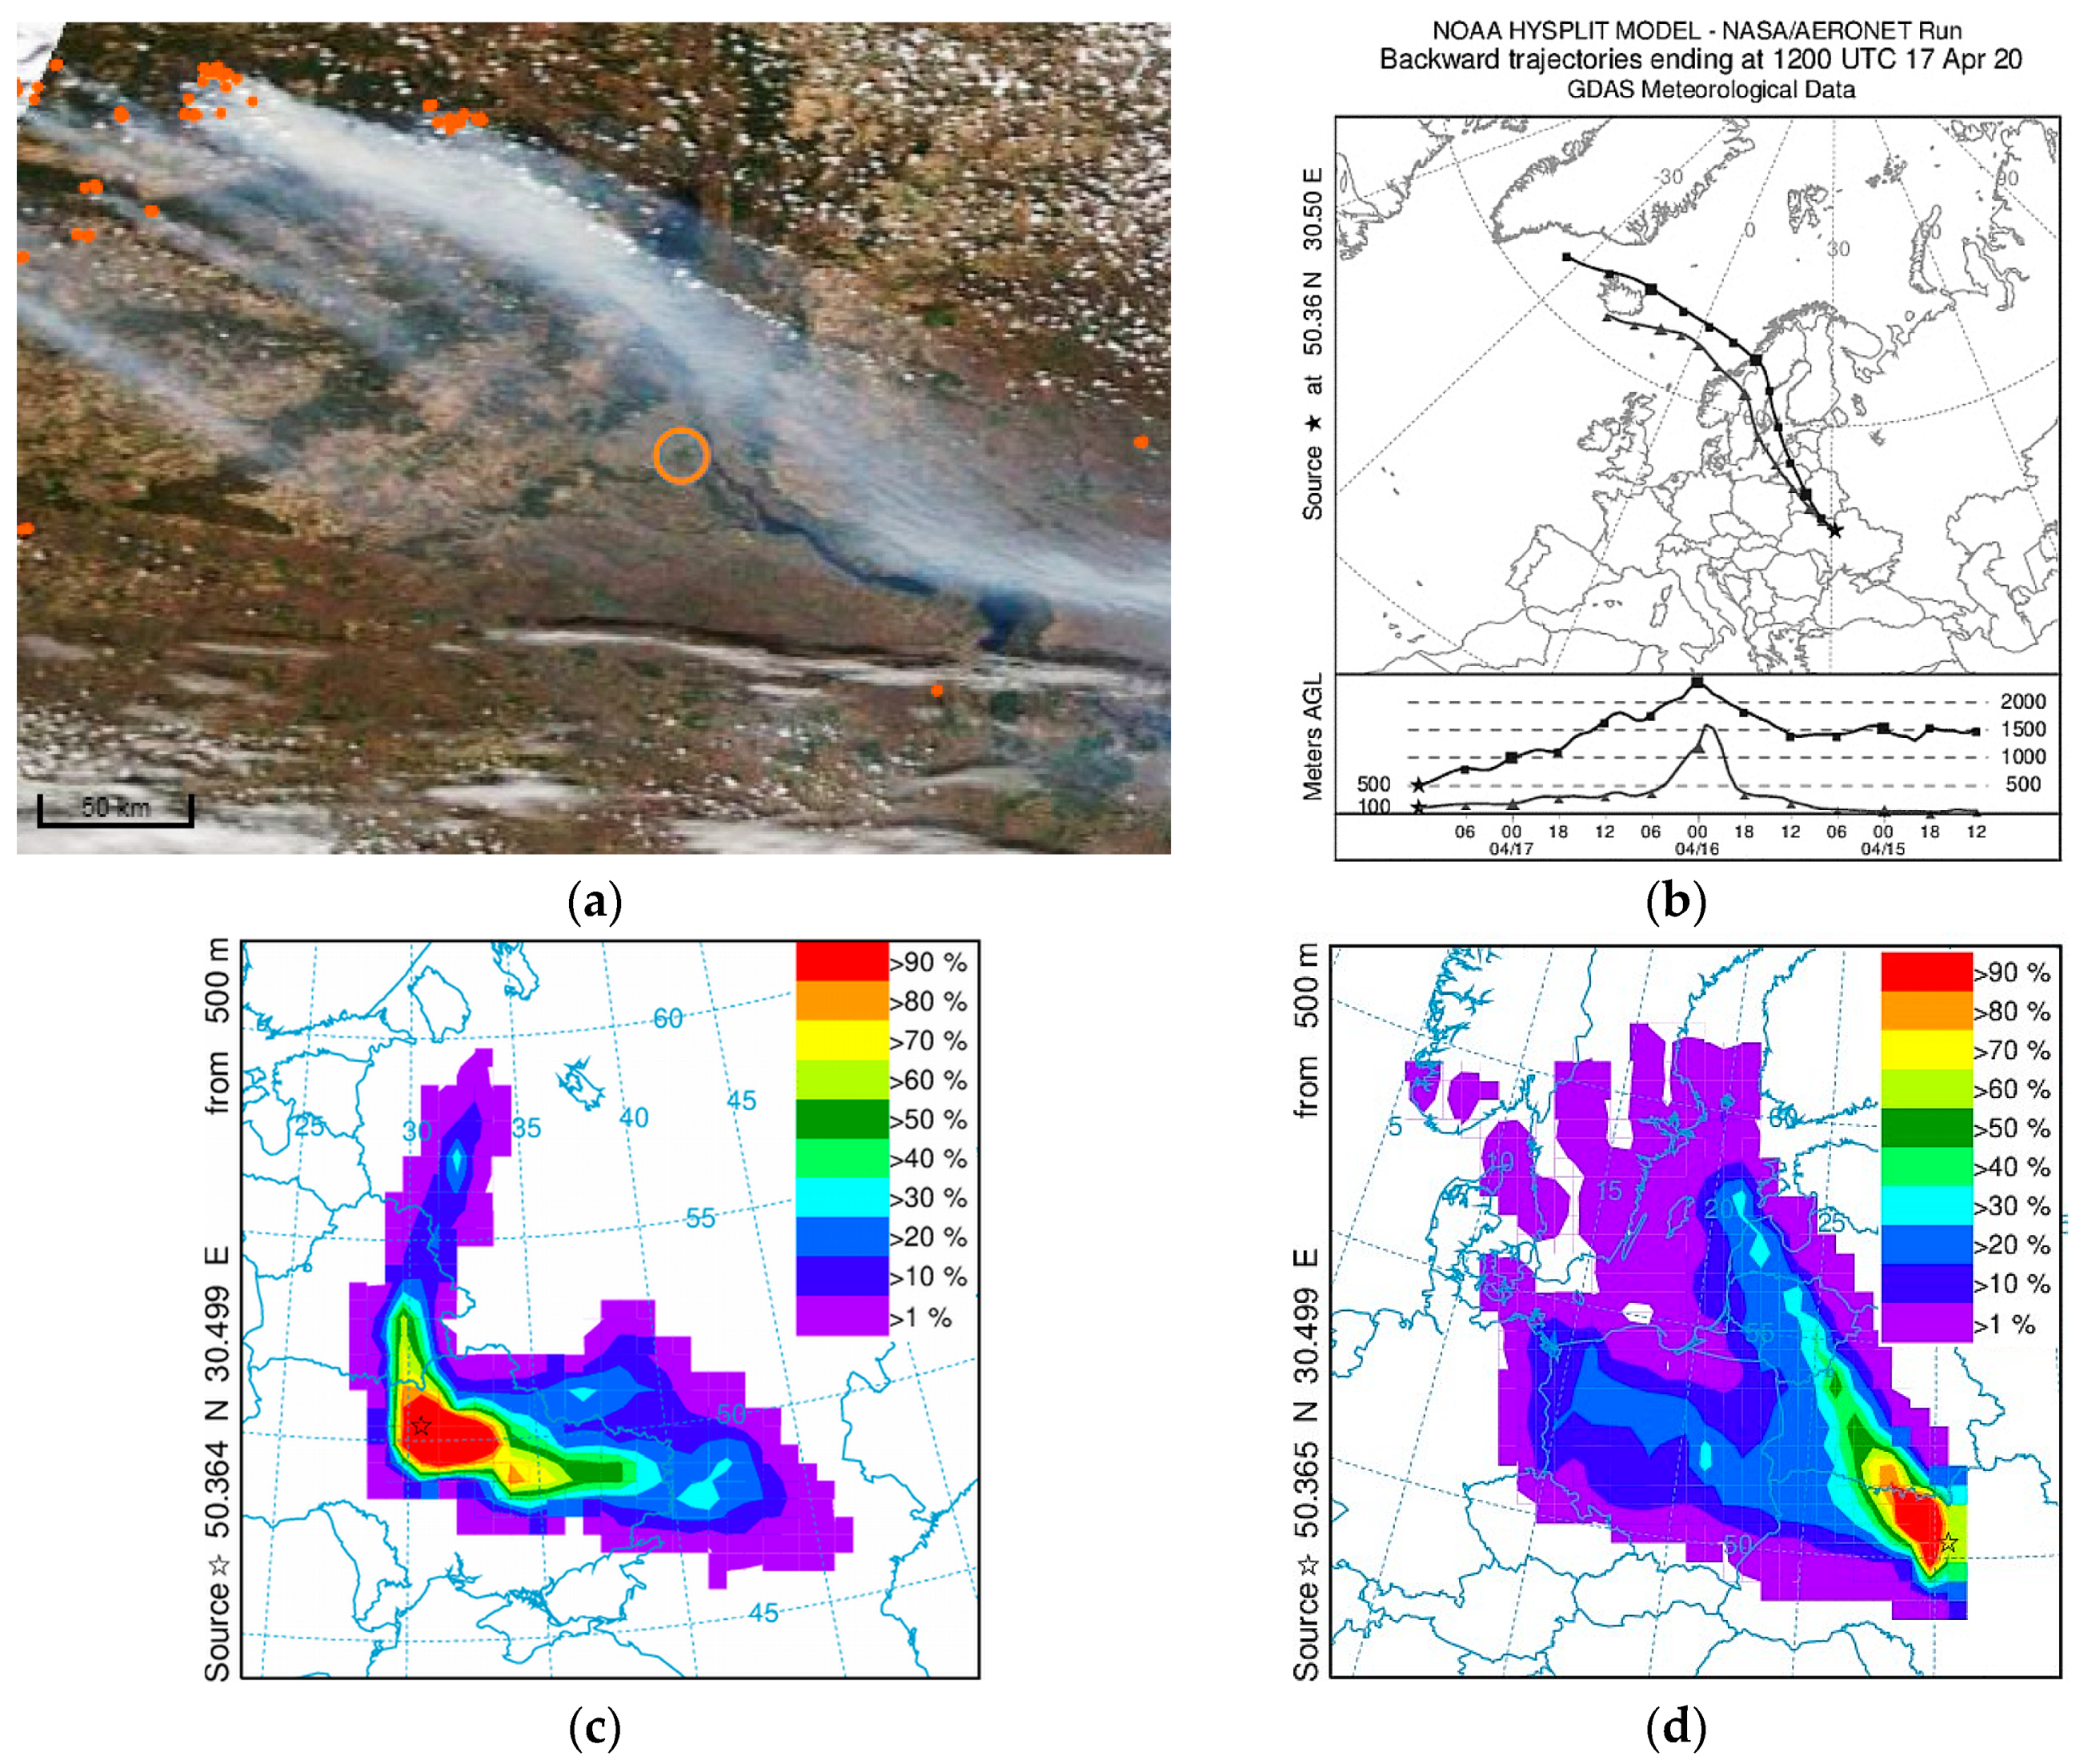
2.3. Satellite Data on Fire Locations

Moderate Resolution Imaging Spectroradiometer (MODIS) is an instrument aboard the Terra (known as EOS AM-1) and Aqua (known as EOS PM-1) satellites. Terra and Aqua MODIS instruments are viewing the entire Earth’s surface every 1 to 2 days, acquiring data in 36 spectral bands, or groups of wavelengths. The infrared channels provide observations of thermal anomalies/active fire. The observations are available in near-real-time and for almost global coverage. The fire detection by MODIS is based on absolute detection of a fire when the fire strength is enough to detect, and on detection, relative to its background, taking into account the variability of surface temperature and reflection of sunlight.
The Visible Infrared Imaging Radiometer Suite (VIIRS) satellite instrument collects global observations in the visible and infrared wavelengths across land, ocean, and atmosphere. It has 22 channels ranging from 0.41 μm to 12.01 μm. VIIRS is one of five instruments onboard the Suomi National Polar-orbiting Partnership (SNPP) satellite platform. Besides measuring aerosol properties, ocean and land surface temperature, ice movement and temperature, the VIIRS data product can be used for fires observations. The VIIRS 375 m resolution thermal anomalies/active fire data product and near-real-time MODIS thermal anomalies and fire locations provide images of the area [44], which produced strong aerosol contamination of the atmosphere over the city of Kyiv (Figure 2). Satellite image for the date of the outburst of pollution is shown in Figure 2b for 8 April 2020 with the large forest fire in the north of the Kyiv region [43].

2.4. Back-Trajectories Simulation Technique

To analyze the impact of weather conditions on the aerosols loading and transport in the atmosphere during wildfires in March–April 2020, we calculated trajectories of air masses using Hybrid Single Particle Lagrangian Integrated Trajectory Model (HYSPLIT) [41,42,54,55]. This model was developed by the National Oceanic and Atmospheric Administration’s (NOAA) Air Resources Laboratory (ARL) [41,42]. Based on numerical and physical limitations of the model, the error in the trajectory location is typical of ~20% of the distance traveled by the air parcel [54]. The HYSPLIT model uses a large variety of meteorological data, which are results of observations and calculations by numerical meteorological models. The following meteorological parameters are employed for computing the trajectory: horizontal components of wind speed, temperature, pressure on the altitude of the trajectory, and surface pressure. We used the online version of the HYSPLIT program via AERONET/Data Synergy Tool [55] to compute the back-trajectories of the air mass starting from the Kyiv AERONET site for altitudes of 100 and 500 m above ground level (AGL). For back-trajectory calculations in this paper, we used the Global Data Assimilation System (GDAS) meteorological data with spatial resolution of 1 degree [55].

3. Results and Discussion
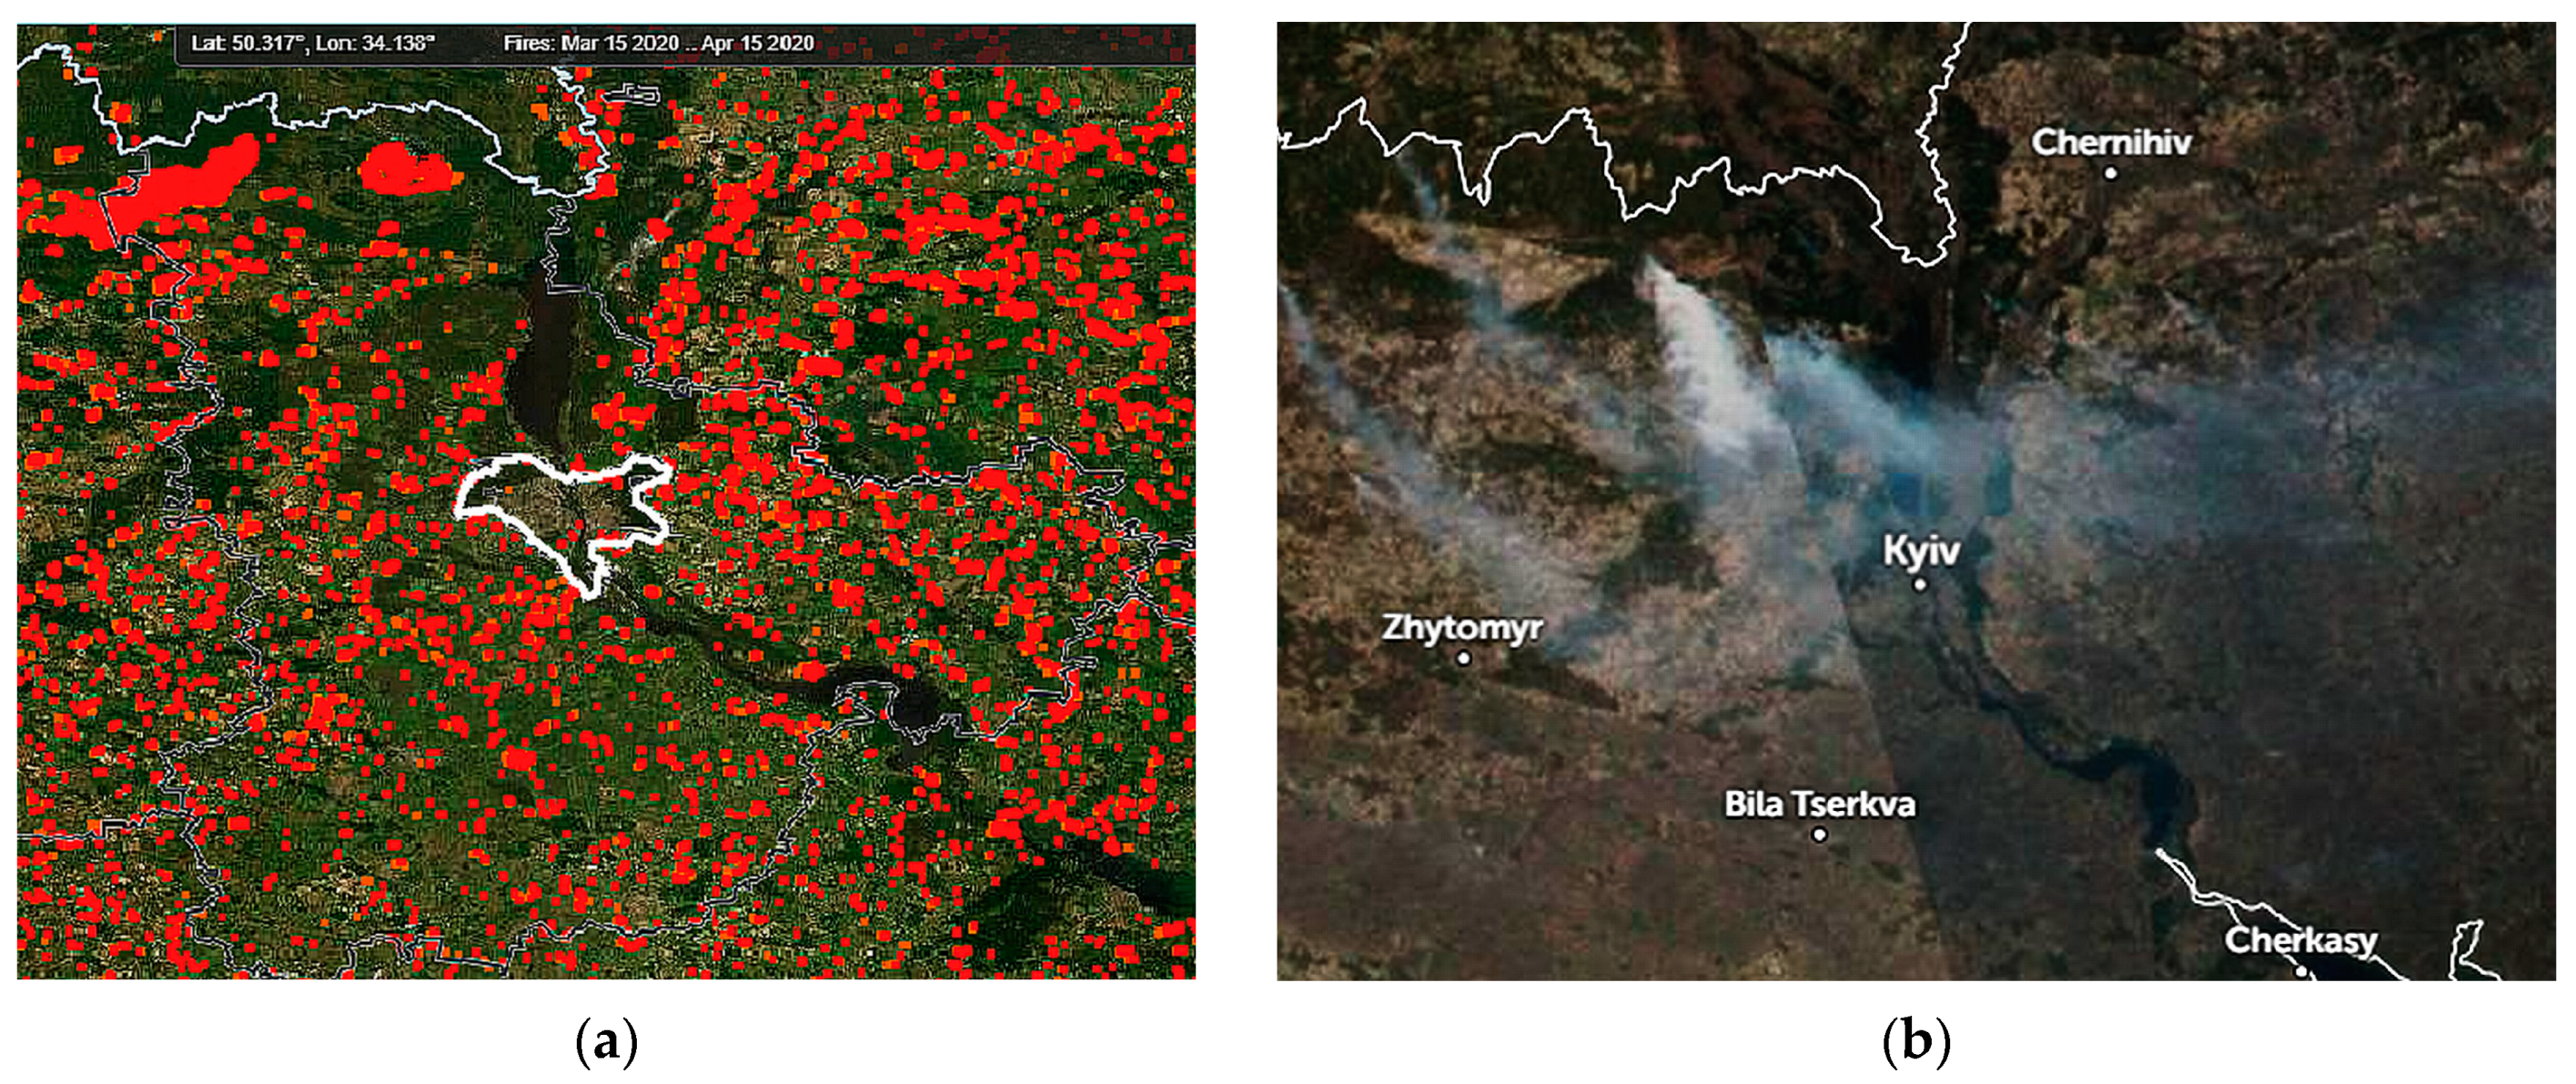
3.1. Fire Locations

Increasing wildfires in the spring in Ukraine and neighboring countries is a typical situation often caused by traditional grass burning. However, in 2020 these events and dry weather conditions led to extensive problems, such as huge uncontrolled wildfires (especially in the northern part of Ukraine), widely burned territories, and strong air contamination over Kyiv and other cities. The satellite observations detected numerous places of thermal anomalies in North Ukraine during the period from 15 March to 15 April 2020. Figure 2a shows the image provided by VIIRS, to 375 m resolution, of thermal anomalies/active fire data and near-real-time MODIS thermal anomalies and fire location products [44], where fire locations are marked with red color. The northeast winds brought aerosol-rich airs over large distances from fire sources; dense smoke could be observed from space. The city of Kyiv and its suburbs were covered by a powerful smoke layer from wildfire regions from time to time during the considered period. Satellite imagery [43] shows the outburst of pollution from the large forest fire in the north of the Kyiv region on 8 April 2020 (Figure 2b).

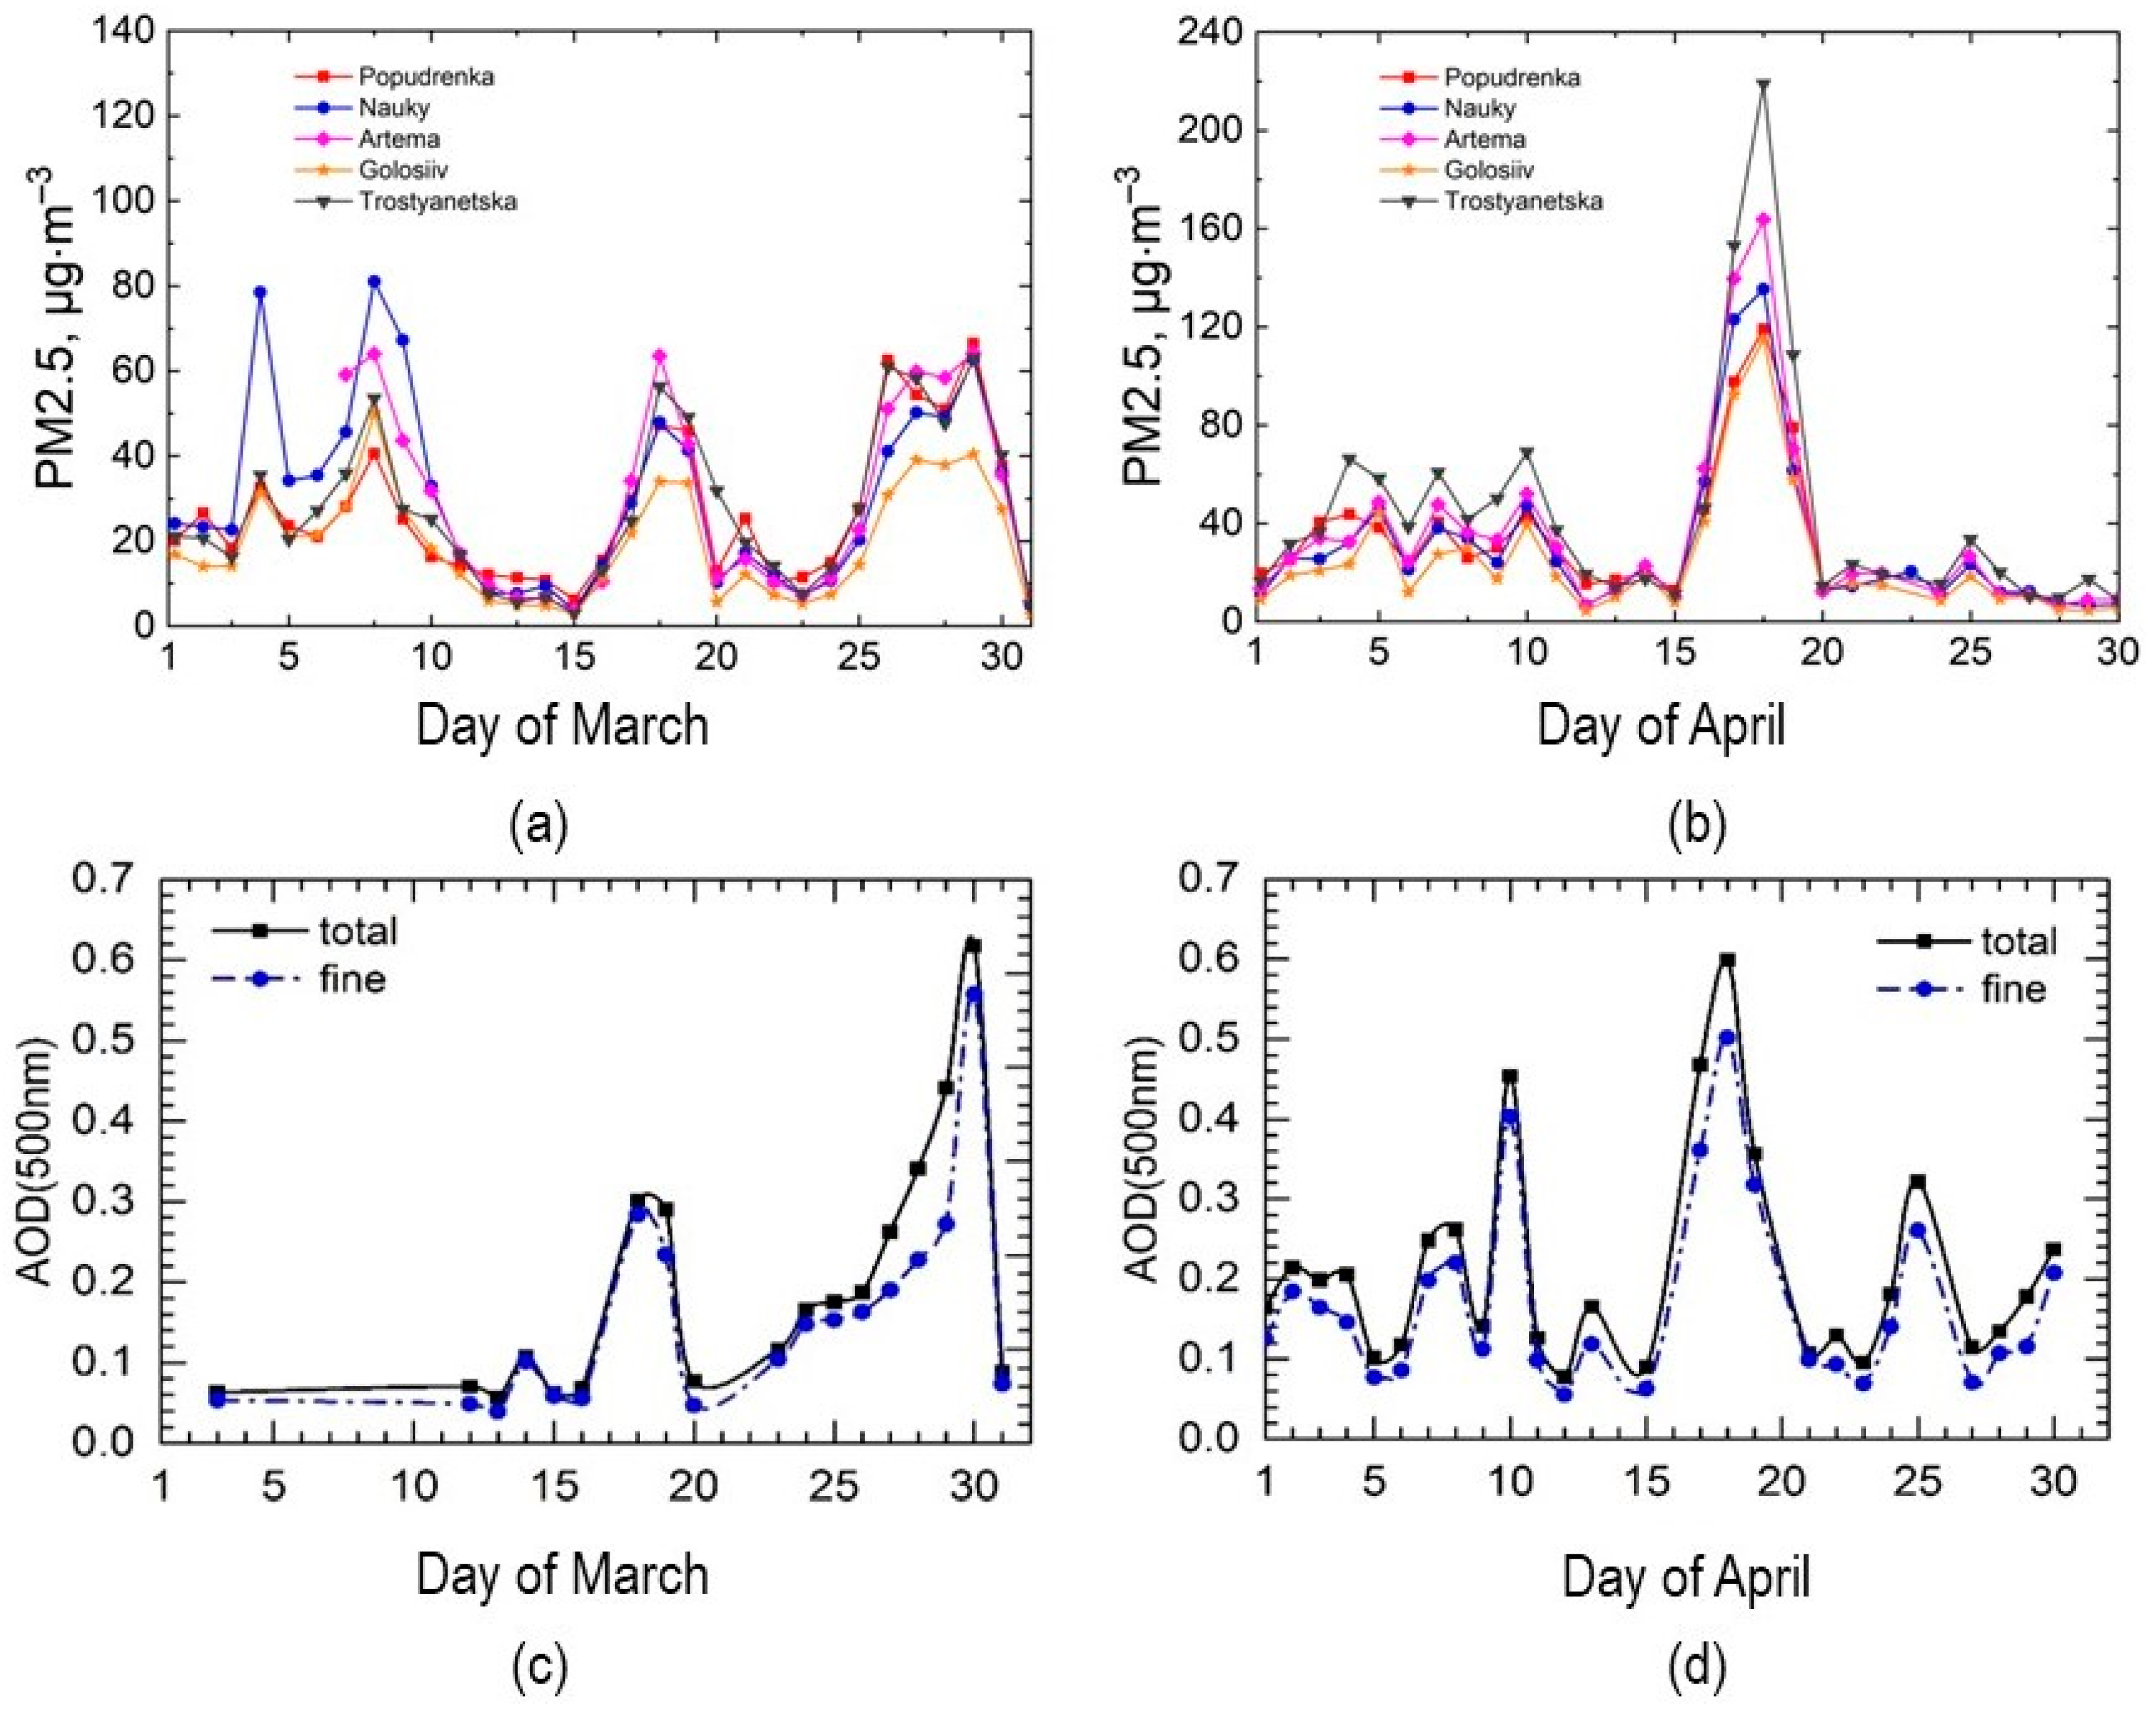
3.2. In Situ Measurements

Using observations from four AirVisual sites and Popudrenka station, the data of PM2.5 concentration in the atmosphere over the city of Kyiv were collected for the March–April 2020 period (Figure 3a,b). In March, four maxima of PM2.5 were observed. The PM2.5 concentration increased up to approximately 80 μg m−3, which is three times higher than the threshold of PM2.5 pollution according to European standards of 25 μg m−3 (Figure 3a). The largest pollution was observed at the Nauky Avenue site in the first half of March, and at Artema Street and Trostyanetska sites in the second half of March 2020 (Figure 3a).
In April, a significant increase of PM2.5 aerosol contamination to 40–70 μg m−3 was registered in the first half of April with the maximum detected at the Trostyanetska site. Extreme contamination with the PM2.5 maximum of 220 μg m−3 was observed on 18 April (Figure 3b). Therefore, the level of pollution by PM2.5 particles was almost 10 times higher than the EU restrictions.
The extreme contamination with PM2.5 aerosols was observed at all sites of the in situ measurement network in the Kyiv city, with the largest daily averaged values at the Trostyanetska site. The data of AirVisual stations are in good agreement with the PM2.5 values variations at Popudrenka station (Figure 3a,b). To estimate the reliability and accuracy of the in situ measurements, we compared daily averaged PM2.5 concentrations obtained by AirVisual stations with PM2.5 concentrations measured by the EU-certified APDA-371 HORIBA sensor (Figure 4a).
As shown in Figure 4a, the values of aerosol contamination obtained with the AirVisual and the APDA-371 HORIBA sensors are consistent for small concentrations of PM2.5 (up to ~40 μg m−3), but the divergence increases at values of PM2.5 more than 60 μg m−3. Linear regression with Pearson correlation coefficient provided a value of r = 0.94.
The measurements show a spatial difference between AirVisual stations (Figure 3). If in March, the highest PM2.5 values were observed at Nauky Avenue and Artema Street stations; in April, the highest (extreme) pollution levels were observed at Trostyanetska station. The lowest values of PM2.5, as expected, were observed at Golosiiv station, which is located in the forest-park zone on the outskirts of the Kyiv city. However, the time variations of PM2.5 concentration at this station also follow the variations of PM2.5 at other stations.

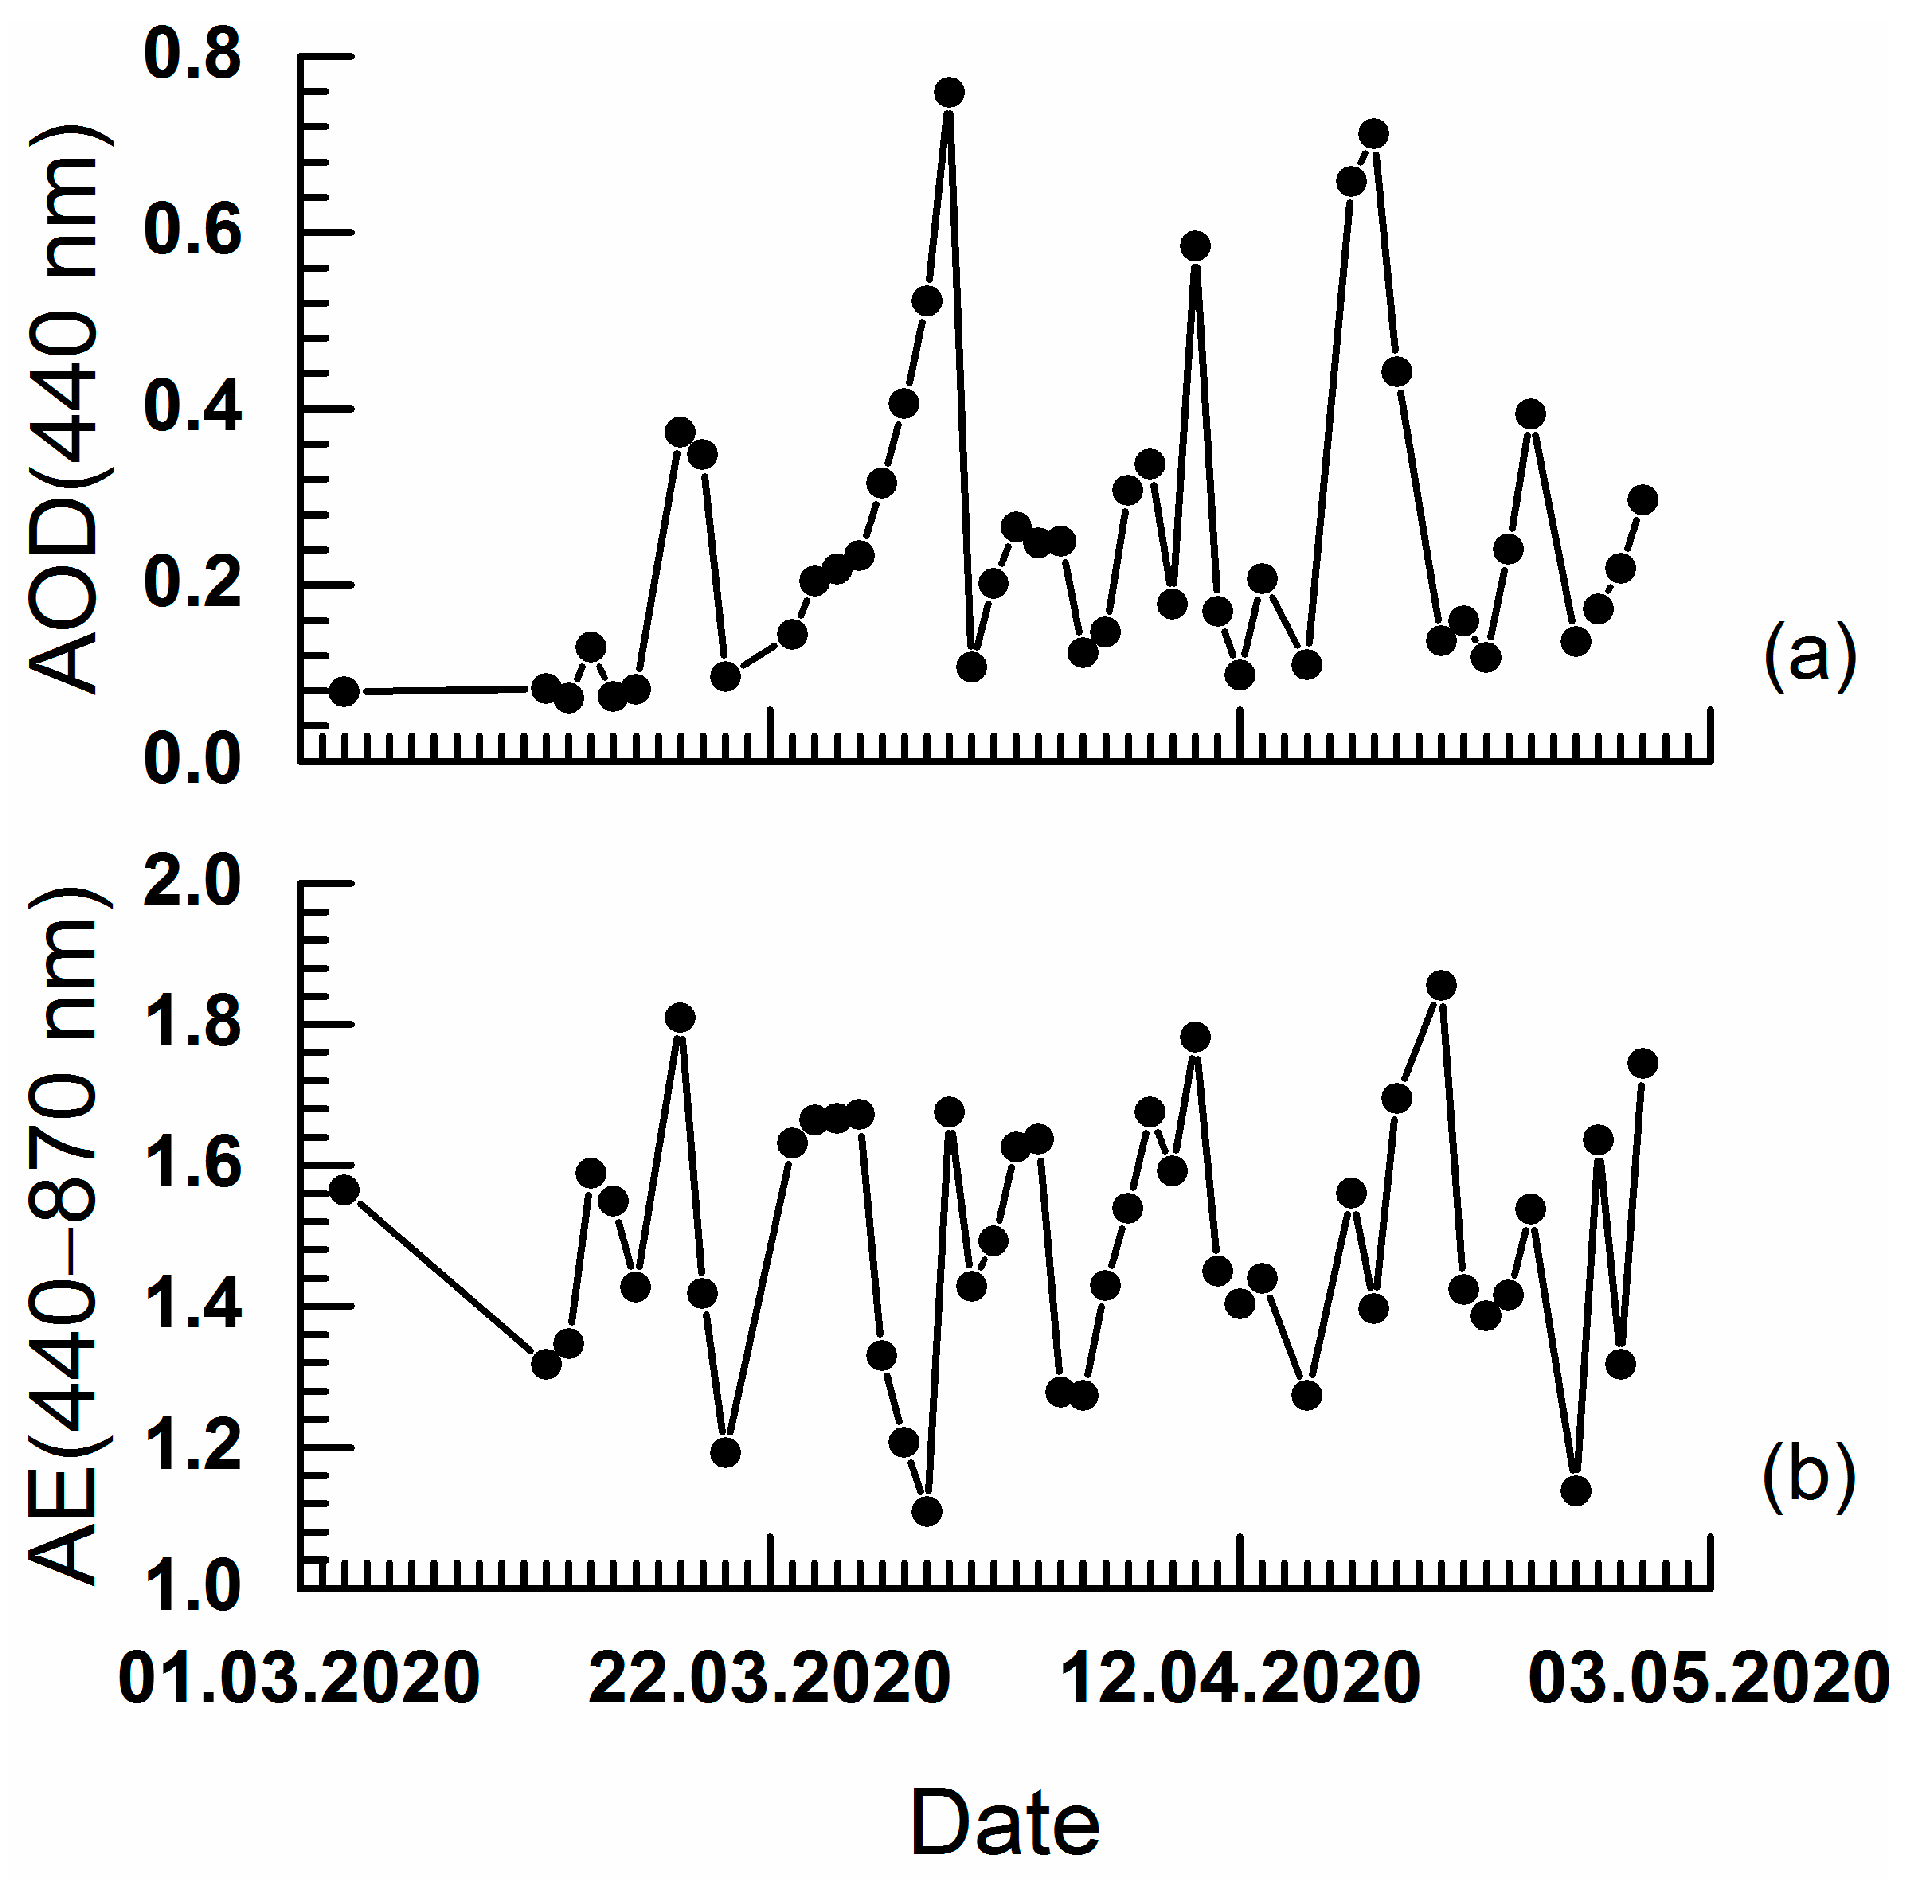
3.3. AOD and Ångström Exponent Data of the Kyiv AERONET Site

During March–April 2020, the events of significant AOD increasing were detected from sun-photometer observations of the Kyiv AERONET site (Figure 3c,d). The aerosol content increases mainly due to the fine-mode, as presented in aerosol size distribution plots.
It was for the first time when the event of the large atmosphere aerosol contamination was observed in the Kyiv city simultaneously by the sun-photometer and devices for PM2.5 measurements. To compare PM2.5 concentration and AOD data, the daily averaged PM2.5 data obtained at four sites (Artema Street, Popudrenka, Nauky Avenue, and Golosiiv) were used on the days when AOD were measured with the sun-photometer at the Kyiv AERONET site during March and April 2020 (Figure 4b). The daily PM2.5 data were averaged over four AirVisual sites and compared with corresponding daily averaged AOD (500 nm). The equation of linear regression AOD (500 nm) = a + b⋅PM2.5 was used to quantify the AOD versus PM2.5 relation. Obtained parameters of regression: Pearson’s correlation coefficient r = 0.81, standard deviation (STD) of 0.09; a = 0.088 ± 0.019; b = 0.004 ± 0.0004. Formally, the r value indicates the close relationship between AOD and PM2.5 parameters of the atmosphere pollution, but it is obviously caused mainly by high contamination level in the near-ground air and atmosphere column on two days on 17 and 18 April. On the contrary, AOD (500 nm) of 0.62 was observed on 29 March at relatively moderate contamination at the ground level (PM2.5 = 45 µg m−3). Very low AOD occurred at the same level of PM2.5 (see Figure 3b).
Comparison of the results of sun-photometer measurements with the data from the in situ network shows that changes of AOD (500 nm) were accompanied with simultaneous changes in the PM2.5 concentration (Figure 3). Both data series show a significant increase in air pollution over the city of Kyiv on 17–19 and 25–30 March, and during the 16–19 April period. The cloudiness explains the data gaps from 3 to 12 March and during some other days in March and April (Figure 3c,d). However, some discrepancies are seen between AOD and PM2.5 data (see Figure 3b and compare Figure 3a,c). Thus, PM2.5 concentration during 17–19 March was approximately the same as during March 25–30 (~40 to 70 μg m−3), but AOD increase was different: AOD (500 nm) was not greater than 0.3 during the former period or greater than 0.6 during latter. On the contrary, on 10 April, the sun-photometer registered a significant increase in AOD relative to its normal values from 1 to 15 April, while ground-based PM concentration measurements showed a more-or-less stable, but relatively high, level of PM2.5 concentrations. Apparently, this is possible due to the peculiarities of the movement of air masses at different altitudes, and the increase in AOD on this day could be caused by the transport of aerosol particles from distant sources above the surface layer of the atmosphere. During a forest fire, the smoke originating near the Earth’s surface can be transported by convection into the higher levels of the atmosphere, depending on fire characteristics and local atmospheric conditions. However, the aerosols at ~3–5 km can originate from elsewhere; for example, from fire-free regions. This can also be a reason for the observed difference between AOD and PM2.5 measurements.
We found that PM2.5 varied from ~5 µg m−3 to ~80 µg m−3 during the first smoke event and from ~3 µg m−3 to ~220 µg m−3 during the second event. The results from the first event are close to findings, e.g., in [56] for the forest fires in the province of Quebec, Canada. However, the results of PM2.5 concentration from the second event are more than twice higher, which indicates the extremely high fire activity during 17–19 April.
The large scattering of points relative to the regression line can be explained by different smoke plumes observed by AirVisual devices and by the sun-photometer, particularly because of the different velocities of the air mass moving at the different altitudes. However, analysis of the back-trajectories and satellite data on the fire locations showed the same origin of the atmosphere contamination by the aerosols during the period under study. It was the forest fires over large areas of Ukraine and surrounding territories of Belarus and Russia.
Along with AOD (500 nm), we considered other aerosol characteristics using the Kyiv AERONET site data that allow for estimating the size of aerosol particles and making assumptions about their nature; specifically, the Ångström exponent (AE) and the particle volume size distribution averaged on the atmosphere column.
The details of the change of the daily averaged AOD and AE variations during the period of significant pollution from 15 March 2020 to 21 April 2020 are presented in Figure 5. Variations of the daily AE (440–870 nm) (Figure 5b) are in the range of 1.6–1.8, which indicates the presence of a fine aerosol mode in the atmosphere produced by forest fires and urban aerosols.
After 26 March, the AE values decreased following AOD increase, which indicated coarse-mode aerosols incoming to the atmosphere column over the city of Kyiv up to 30 March, when AOD (440 nm) reached the peak value of approximately 0.8 (Figure 5a). AE increased again to 1.6–1.7 on 31 March and changed in range to approximately 1.7 to 1.2, with the typical AOD at the Kyiv AERONET site AOD (440 nm) at 0.1–0.3 on 10 April. The aerosol content and property variation during those days, as well as during the end of April and start of May, is not interesting for analysis; firstly, low aerosol content was determined from a low number of observations, and secondly, the AE short-time variations suggest that AOD variations were provoked by aerosol of various origins. On 10 April, the AOD increased dramatically, and AE values indicated fine mode aerosol as dominant in the atmosphere column. It is obvious that the smoke plume passed over the Kyiv AERONET site on that day.
Significant pollution of the atmosphere over the Kyiv city with biomass-burning aerosol occurred during 17–19 April. The AE increasing from 1.4 to 1.85 indicates that the fine-mode particles dominated in the atmosphere column on those days.

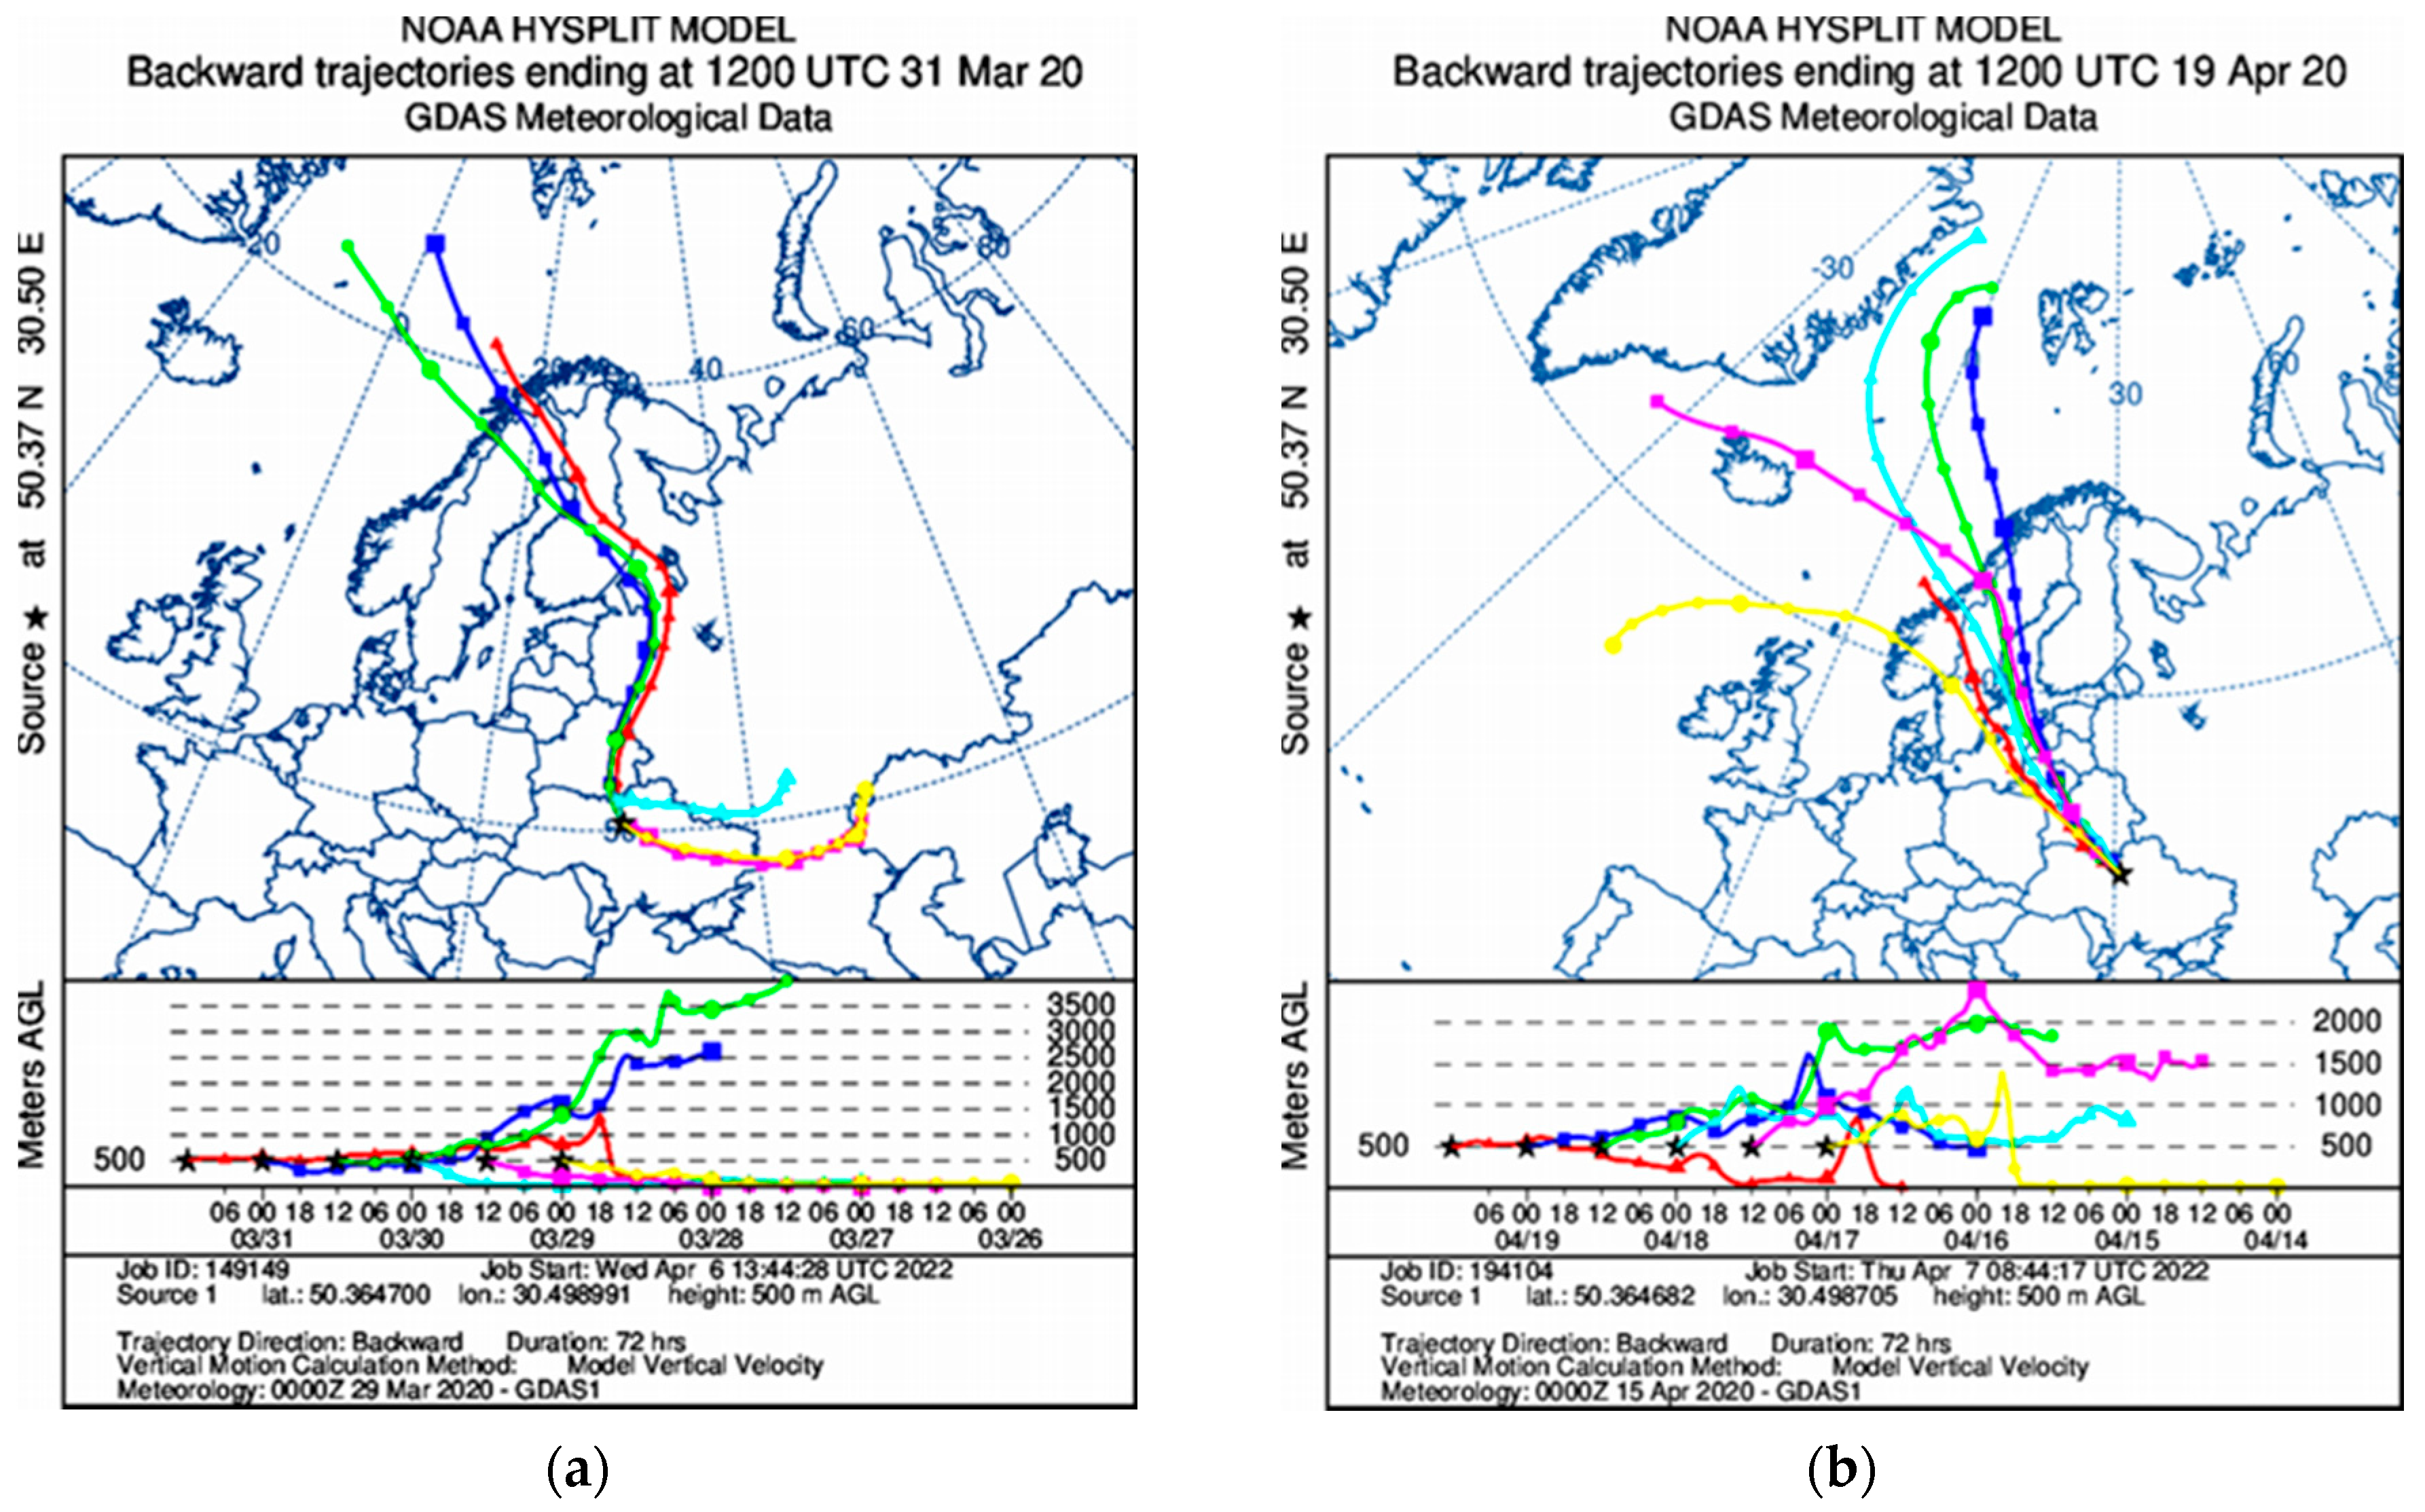
3.4. Air Mass Back-Trajectories

Air mass back-trajectories indicate the influence mostly of the large forest fires in the north region of Ukraine on the aerosol content and properties in the atmosphere over the Kyiv city in the spring of 2020 (Figure 6). The back-trajectories were computed with an online version of the HYSPLIT model [41,42,54,55] for altitude 0.1 to 5 km above ground level (AGL) starting from the Kyiv AERONET site.
Increased pollution of the air in the Kyiv city on 17–19 April was caused by the large forest fires that took place in the northern region of Ukraine, northwest of the city of Kyiv. Smoke trails from the fire locations visible on the MODIS pictures (Figure 6a) show this. The back-trajectories from the Kyiv city of the air mass movement (Figure 6b) indicate the northwest wind and the air passing over the fires on the 17–19 April event. Distances from the locations of the fires to the Golosiiv observational site ranged from approximately 90 to 240 km, as it can be estimated using the scale of the MODIS pictures. The largest fires were located at the distance of about 200 km. The air mass moved to the Kyiv city from the azimuth direction at approximately 300° while mixing the air layers in the altitude range from the surface to 1500 m AGL (Figure 6b) due to convection in the atmosphere (which originate mixing) produced by the fire.
The time-travel dependence on the altitude of the air mass means that the AirVisual sensors and the sun-photometer can observe different aerosol particles at the same time. It should be expected that, owing to the air mass speed dependence on altitude, the sun-photometer observes “fresher” aerosol compared to AirVisual sensors.
We also used trajectory frequency plots, which provide information about dominant wind directions and air mass movements over Kyiv [57]. The trajectory frequency option starts a trajectory from a single location: the Kyiv AERONET site at a height of 500 m AGL, every 3 h. The analysis has been done on 3 days of archive trajectories (Figure 6c,d).
Back-trajectories at altitude 500 m AGL starting from the Kyiv AERONET site on March 26–30 passed over territories with fires during the previous 3 days (Figure 6c). The results for March 30 at 12 UTC include information from 26 March at 20 UTC (Figure 6c) and show that most air mass was transported to Kyiv from the southeast–northwest direction. Fires showed a maximum during 26–28 March, which were the most probable cause of aerosol loading of the atmosphere over the Kyiv city on those days. During this period, wildfires in the East and the South parts of Ukraine were detected.
Another case that contains calculation from 14 April at 20 UTC until 18 April at 12 UTC (Figure 6d), shows opposite directions of air mass transfer. For this period, the north and northwest air movements were typical. In this case, air masses with aerosol contamination from the northwest and north regions, including the Chernobyl area, reached the Kyiv city and its suburbs.

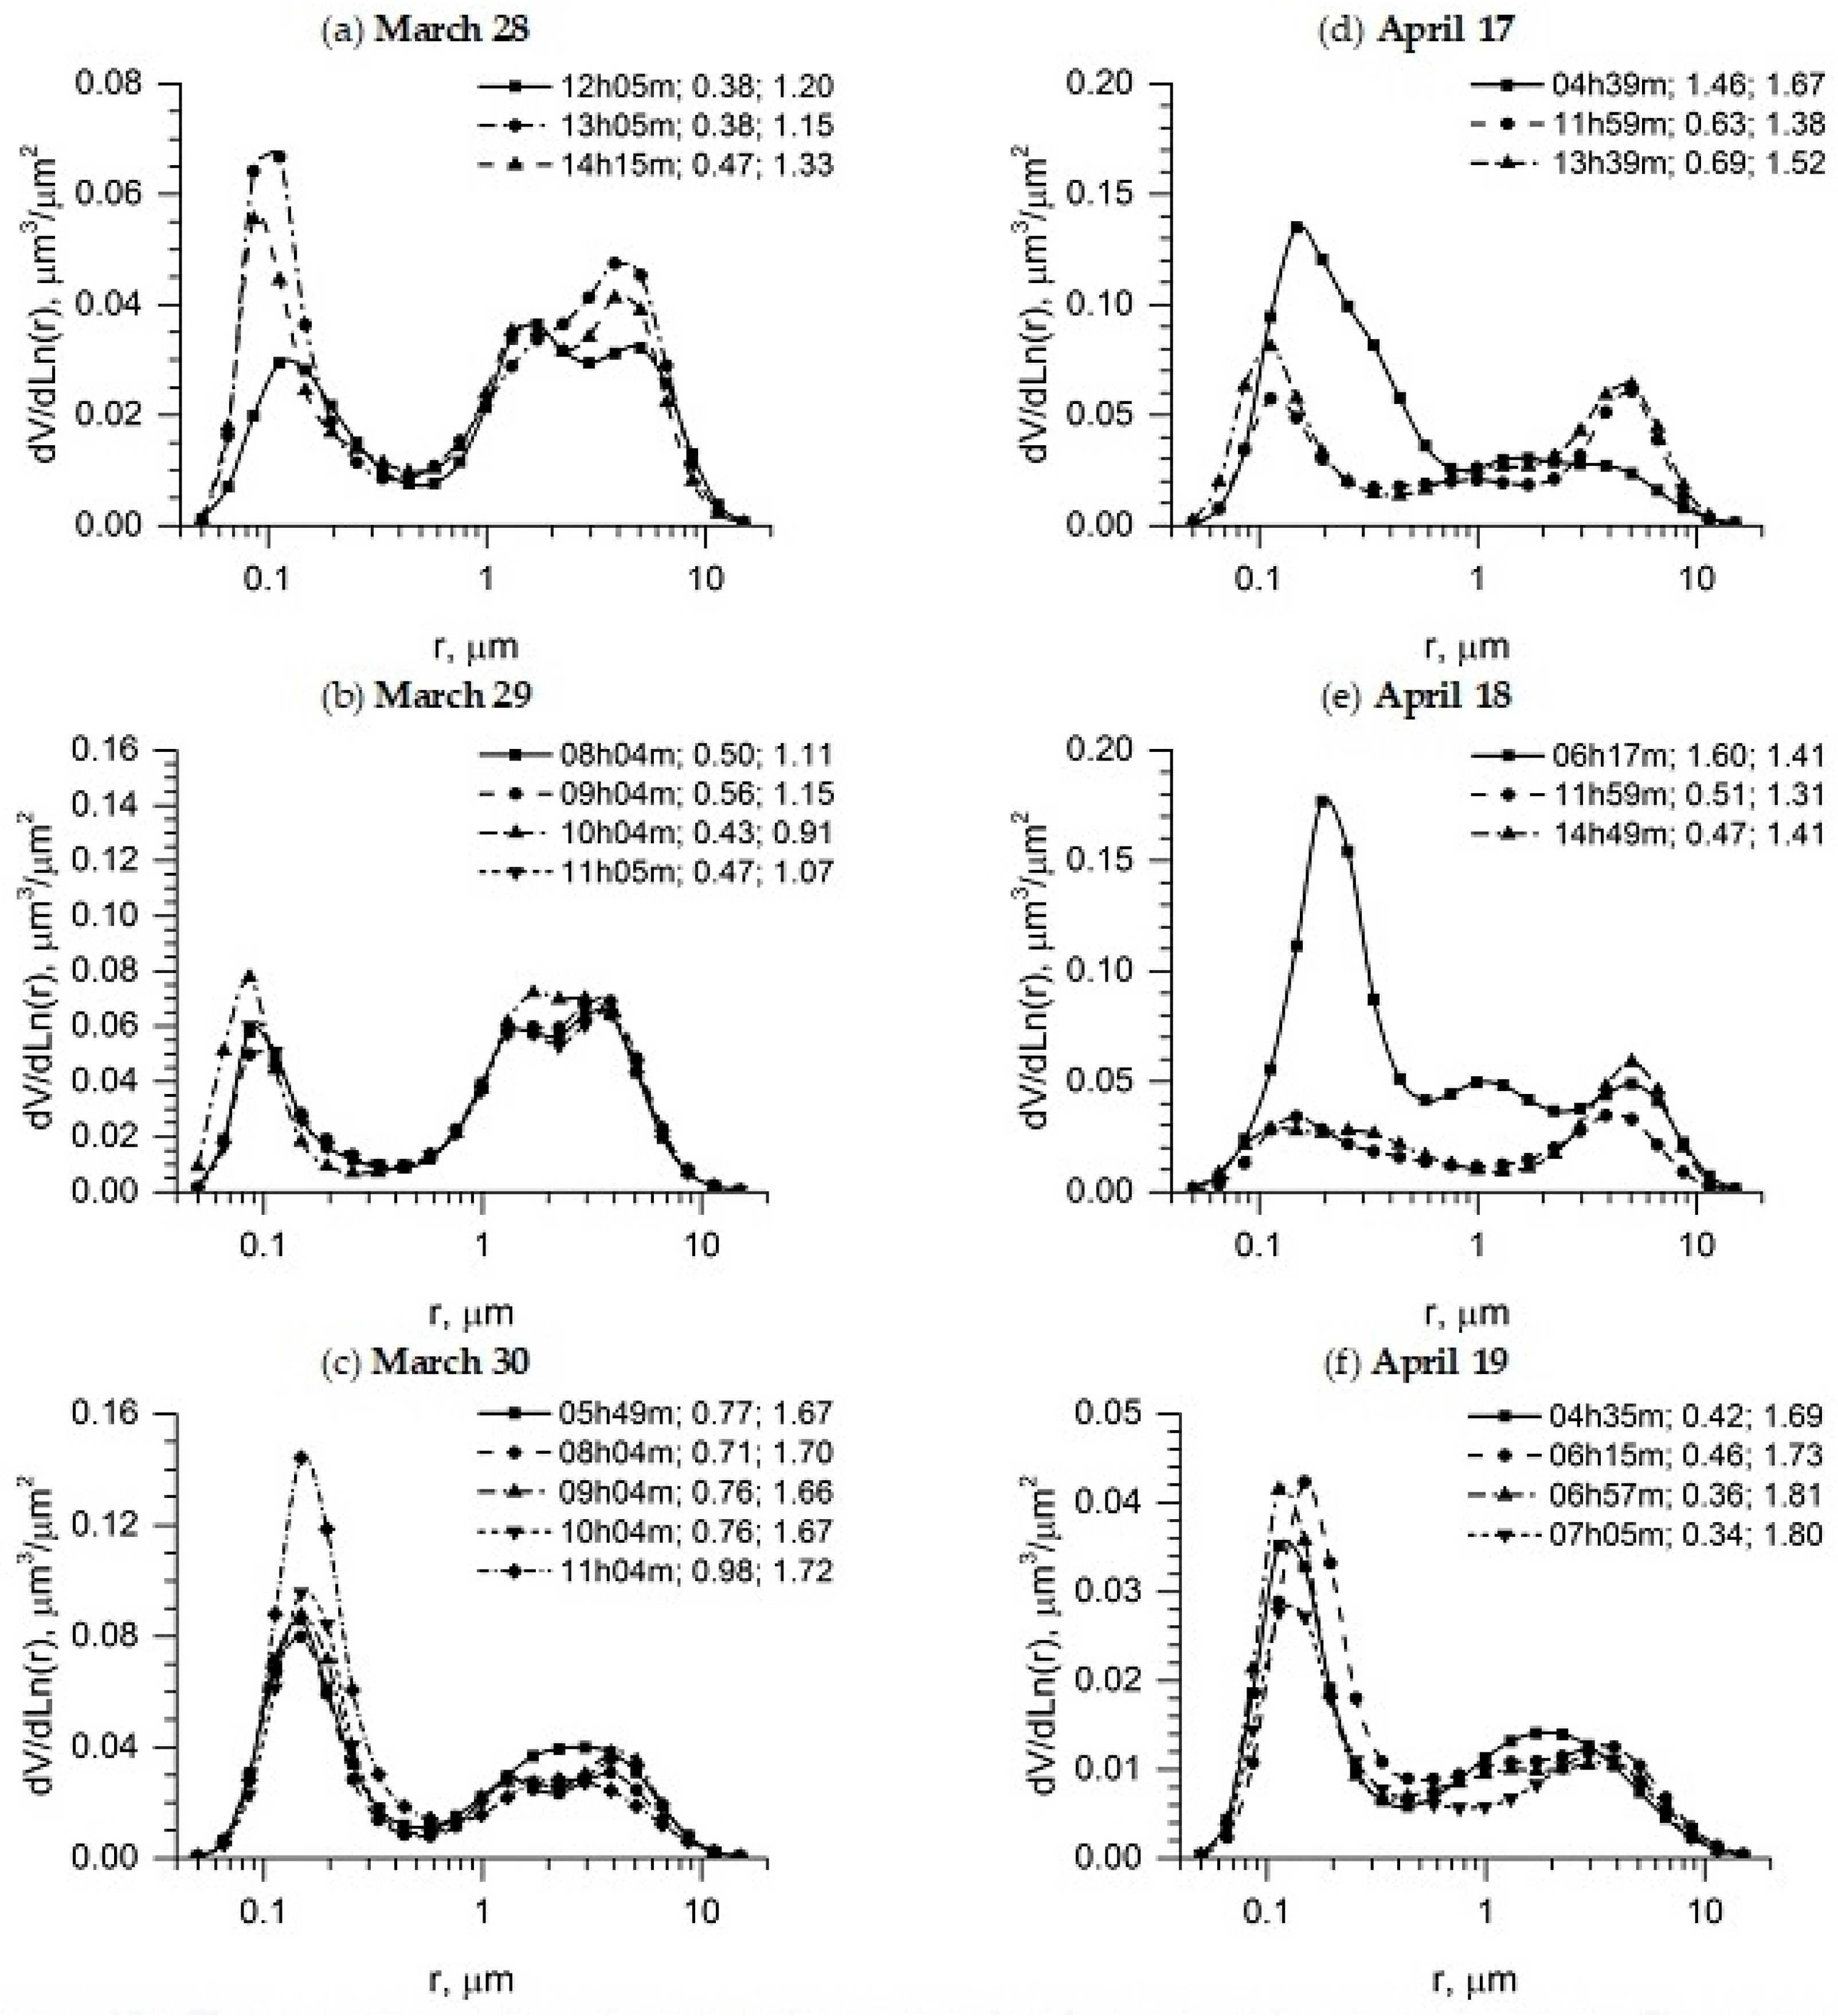
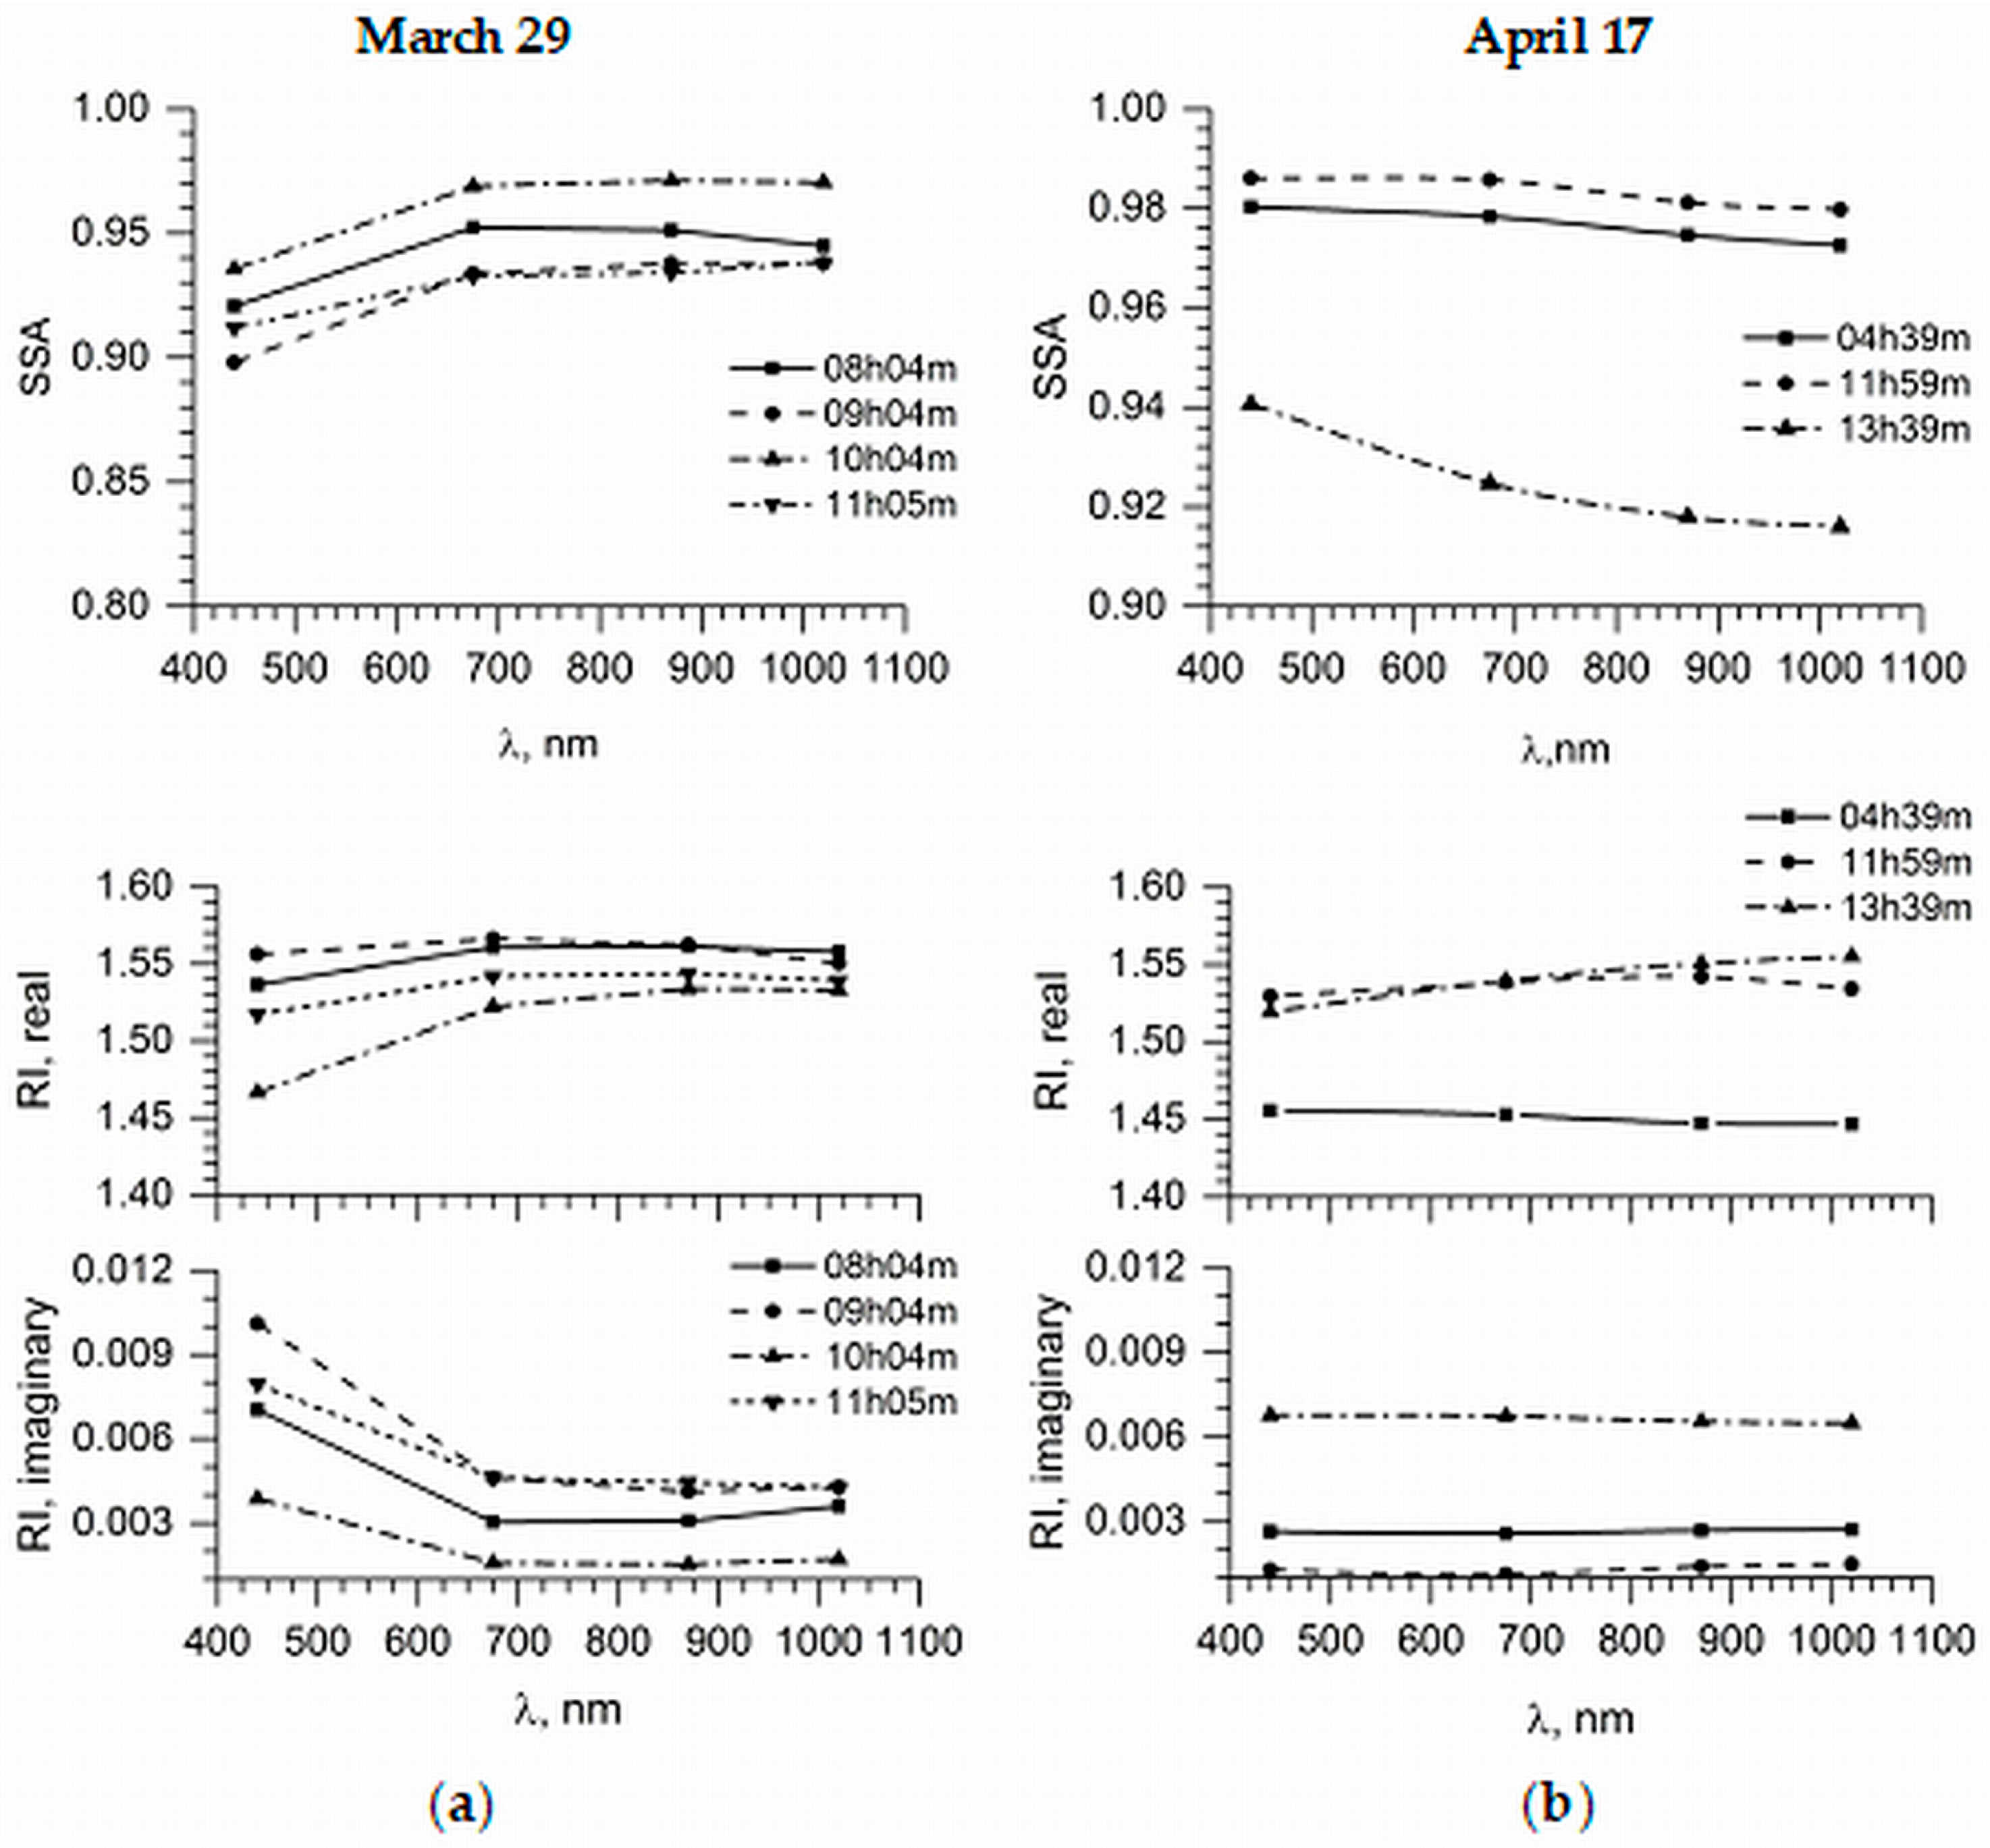
3.5. Aerosol Size Distribution, Single-Scattering Albedo, and Refractive Index

Observations with the sun-photometer at the Kyiv AERONET site during the events of the forest fires in March and April of 2020 qualified to determine the aerosol size distribution were sparse because of clouds. There were 20 successful blue-sky sun-photometer observations with appropriate quality data to determine the aerosol size distribution in the period 28 March 2020–19 April 2020. The data showed that particle size distribution was very variable (Figure 7). During 29 March, coarse-mode particles predominated over fine-mode only. In most of the other cases, the fine-mode was dominant.
The parameters of the size distribution for the accumulation mode (fine mode) and coarse mode are given in Table 1, where Reff is the volume effective and RMed is the volume median radius of the particles, and STD is the geometric standard deviation of particle radius r from the RMed for lognormal radius distribution (RMed/STD ≥ r ≥ RMed STD) at the confidence interval 0.67. The AOD and AE are the total particle parameters.
For all cases, the AOD (440 nm) was in the range 0.34–1.60, and uncertainties of the fine-mode particles RMed and STD could be estimated using data demonstrated by [48] for sites with dominant biomass-burning and urban/industrial aerosols. The uncertainties of the fine-mode particles RMed are 0.03 to 0.06 μm and the size distribution width for fine mode is 0.008 to 0.013 μm.
The time of smoke travel was estimated with the HYSPLIT model back-trajectories. Location of the fires and smoke origin were determined for 17 April (Figure 6a) and the age of aerosols was not more than approximately 10 h. In order to reach the Kyiv AERONET site on 27–29 March, the air mass traveled more than 2 to 3 days over the large area where fires took place (Figure 2a), and aerosol observed on those days was a mixture of particles of different ages. However, following Alados-Arboledas et al. [58] we can consider the aerosol observed at the Kyiv AERONET site as fresh during March and April events.
We note the difference in air mass movement during two smoke advection events in 26–30 March and in 15–19 April (Figure 8). While during the 15–19 April event the air mass movements were rather uniform from the northwest, the advection direction for the 26–30 March event changes from east and southeast to northwest, as seen in backward trajectories (Figure 8a). In (Figure 8a), the change in wind direction is visible from 29 March to 30 March. The change of aerosol properties (the aerosol size distribution) is seen in transition from eastern (Figure 7a,b) to northwest (Figure 7c) advection. While in eastern advection the coarse-mode aerosol prevails, after change to northwest advection, the fine-mode prevailed.
Aerosols of coarse mode apparently predominated in the particle size distribution during 28 and 29 March, when air masses arrived in the Kyiv city along the trajectories shown in Figure 8a from east and southeast over the burning open areas of both grasses and forest-steppe fields. The vegetation burn can produce coarse-mode particles consisting of dust, carbon aggregates, and ash. Some parts of aerosols in smoke plumes can reach quite large sizes [13]. After steppe vegetation fires, the wind also can lift up coarse-mode particles into the air from exposed soil. In the 28–29 March case, such particles arrived in large amounts over Kyiv (as the back-trajectories show in Figure 8a), while during the previous two or three days, air masses moved at low altitudes over regions where vegetation fires of various types took place (see Figure 2a). Therefore, soil dust, ash, and unburned parts of vegetation could rise into the air from wind. This process is more likely in the open areas, like steppe and forest-steppe areas, than in forested areas in the north, which may explain the predominance of coarse-mode aerosol in the particle size distributions during 28–29 March compared to the 30 March and 17–19 April periods (compare Figure 7a,b with Figure 7c–f). The coarse-mode aerosol in the 28–29 March case was a mixture of vegetation combustion products and mineral dust from open areas in the south and southeast of Ukraine. The dust intrusion to southeast of Ukraine also was seen from the Navy Aerosol Analysis and Prediction System (NAAPS) data on 27 March 2020, when the increased dust concentration “tongue” moved at lower layers of the atmosphere from the regions of Central Asia [59].
On 30 March, fine particles prevailed in the column of atmosphere over the Kyiv city (Figure 7c). This type size distribution is typical for aerosol from forest fires, see e.g., [8,11,59]. In that case, there is a lower content of soil dust, as air masses passed over areas with a predominance of forests (Figure 8a: red, green, and blue trajectories), where fires were observed during the previous three days.
Therefore, these two periods of the 26–30 March smoke advections differ due to the vegetation type difference that dominates in the eastern and southeastern Ukraine in comparison to northern Ukraine. In the northern part of Ukraine, mixed forest with woodland and marsh prevails, but in the east and southeast, there are mainly forest-steppe areas and the steppe open areas. The jump in the aerosol parameters of Reff, RMed, AOD, and AE from 29 March to 30 March is marked in bold in Table 1. For example, the AE value increased from 1.1 to 1.7, which closely corresponds to the transition from dust aerosol to biomass-burning aerosol [48].
The particle size distribution of fresh smoke is typically dominated by lognormal accumulation mode particles with median diameter of 0.12 μm, which is a fine mode in terms of the AERONET algorithm [13]. The volume median radius of the fine-mode particles in our study varies from 0.10 to 0.23 μm (see Table 1) and generally corresponds to data of other studies, e.g., [8,13,58,60]. In addition, fine mode of the particle size distribution is predominant in most cases except March 28 and 29, when the coarse-mode dominates (Figure 7a,b).
Dubovik et al. [60] obtained the fine-mode particles volume RMed = 0.13–0.16 μm depending on burned vegetation at different regions of the globe (Amazonian forest and Brazil cerrado, African savanna, US and Canada boreal forest), and coarse mode RMed = 3.4 μm for boreal forest fires and approximately 3.8–3.9 μm for the other noted vegetation fires. The coarse-mode particles RMed obtained from our observations during events in March and April is approximately 1.90 to 4.20 μm. This range is larger than obtained in [60]. It is evidence of the complexity of coarse aerosol mixture in the considered case. It is necessary to note that the data of the cited authors are a summary of several years of observations, while our results were obtained from the case study.
As SSA depends on the complex refractive index (RI) of the aerosol particle, both parameters were analyzed together (Figure 9).
The columnar SSA and RI were determined for the aerosols observed at the Kyiv AERONET site during events of significant pollution of the atmosphere in March and April 2020 and were very changeable both in value and in spectral dependence (Figure 9). The SSA and RI variation is very significant both from day to day and during each day. During March 30 and the 17–18 April event, fine particles from forest fires dominated over Kyiv, which determined both the particle size distribution and the spectral dependence of SSA and RI (Figure 7d–f and Figure 8b). The large values of SSA were retrieved on 30 March and 17–18 April, when SSA (440 nm) varied from 0.97 to 1.0 and SSA (1020 nm) varied from 0.90 to more than 0.99. The lowest values of SSA were retrieved on 28–29 March with SSA (440 nm) and SSA (1020 nm) not more than 0.88. However, generally the SSA values were quite high during those events of the aerosol loading in the atmosphere over Kyiv. In addition, the prominent feature was the variation of the spectral dependence of the SSA for those events. Although SSA (440 nm) was generally larger than SSA (1020 nm), except for 29 March, the slope of the wavelength dependence varied during a day.
During the 26–29 March case, the effect of coarse-mode aerosols appeared both in the size distribution and in the spectral dependence of SSA and RI (Figure 9). The presence of the coarse-mode aerosols led to an increase in SSA values with a wavelength on 29 March compared to 30 March and 17 April. The real part of the RI values also increased with a wavelength, but the imaginary part of the RI noticeably increased in the short-wavelength part of the visible spectrum in comparison to the spectral dependence imaginary RI on 17 April.
On the basis of data from the AERONET site [40] we can estimate the uncertainties of spectral SSA for the Kyiv AERONET site for the events under study to be approximately not more than 0.025 at 440 nm, 0.030 at 675 nm, 0.035 at 870 nm, and 0.045 at 1020 nm. The uncertainties of the real RI (440 nm) values can be estimated as less than 0.02 for AOD (440 nm) > 0.4, and the uncertainty for the imaginary RI (440 nm) values is less than 0.003, according to Sinyuk et al. [48].
The forests in the north region of Ukraine with latitudes of approximately 51–52° N are located on the border of the temperate and boreal zones, and in general, the properties of the smoke particles observed at the Kyiv AERONET site during the fires in March–April 2020 agree with cited results for this type of burning vegetation.

4. Conclusions

The first results of the recently created local network of AirVisual devices for surface air quality monitoring in the Kyiv city using PM2.5 concentration measurements are presented in the paper. We examine in detail the results of measurements of AirVisual stations, APDA-371 HORIBA Popudrenka station, and the Kyiv AERONET site air pollution by aerosol particles in the Kyiv city over the March–April 2020 period during forest fires spanning large areas in the northern region of Kyiv.
The properties of aerosol particles during pollution according to the measurements of the Kyiv AERONET site are also considered. These data allowed us to estimate variations in the size of aerosol particles and to make assumptions about their nature according to the Ångström exponent and its dependence on AOD at different wavelengths. Variability of the optical properties and chemical composition of the aerosol particles in the smoke plumes, which have passed over Kyiv, were caused by different burning materials and phases of fires at different times. These features of the BB aerosols are typical for the region.
In the nearest future, we plan to expand the network of AirVisual stations to obtain detailed information in other areas of Kyiv and to inform citizens on the state of air pollution. It also is planned to assess the risks of aerosol pollution on the health of Kyiv residents based on measurements in the AirVisual network and other existing tools. The discussed case of enormous PM2.5 aerosol contamination in Kyiv shows the need to accept strong measures for forest fire control and prevention in the Kyiv region, especially in northwest areas where radioactivity contamination from the Chernobyl disaster is still significant and impacting the ecosystem [61].

Author Contributions

Conceptualization, G.M. and V.D.; methodology, V.D., O.T., P.G., N.M. and G.M.; software, V.D., V.K., Y.Y., C.Z., D.S. and M.S.; validation, V.D., O.T., V.S., A.H., D.S. and G.M.; investigation, I.S., M.S., A.S., V.C., T.M., V.M., V.P., P.G., C.Z. and A.H.; writing—original draft preparation, G.M., V.D. and Y.Y.; writing—review and editing, G.M., V.D., N.M., P.G. and Y.Y.; visualization, A.P., V.K., Y.Y., V.D. and O.T.; supervision, G.M. and V.S.; project administration, G.M. and V.S. Each author contributed to the interpretation and discussion of the results and edited the manuscript. All authors have read and agreed to the published version of the manuscript.

Funding

This research received no external funding.

Institutional Review Board Statement

Not applicable.

Informed Consent Statement

Not applicable.

Data Availability Statement

Not applicable.

Acknowledgments

This work was partly supported by College of Physics International Center of Future Science, Jilin University, China; by the National Antarctic Scientific Center and Ministry of Education and Science of Ukraine, Kyiv, through the projects 20BF051-02; by the Belarusian Republican Foundation for Fundamental Research through the project F20UKA-017 and National Academy of Sciences of Ukraine through the project 01-01-20/21. We acknowledge the use of images modified by authors from the NASA Worldview application (https://worldview.earthdata.nasa.gov, accessed on 15 December 2021), part of the NASA Earth Observing System Data and Information System (EOSDIS). The work was partly supported from the European Union’s Horizon 2020 research and innovation program under the Marie Skłodowska-Curie grant agreement No 77834 and research and innovation program under ACTRIS-2 grant agreement No 654109. We thank Brent Holben (NASA/GSFC) for managing the AERONET program and its sites. The high quality of AERONET/PHOTONS data was provided by CIMEL sun-photometer calibration performed at the AERONET-EUROPE calibration center. The authors would like also to acknowledge the European Commission ‘Horizon 2020 Program’ that funded the ERA-PLANET/SMURBS project.

Conflicts of Interest

The authors declare no conflict of interest.

References

  1. IPCC. Contribution of Working Group II to the Sixth Assessment Report of the Intergovernmental Panel on Climate Change. In Climate Change 2022: Impacts, Adaptation, and Vulnerability; Pörtner, H.-O., Roberts, D.C., Tignor, M., Poloczanska, E.S., Mintenbeck, K., Alegría, A., Craig, M., Langsdorf, S., Löschke, S., Möller, V., et al., Eds.; Cambridge University Press: Cambridge, UK, 2022; Available online: https://www.ipcc.ch/report/ar6/wg2/ (accessed on 20 March 2022).
  2. Konovalov, I.B.; Beekmann, M.; Kuznetsova, I.N.; Yurova, A.; Zvyagintsev, A.M. Atmospheric impacts of the 2010 Russian wildfires: Integrating modelling and measurements of an extreme air pollution episode in the Moscow region. Atmos. Chem. Phys. 2011, 11, 10031–10056. [Google Scholar] [CrossRef] [Green Version]
  3. Chubarova, N.; Nezval’, Y.; Sviridenkov, I.; Smirnov, A.; Slutsker, I. Smoke aerosol and its radiative effects during extreme fire event over Central Russia in summer 2010. Atmos. Meas. Tech. 2012, 5, 557–568. [Google Scholar] [CrossRef] [Green Version]
  4. Portin, H.; Mielonen, T.; Leskinen, A.; Arola, A.; Pärjälä, E.; Romakkaniemi, S.; Laaksonen, A.; Lehtinen, K.E.J.; Komppula, M. Biomass burning aerosols observed in Eastern Finland during the Russian wildfires in summer 2010-Part 1: In-situ aerosol characterization. Atmos. Environ. 2012, 47, 269–278. [Google Scholar] [CrossRef]
  5. Mielonen, T.; Portin, H.; Komppula, M.; Leskinen, A.; Tamminen, J.; Ialongoc, I.; Hakkarainen, J.; Lehtinen, K.E.J.; Arola, A. Biomass burning aerosols observed in Eastern Finland during the Russian wildfires in summer 2010-Part 2: Remote Sensing. Atmos. Environ. 2012, 47, 279–287. [Google Scholar] [CrossRef]
  6. Galytska, E.; Danylevsky, V.; Hommel, R.; Burrows, J.P. Increased aerosols content in the atmosphere over Ukraine during summer 2010. Atmos. Meas. Tech. 2018, 11, 2101–2118. [Google Scholar] [CrossRef] [Green Version]
  7. Markowicz, K.M.; Chilinski, M.T.; Lisok, J.; Zawadzka, O.; Stachlewska, I.S.; Janicka, L.; Rozwadowska, A.; Makuch, P.; Pakszys, P.; Zielinski, T.; et al. Study of aerosol optical properties during long-range transport of biomass burning from Canada to Central Europe in July 2013. J. Aerosol Sci. 2016, 101, 156–173. [Google Scholar] [CrossRef]
  8. Reid, J.S.; Koppmann, R.; Eck, T.F.; Eleuterio, D.P. A review of biomass burning emissions part II: Intensive physical properties of biomass burning particles. Atmos. Chem. Phys. 2005, 5, 799–825. [Google Scholar] [CrossRef] [Green Version]
  9. Putaud, J.-P.; Van Dingenen, R.; Alastuey, A.; Bauer, H.; Birmili, W.; Cyrys, J.; Flentje, H.; Fuzzi, S.; Gehrig, R.; Hansson, H.C.; et al. A European aerosol phenomenology-3: Physical and chemical characteristics of particulate matter from 60 rural, urban, and kerbside sites across Europe. Atmos. Environ. 2010, 44, 1308–1320. [Google Scholar] [CrossRef]
  10. Reid, J.S.; Eck, T.F.; Christopher, S.A.; Koppmann, R.; Dubovik, O.; Eleuterio, D.P.; Holben, B.N.; Reid, E.A.; Zhang, J. A review of biomass burning emissions part III: Intensive optical properties of biomass burning particles. Atmos. Chem. Phys. 2005, 5, 827–849. [Google Scholar] [CrossRef] [Green Version]
  11. Sayer, A.M.; Hsu, N.C.; Eck, T.F.; Smirnov, A.; Holben, B.N. AERONET-based models of smoke-dominated aerosol near source regions and transported over oceans, and implications for satellite retrievals of aerosol optical depth. Atmos. Chem. Phys. 2014, 14, 11493–11523. [Google Scholar] [CrossRef] [Green Version]
  12. Konovalov, I.B.; Golovushkin, N.A.; Beekmann, M.; Andreae, M.O. Insights into the aging of biomass burning aerosol from satellite observations and 3D atmospheric modeling: Evolution of the aerosol optical properties in Siberian wildfire plumes. Atmos. Chem. Phys. 2021, 21, 357–392. [Google Scholar] [CrossRef]
  13. Janhäll, S.; Andreae, M.O.; Pöschl, U. Biomass burning aerosol emissions from vegetation fires: Particle number and mass emission factors and size distributions. Atmos. Chem. Phys. 2010, 10, 1427–1439. Available online: https://acp.copernicus.org/articles/10/1427/2010/ (accessed on 12 January 2022). [CrossRef] [Green Version]
  14. Levin, E.J.T.; McMeeking, G.R.; Carrico, C.M.; Mack, L.E.; Kreidenweis, S.M.; Wold, C.E.; Moosmüller, H.; Arnott, W.P.; Hao, M.W.; Collett, J.L., Jr.; et al. Biomass burning smoke aerosol properties measured during Fire Laboratory at Missoula Experiments (FLAME). J. Geophys. Res. 2010, 115, D18210. [Google Scholar] [CrossRef]
  15. Kim, J.; Bauer, H.; Dobovičnik, T.; Hitzenberger, R.; Lottin, D.; Ferry, D.; Petzold, A. Assessing Optical Properties and Refractive Index of Combustion Aerosol Particles Through Combined Experimental and Modeling Studies. Aerosol Sci. Technol. 2015, 49, 340–350. [Google Scholar] [CrossRef]
  16. Shelestov, A.; Kolotii, A.; Borisova, T.; Turos, O.; Milinevsky, G.; Gomilko, I.; Bulanay, T.; Fedorov, O.; Shumilo, L.; Pidgorodetska, L.; et al. Essential variables for air quality estimation. Intern. J. Digital Earth 2020, 13, 278–298. [Google Scholar] [CrossRef]
  17. Haënninen, O.O.; Salonen, R.O.; Koistinen, K.; Lanki, T.; Barregard, L.; Jantunen, M. Population exposure to fine particles and estimated excess mortality in Finland from an East European wildfire episode. J. Expo. Sci. Environ. Epidemiol. 2009, 19, 414–422. [Google Scholar] [CrossRef] [Green Version]
  18. Lanzinger, S.; Schneider, A.; Breitner, S.; Stafoggia, M.; Erzenc, I.; Dostal, M.; Pastorkova, A.; Bastian, S.; Cyrys, J.; Zscheppang, A.; et al. Associations between ultrafine and fine particles and mortality in five central European cities-Results from the UFIREG study. Environ. Int. 2016, 88, 44–52. [Google Scholar] [CrossRef]
  19. Amaral, S.S.; de Carvalho, J.A., Jr.; Martins Costa, M.A.; Pinheiro, C. An Overview of Particulate Matter Measurement Instruments. Atmosphere 2015, 6, 1327–1345. [Google Scholar] [CrossRef] [Green Version]
  20. Huang, K.; Xiao, Q.; Meng, X.; Geng, G.; Wang, Y.; Lyapustin, A.; Gu, D.; Liu, Y. Predicting monthly high-resolution PM2.5 concentrations with random forest model in the North China Plain. Environ. Pollut. 2018, 242, 675–683. [Google Scholar] [CrossRef]
  21. Samek, L.; Turek-Fijak, A.; Skiba, A.; Furman, P.; Styszko, K.; Furman, L.; Stegowski, Z. Complex characterization of fine fraction and source contribution to PM2.5 mass at an urban area in Central Europe. Atmosphere 2020, 11, 1085. [Google Scholar] [CrossRef]
  22. Abera, A.; Mattisson, K.; Eriksson, A.; Ahlberg, E.; Sahilu, G.; Mengistie, B.; Bayih, A.G.; Aseffaa, A.; Malmqvist, E.; Isaxon, C. Air pollution measurements and land-use regression in urban Sub-Saharan Africa using low-cost sensors—Possibilities and pitfalls. Atmosphere 2020, 11, 1357. [Google Scholar] [CrossRef]
  23. Fattoruso, G.; Nocerino, M.; Toscano, D.; Pariota, L.; Sorrentino, G.; Manna, V.; De Vito, S.; Cartenì, A.; Fabbricino, M.; Di Francia, G. Site suitability analysis for low cost sensor networks for urban spatially dense air pollution monitoring. Atmosphere 2020, 11, 1215. [Google Scholar] [CrossRef]
  24. Schaap, M.; Apituley, A.; Timmermans, R.M.A.; Koelemeijer, R.B.A.; de Leeuw, G. Exploring the relation between aerosol optical depth and PM2.5 at Cabauw, the Netherlands. Atmos. Chem. Phys. 2009, 9, 909–925. [Google Scholar] [CrossRef] [Green Version]
  25. Van Donkelaar, A.; Martin, R.V.; Levy, R.C.; da Silva, A.M.; Krzyzanowski, M.; Chubarova, N.E.; Semutnikova, E.; Cohen, A.J. Satellite-based estimates of ground-level fine particulate matter during extreme events: A case study of the Moscow fires in 2010. Atmos. Environ. 2011, 45, 6225–6232. [Google Scholar] [CrossRef]
  26. Bovchaliuk, A. The spatial variability of PM2.5 over Europe using satellite POLDER-3/PARASOL data. Adv. Astron. Space Phys. 2013, 3, 102–108. Available online: http://aasp.kiev.ua/volume3/102-108-BovchaliukA.pdf (accessed on 12 January 2022).
  27. Gao, C.; Zhang, X.; Wang, W.; Xiu, A.; Tong, D.Q.; Chen, W. Spatiotemporal distribution of satellite-retrieved ground-level PM2.5 and near real-time daily retrieval algorithm development in Sichuan Basin, China. Atmosphere 2018, 9, 78. [Google Scholar] [CrossRef] [Green Version]
  28. Chu, Y.; Liu, Y.; Li, X.; Liu, Z.; Lu, H.; Lu, Y.; Mao, Z.; Chen, X.; Li, N.; Ren, M.; et al. A Review on Predicting Ground PM2.5 Concentration Using Satellite Aerosol Optical Depth. Atmosphere 2016, 7, 129. [Google Scholar] [CrossRef] [Green Version]
  29. Lennartson, E.M.; Wang, J.; Gu, J.; Garcia, L.C.; Ge, C.; Gao, M.; Choi, M.; Saide, P.E.; Carmichael, G.R.; Kim, J.; et al. Diurnal variation of aerosol optical depth and PM2:5 in South Korea: A synthesis from AERONET, satellite (GOCI), KORUS-AQ observation, and the WRF-Chem model. Atmos. Chem. Phys. 2018, 18, 15125–15144. [Google Scholar] [CrossRef] [Green Version]
  30. Yang, S.H.; Jeong, J.I.; Park, R.J.; Kim, M.J. Impact of Meteorological Changes on Particulate Matter and Aerosol Optical Depth in Seoul during the Months of June over Recent Decades. Atmosphere 2020, 11, 1282. [Google Scholar] [CrossRef]
  31. Zhao, F.; Liu, Y.; Shu, L.; Zhang, Q. Wildfire Smoke Transport and Air Quality Impacts in Different Regions of China. Atmosphere 2020, 11, 941. [Google Scholar] [CrossRef]
  32. Evangeliou, N.Y.; Balkanski, Y.; Cozic, A.; Hao, W.M.; Mouillot, F.; Thonicke, K.; Paugam, R.; Zibtsev, S.; Mousseau, T.A.; Wang, R.; et al. Fire evolution in the radioactive forests of Ukraine and Belarus: Future risks for the population and the environment. Ecol. Monogr. 2015, 85, 49–72. [Google Scholar] [CrossRef]
  33. Milinevsky, G.; Danylevsky, V.; Bovchaliuk, V.; Bovchaliuk, A.; Goloub, P.; Dubovik, O.; Kabashnikov, V.; Chaikovsky, A.; Miatselskaya, N.; Mishchenko, M.; et al. Aerosol seasonal variations over urban–industrial regions in Ukraine according to AERONET and POLDER measurements. Atmos. Meas. Tech. 2014, 7, 1459–1474. [Google Scholar] [CrossRef] [Green Version]
  34. Bovchaliuk, A.; Milinevsky, G.; Danylevsky, V.; Goloub, P.; Dubovik, O.; Holdak, A.; Ducos, F.; Sosonkin, M. Variability of aerosol properties over Eastern Europe observed from ground and satellites in the period from 2003 to 2011. Atmos. Chem. Phys. 2013, 13, 6587–6602. [Google Scholar] [CrossRef] [Green Version]
  35. Kabashnikov, V.; Milinevsky, G.; Chaikovsky, A.; Miatselskaya, N.; Danylevsky, V.; Aculinin, A.; Kalinskaya, D.; Korchemkina, E.; Bovchaliuk, A.; Pietruczuk, A.; et al. Localization of aerosol sources in East-European region by back-trajectory statistics. Int. J. Remote Sens. 2014, 35, 6993–7006. [Google Scholar] [CrossRef]
  36. Miatselskaya, N.; Kabashnikov, V.; Milinevsky, G.; Chaikovsky, A.; Danylevsky, V.; Bovchaliuk, V. Atmospheric aerosol distribution in the Belarus-Ukraine region by the GEOS–Chem model and AERONET measurements. Int. J. Remote Sens. 2016, 37, 3181–3195. [Google Scholar] [CrossRef]
  37. Miatselskaya, N.S.; Kabashnikov, V.P.; Norka, H.V.; Chaikovsky, A.P.; Bril, A.I.; Milinevsky, G.P.; Danylevsky, V.O. Atmosphere aerosol modeling by GEOS-Chem for the AEROSOL-UA space project validation. Space Sci. Technol. 2017, 23, 3–10. [Google Scholar] [CrossRef]
  38. Bovchaliuk, V.P.; Milinevsky, G.P.; Danylevsky, V.O.; Golub, P.; Sosonkin, M.G.; Yukhimchuk, Y.; Podvin, T. Properties of aerosol in the atmosphere over Kiev by lidar and photometric observations. Space Sci. Technol. 2017, 23, 37–47. Available online: http://knit.mao.kiev.ua/en/archive/2017/6/05 (accessed on 12 January 2022).
  39. Holben, B.N.; Eck, T.F.; Slutsker, I.; Tanré, D.; Buis, J.P.; Setzer, A.; Vermote, E.; Reagan, J.A.; Kaufman, Y.J.; Nakajima, T.; et al. AERONET-A Federated Instrument Network and Data Archive for Aerosol Characterization. Remote Sens. Environ. 1998, 66, 1–16. [Google Scholar] [CrossRef]
  40. Holben, B.N.; Kim, J.; Sano, I.; Mukai, S.; Eck, T.F.; Giles, D.M.; Schafer, J.S.; Sinyuk, A.; Slutsker, I.; Smirnov, A.; et al. An overview of mesoscale aerosol processes, comparisons, and validation studies from DRAGON networks. Atmos. Chem. Phys. 2018, 18, 655–671. [Google Scholar] [CrossRef] [Green Version]
  41. Draxler, R.R.; Hess, G.D. An overview of the HYSPLIT 4 modeling system for trajectories, dispersion, and deposition. Aust. Meteor. Mag. 1997, 47, 295–308. [Google Scholar]
  42. Stein, A.F.; Draxler, R.R.; Rolph, G.D.; Stunder, B.J.B.; Cohen, M.D.; Ngan, F. NOAA’s HYSPLIT atmospheric transport and dispersion modeling system. Bull. Amer. Meteor. Soc. 2015, 96, 2059–2077. [Google Scholar] [CrossRef]
  43. ZoomEarth: NOAA/NESDIS/STAR, EUMETSAT, JMA/NOAA/CIRA Global Weather Satellite Images. Available online: https://zoom.earth/ (accessed on 15 July 2021).
  44. FIRMS: Fire Information for Resource Management System of NASA’s Earth Observing System Data and Information System (EOSDIS). Available online: https://earthdata.nasa.gov/firms (accessed on 15 December 2021).
  45. IQAir AirVisual Series. Available online: https://www.iqair.com/air-quality-monitors/airvisual-pro (accessed on 15 December 2021).
  46. IQAir Air Quality in the World. Available online: https://airvisual.com/world (accessed on 15 December 2021).
  47. Dubovik, O.; King, M.D. A flexible inversion algorithm for retrieval of aerosol optical properties from Sun and sky radiance measurements. J. Geophys. Res. 2000, 105, 20673–20696. [Google Scholar] [CrossRef] [Green Version]
  48. Sinyuk, A.; Holben, B.N.; Eck, T.F.; Giles, D.M.; Slutsker, I.; Korkin, S.; Schafer, J.S.; Smirnov, A.; Sorokin, M.; Lyapustin, A. The AERONET Version 3 aerosol retrieval algorithm, associated uncertainties and comparisons to Version 2. Atmos. Meas. Tech. 2020, 13, 3375–3411. [Google Scholar] [CrossRef]
  49. Giles, D.M.; Sinyuk, A.; Sorokin, M.G.; Schafer, J.S.; Smirnov, A.; Slutsker, I.; Eck, T.F.; Holben, B.N.; Lewis, J.R.; Campbell, J.R.; et al. Advancements in the Aerosol Robotic Network (AERONET) Version 3 database-automated near-real-time quality control algorithm with improved cloud screening for Sun photometer aerosol optical depth (AOD) measurements. Atmos. Meas. Tech. 2019, 12, 169–209. [Google Scholar] [CrossRef] [Green Version]
  50. Milinevsky, G.; Danylevsky, V. Atmospheric aerosol over Ukraine region: Current status of knowledge and research efforts. Front. Environ. Sci. 2018, 6, 59. [Google Scholar] [CrossRef]
  51. Kyiv AERONET Site: AERONET Aerosol Robotic Network, Site Information Database. Available online: https://aeronet.gsfc.nasa.gov/new_web/photo_db_v3/Kyiv.html (accessed on 15 December 2021).
  52. Boucher, O. Properties and climate Impacts. In Atmospheric Aerosols; Springer: Dordrecht, The Netherlands, 2015; p. 311. [Google Scholar] [CrossRef]
  53. O’Neill, N.T.; Eck, T.F.; Smirnov, A.; Holben, B.N.; Thulasiraman, S. Spectral discrimination of coarse and fine mode optical depth. J. Geophys. Res. 2003, 108, 4559–4573. [Google Scholar] [CrossRef]
  54. Stohl, A. Computation, accuracy and applications of trajectories: A review and bibliography. Atmos. Environ. 1998, 32, 947–966. [Google Scholar] [CrossRef]
  55. AERONET/Data Synergy Tool. Available online: https://aeronet.gsfc.nasa.gov/cgi-bin/bamgomas_interactive (accessed on 20 March 2022).
  56. Sapkota, A.; Symons, J.M.; Kleissl, J.; Wang, L.; Parlange, M.B.; Ondov, J.; Breysse, P.N.; Diette, G.B.; Eggleston, P.A.; Buckley, T.J. Impact of the 2002 Canadian forest fires on particulate matter air quality in Baltimore city. Environ. Sci. Technol. 2005, 39, 24–32. [Google Scholar] [CrossRef] [PubMed] [Green Version]
  57. HYSPLIT Website Service, NOAA Air Resources Laboratory. Available online: https://www.ready.noaa.gov/HYSPLIT.php (accessed on 18 March 2022).
  58. Alados-Arboledas, L.; Müller, D.; Guerrero-Rascado, J.L.; Navas-Guzmán, F.; Pérez-Ramírez, D.; Olmo, F.J. Optical and microphysical properties of fresh biomass burning aerosol retrieved by Raman lidar, and star- and sun-photometry. Geophys. Res. Lett. 2011, 38, L01807. [Google Scholar] [CrossRef]
  59. NAAPS: Navy Aerosol Analysis and Prediction System. Naval Research Lab Monterey ICAP Multi-Model Ensemble. Available online: https://www.nrlmry.navy.mil/aerosol_web/Docs/nrlmryonrprop.html (accessed on 7 April 2022).
  60. Dubovik, O.; Holben, B.; Eck, T.F.; Smirnov, A.; Kaufman, Y.J.; King, M.D.; Tanré, D.; Slutsker, I. Variability of absorption and optical properties of key aerosol types observed in worldwide locations. J. Atmos. Sci. 2002, 59, 590–608. [Google Scholar] [CrossRef]
  61. Mousseau, T.A. The biology of Chernobyl. Annu. Rev. Ecol. Evol. Syst. 2021, 52, 87–109. [Google Scholar] [CrossRef]
Figure 1. AirVisual stations and Popudrenka (APDA-371 HORIBA) station locations on the Kyiv city map: 1—Artema Street, 2—Golosiiv, 3—Nauky Avenue, 4—Trostyanetska, 5—Chornobylska Street, 6—Popudrenka. The Golosiiv station (2) is co-located with the Kyiv sun-photometer AERONET/PHOTONS site.
Atmosphere 13 00687 g001
Figure 2. (a) MODIS/VIIRS fire map data 15 March–15 April 2020, prevailed wind direction N–NW, wind speed up to 27 km h−1. The area of the city of Kyiv is marked with a bold white line. Two big forest fire areas (red color marks fire areas) were persistent at north of Chernobyl region. (b) Satellite image 8 April 2020 with large forest fire in the northwest of the Kyiv region. Plots have been created using open access data from [43,44].
Atmosphere 13 00687 g002
Figure 3. Air Visual network PM2.5 daily averaged in situ measurements in the city of Kyiv in four sites (Nauky, Artema, Trostyanetska, Golosiiv) and APDA-371 Popudrenka site in (a) March and (b) April 2020; the daily averaged AOD of all particles (total) and AOD fine particles (fine) over the city of Kyiv from observations with the AERONET Kyiv site sun-photometer at 500 nm wavelength during (c) March and (d) April 2020.
Atmosphere 13 00687 g003
Figure 4. (a) Comparison of AirVisual PM2.5 data from Artema Street site with APDA-371 Popudrenka site simultaneous measurements March–April 2020. (b) Comparison of the daily averaged PM2.5 concentration with daily AOD (500 nm) data from the AERONET Kyiv site for March–April 2020.
Atmosphere 13 00687 g004
Figure 5. Daily averaged (a) AOD (440 nm) and (b) Ångström exponent from the AERONET Kyiv site sun-photometer observation during March–April 2020.
Atmosphere 13 00687 g005
Figure 6. Smoke plumes of the forest fires in the north part of Ukraine on 17 April 2020: (a) MODIS/Terra image, (b) back-trajectories on altitude 100 and 500 m AGL for the Kyiv AERONET site on 17 April passed over territories with fires. The Kyiv AERONET site and Golosiiv AirVisual station location marked with an open orange circle in the center of (a). (c) Trajectory frequencies at altitude 500 m AGL for the Kyiv AERONET site on 30 March and (d) 17 April passed over territories with fires. The Kyiv AERONET site and Golosiiv AirVisual station locations are marked with a star. Plots have been created using open access data from AERONET/Data Synergy Tool [55] and from HYSPLIT website service [57], GDAS meteorological data were used.
Atmosphere 13 00687 g006
Figure 7. The aerosol particle columnar volume size distributions in the atmosphere over the Kyiv AERONET site from sun-photometer observations (ac) 28–30 March; (df) 17–19 April of 2020. The legends show the time of observation (UTC), AOD (440 nm) and AE (440–870 nm).
Atmosphere 13 00687 g007
Figure 8. Back-trajectories at altitude 500 m AGL for the Kyiv AERONET site on 26–31 March (a) and 14–19 April (b) passed over territories with fires. The Kyiv AERONET site and Golosiiv AirVisual station location marked with a star. Plots have been created from HYSPLIT website service [57], GDAS meteorological data were used. Different colors correspond to days and time when air mass started and respective trajectories: yellow—April 14, 00hUTC; pink—April 14, 12hUTC; aqua—April 15, 00hUTC; green—April 15, 12hUTC; blue—April 16, 00hUTC; red—April 16, 12hUTC. Stars at 500 m altitude show when the respective air mass reached the Kyiv AERONET site.
Atmosphere 13 00687 g008
Figure 9. Spectral SSA and complex RI in the atmosphere over the Kyiv AERONET site from sun-photometer observations at (a) 29 March 2020; (b) 17 April 2020. The legends show UTC time of observation.
Atmosphere 13 00687 g009
Table 1. Parameters of the aerosol particle columnar size distribution in the atmosphere over the Kyiv AERONET site during the days with significant aerosol contamination in March and April 2020.
DateTimeFine Mode ParametersCoarse Mode ParametersAOD
(440 nm)
AE
(440–870 nm)
Reff,
μm
RMed,
μm
STDReff,
μm
RMed,
μm
STD
28 March 202012:050.1330.1490.4791.8782.4860.7550.381.20
28 March 202013:050.1120.1220.4321.9322.5670.7370.381.15
28 March 202014:150.1130.1260.4931.8002.3740.7400.471.33
29 March 202008:040.1100.1210.4671.7792.2290.6720.501.11
29 March 202009:040.1140.1260.4841.8002.2710.6800.561.15
29 March 202010:040.0920.1000.4631.7912.2190.6530.430.91
29 March 202011:050.1120.1240.4721.7732.2400.6820.471.07
29 March 202012:040.1110.1220.4711.8332.3630.7040.481.05
29 March 202013:040.1130.1240.4671.8832.4090.6920.561.16
29 March 202014:170.1130.1230.4341.9472.4770.6840.601.23
29 March 202014:590.1260.1350.3821.9062.3650.6530.541.16
30 March 202005:490.1470.1620.4561.9522.4480.6790.771.67
30 March 202008:040.1430.1570.4391.8972.3990.6990.711.70
30 March 202009:040.1440.1560.3921.7822.3850.7580.761.66
30 March 202010:040.1540.1680.4181.9842.5310.7040.761.67
30 March 202011:040.1620.1780.4702.0792.5280.6440.981.72
17 April 202004:390.1870.2200.6012.2852.7450.6321.461.67
17 April 202011:590.1350.1490.4711.8282.6760.8370.631.38
17 April 202013:390.1200.1320.4561.9392.7310.7980.691.52
18 April 202006:170.1920.2130.4531.6692.2860.8261.601.41
18 April 202011:590.1840.2260.6832.9133.4460.5710.511.31
18 April 202014:490.1760.2230.7113.5754.1830.5320.471.41
19 April 202004:350.1320.1430.4251.4511.8970.7540.421.69
19 April 202006:150.1590.1760.4761.7062.2490.7650.461.73
19 April 202006:570.1300.1410.4201.4271.9660.8240.361.81
19 April 202007:050.1490.1720.5822.1802.6770.6470.341.80
Publisher’s Note: MDPI stays neutral with regard to jurisdictional claims in published maps and institutional affiliations.

