Article

The Effect of Drought and Sowing Date on Dry Matter Accumulation and Partitioning in the Above-Ground Organs of Maize

1
Institute of Atmospheric Environment, China Meteorological Administration, Shenyang 110166, China
2
Key Laboratory of Agrometeorological Disasters (Liaoning Province), Shenyang 110166, China
3
Liaoning Province Meteorological Service Center, Shenyang 110166, China
4
Jinzhou Ecology and Agriculture Meteorological Center, Jinzhou 121001, China
*
Authors to whom correspondence should be addressed.
Atmosphere 2022, 13(5), 677; https://doi.org/10.3390/atmos13050677
Submission received: 2 April 2022 / Revised: 19 April 2022 / Accepted: 21 April 2022 / Published: 23 April 2022
(This article belongs to the Section Biometeorology)

Abstract

:
Observational data on dry matter accumulation (DMA) and dry matter partitioning (DMP) from the experiment of maize sown on four different dates in a normal year (2012) and three drought years (2014, 2015, 2018) were analyzed to assess the impact of drought and the sowing date on DMA and DMP in different above-ground organs. The phenology of maize was more closely related to the sowing date than to drought. In the normal year, the amount of dry matter in different organs differed slightly among sowing dates, except for those at maturity, and increased linearly after jointing: the dry matter of leaves and stalks increased rapidly before tasselling and the milk stage, respectively, and both increased slowly thereafter, whereas the dry matter of the ears increased linearly. In the drought years, DMA was more sensitive to precipitation relative to the normal year and was affected by the sowing date and drought. Specifically, drought lowered the dry matter of the above-ground organs to varying degrees and accentuated that variation in crops sown on different dates. From the view of DMP, a mild drought lowers the stalk DMP rate but increases the rate in ears. The more severe the drought, the smaller the DMP rate in ears and the stronger the inhibition of the transfer of dry matter from stalk to ears, as well as the more significant difference in the DMP pattern among the sowing dates. High temperatures and drought had a significant synergistic effect on DMAs in all the organs relative to that of drought alone, reversely having an inappreciable impact on the DMP pattern. During the three growth periods, namely jointing to tasselling, tasselling to the milk stage, and the milk stage to maturity, DMA during any two adjacent periods had a clear complementary effect, especially before and after tasselling. Dry matters of the above-ground parts in aggregate, of the stalk and of the ears, at the milk and maturity stages were negatively correlated to the degree of drought, and the maximum correlation was for the ears.

1. Introduction

Drought is one of the most severe constraints to crop production and accounts for more than half of the total annual food crop production lost to various natural disasters [1,2,3]. Ways to predict drought well in time, assess its likely impact, and then take appropriate measures in advance to reduce losses now attract increasing attention from researchers [4]. The basis of crop yields is DMA, and drought decreases the production of dry matter by reducing photosynthesis through reducing leaf stomatal conductance [5], and then goes on to reduce the growth of roots and of the above-ground organs by affecting DMP among different plant organs. The reduced growth of leaves, in turn, affects photosynthesis and nutrient uptake, thereby affecting the distribution of photosynthates [6]. DMP refers to the distribution of dry matter accumulated in a plant over a given length of time among different organs of the plant, and has been studied extensively in most crops and fruit trees because it is their reproductive organs that form the economic products, namely seeds (including grain) and fruits [7,8]. Usually, the increase in the dry matter weight (DMW) of each plant organ over time is measured to calculate the proportion of dry matter partitioned or diverted to that organ [9]. The main factors affecting DMP include light, nutrients, moisture, temperature, and CO2 [10]. To cope with drought, plants divert more photosynthates to the root system to increase water uptake [11,12]. Notably, DMA within a plant organ is a reflection not only of the distribution of photosynthates, but also of their redistribution among the organs. Stems are the main source of redistribution, followed by leaves. The redistributed photosynthates play a major role in plant growth and help to ensure that the plant maintains a higher growth rate despite a lower rate of photosynthesis during later stages of growth [13]. During the stage of reproductive growth, photosynthates are used mainly for the growth of reproductive organs, and vegetative organs transfer part of the dry matter to reproductive organs to enable them to maintain a high growth rate [14]. Penning de Vries et al. [15] pointed out that during the grain-filling stage of maize, dry matter from the stalk and leaves, and even small quantities of dry matter from roots will be redistributed to the reproductive organs, and the rate of such redistribution from the stalk can be as high as 35% of its dry weight. One effect of drought is to hasten ripening, which shortens the duration of DMA in reproductive organs [16] and suppresses the redistribution of dry matter to them, leading to lower yields.
The lack of reliable data on the impact of drought on DMP prevents the current mainstream models of crop growth from simulating it truly and effectively in crops suffering from drought. In the AquaCrop model, normalized crop water productivity and daily evapotranspiration are used for estimating the amount of dry matter, but this estimate does not take into account the distribution of photosynthates to different organs [17,18,19]. In the DSSAT CERES-Maize model, under water stress, a greater proportion of dry matter will be diverted to the roots during the stage of vegetative growth [20], and during reproductive growth, once the potential requirement of grains or other reproductive organs is met, any surplus is partitioned equally between the roots and the stems, without any redistribution from the vegetative organs. In the WOFOST model, DMP is taken as a function of the stage of development, but the partitioning coefficient is assigned a fixed value during some stages of development [21]. Yet, the EPICphase does take into account water stress, but continues to consider DMP as an empirical expression without any mechanism to reflect changes in the relative proportions [22]. In general, changes in crop physiology and growth as a result of drought are complex, and an adequate understanding of the differences in the impact of drought on a crop at different growth stages has proved elusive [23]—a shortcoming that leads to the poor simulation of drought by different models [24].
In addition, the sowing date can profoundly affect the phenology by changing climatic conditions, such as the temperature and light experienced during plant growth, which further affects biomass production and the source–sink relationship [25,26]. Bonelli et al. [27] pointed out that the delayed planting of maize limited leaf photosynthetic capacities, decreased the translocation of photoassimilates to different organs and, consequently, lowered yields. Meanwhile, the phenology of drought-affected plants will also shift owing to the change of the water consumption process [28,29]. However, the synthetical influence induced by shifting the sowing date and drought will play a more complex role in DMA and DMP, and relevant researches are also scarce. Insufficient understanding of DMP and of the mechanisms that govern it is one of the most important reasons for the unsatisfactory performance of crop models in simulating the impacts of drought on crop plants. This was the knowledge gap that the present study sought to bridge by closely examining and analyzing the effect of drought on DMA and DMP in an attempt to improve the performance of the models [30]
Among the world’s three staple crops, maize has outpaced rice and wheat recently in terms of both area and production, and is increasingly important to food security and economic development as the world’s population continues to increase [31]. North-eastern China is the main production area of spring maize in the country and, with a sown area of about 6 × 10⁶ hm2, is the second largest maize-production area in the world, accounting for 26.6% of the total sown area in China. The area is thus critical to increasing maize yield and occupies an important position in the grain production of China [32]. Maize is particularly sensitive to moisture at all stages of growth, and drought is the most important natural disaster that affects maize yield: it reduces yields typically by 20%–30%, and severe droughts reduce the yield even more [28,33,34].
Against this background, to deeply understand the combined effect of the sowing date and drought on the DMA and DMP of maize and to increase the scientificity of the crop model parameterization scheme in recognizing drought, the specific objectives of the present study were as follows: (1) to explore the characteristic responses of DMA and DMP in above-ground parts of maize under different degrees of drought; (2) to examine the effect of the sowing date on those responses; and (3) to determine, for different plant organs, the relationship between the extent of response and the degree of drought. The study will enhance our understanding of water consumption and drought in spring maize in north-eastern China. More specifically, the findings of the study will help to make crop models better at simulating maize growth under drought, thereby providing a scientific basis for assessing the impact of drought more accurately and, in turn, to help in developing rational measures to mitigate the impacts of drought on maize production.

2. Materials and Methods

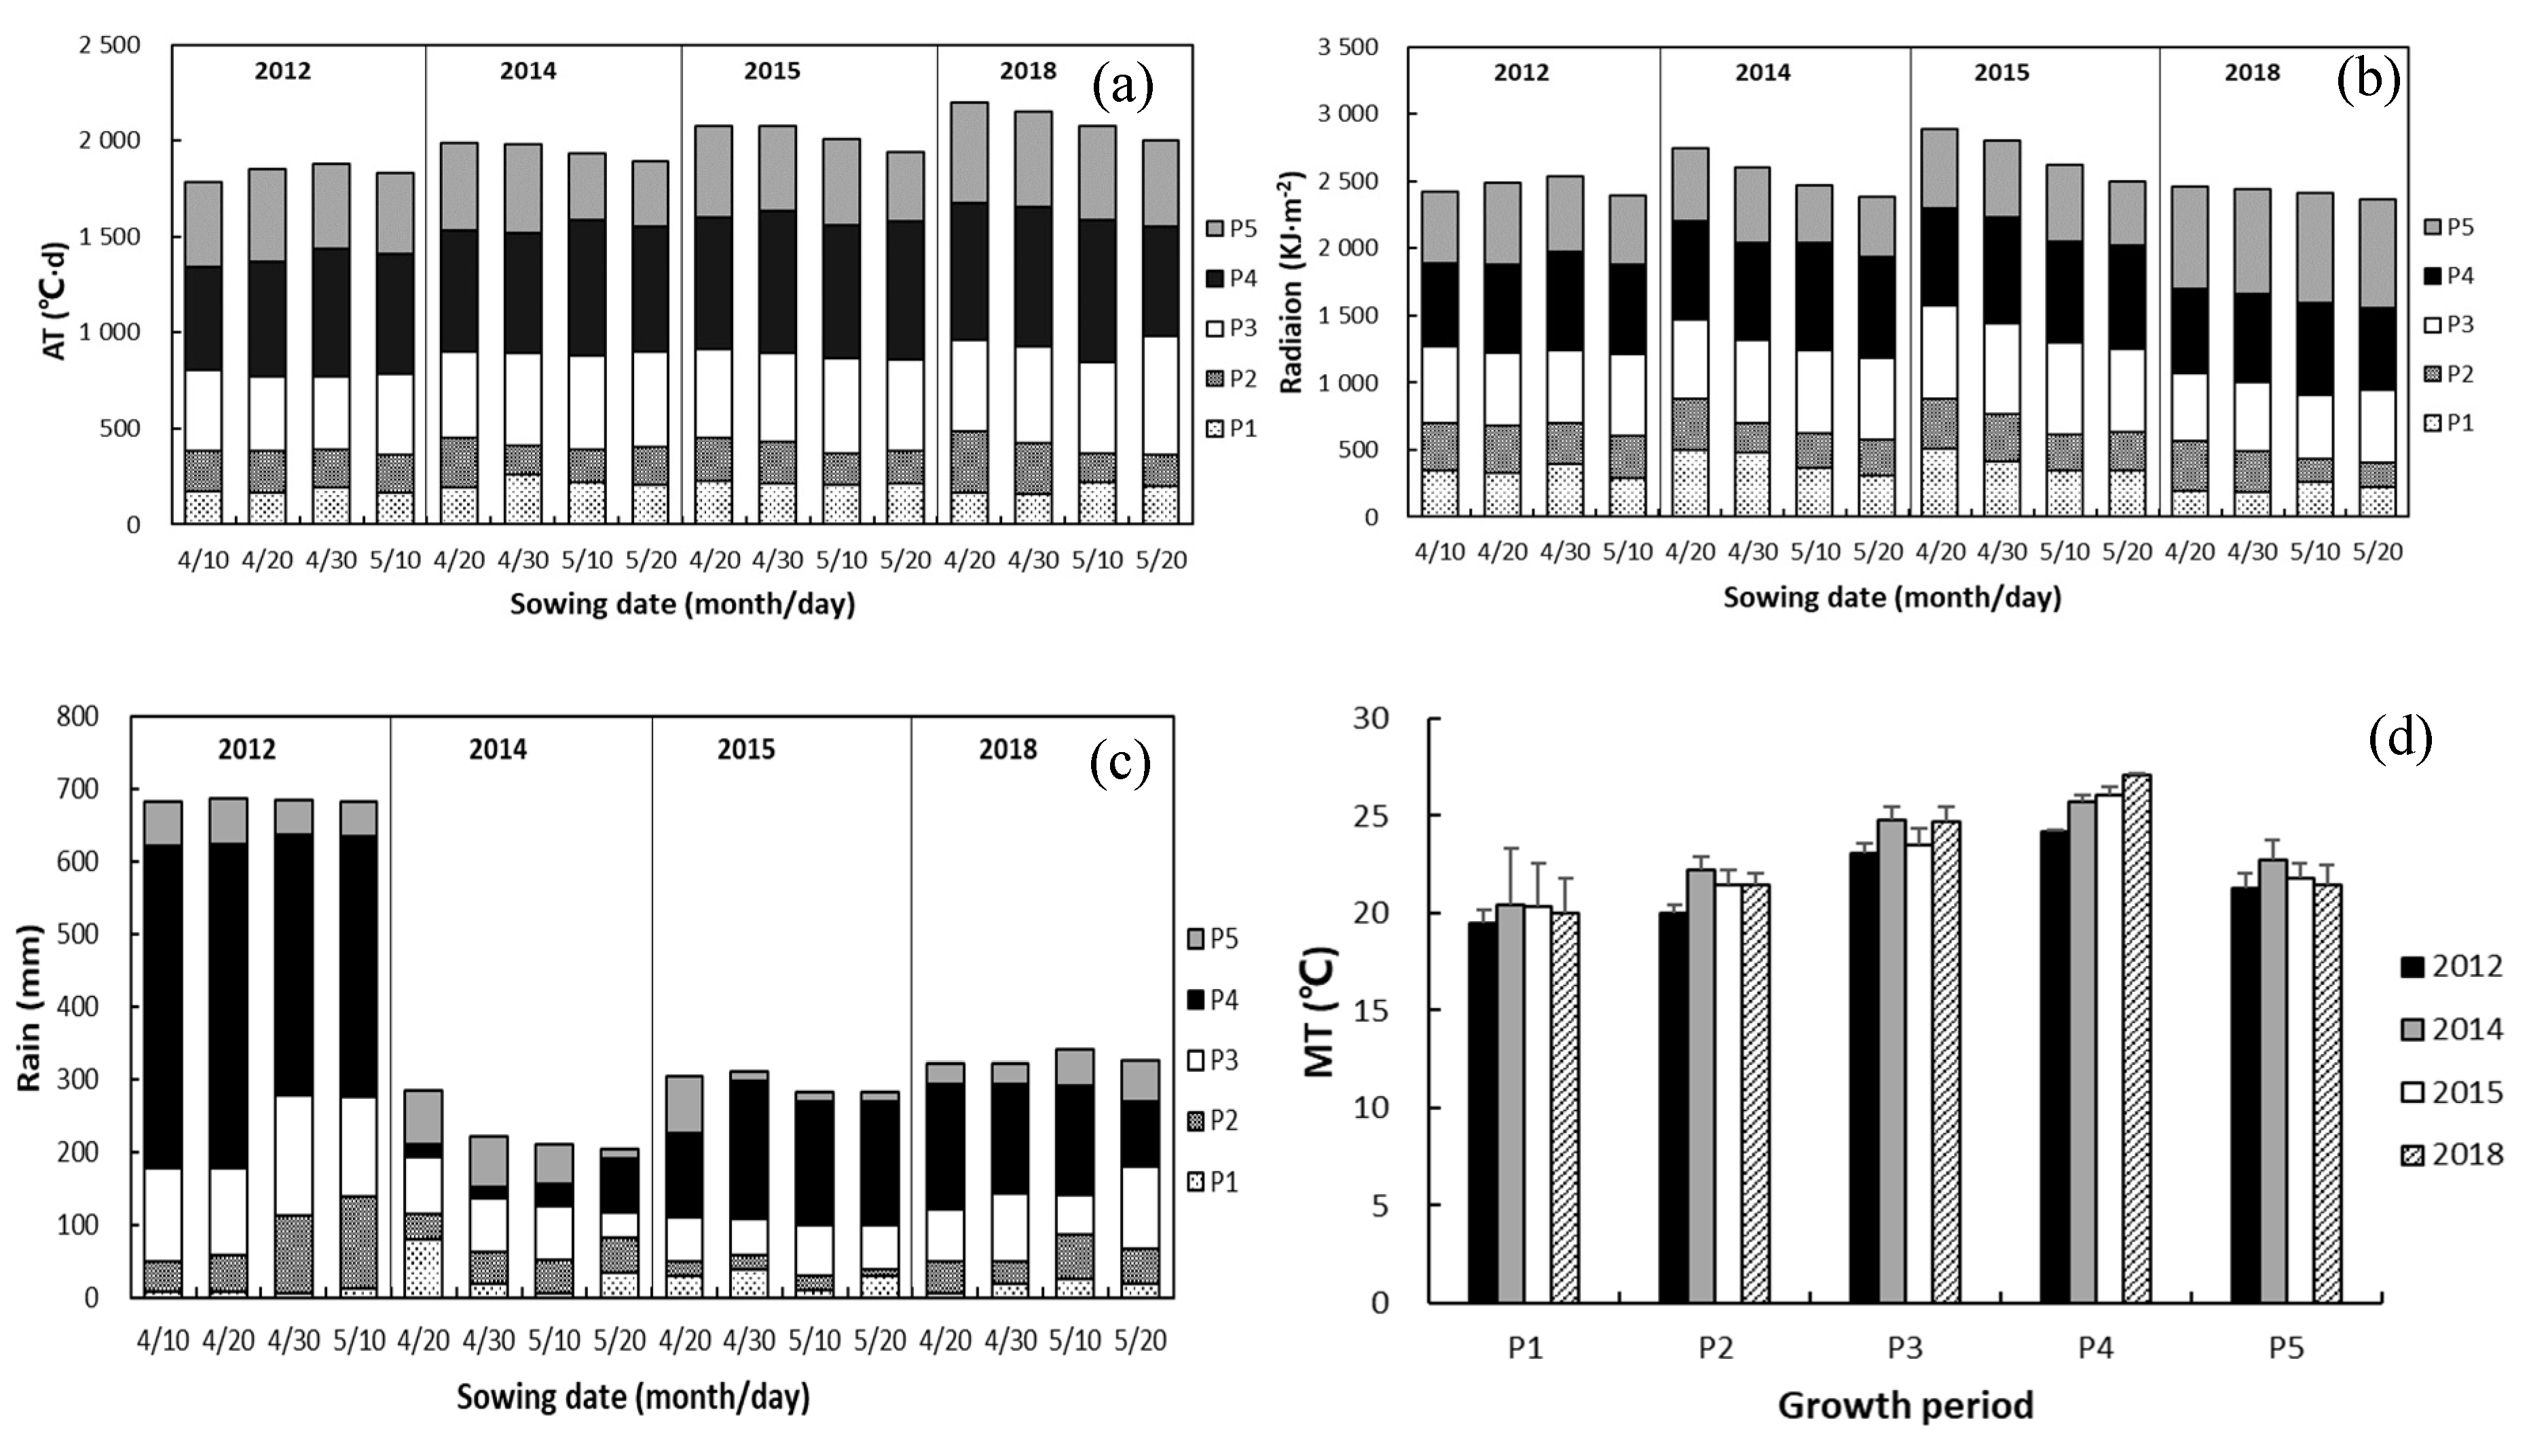
2.1. Description of Study Area

Data for the present study were sourced from the experiment of maize sown on different dates, conducted at the Jinzhou Agricultural Meteorological Experimental Station in Liaoning province. The study area has a temperate monsoon continental climate. The average temperature and precipitation during 1981–2010 were 9.9 °C and 568 mm. The soil was a typical brown soil with a pH of 6.3 and the following nutritional composition: soil organic matter, 15.24 g·kg−1; nitrogen, 1.04 g·kg−1; phosphorus, 0.50 g·kg−1; and potassium, 22.62 g·kg−1. The average field capacity of the top 50 cm soil layer was 22.64%, the withering humidity was 5.64%, and the bulk density was 1.426 g·cm−3.

2.2. Experimental Design

The experiment was carried out under rain-fed conditions with only one irrigation, at the time of sowing, to ensure proper emergence in 2012, 2014, 2015, and 2018. Maize cultivar ‘Danyu 39’ was grown in the first three years and ‘Danyu 405’ in 2018; both are homotypic lines and share most of the genetic parameters. The sowing dates of maize were on 10 April, 20 April, 30 April, and 10 May in 2012, and 20 April, 30 April, 10 May, and 20 May in 2014, 2015 and 2018, with a same planting density of 4.48 m−2. Each test plot was 15 m long and 10 m wide. The experiment comprised three replications. Only one dose of fertilizer—at 750 kg·hm−2—was given as a basal dose, at the time of sowing, in the form of a complex fertilizer, the total nutrient content of which was ≥45%, comprising 28% N, 11% P2O5, and 12% K2O [35]. Observations were recorded six times during the entire growth period to coincide with the date of onset for each growth stage, namely 3-leaf, 7-leaf, jointing, tasselling, milk, and maturity. The following values were recorded and averaged over three plants: leaf area and dry matter of each above-ground organ (leaves, the stalk, and ears). Soil moisture was recorded every 5 days during the growth period, sampling every 10 cm layer up to a depth of 50 cm by drilling the soil [36].

2.3. Methods

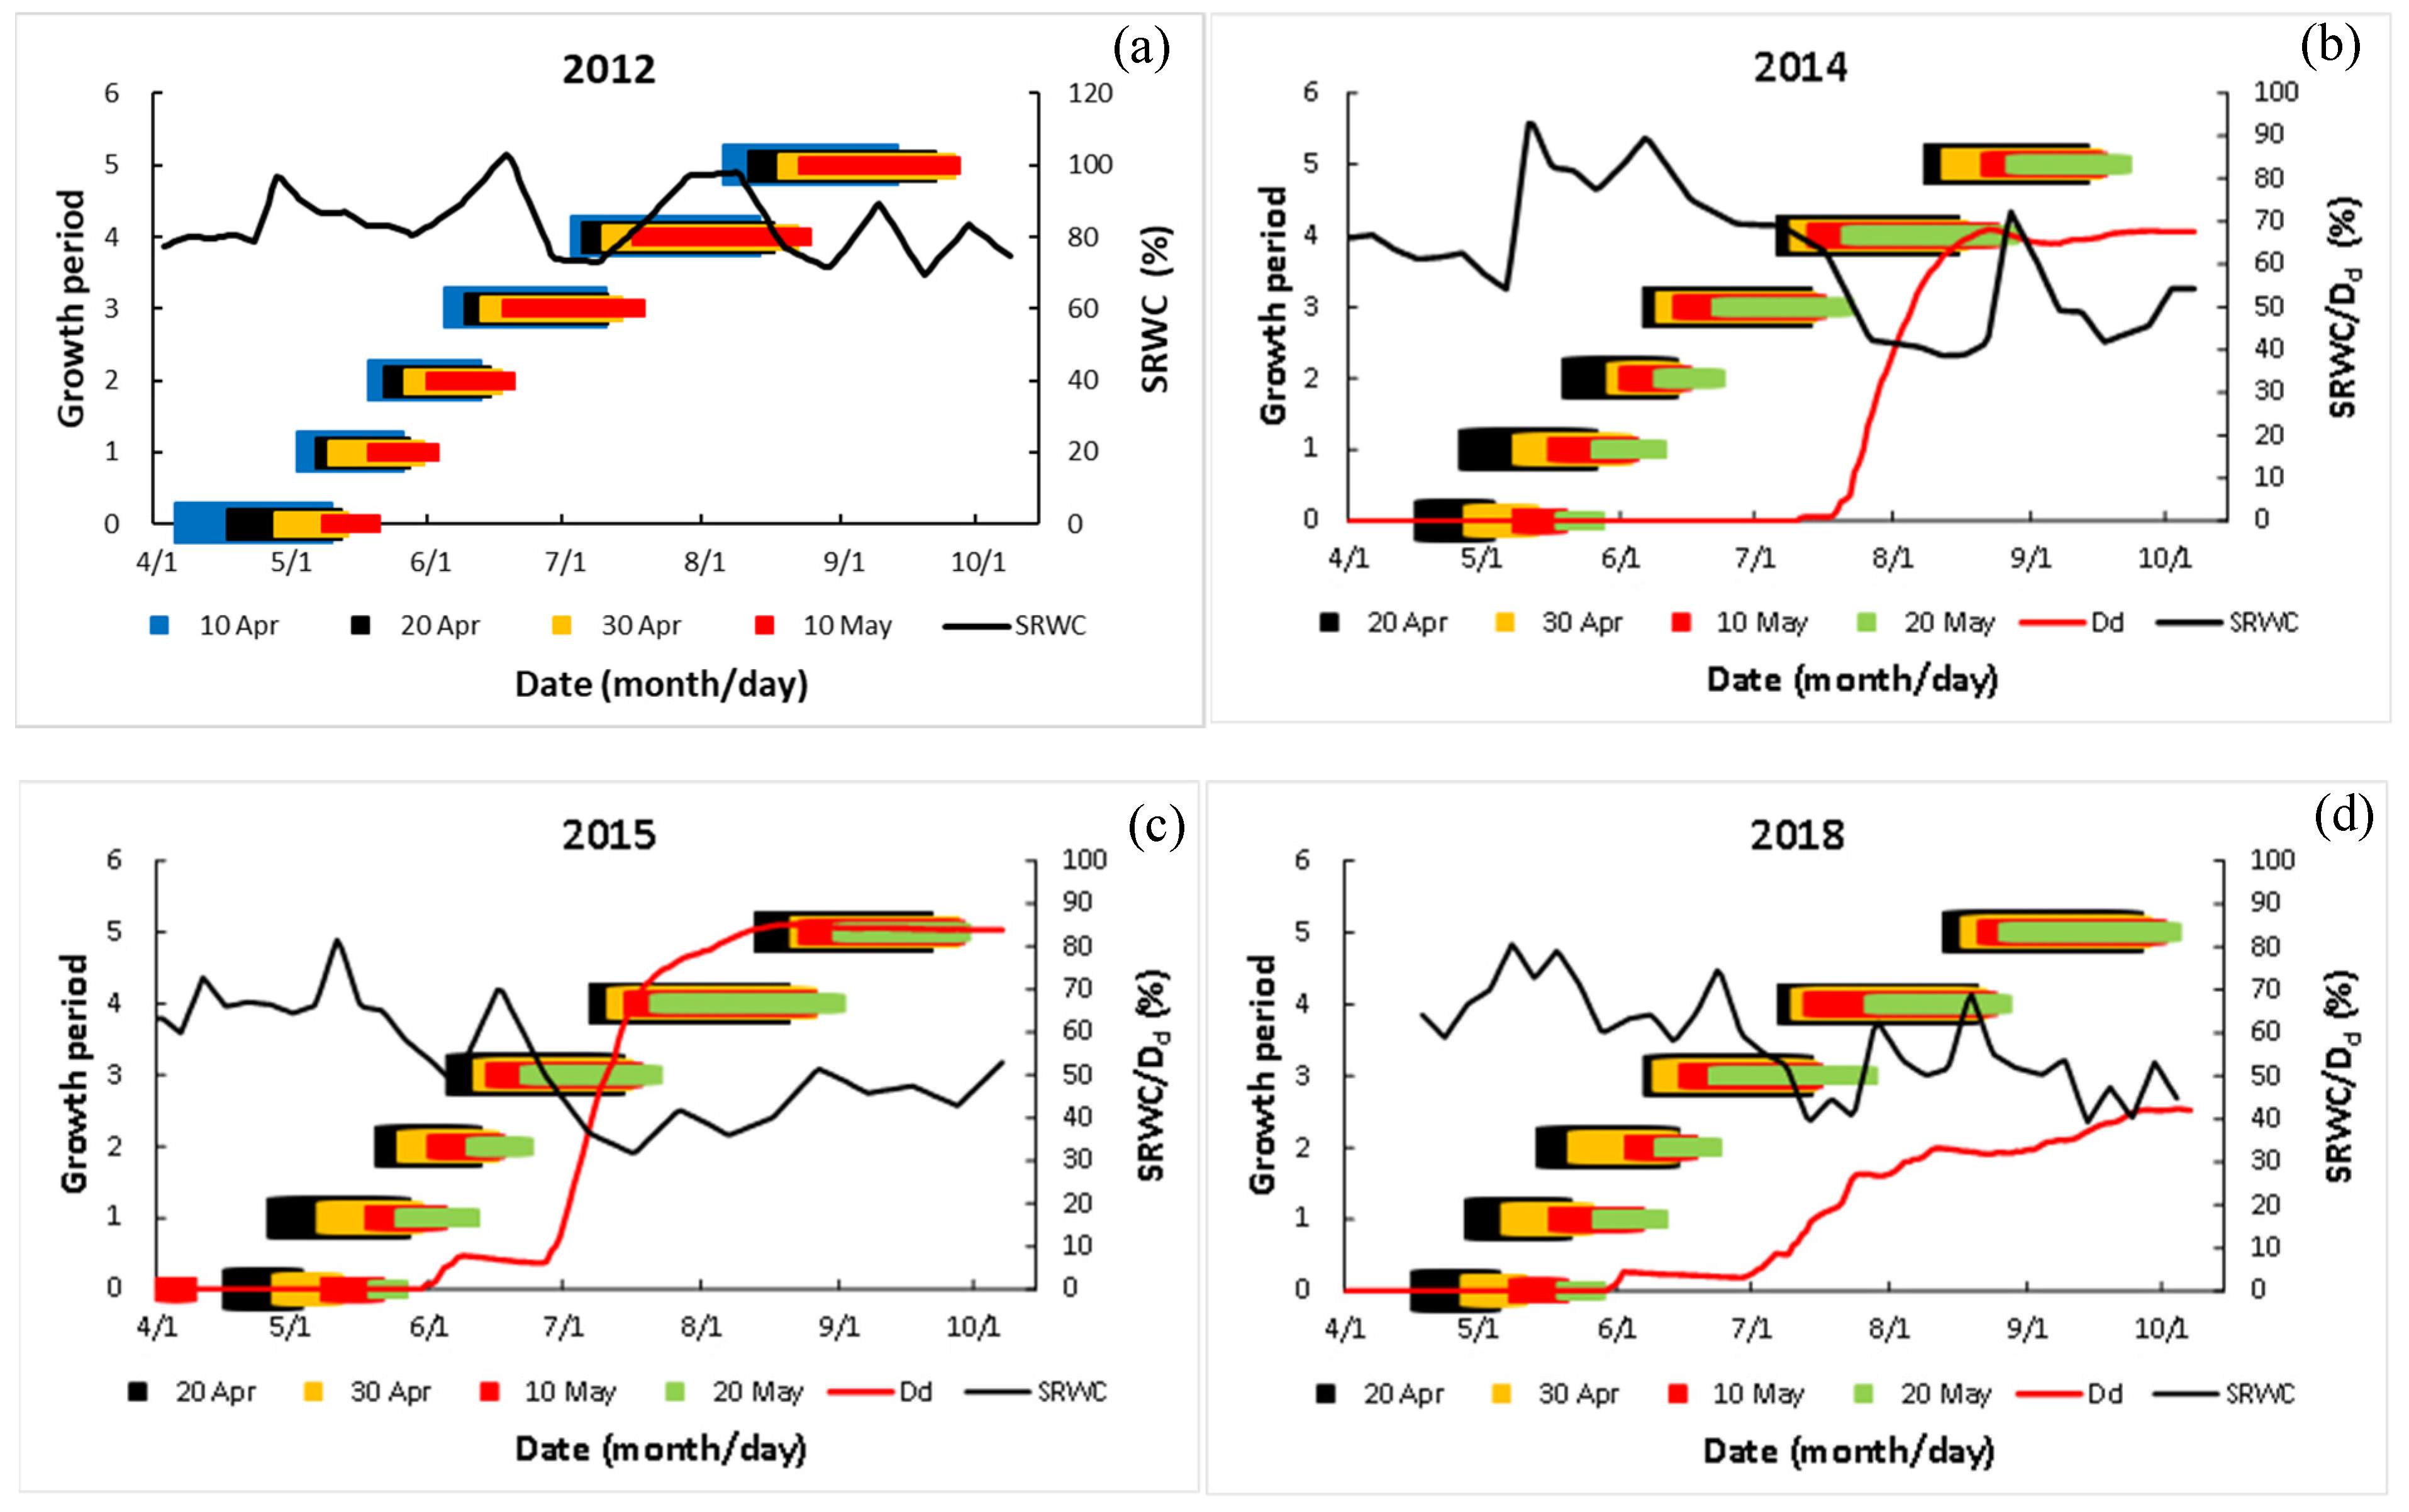
2.3.1. Calculating the Degree of Drought

The degree of drought (Dd) is used for quantifying the cumulative degree of soil water deficit over a given length of time [37], expressed as
D d = 1 e 5.3 × t = 1 L   I w s t E T c t = 1 L E T c
where I w s t is the intensity of water stress, E T c is the potential evapotranspiration, and L is the duration of water deficit [4]. Based on the water stress coefficient ( K s ) proposed by FAO [31], the intensity of water stress can be expressed as
I w s t = 1 K s
where
K s = { 1 D r R a w T a w D r T a w R a w D r > R a w
T a w = θ f θ w p
D r = θ f θ i
R a w = p × T a w
p = p 0 + 0.04 × ( 5 E T c )
Among them, T a w is the difference between field capacity ( θ f ) and the soil’s wilting coefficient ( θ w p ) , and represents the effective water content that can be obtained by crops. The term D r is calculated by subtracting the actual water content ( θ i ) from θ f and represents water deficit. R a w is the difference between θ f and capillary suspension water, and is equal to the proportion of T a w , which represents the rapidly available water content in the reference soil layer. Its proportional coefficient (p) can be determined by the reference value ( p 0 ) related to the crop type and the local potential evapotranspiration ( E T c ) [38]. In the present study, p 0 for maize was taken as 0.55 [39]. E T c is determined on the basis of reference evapotranspiration values and the crop coefficients for maize at different growth stages [40,41].

2.3.2. Calculating Relative Water Content of Soil

The soil’s relative water content (SRWC) was determined by weighing the samples collected using a soil auger [42]. The samples were collected at 10 cm intervals up to a depth of 50 cm every 5 days in every replication during each growth period. The relative water content was calculated as follows:
θ r m = i n ( θ i θ f ) n
where θ r m represents the SRWC, θ i and θ f are the water content and field capacity at the ith soil layer, respectively, and n is the number of replicates (three in this case).

2.4. Abbreviations

Abbreviations of all the parameters are given in Table 1.

3. Results

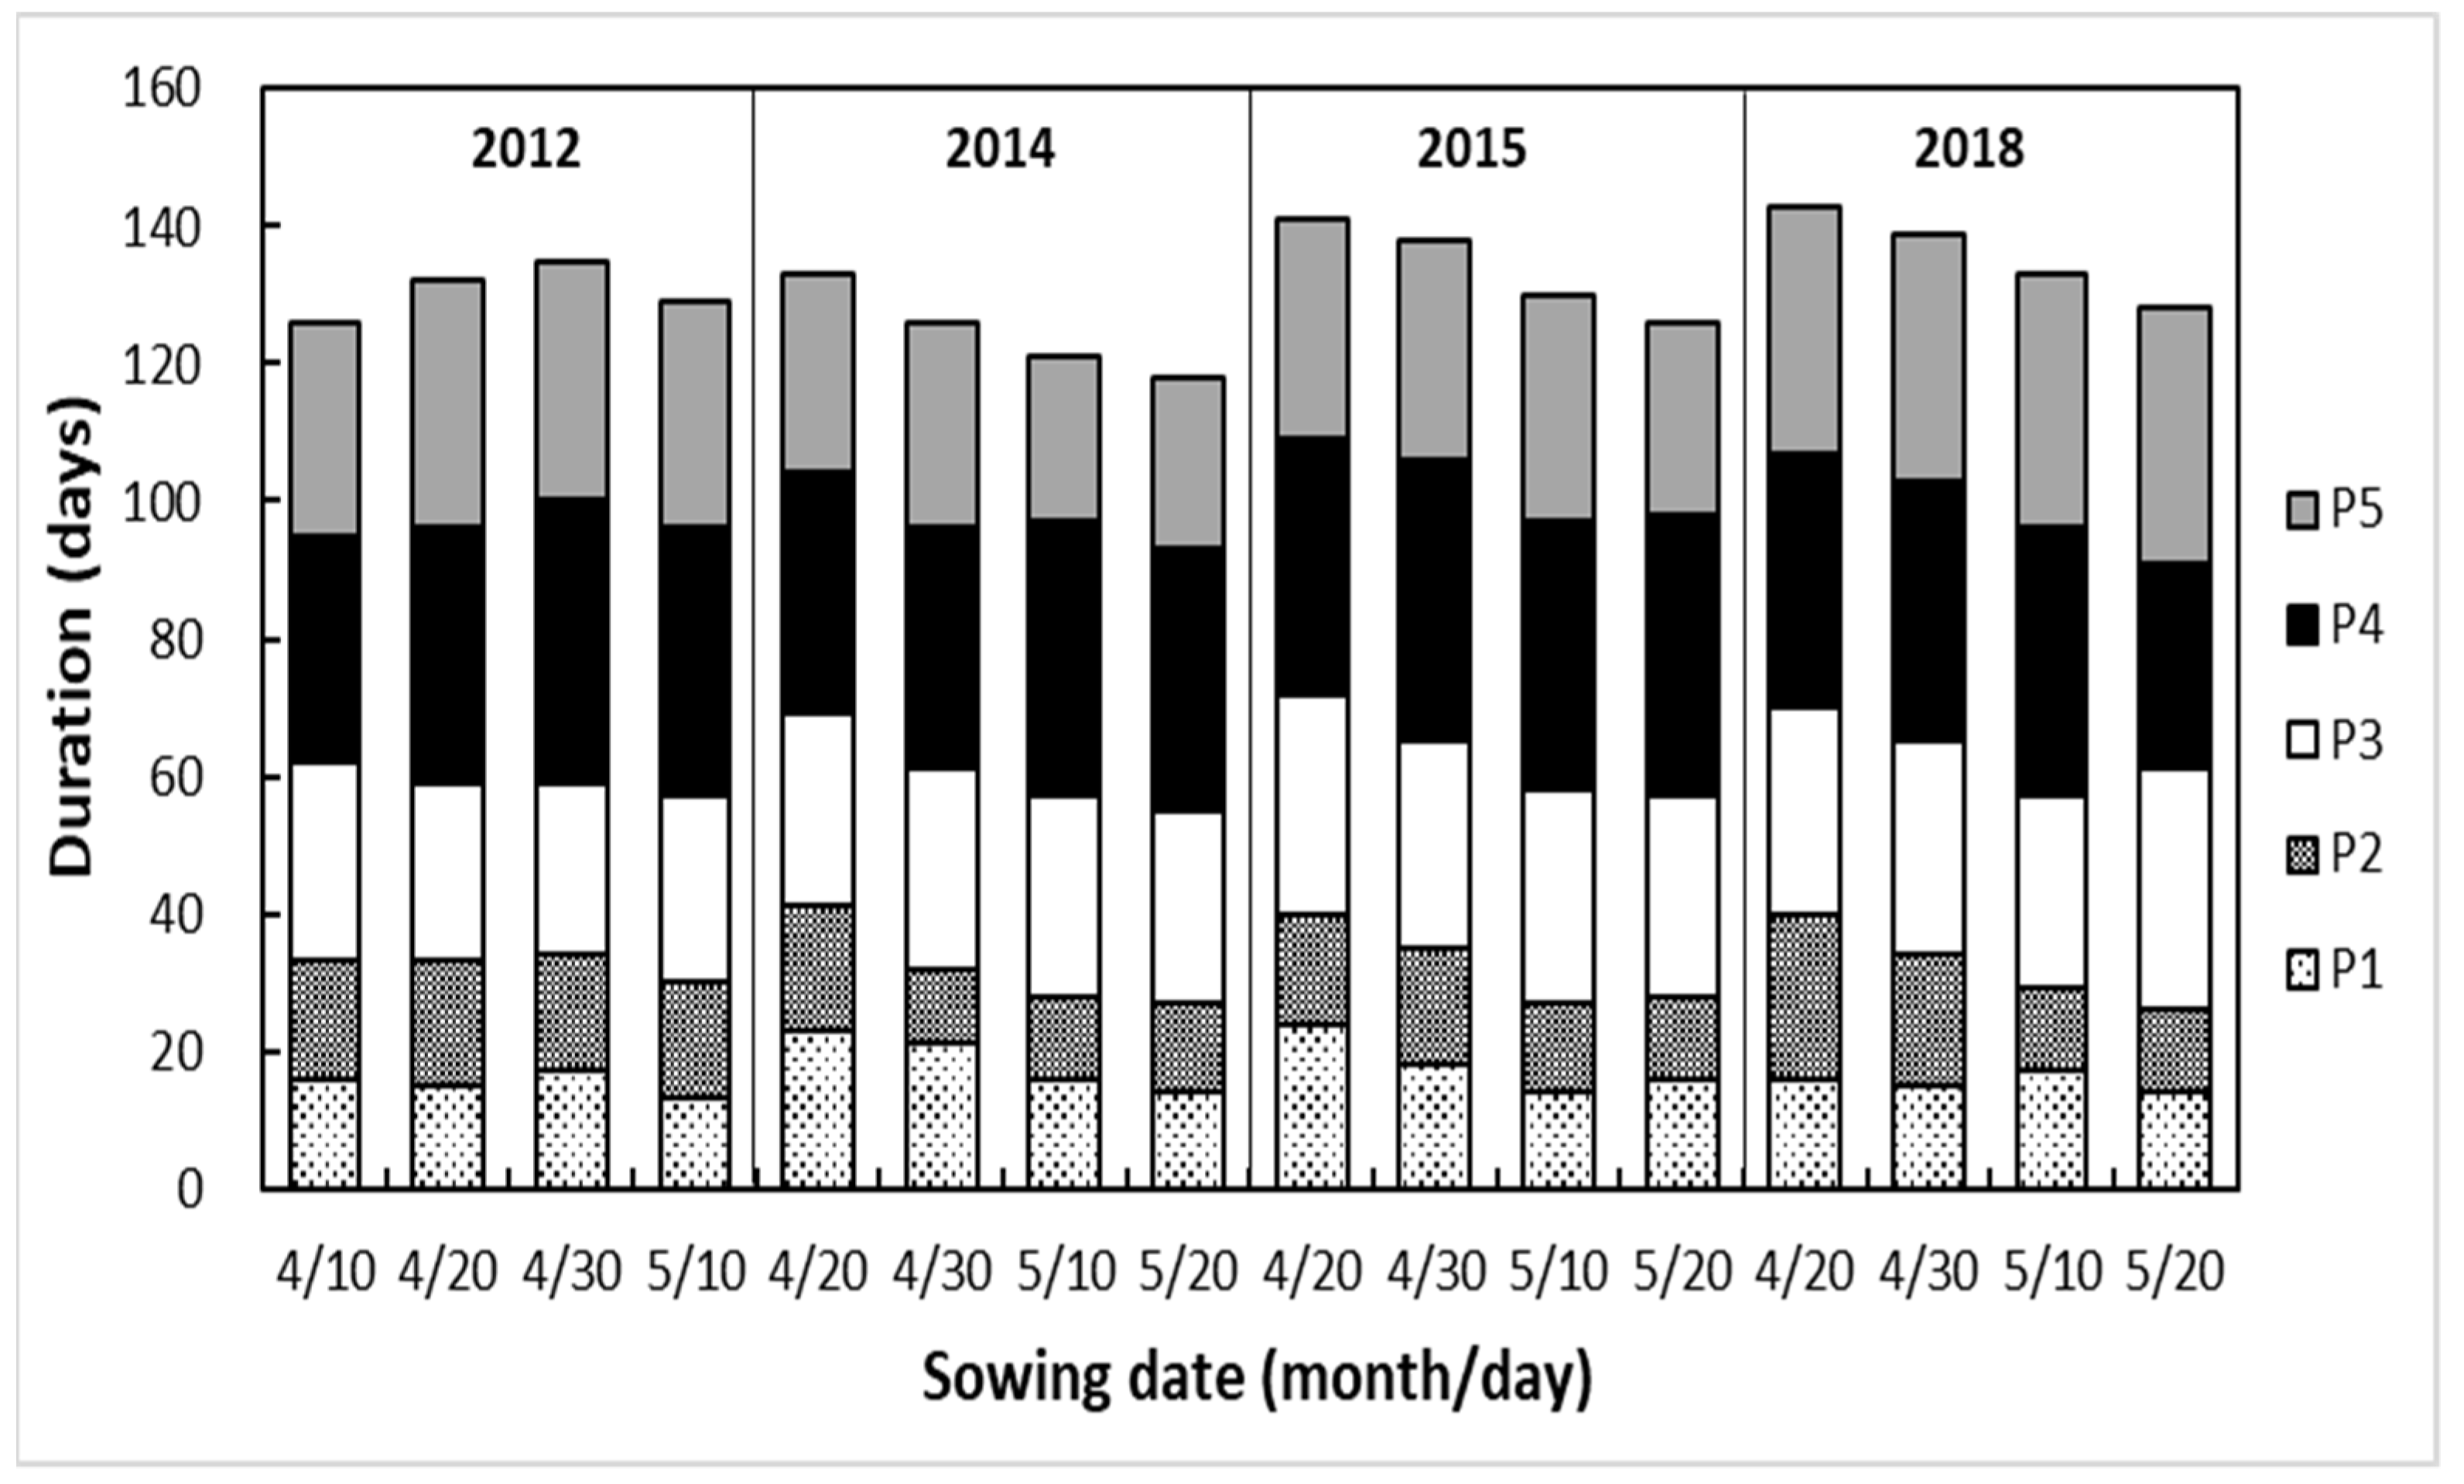
3.1. Growth Stages and Methodological Factors

The prerequisite to analyzing the meteorological conditions prevailing during different stages of crop growth is to know the start and end of each stage. As shown in Figure 1, in 2012, the total growth period was the shortest in the crop sown on 10 April because of the short stages of P4 and P5, and the longest in the crop sown on 30 April for the long stage of P4. In 2014, 2015, and 2018, some or all stages became increasingly shorter as the crop was sown progressively later: in 2014, the period was shorter because P1, P2, and P5 were shorter; in 2015, it was because P1 and P2 were shorter (and also P5 in the crop sown on 20 May); and in 2018, it was because P2 was gradually shortened.
Figure 2 captures the meteorological factors—AT, MT, radiation, and precipitation—during each growth stage of the crops sown on different dates. During P1 and P2, irrespective of the year or sowing date, AT was markedly stable. The difference in AT in each treatment in 2014 and 2015 was mainly due to P5. In 2018, the differences in AT among P2, P3, and P4 in crops sown on different dates were relatively prominent. Overall, the pattern of change in total AT matched that of the entire duration of the crop (Figure 2a). In 2014 and 2015, the total radiation during each growth period decreased with the delay in sowing, whereas no such clear association was seen in 2012 and 2018 (Figure 2b). It is seen in Figure 2c that the total precipitation during the growth period had an obvious difference between normal precipitation and drought years. The total precipitation in 2012 was nearly the same for all sowing dates, about 680 mm, and mainly concentrated in P4, while those in 2014, 2015, or 2018 were significantly less than in 2012, the least—about 200 mm—being in 2014 in all except in the earliest sown crop. In 2015 and 2018, the total precipitation was about 300 mm, irrespective of the date of sowing. Judging by the average MT in the four sowing dates each year, that during each growth period in 2012 was significantly lower than the corresponding MT in any of the other three years because of the earlier sowing dates and the greater precipitation in 2012. In each year, the MT varied the most during P1, which is related to the drastic fluctuations in temperature in spring. In P4, the MT was higher than those in other periods, and the highest in 2018.
The start and end dates of each growth period and the diurnal values of the SRWC and Dd for the different sowing dates each year are shown in Figure 3. The secondary axis, also vertical, shows the SRWC and Dd. In 2012 (Figure 3a), the water content during the entire growth period remained above 60%, irrespective of the date of sowing, indicating a total absence of drought. In 2014 (Figure 3b), the values of both the SRWC and Dd were consistent in marking the beginning of the drought as 13 July, which meant that the crop experienced drought from the middle of tasselling to maturity, during which the minimum soil moisture was about 40% and the maximum Dd was about 70%. The end of August was a period of significant increase in soil moisture. In 2015 (Figure 3c), drought set in by early June and crops sown on any of the four dates were exposed to it from jointing. The drought rapidly became severe after 1 July and remained severe from tasselling to maturity: the minimum SRWC was approximately 32%, and the maximum Dd was 85%, which was greater than that in 2014. In 2018, the drought set in by early June and soil moisture remained low but fluctuated, with a minimum of about 40%, whereas the maximum of Dd was about 45%. Although precipitation was not the lowest in 2015 (Figure 2c), soil moisture that year was significantly lower than that in either 2014 or in 2018, indicating that the drought in 2014 had depleted the stock of moisture in the deeper layers, and the adverse impact of low soil moisture was seen even next year. In 2018, soil moisture was greater than that in 2015 (Figure 3d) because the previous year, 2017, was not a drought year.
The daily variation in the maximum and minimum temperatures and in the relative humidity each year were analyzed (relevant figures are omitted with limited paper space). Notably, in 2018, the MT from late June to early July was significantly higher than that in any of the other 3 years, whereas the relative humidity was significantly lower. In addition, from late July to early August, when water consumption of maize is at its maximum, all three variables were also correspondingly higher and lower in 2018 than their values in the other 3 years. Predictably, two spells of high temperatures and low relative humidity will affect the growth of maize adversely.

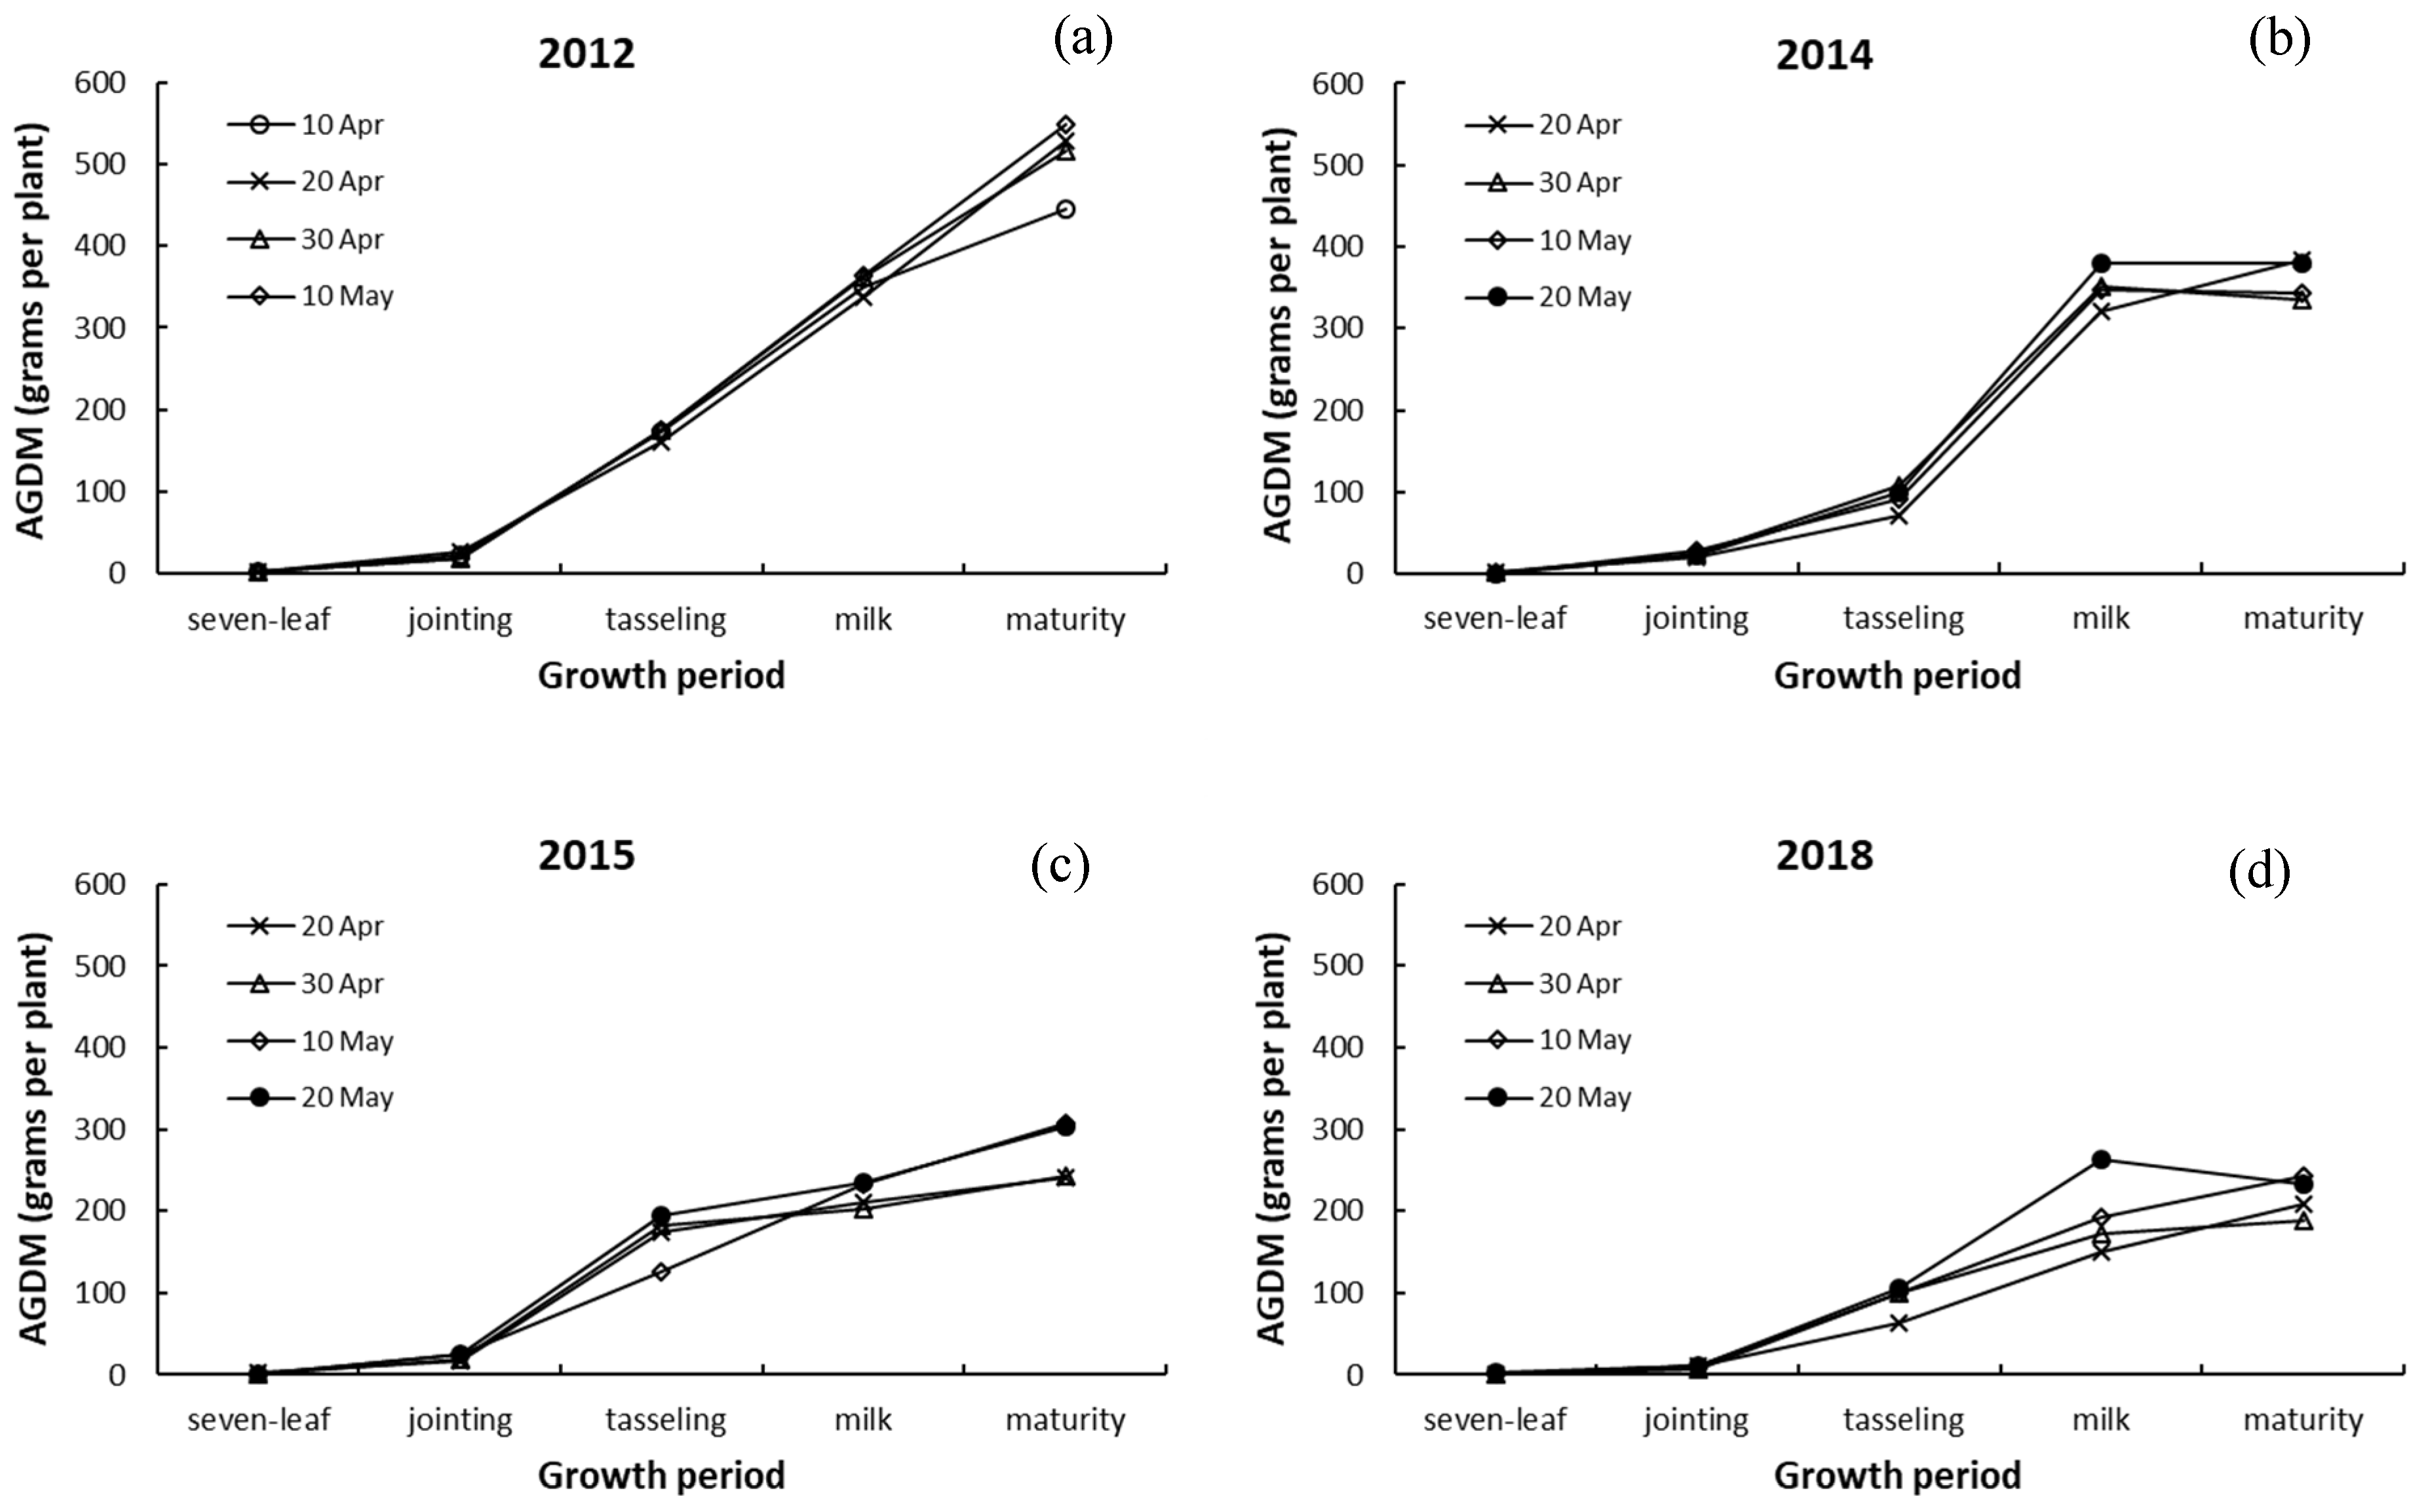
3.2. Above-Ground Dry Matter Weight and Its Response to Drought

Figure 4 shows the change patterns of AGDM at different growth stages of maize. In 2012, the differences in AGDM among crops sown on different dates were small before the milk stage, but widened as the crop neared maturity, especially in the crop sown on 10 April (Figure 4a), probably because the early sowing shortened the overall growth period. In 2014, AGDM during tasselling was markedly less than in 2012, irrespective of the date of sowing and, in most treatments, did not continue to increase after the milk stage. Relative to the AGDM in 2012, the AGDM in 2014 decreased by an average of 33% at maturity for the crops sown on 20 April, 30 April, and 10 May (Figure 4b). As the plants continued to grow, the differences in AGDM among the treatments increased slightly. The differences between the crop sown on 20 April and that on 20 May were particularly wider during the milk stage, but converged as the crops neared maturity. Plants from those two treatments, however, recorded higher AGDMs than those from the other treatments did—probably because of the difference in precipitation among treatments. In 2015, at tasselling, AGDM was significantly less in the crop sown on 10 May, but that was probably a sampling error, judging by the values of AGDM at the later stages. At maturity, AGDMs in crops sown on the two later dates were greater than those on the two earlier dates. The difference in AGDM due to drought occurred from the milk stage to maturity, AGDMs for the first three dates of sowing had decreased by about 50% on average compared to those in 2012 (Figure 4c). In 2018, the differences in the AGDM among treatments at the milk stage were greater than those at maturity, and the AGDM in the crops sown later (10 May and 20 May) was slightly larger than in the crops sown earlier (20 April and 30 April), and beginning from tasselling, the AGDM on the first three dates of sowing was about 60% lower on average compared to the value in 2012 (Figure 4d).

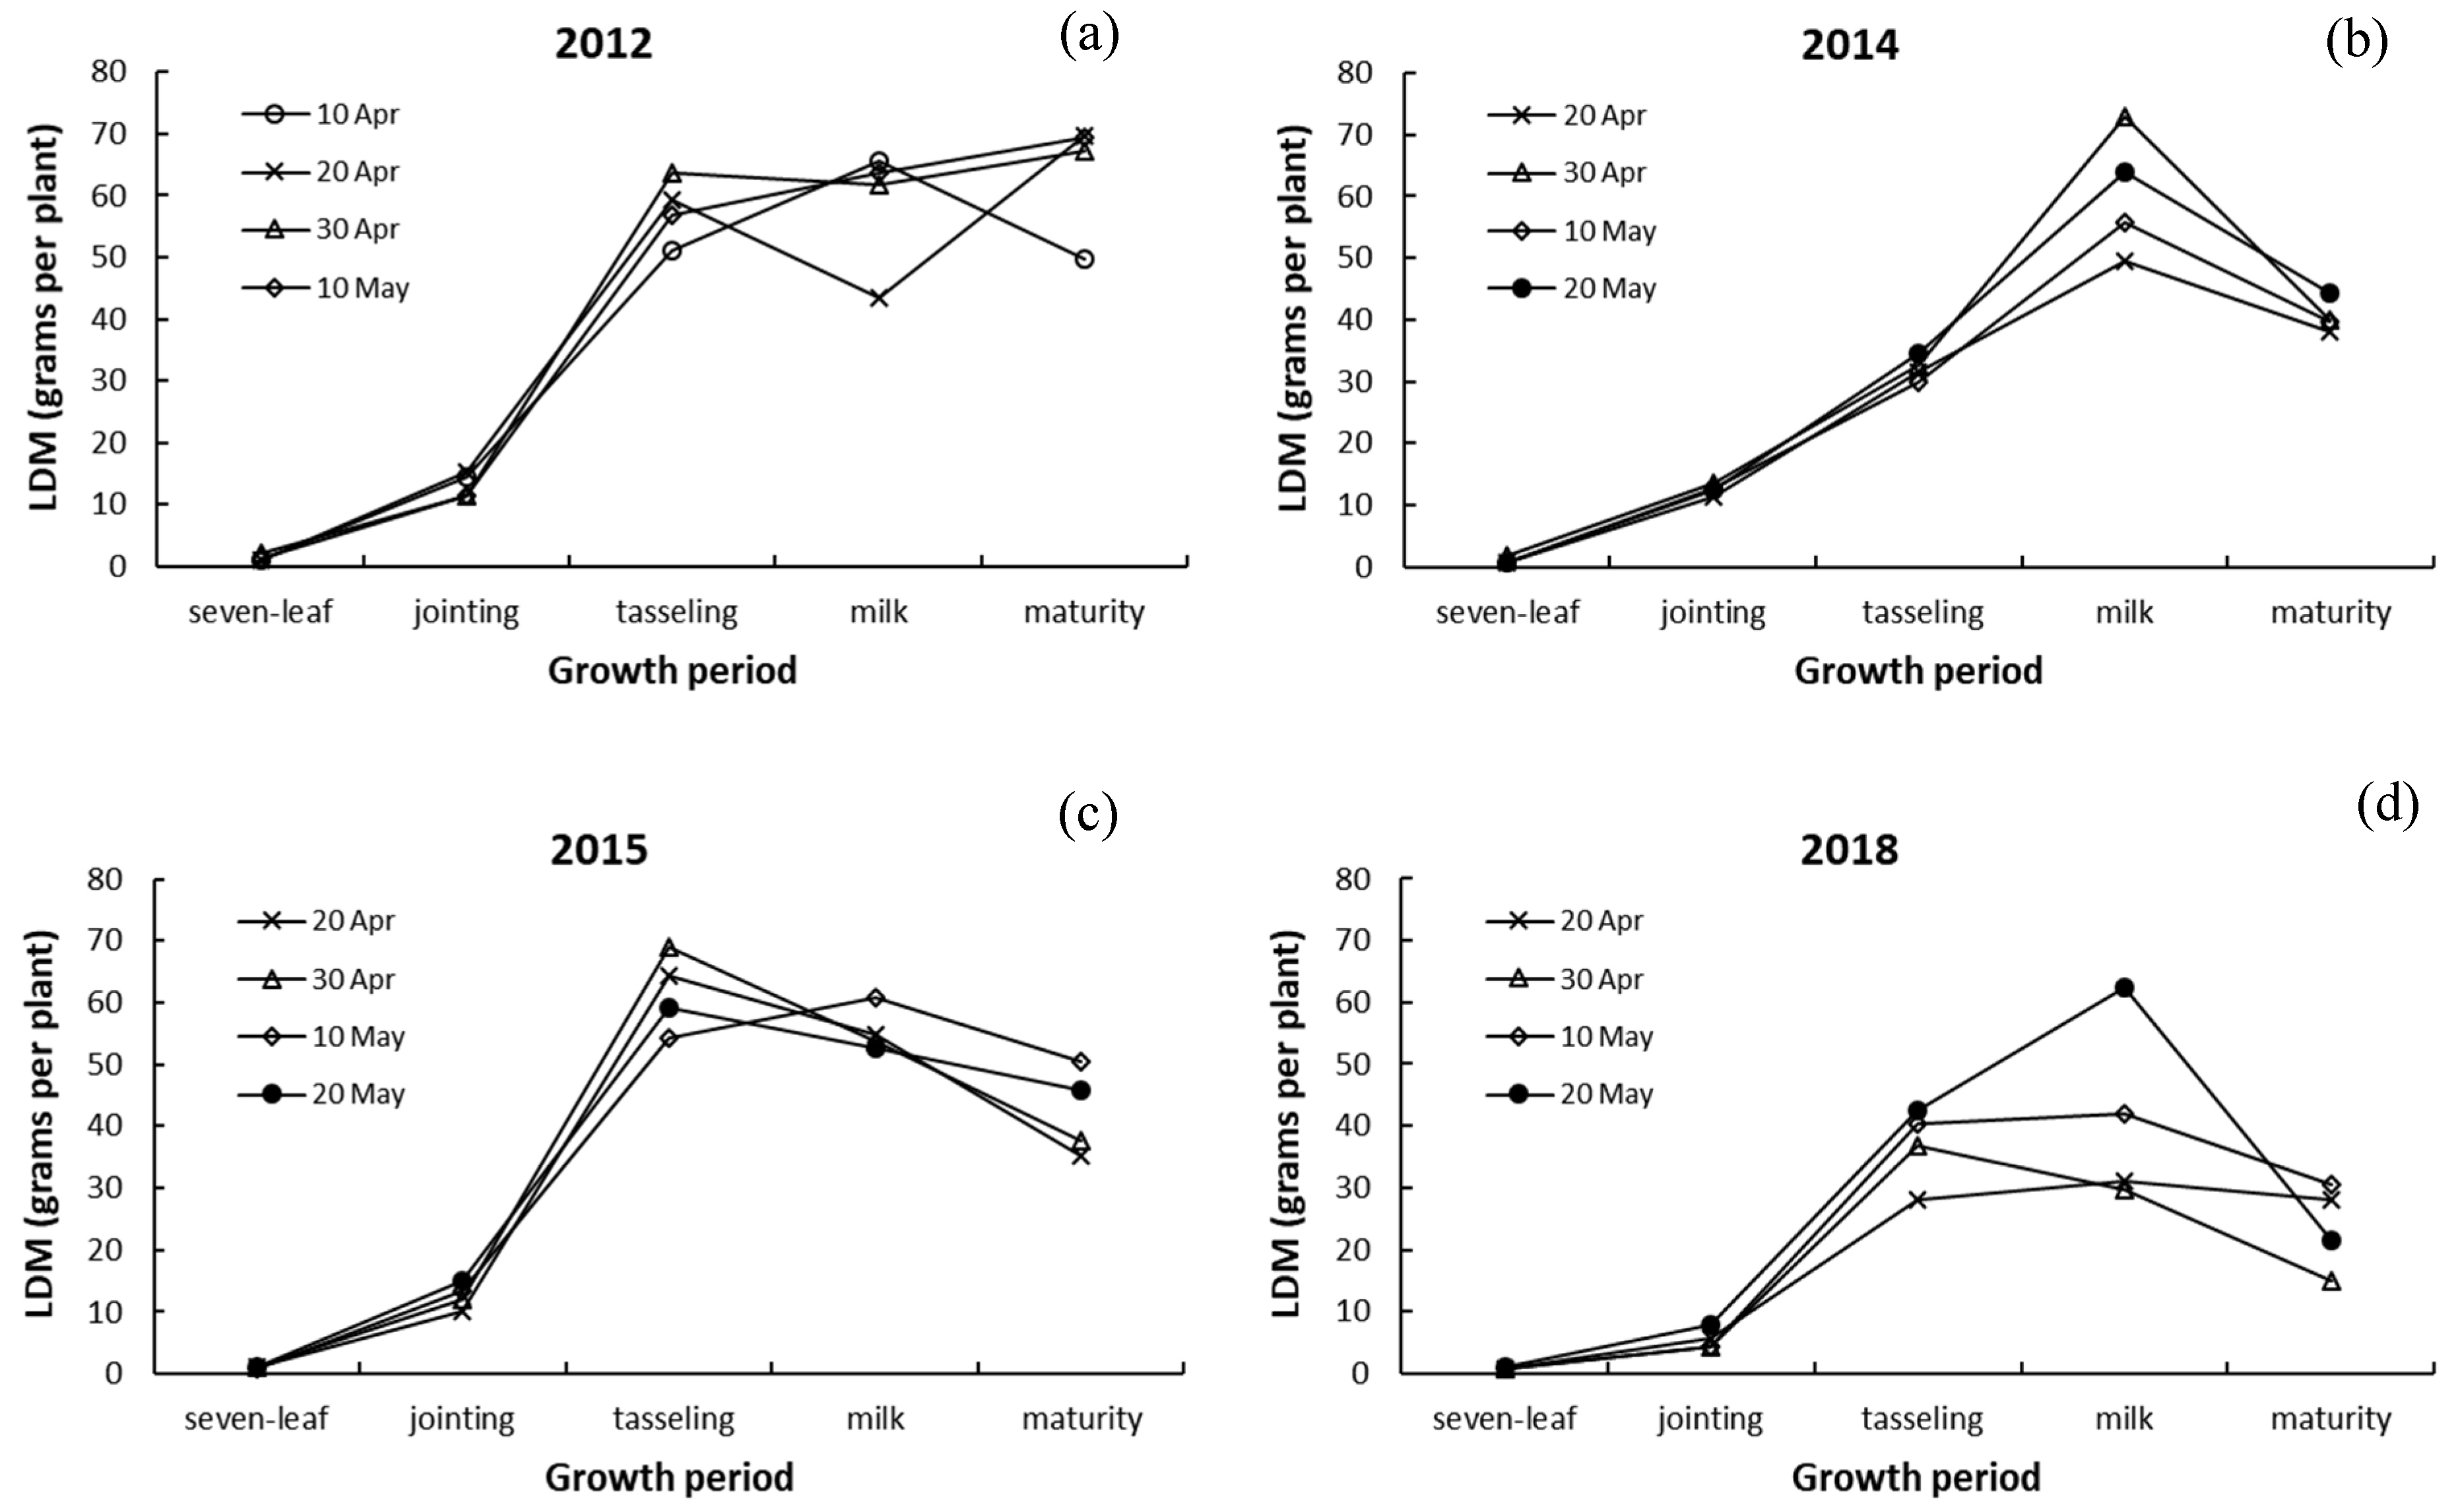
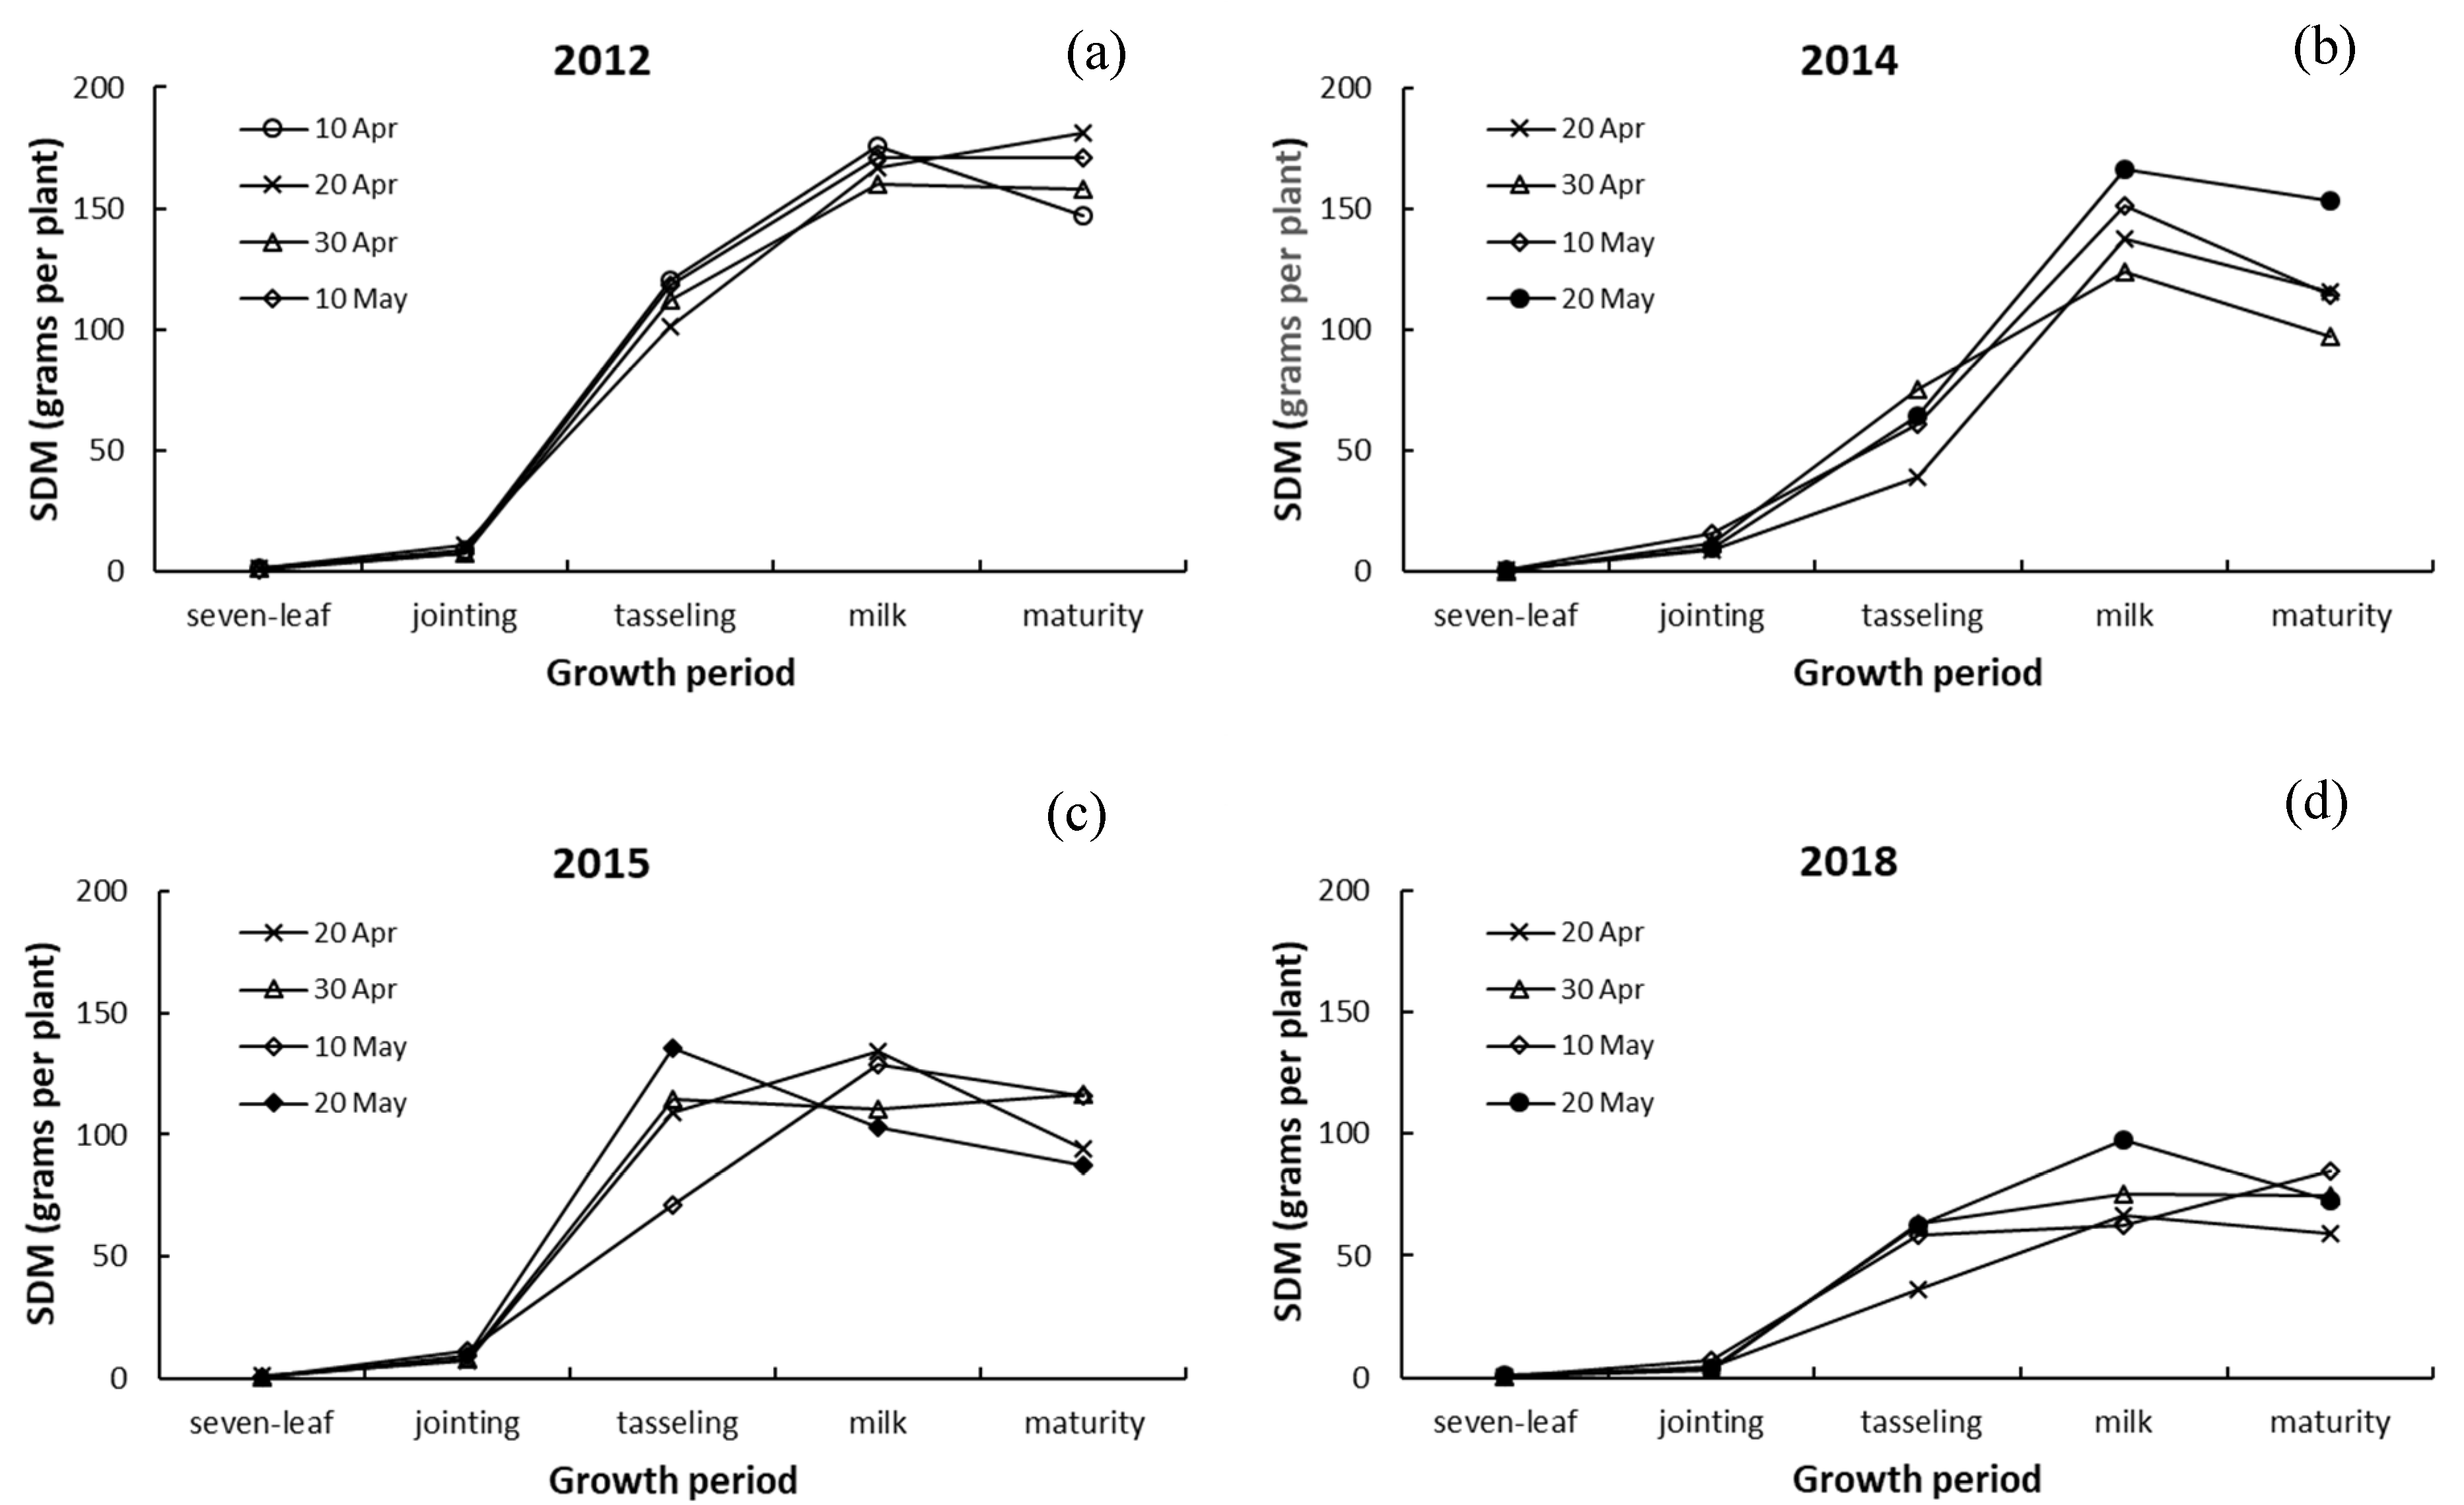
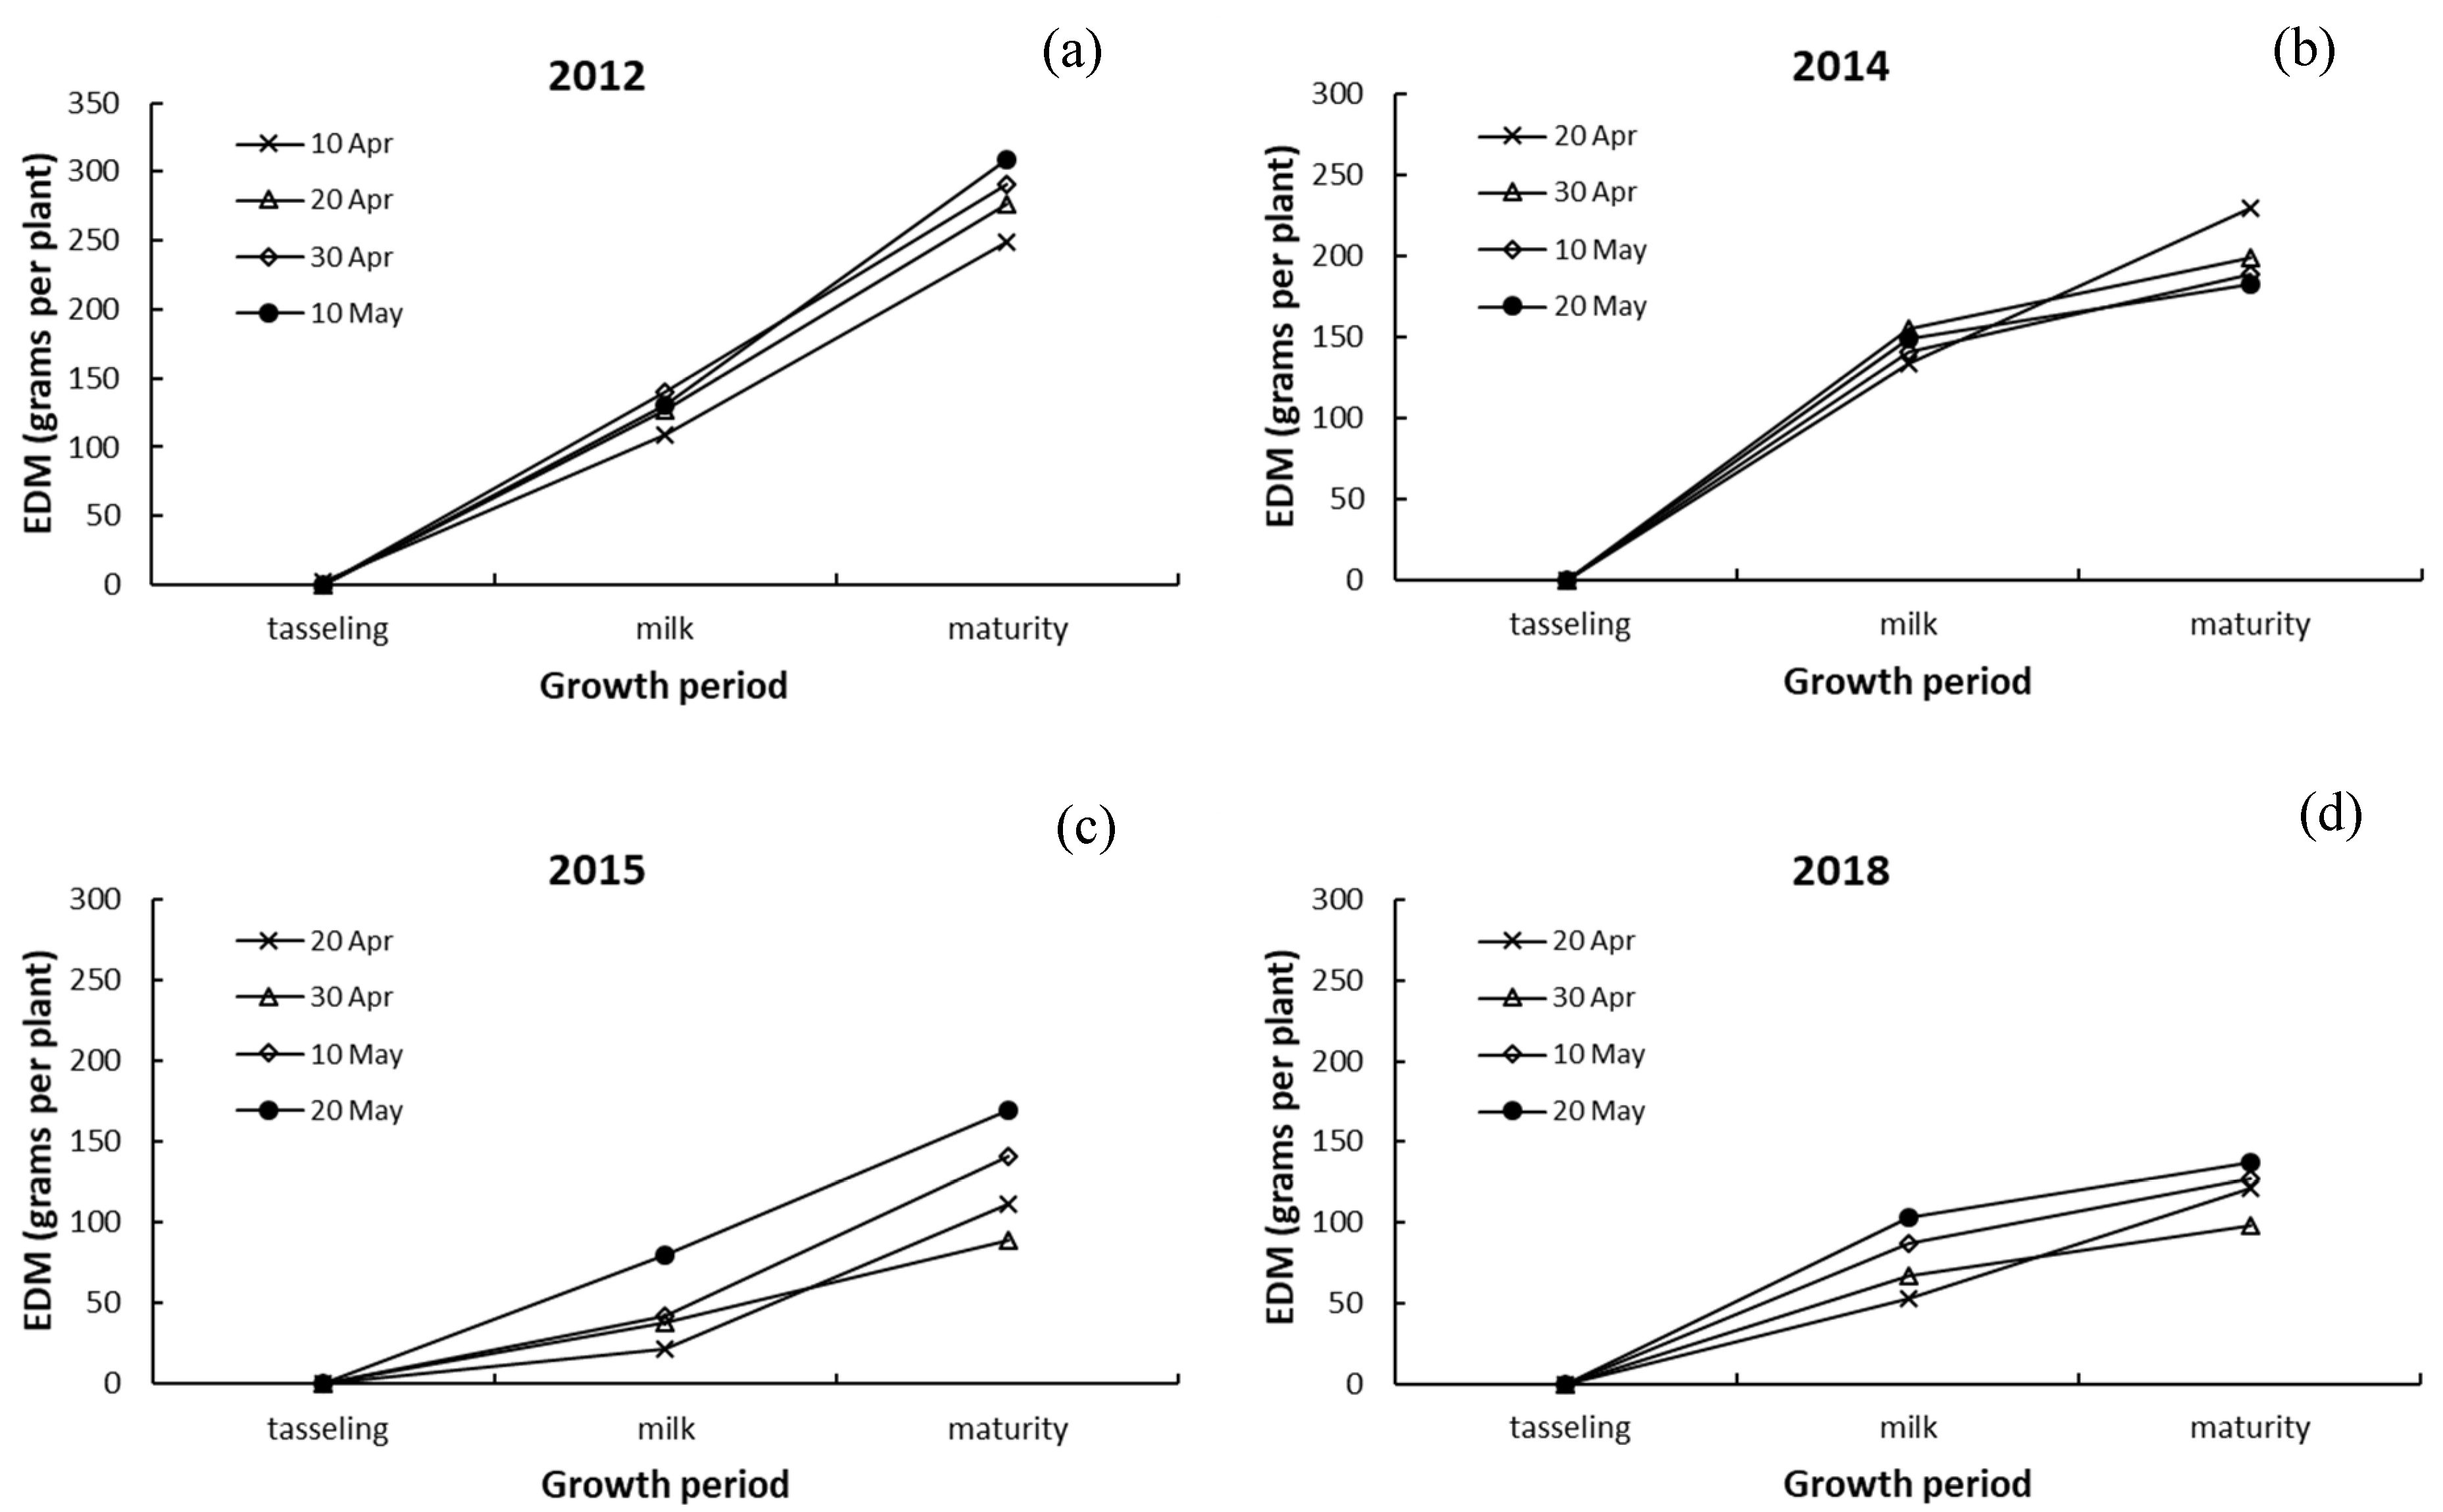
3.3. Differences in Dry Matter among Leaves, Stalk, and Ears of Maize

Different above-ground organs, namely leaves, the stalk, and ears, differed in the extent to which their DMs were affected by the sowing date and also by the year. As shown in Figure 5a, in 2012, LDM increased rapidly from jointing to tasselling and slowly thereafter, irrespective of the date of sowing. The differences among treatments began to widen from tasselling, and LDM decreased significantly at maturity in the crop sown on 10 April, the earliest date. However, LDM at the milk stage in the crop sown on 20 April was significantly less than that on other dates, probably due to experimental error. In 2014 (Figure 5b), LDM in each treatment increased gradually up to the milk stage and decreased thereafter. The differences among treatments were the most marked at the milk stage, but showed no consistent pattern connected to the date of sowing. In 2015 (Figure 5c), LDM for different treatments peaked at tasselling and decreased almost linearly thereafter, and was significantly lower than in 2012 after the milk stage, thus indicating that the effects of drought appeared sooner in 2015 than in 2014. In 2018 (Figure 5d), LDM in the crop sown on 30 April also peaked at tasselling, whereas for the rest of sowing dates, it peaked at the milk stage and decreased thereafter. The maximum LDM for the first three sowing dates was significantly less than that in 2012.
SDM differed from LDM in the response to sowing dates (Figure 6). In 2012 (Figure 6a), SDM increased rapidly from jointing to the milk stage, indicating that under normal circumstances, SDM peaks later than LDM does. Additionally, SDM at maturity in most treatments remained either unchanged or increased slightly, except in the crop sown on 10 April. The pattern of changes in SDM before the milk stage was more consistent with that seen in AGDM. In 2014 (Figure 6b), irrespective of the sowing date, SDM peaked at the milk stage and decreased thereafter, a pattern slightly different from that seen in LDM. The SDMs of crops sown on different dates that year were less than in 2012 and the differences among them appeared after tasselling and widened thereafter. In 2015 (Figure 6c), SDMs at tasselling in the crop sown on 10 May and at the milk stage and maturity in all the crops were significantly lower than in 2012, and the reductions in peak values were greater than in 2014. In 2018 (Figure 6d), SDMs in most of the treatments peaked at the milk stage and differed greatly among the treatments, and were also significantly less than those in 2012, although the overall pattern was similar to that in the AGDM.
As shown in Figure 7a, in 2012, EDM and the differences in it increased from tasselling to maturity in crops sown on any of the dates, although the later the sowing date, the greater the EDM at maturity. In 2014 (Figure 7b), the EDM was not affected by drought, and the differences among the sowing dates before the milk stage were smaller than those in 2012; also, the EDMs at maturity were 29% less on average than those in 2012. In 2015 (Figure 7c), the EDM showed large differences among treatments at the milk stage and at maturity, and the increase at maturity was greater than that at the milk stage. EDM at maturity averaged for the above-mentioned three dates was lower by 61% compared to that in 2012. In 2018 (Figure 7d), EDM for each treatment at the milk stage and at maturity was smaller than the corresponding values in 2012, and the increase at maturity was less than that at the milk stage. EDMs in the crop sown on 10 May or on 20 May at the milk stage, and at maturity, were greater than those in the crops sown on 20 April or 30 April. On average, the decrease of the EDM in 2018 was 60% of that seen in 2012. Overall, in 2018, the impact of the combination of high temperature and drought weakened as sowing was progressively delayed.
Considering that the DM of maize in 2018 was jointly affected by high temperature and drought, which was different from the impact of drought alone, we examined the relationship of the magnitudes of IDM in different organs in P3 with those in P4 (Figure 8a), and also between that magnitude in P4 and that in P5 (Figure 8b) based on the data for 2014 and 2015. Marked negative correlations were evident between P3 and P4 with reference to the magnitude of leaves’ IDM, stalk IDM, and AGIDM. The correlation with reference to the stalk IDM or AGIDM was more significant than the leaf IDM. Although similar negative correlations were observed between P4 and P5, these correlations were markedly weaker. However, in the case of the correlation between P4 and P5, the correlation was strongest for the ear IDM, followed by the leaf IDM and stalk IDM (Figure 8b).

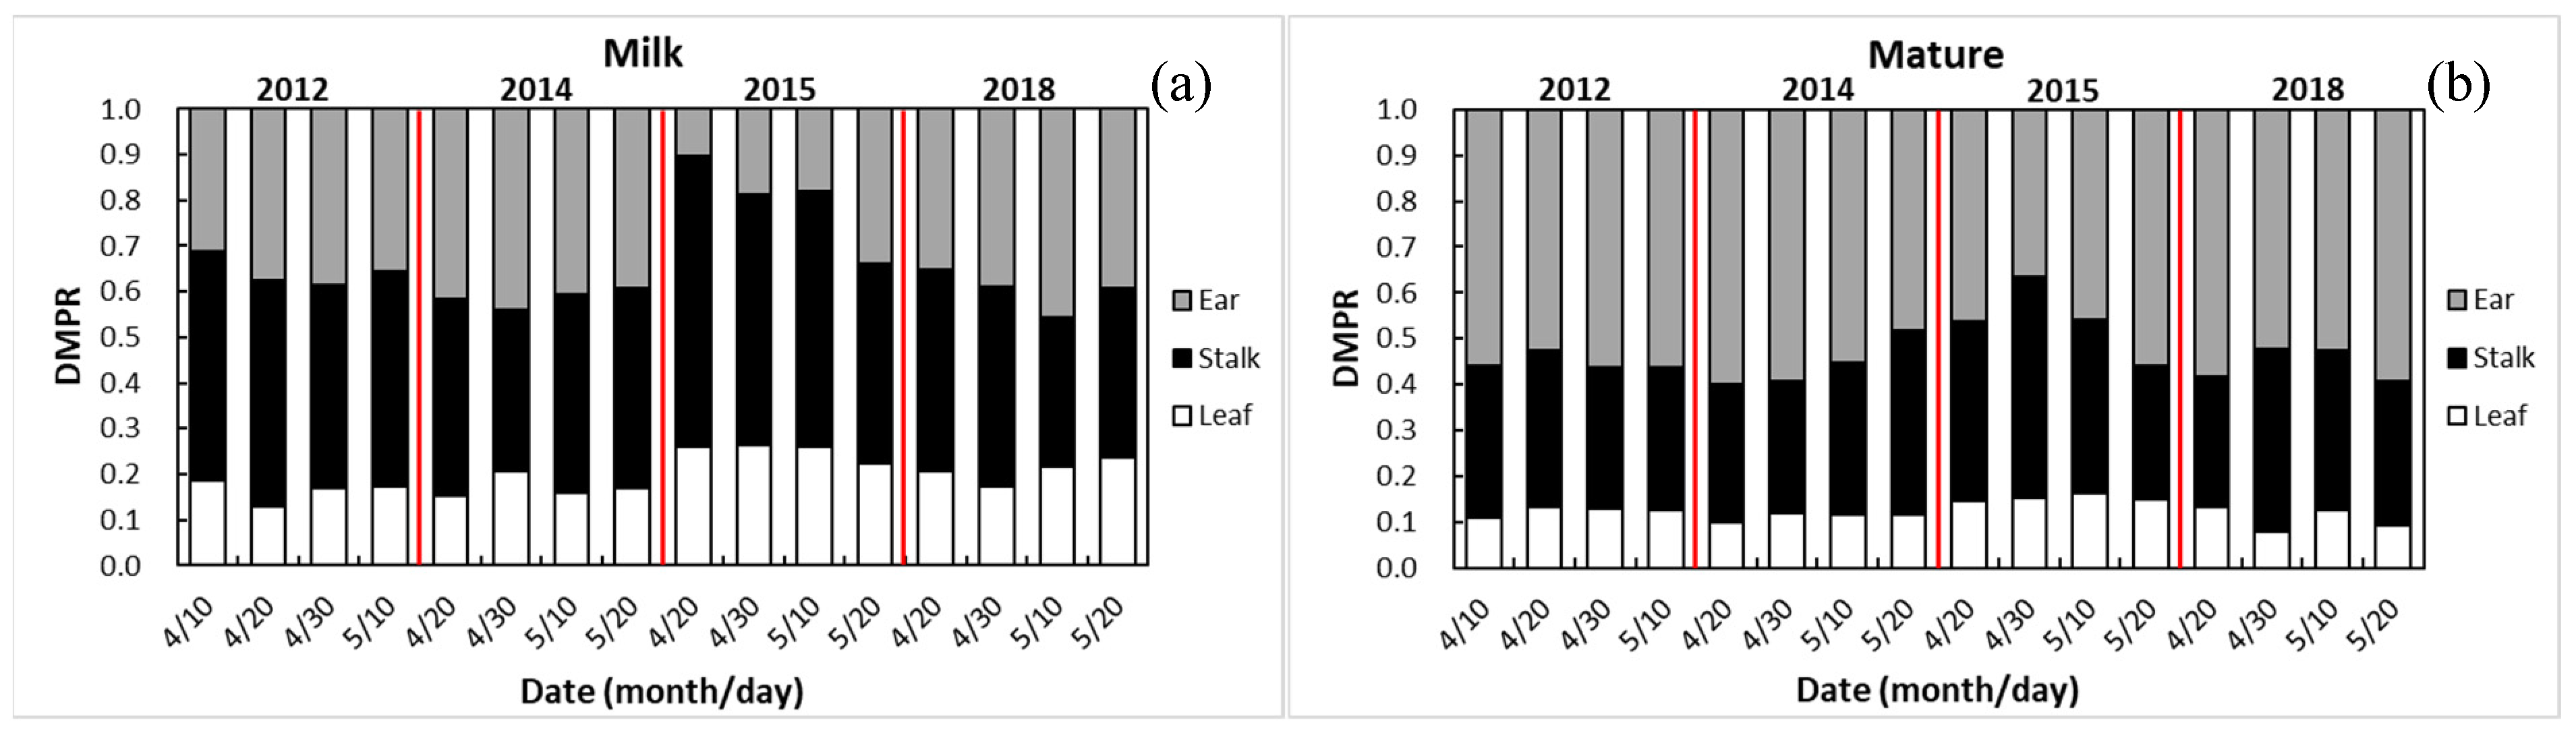
3.4. Dry Matter Partitioning among Different Organs of Maize at Different Growth Stages as Affected by Drought

3.4.1. Dry Matter Partitioning at Milk Stage

The DMP among the three above-ground organs of maize (leaves, stalk, and ears) at the milk stage and at maturity for each of the four years is shown in Figure 9. At the milk stage (Figure 9a), in 2012, the DMPR was 0.13–0.19 for leaves, 0.44–0.50 for the stalk, and 0.31–0.39 for ears—values that can be considered typical under normal growth conditions. In decreasing order of the rates, the organs were the stalk, ears, and leaves. In 2014, the DMPR was 0.15–0.21 for leaves, 0.35–0.43 for the stalk, and 0.35–0.44 for ears. Compared to its values in 2012, the DMPRs for leaves and ears were higher in 2014, whereas the value for the stalk was lower, indicating that drought promotes the transfer of DM from the stalk to the ears. In 2015, the DMPR was 0.22–0.26 for leaves, 0.44–0.64 for the stalk, and 0.10–0.34 for ears. It is clear that the leaves and stalk’s DMPRs were higher than in 2012. The differences in the stalk and ears’ DMPRs between the sowing dates increased compared to that in 2012. On the other hand, the stalk DMPR decreased and the ear DMPR increased with progressively delayed sowing, which was related to the slight rise in soil moisture during the later stages of growth. In 2018, the DMPR was 0.17–0.24 for leaves, 0.33–0.44 for the stalk, and 0.35–0.46 for ears, a pattern similar to that in 2014: the DMPR for stalks was lower, whereas that for the leaves and ears was higher.

3.4.2. Dry Matter Partitioning at Maturity

At maturity (Figure 9b), in 2012, the DMPR was 0.11–0.13 for leaves, 0.31–0.34 for the stalk, and 0.52–0.56 for ears. It can be seen that from the milk stage to maturity, the leaves and stalk’s DMPRs decreased when rainfall was sufficient, the decrease in the DMPR for the stalk being particularly large, whereas the ear DMPR increased significantly. In 2014, the DMPR was 0.10–0.12 for leaves, 0.29–0.40 for the stalk, and 0.48–0.60 for ears. The DMPR for the stalk had increased significantly with the delay in the sowing date and was greater for the last two sowing dates than the corresponding values in 2012. With the DMPR for ears, the pattern was the exact opposite, indicating that the impact of drought during maturity was different, depending on the date of sowing. More specifically, for the first two sowing dates, drought promoted the transfer of the stalk DM into the ears, whereas for the last two sowing dates, drought inhibited such a transfer. In 2015, the DMPR was 0.15–0.16 for leaves, 0.29–0.48 for the stalk, and 0.37–0.56 for ears. Compared to that in 2012, the DMPR for the stalk was significantly greater, especially for the first two sowing dates, and the difference between the sowing dates was also greater. These observations show that severe drought has a greater impact on DMP at maturity and inhibits the transfer of DM from the stalk to the ears. However, greater soil moisture during the later growth stages weakened the impact of drought. In 2018, the DMPR was 0.08–0.13 for leaves, 0.28–0.40 for the stalk, and 0.52–0.59 for ears; the pattern being largely similar to that seen in 2012. Overall, the more severe the drought, the greater the decrease in the DMPR for ears at maturity. Although the combined impact of high temperature and drought can lower AGDM, it has only a limited impact on the pattern of DMP among various organs.

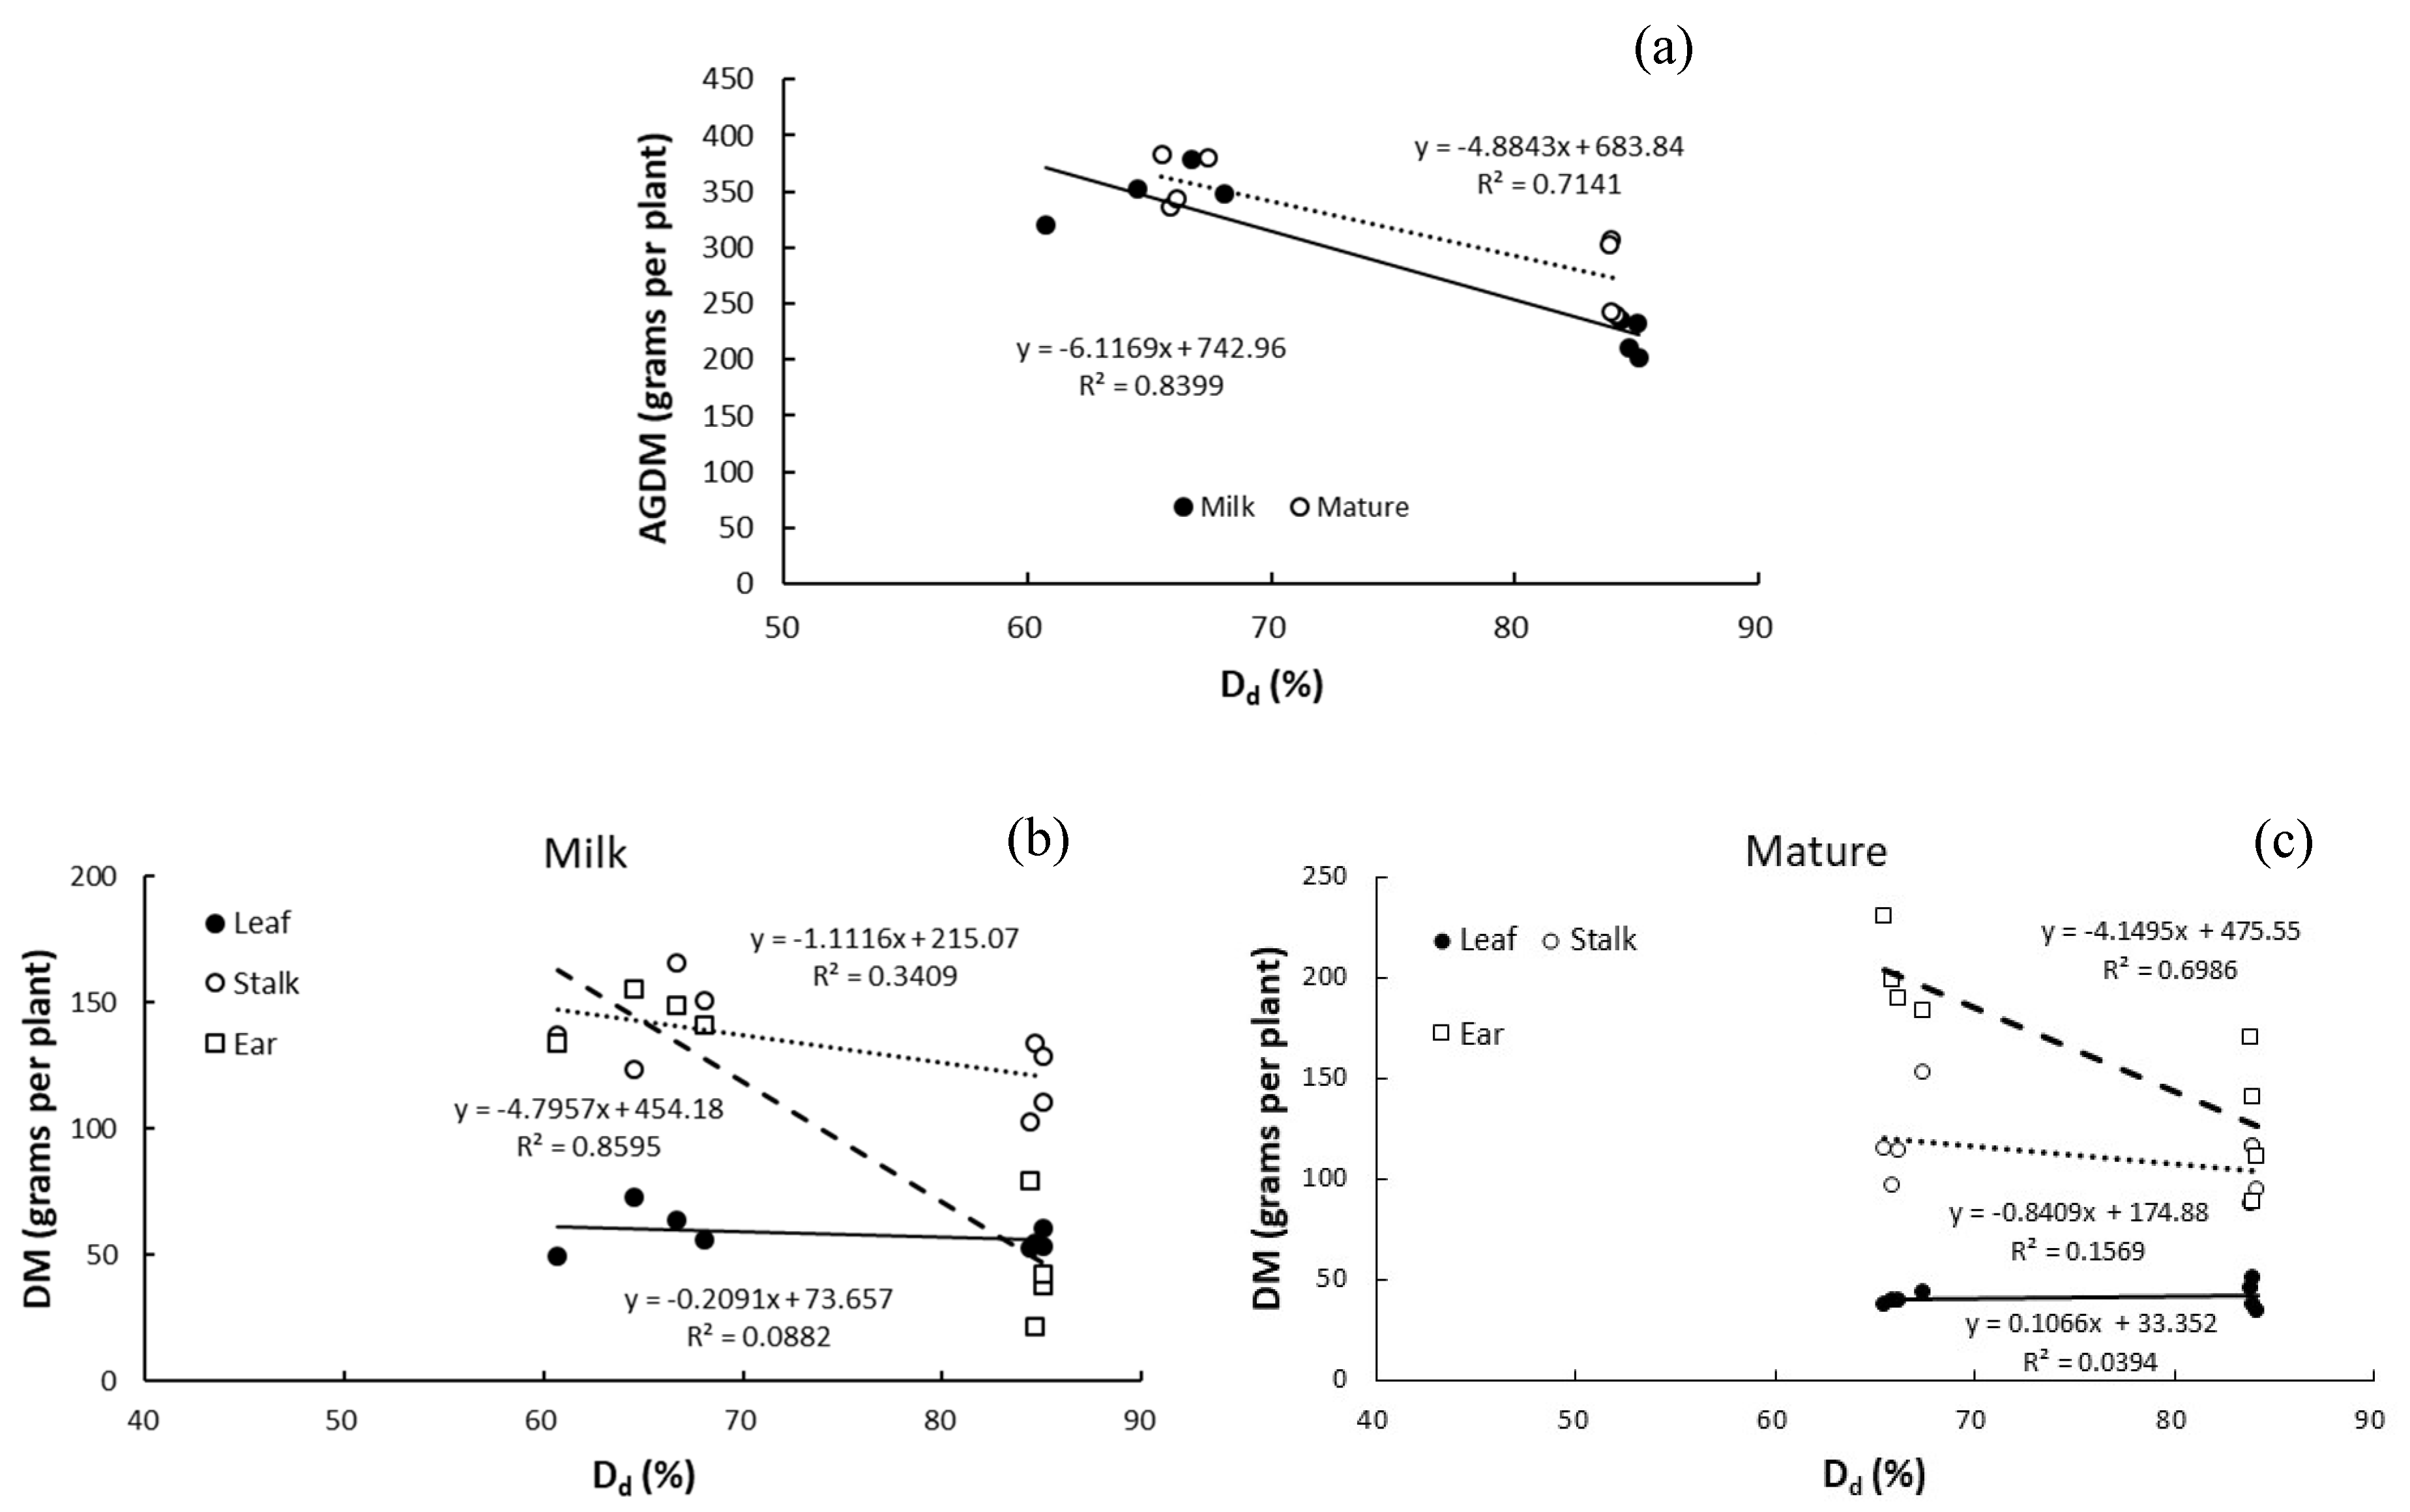
3.5. Relationship between Dry Matter and Degree of Drought

The degree of drought (Dd), was negatively correlated to the AGDM and DM in the leaves, stalk, and ears of maize at the milk stage and at maturity (Figure 10). More specifically, at the milk stage (Figure 10b), EDM and SDM were negatively correlated to Dd, the correlation being significant in the case of EDM, whereas LDM remained almost unaffected by Dd. At maturity (Figure 10c), SDM and EDM were negatively correlated to Dd.

4. Discussion

4.1. Response of Length of Growth Period to Drought and Sowing Date

Precipitation during the entire growth period of maize in 2014, 2015, or 2018 was less than half of that in 2012, which distinguishes clearly between the normal and drought years. However, the impact of drought on plant growth is cumulative, and the present study introduces an indicator of the degree of drought, namely Dd, to reflect that cumulative impact. This indicator takes into account the influence of soil depth, soil hydrological properties, and meteorological factors on drought [4], and is therefore more objective than using soil moisture as the only indicator of drought [39]. In the present study, Dd corresponded closely to the SRWC, clearly indicating the continued accumulation of the drought process. It is difficult to judge the level of soil drought from precipitation, but it can be seen from the changes in Dd that the drought in 2015 was the most serious and occurred before tasselling, which was significantly earlier than that in 2014, and was closely related to the water deficit in the deeper layers of soil caused by the drought in the previous year, reflecting that the effect of drought in a given year is exacerbated or aggravated if the previous year was a drought year, and a series of consecutive drought years results in severe drought.
By analyzing the length of the growth period of maize sown on different dates, we found that, in a normal year, both early and late sowing shortened the entire growth period. However, when sowing was delayed in drought years (that is, no or scant rain during the growth period of maize), the entire growth period was shortened mainly because of a shorter seedling stage (from emergence to jointing), a consequence of the higher MTs during that period. Although the duration from emergence to tasselling, namely the vegetative stage, varied markedly among the different sowing dates and from year to year, the AT during that period was relatively constant, and the difference in AT in the entire growth period was due mainly to the differences in the duration of the period from tasselling to maturity, i.e., the reproductive stage. Therefore, it is found that the phenology of the vegetative stage is more closely related to the AT than that of the reproductive stage, which will put forward a challenge to phenology simulation for many crop models [20,21]. In addition, the total radiation also corresponded closely to the length of the growth period under different dates of sowing in all the years except 2018. The MT was significantly higher in the drought years than in the normal year, and the MT from tasselling to the milk stage was the highest in 2018. In general, the meteorological conditions special for the MT that prevailed during each developmental stage of maize showed clear differences depending on the date of sowing and the year [43,44], and were an important reason for the differences in the lengths of the developmental stages—more so than drought, which had only a limited impact [35] (Mi et al., 2019). That is, the planting date affects the phenology and further impacts the crop biomass [43,45]. Some scholars maintain that drought affects the phenological period of crops [35,46,47] by lengthening or shortening the duration over which the drought exercises its impact. However, the results from the present study suggest that a drought does not necessarily change the duration of the growth period because maize adapts itself to the drought so long as it does not extend beyond a certain threshold [48], which also reflects that the interactions between the stresses and the developmental stages of the crop are very complicated [49].

4.2. Response of Aggregate Above-Ground Dry Matter to Drought and Sowing Date

The impact of drought on the AGDM differs depending on the degree of drought, and a difference in the sowing date can change the degree of drought to which maize is exposed during each of its development stages. In 2014, the AGDM peaked during the milk stage and differed markedly depending on the sowing date as a result of drought: the AGDM was the lowest in the crop sown on 20 April and the highest in that sown on 20 May, probably because of the differences in precipitation. This observation suggests that although the total precipitation that year was less than that in a normal year, even a small amount of precipitation has a significant positive effect on DMA. In the crop sown on 20 April, DM increased significantly during maturity compared to that during the previous stage, which was also because precipitation during maturity was higher for the crop sown on 20 April. Therefore, DMA is more sensitive to precipitation in a drought year than in a normal year [50].
The drought was the most severe in 2015. Unlike in 2014, the crop was affected by drought before tasselling, which is earlier than in 2014, and the reduction in DM due to drought was significantly greater in 2015 than in 2014. AGDMs at the milk stage and maturity were significantly less than in a normal year, and the impact of drought varied with the sowing date. Specifically, crops sown earlier, i.e., on the first two dates, produced less DM than those sown on the last two sowing dates under the effect of drought. Thus, the time of onset of the drought, or the stage of growth at which the drought sets in, has a significant impact on DMA, which has a consistency with the pioneering work [51]. In 2018, maize encountered high temperatures and drought from late tasselling to the milk stage simultaneously, which is, therefore, significantly different from the other two drought years. As a result, the AGDMs at the milk stage and at maturity declined sharply, although Dd was not particularly large, demonstrating that the synergistic effect of high temperatures and drought is significantly greater than that of drought alone [52]. Notably, dry matter production during the milk stage in crops sown later was greater than that in the crops sown earlier, indicating that the effect of high temperatures and drought on the late-sown crops was smaller than that on the early-sown crops, which reflects that the growth stage at which maize is exposed to stress changes the response of crop, as expressed through dry matter production. Thus, it is an effective measure to avoid the influence of disaster in the key growth stages, such as the flowering or silking stages, of maize by shifting the sowing date [27,53].

4.3. Responses of Dry Matter in Leaves, Stalk, and Ears to Drought and Sowing Date

In the normal year (2012), dry matter in above-ground organs of maize peaked at different stages: LDM peaked at tasselling, and experienced a weak fluctuation change thereafter; SDM peaked at the milk stage, a pattern that matched the pattern of AGDM; and EDM kept increasing linearly from tasselling to maturity. SDMs in early sowing dates were larger than in late ones, and the situation of EDMs were inverse to SDMs, which can be explained based on the source–sink relationship, that is, the sink strength in the late sowing dates is larger than in the early ones [27]. These patterns changed as a result of the timing of drought. Drought had different effects on DMA in different organs, which varied depending on sowing dates. In the years of mild drought, i.e., 2014, LDM peaked at the milk stage and decreased thereafter. The lowest amount of LDM at the milk stage in the crop sown on 20 April was probably the result of the combined effect of the sowing date and drought. The change in weather with the sowing date affected the LDM, especially at the milk stage and maturity. Compared to 2012, the LDM at tasselling and maturity decreased significantly, indicating that drought inhibited DMA in leaves and delayed its peaking by promoting the diversion of DM from leaves to ears. In 2015, the year with the most severe drought, LDM peaked at tasselling and decreased rapidly thereafter, indicating that severe drought affects LDM earlier than mild drought. In 2018, the LDM in the crop sown on 20 May was less affected by the high temperatures and drought and peaked at the milk stage. SDM changed more markedly than LDM as a result of drought and changes in the sowing dates, while the changes in the SDM among the sowing dates due to the high temperature and drought were also greater and were evident at the milk stage and maturity. The response of EDM to drought and the difference of the response among sowing dates increased with the increase of Dd. At the milk stage, the effect of the high temperature and drought was greater than that of drought alone. Notably, AGDM was negatively correlated to Dd at the milk stage and at maturity, the most significant correlation being that between EDM and Dd, followed by that between SDM and Dd, whereas LDM was only weakly correlated to Dd, which was also proven in another research based on a water control field experiment at the same studied site [4].

4.4. Responses of DMP among Leaves, Stalk, and Ears to Drought and Sowing Date

At the milk stage, the DMPR increased slightly in leaves and ears, but decreased in the stalk in 2014. In 2015, the rate increased in leaves and the stalk, but decreased significantly in ears. The variation in the DMPR among sowing dates was very significant in the stalk and ears. As a whole, the pattern of changes in the DMPR in all of the three organs in 2018 was similar to that in 2014, with evident differences among sowing dates. At maturity, the differences of the stalk and ears’ DMPRs relative to those in 2012 gradually increased with the sowing dates in 2014, indicating that the response to drought varied with the sowing date. Specifically, during drought, early sowing promoted DMA in ears, whereas late sowing inhibited it. In 2015, the DMPR of the ears increased from the milk stage to maturity, although the rates were still lower than those in 2012. However, the DMPR of the ears varied greatly among the sowing dates, suggesting that severe drought had significantly inhibited DMA in ears. Furthermore, in 2018, the patterns of DMP in the three organs closely matched those seen in 2012. These results indicate that mild drought promotes DMA in ears in the early stages [54], whereas severe drought inhibits DMA in ears and promotes DMPRs in the stalk and leaves. These inferences are consistent with the results obtained by in summer maize [55]. In addition, these results show that different degrees of drought have a greater impact on the pattern of DMP in different organs. Such partitioning not only includes changes in the distribution of photosynthates but also reflects the changes in the process of the redistribution of DM between organs: a mild drought accelerates the redistribution of DM from the stalk to ears [56], whereas a severe drought inhibits such redistribution [16]. Specifically, the more severe the drought, the smaller the DMPR in ears and the stronger the inhibition of the transfer of SDM to EDM. Notably, drought and high temperatures decreased AGDM, but had only a limited effect on DMP among organs.

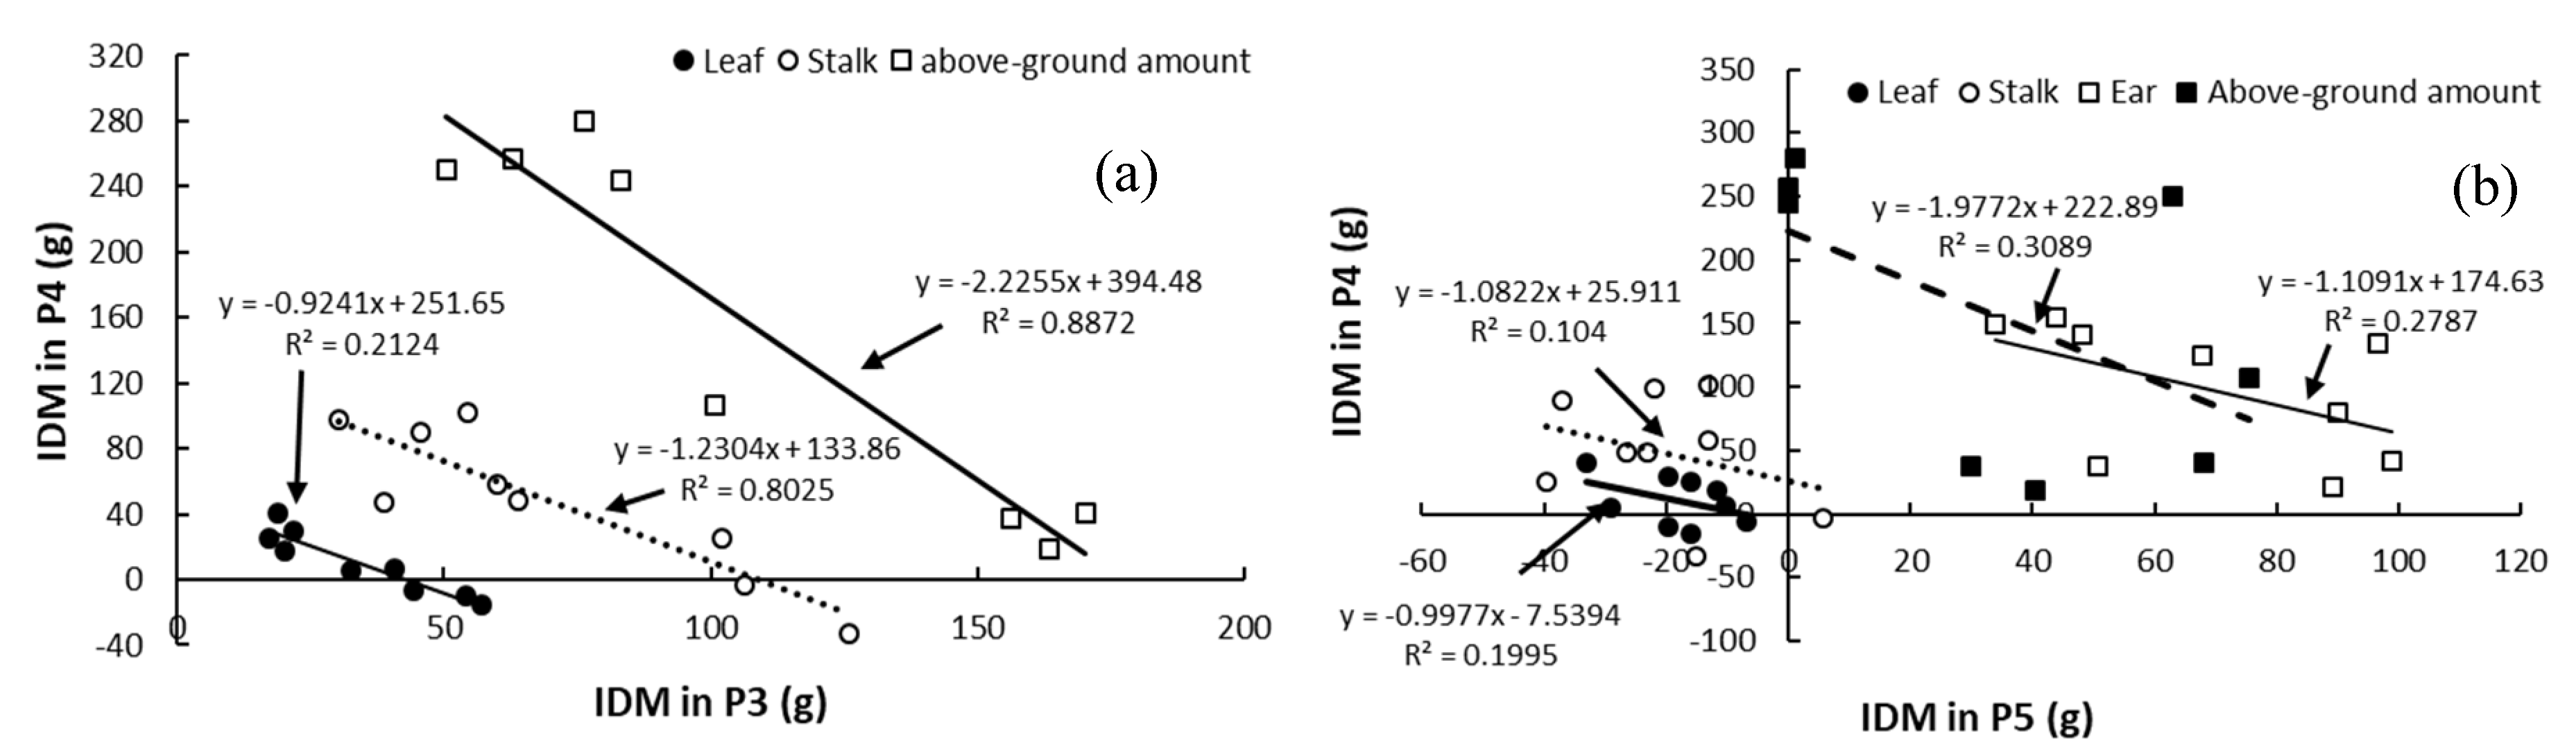
4.5. Relationships of Magnitude of Increase in Dry Matter of Above-Ground Organs between Development Stages

The magnitudes of IDM in different organs and total above-ground biomass were significantly and negatively correlated between the stages of development of maize, and the relationships between P3 and P4 were more significant than those between P4 and P5. Among the three organs, the negative correlation in the IDM of the stalk was stronger than that in the IDM of leaves. These correlations show that the DMA of different above-ground organs of maize between two consecutive development periods before and after reproductive growth has marked complementary effects. In other words, if such accumulation during one stage is less than normal, that loss will be made up during the next stage, which can be testified through the compensatory effect of maize leaf photosynthesis to rewatering after drought [4,57]; likewise, if the accumulation happens to be greater than normal, that gain will be offset by lower accumulation during the next stage. However, if the later stage is exposed to severe drought, such a compensating mechanism may be inhibited and the above-mentioned correlation will be weaker.

5. Conclusions

The present research examined the impact of drought on DMA and DMP in three above-ground organs of maize, namely leaves, the stalk, and ears, through field experiments conducted during a year with normal precipitation and during three years with varying degrees of drought. Each year, sowing was staggered to ensure that different growth stages of maize encounter different weather conditions. The salient conclusions of the research are as follows:
  • The degree of drought, corresponding closely to soil moisture and clearly reflecting the progressive accumulation of drought, is negatively correlated to AGDM, SDM, and EDM. The phenology of maize was more closely related to the sowing date than to drought.
  • Under drought conditions, DMA is especially sensitive to total precipitation during the developmental period: under a severe drought, AGDM and dry matters in different organs are impacted earlier and decrease to a greater extent, with wider differences among the sowing dates compared to those under a mild drought.
  • A mild drought promoted the transfer of SDM into the ears at the milk stage, whereas it promoted DMA in the early-sown crop, but inhibited it in the late-sown crop at maturity. A severe drought inhibited DMA of the ears at both the stages, especially for the milk stage, and dramatically varied the pattern of DMP as well as increased the difference of the patterns among the sowing dates.
  • There are negative correlations for the IDMs in different organs between P3 and P4, and between P4 and P5, proving the complementary effect of the DMA in different organs between the two adjacent developmental stages.
  • High temperatures and drought have a synergistic and larger effect on DMA than that of drought alone, and lower DMAs in all the organs, but have only a limited impact on the DMP pattern.

Author Contributions

F.C. and Y.Z. conceived and designed the experiments; H.Z., X.Z. and B.Z. performed the experiments; N.M., H.M. and S.Z. analyzed the data; F.C. drafted the manuscript. All authors have read and agreed to the published version of the manuscript.

Funding

This study was funded by the National Natural Science Foundation of China (Grant Nos. 41775110 and 41975149), the LiaoNing Revitalization Talents program (Grant No. XLYC1807262), the Provincial Key R&D Project of Department of Science and Technology of Liaoning Province (2019JH2/10200018), and the Liaoning Provincial Key R&D Guidance Plan (2019JH8/10200022).

Institutional Review Board Statement

Not applicable.

Informed Consent Statement

Not applicable.

Conflicts of Interest

The authors declare no conflict of interest.

References

  1. Hussain, M.; Farooq, S.; Hasan, W.; Ul-Allah, S.; Tanveer, M.; Farooq, M.; Nawaz, A. Drought stress in sunflower: Physiological effects and its management through breeding and agronomic alternatives. Agric. Water Manag. 2018, 201, 152–166. [Google Scholar] [CrossRef]
  2. Li, Y.B.; Song, H.; Zhou, L.; Xu, Z.Z.; Zhou, G.S. Vertical distributions of chlorophyll and nitrogen and their associations with photosynthesis under drought and rewatering regimes in a maize field. Agric. For. Meteorol. 2019, 272–273, 40–54. [Google Scholar] [CrossRef]
  3. Xu, K.; Zhu, X.F.; Liu, Y.; Guo, R.; Chen, L.Y. Effects of drought on maize yield under climate change in China. Trans. Chin. Soc. Agric. Mach. 2020, 36, 149–158. [Google Scholar]
  4. Cai, F.; Zhang, Y.S.; Mi, N.; Ming, H.Q.; Zhang, S.J.; Zhang, H.; Zhao, X.L.; Zhao, X.L. Maize (Zea mays L.) physiological responses to drought and rewatering, and the associations with water stress degree. Agric. Water Manag. 2020, 241, 106379. [Google Scholar] [CrossRef]
  5. Gao, J.; Zhang, R.H.; Wang, W.B.; Li, Z.W.; Xue, J.Q.; Aamp, N. Effects of drought stress on performance of photosystem Ⅱ in maize seedling stage. Chin. J. Appl. Ecol. 2015, 26, 1391–1396. [Google Scholar]
  6. Djaman, K.; Irmak, S.; Rathje, W.R.; Martin, D.L.; Eisenhauer, D.E. Maize Evapotranspiration, Yield Production Functions, Biomass, Grain Yield, Harvest Index, and Yield Response Factors under Full and Limited Irrigation. Trans. ASABE 2013, 56, 373–393. [Google Scholar] [CrossRef]
  7. Andrews, M.; Raven, J.A.; Sprent, J.I. Environmental effects on dry matter partitioning between shoot and root of crop plants: Relations with growth and shoot protein concentration. Ann. Appl. Biol. 2001, 138, 57–68. [Google Scholar] [CrossRef]
  8. Marcelis, L.F.M.; Heuvelink, E. Concepts of modelling carbon allocation among plant organs. In Functional-Structural Plant Modelling in Crop Production; Vos, J., Marcelis, L.F.M., de Visser, P.H.B., Struik, P.C., Evers, J.B., Eds.; Springer: Cham, The Netherlands, 2007; pp. 103–111. [Google Scholar]
  9. Poorter, H.; Niklas, K.J.; Reich, P.B.; Oleksyn, J.; Poot, P.; Mommer, L. Biomass allocation to leaves, stems and roots: Meta-analyses of interspecific variation and environmental control. New Phytol. 2012, 193, 30–50. [Google Scholar] [CrossRef] [PubMed]
  10. Fan, J.W.; Wang, K.; Harris, W.; Zhong, H.P.; Hu, Z.M.; Han, B.; Zhang, W.Y.; Wang, J.B. Allocation of vegetation biomass across a climate-related gradient in the grasslands of Inner Mongolia. J. Arid Environ. 2009, 73, 521–528. [Google Scholar] [CrossRef]
  11. Berendse, F.; Möller, F. Effects of competition on root-shoot allocation in Plantago lanceolata L.: Adaptive plasticity or ontogenetic drift? Plant Ecol. 2009, 201, 567–573. [Google Scholar] [CrossRef] [Green Version]
  12. Schenk, H.J. Root competition: Beyond resource depletion. J. Ecol. 2006, 94, 725–739. [Google Scholar] [CrossRef]
  13. Weiner, J.; Campbell, L.G.; Pino, J.; Echarte, L. The allometry of reproduction within plant populations. J. Ecol. 2009, 97, 1220–1233. [Google Scholar] [CrossRef]
  14. Bonato, O.; Schulthess, I.F.; Baumgartner, J. Simulation model for maize crop growth based on acquisition and allocation processes for carbohydrate and nitrogen. Ecol. Model. 1999, 124, 11–28. [Google Scholar] [CrossRef]
  15. Penning de Vries, F.W.T.; Jansen, D.M.; Ten Berge, H.F.M.; Bakema, A. Simulation of Ecophysiological Processes of Growth in Several Annual Crops; Simulation Monographs; PUDOC: Wageningen, The Netherlands, 1989; p. 271. [Google Scholar]
  16. Yang, J.C.; Zhang, J.H. Grain filling of cereals under soil drying. New Phytol. 2006, 169, 223–236. [Google Scholar] [CrossRef]
  17. Araya, A.; Keesstra, S.D.; Stroosnijder, L. Simulating yield response to water of Teff (Eragrostis tef) with FAO’s AquaCrop model. Field Crops Res. 2010, 116, 196–204. [Google Scholar] [CrossRef]
  18. Steduto, P.; Hsiao, T.C.; Raes, D.; Fereres, E. AquaCrop: The FAO crop model to simulate yield response to Water: I. Concepts and underlying principles. Agron. J. 2009, 101, 426–437. [Google Scholar] [CrossRef] [Green Version]
  19. Toumi, J.; Er-Raki, S.; Ezzahar, J.; Khabba, S. Performance assessment of AquaCrop model for estimating evapotranspiration, soil water content and grain yield of winter wheat in Tensift Al Haouz (Morocco): Application to irrigation management. Agric. Water Manag. 2016, 163, 219–235. [Google Scholar] [CrossRef]
  20. Hoogenboom, G.; Porter, C.H.; Shelia, V.; Boote, K.J.; Singh, U.; White, J.W.; Hunt, L.A.; Ogoshi, R.; Lizaso, J.I.; Koo, J.S.; et al. Decision Support System for Agrotechnology Transfer (DSSAT), Version 4.7.5; DSSAT Foundation: Gainesville, FL, USA, 2019; Available online: https://DSSAT.net (accessed on 1 January 2022).
  21. Hijmans, R.J.; Guiking-lens, I.M.; Van Diepen, C.A. WOFOST, User Guide for the WOFOST 6.0 Crop Growth Simulation Model; Technical Document; DLO Win and Staring Centre: Wageningen, The Netherlands, 1994. [Google Scholar]
  22. Cavero, J.; Farre, I.; Debaeke, P.; Faci, J.M. Simulation of Maize Yield under Water Stress with the EPICphase and CROPWAT Models. Agron. J. 2000, 92, 679–690. [Google Scholar] [CrossRef]
  23. Mi, N.; Zhang, Y.S.; Ji, R.P.; Cai, F.; Yu, W.Y.; Zhang, S.J. Analysis on optimum sowing date of maize in Jinzhou using crop growth model and optimum season method. Chin. J. Agrometeorol. 2016, 37, 67–75. [Google Scholar]
  24. Anothai, J.; Soler, C.M.T.; Green, A. Evaluation of two evapotranspiration approaches simulated with the CSM–CERES–Maize model under different irrigation strategies and the impact on maize growth, development and soil moisture content for semi-arid conditions. Agric. For. Meteorol. 2013, 176, 64–76. [Google Scholar] [CrossRef]
  25. Balemi, T.; Kebede, M.; Golla, B.; Tufa, T.; Chala, G.; Abera, T. Phenological and grain yield response of hybrid maize varieties, released for differing agro-ecologies, to growing temperatures and planting dates in Ethiopia. Afr. J. Agric. Res. 2020, 16, 1730–1739. [Google Scholar]
  26. Zhang, Z.X.; Yu, K.L.; Jin, X.L.; Nan, Z.B.; Wang, J.F.; Niu, X.L.; Whish, J.P.M.; Bell, L.W.; Siddique, K.H.M. Above- and belowground dry matter partitioning of four warm-season annual crops sown on different dates in a semiarid region. Eur. J. Agron. 2019, 109, 125918. [Google Scholar] [CrossRef]
  27. Bonelli, L.E.; Monzon, J.P.; Cerrudo, A.; Rizzalli, R.H. Maize grain yield components and source-sink relationship as affected by the delay in sowing date. Field Crops Res. 2016, 198, 215–225. [Google Scholar] [CrossRef]
  28. Mi, N.; Cai, F.; Zhang, Y.S.; Ji, R.P.; Yu, W.Y.; Zhang, S.J.; Fang, Y. Effects of continuous drought during different growth stages on maize and its quantitative relationship with yield loss. Chin. J. Appl. Ecol. 2017, 28, 1563–1570. [Google Scholar]
  29. Mi, N.; Cai, F.; Zhang, Y.S.; Ji, R.P.; Zhang, S.J.; Wang, Y. Differential responses of maize yield to drought at vegetative and reproductive stages. Plant Soil Environ. 2018, 64, 260–267. [Google Scholar]
  30. Ma, X.Y.; Zhou, G.S. Maize biomass simulation based on dynamic photosynthate allocation. Chin. J. Appl. Ecol. 2016, 27, 2292–2300. [Google Scholar]
  31. FAO. Faostat. Verified. 3 March 2019. Available online: http://www.fao.org/faostat/en/#data (accessed on 1 January 2022).
  32. Cheng, Z.Q.; Meng, J.H.; Wang, Y.M. Improving Spring Maize Yield Estimation at Field Scale by Assimilating Time-Series HJ-1 CCD Data into the WOFOST Model Using a New Method with Fast Algorithms. Remote Sens. 2016, 8, 303. [Google Scholar] [CrossRef] [Green Version]
  33. Huang, S.; Wang, L.; Wang, H.; Huang, Q.; Leng, W.; Fang, W.; Zhang, Y. Spatio-temporal characteristics of drought structure across China using an integrated drought index. Agric. Water Manag. 2019, 218, 182–192. [Google Scholar] [CrossRef]
  34. Zhou, Z.; Shi, H.Y.; Fu, Q.; Li, T.X.; Gan, T.Y.; Liu, S.N. Assessing spatiotemporal characteristics of drought and its effects on climate-induced yield of maize in Northeast China. J. Hydrol. 2020, 588, 125097. [Google Scholar] [CrossRef]
  35. Mi, N.; Zhang, Y.S.; Cai, F.; Ji, R.P.; Zhang, S.J.; Chen, N.N. Higher yields of rain-fed maize affected by drought and sowing date in a semi-humid region of North-eastern China. Int. J. Agric. Biol. 2019, 22, 83–90. [Google Scholar]
  36. Cai, F.; Mi, N.; Ji, R.P.; Ming, H.Q.; Feng, R.; Zhang, S.J.; Zhang, H.; Zhao, X.L.; Zhang, Y.S. Determination of crop parameters for WOFOST model and its performance evaluation based on field experiment of spring maize in Jinzhou, Liaoning. Chin. J. Ecol. 2019, 38, 1238–1248. [Google Scholar]
  37. Zargar, A.; Sadiq, R.; Naser, B.; Khan, F.I. A review of drought indices. Environ. Rev. 2011, 19, 333–349. [Google Scholar] [CrossRef]
  38. Allen, R.G.; Pereira, L.S.; Raes, D.; Smith, M. Crop evapotranspiration. In Guideline for Computing Crop Water Requirements; FAO Irrigation and Drainage Papa 56; FAO: Rome, Italy, 1998. [Google Scholar]
  39. Ma, X.Y. The Occurrence and Development of Drought on Summer Maize and Its Quantitative Research; Chinese Academy of Meteorological Sciences: Beijing, China, 2017. [Google Scholar]
  40. Zhang, S.J.; Zhou, G.S.; Li, R.P. Daily crop coefficient of spring maize using eddy covariance observation and its actual evapotranspiration simulation. J. Appl. Meteorol. Sci. 2015, 26, 695–704. [Google Scholar]
  41. Cao, Y.Q.; Feng, X.X.; Li, L.H.; Lu, J. Temporal and spatial variation of spring corn in Liaoning Province under climate change. Acta Ecol. Sin. 2021, 41, 1092–1105. [Google Scholar]
  42. Song, H.; Li, Y.B.; Zhou, L.; Xu, Z.Z.; Zhou, G.S. Maize leaf functional responses to drought episode and rewatering. Agric. For. Meteorol. 2018, 249, 57–70. [Google Scholar] [CrossRef]
  43. Lizaso, J.I.; Ruiz-Ramos, M.; Rodríguez, L.; Gabaldon-Leal, C.; Oliveira, J.A.; Lorite, I.J.; Sánchez, D.; García, E.; Rodrígueza, A. Impact of high temperatures in maize: Phenology and yield components. Field Crops Res. 2018, 216, 129–140. [Google Scholar] [CrossRef] [Green Version]
  44. Nouri, M.; Homaee, M.; Bannayanc, M.; Hoogenboom, G. Towards shifting planting date as an adaptation practice for rainfed wheat response to climate change. Agric. Water Manag. 2017, 186, 108–119. [Google Scholar] [CrossRef]
  45. Baum, M.E.; Archontoulis, S.V.; Licht, M.A. Planting Date, Hybrid Maturity, and Weather Effects on Maize Yield and Crop Stage. Agron. J. 2019, 111, 303–313. [Google Scholar] [CrossRef] [Green Version]
  46. Kazan, K.; Lyons, R. The link between flowering time and stress tolerance. J. Exp. Bot. 2016, 67, 47–60. [Google Scholar] [CrossRef] [Green Version]
  47. Hu, M.X.; Zhou, G.S. Phenological change and its ecophysiological mechanism of spring maize responding to drought at jointing stage and rewatering. Acta Ecol. Sin. 2020, 40, 274–283. [Google Scholar]
  48. Fisher, M.; Abate, T.; Lunduka, R.W.; Asnake, W.; Alemayehu, Y.; Madulu, R.B. Drought tolerant maize for farmer adaptation to drought in sub-Saharan Africa: Determinants of adoption in eastern and southern Africa. Clim. Chang. 2015, 133, 283–299. [Google Scholar] [CrossRef] [Green Version]
  49. Seyoum, S.; Chauhanb, Y.; Rachaputia, R.; Fekybeluc, S.; Prasannad, B. Characterising production environments for maize in eastern and southern Africa using the APSIM Model. Agric. For. Meteorol. 2017, 247, 445–453. [Google Scholar] [CrossRef]
  50. Zhou, W.; Guan, K.; Peng, B.; Shi, J.; Jiang, C.; Wardlow, B.; Pan, M.; Kimball, J.S.; Franz, T.E.; Gentine, P.; et al. Connections between the hydrological cycle and crop yield in the rainfed U.S. Corn Belt. J. Hydrol. 2020, 590, 125398. [Google Scholar] [CrossRef]
  51. Ji, R.P.; Che, Y.S.; Zhu, Y.N.; Liang, T.; Feng, R.; Yu, W.Y.; Zhang, Y.S. Impacts of drought stress on the growth and development and grain yield of spring maize in Northeast China. Chin. J. Appl. Ecol. 2012, 23, 3021–3026. [Google Scholar]
  52. Lobell, D.B.; Hammer, G.L.; Chenu, K.; Zheng, B.; McLean, G.; Chapman, S.C. The shifting influence of drought and heat stress for crops in northeast Australia. Glob. Chang. Biol. 2015, 21, 4115–4127. [Google Scholar] [CrossRef]
  53. Maddonni, G.A. Analysis of the climatic constraints to maize production in the current agricultural region of Argentina—A probabilistic approach. Arch. Meteorol. Geophys. Bioclimatol. Ser. B 2012, 107, 325–345. [Google Scholar] [CrossRef]
  54. Yu, Z.Q.; Yu, W.W.; Tan, X.S.; Ye, B.X.; Bi, J.J. Effect of water stress on dry-matter partition of summer maize. Acta Agric. Boreali-Sin. 2009, 24, 149–154. [Google Scholar]
  55. Tan, F.Y.; Li, H.; Wang, J.L.; Wang, Z.W. Response of dry matter partitioning coefficient of summer maize to drought stress in North China. Chin. J. Appl. Ecol. 2019, 30, 217–223. [Google Scholar]
  56. Dang, H.K.; Li, W.; Cao, C.Y.; Zheng, C.L.; Ma, J.Y.; Li, K.J. Effects of late milk irrigation on water use efficiency and dry matter distribution of maize. Trans. Chin. Soc. Agric. Mach. 2014, 45, 131–138. [Google Scholar]
  57. Li, Y.B.; Song, H.; Zhou, L.; Xu, Z.Z.; Zhou, G.S. Tracking chlorophyll fluorescence as an indicator of drought and rewatering across the entire leaf lifespan in a maize field. Agric. Water Manag. 2018, 211, 190–201. [Google Scholar] [CrossRef]
Figure 1. Durations of different growth stages in maize sown on different dates.
Atmosphere 13 00677 g001
Figure 2. Meteorological conditions during different growth stages of maize sown on different dates: (a) AT, (b) Radiation, (c) Rain, and (d) MT.
Atmosphere 13 00677 g002
Figure 3. The start and end dates of each of the five growth stages of maize, soil relative water content, and degree of drought in maize sown on different dates: (a) 2012, (b) 2014, (c) 2015, (d) 2018. The main axis (the y axis) marks the growth stages, starting from 0 (sowing to emergence); the numbers 1 to 5 correspond to the growth stages P1 to P5. The number 6 is shown to ensure full display of figure content and has no meaning.
Atmosphere 13 00677 g003
Figure 4. AGDMs of maize at different stages of growth: (a) 2012, (b) 2014, (c) 2015, (d) 2018.
Atmosphere 13 00677 g004
Figure 5. LDMs at different growth stages of maize sown on different dates: (a) 2012, (b) 2014, (c) 2015, (d) 2018.
Atmosphere 13 00677 g005
Figure 6. SDMs at different growth stages of maize sown on different dates: (a) 2012, (b) 2014, (c) 2015, (d) 2018.
Atmosphere 13 00677 g006
Figure 7. Variations in EDM with development stages for different treatments in each year: (a) 2012, (b) 2014, (c) 2015, (d) 2018.
Atmosphere 13 00677 g007
Figure 8. Correlation between stage P4 and stage P3 (a), and that between stage P4 and stage P5 (b) in terms of the IDMs of different organs of maize.
Atmosphere 13 00677 g008
Figure 9. DMPRs at milk stage and at maturity in leaves, stalk, and ears of maize sown on different dates: (a) Milk, (b) Mature.
Atmosphere 13 00677 g009
Figure 10. Correlations between dry matter of leaves, stalk, or ears of maize and degree of drought at the milk stage and at maturity: (a) the relationship between Dd and AGDM, (b) the relationship at milk stage, (c) the relationship at maturity.
Atmosphere 13 00677 g010
Table 1. Abbreviations used to denote each parameter.
ParameterAbbreviation
Above-ground dry matter AGDM
The degree of drought Dd
Dry matterDM
Dry matter accumulationDMA
Dry matter partitioningDMP
Dry matter partitioning rateDMPR
Effective accumulated temperatureAT
Leaf, Stalk, Ear DMLDM, SDM, EDM
Increase in DMIDM
Increase in AGDMAGIDM
Mean temperatureMT
Soil relative water contentSRWC
Stages of growth: from emergence to 7-leaf stage, 7-leaf stage to jointing, jointing to tasselling, tasselling to milk stage, and milk stage to maturityP1, P2, P3, P4, P5
Publisher’s Note: MDPI stays neutral with regard to jurisdictional claims in published maps and institutional affiliations.

