
Evaluation of Warm-Season Rainfall Diurnal Variation over the Qilian Mountains in Northwest China in ERA5 Reanalysis


Abstract
:1. Introduction
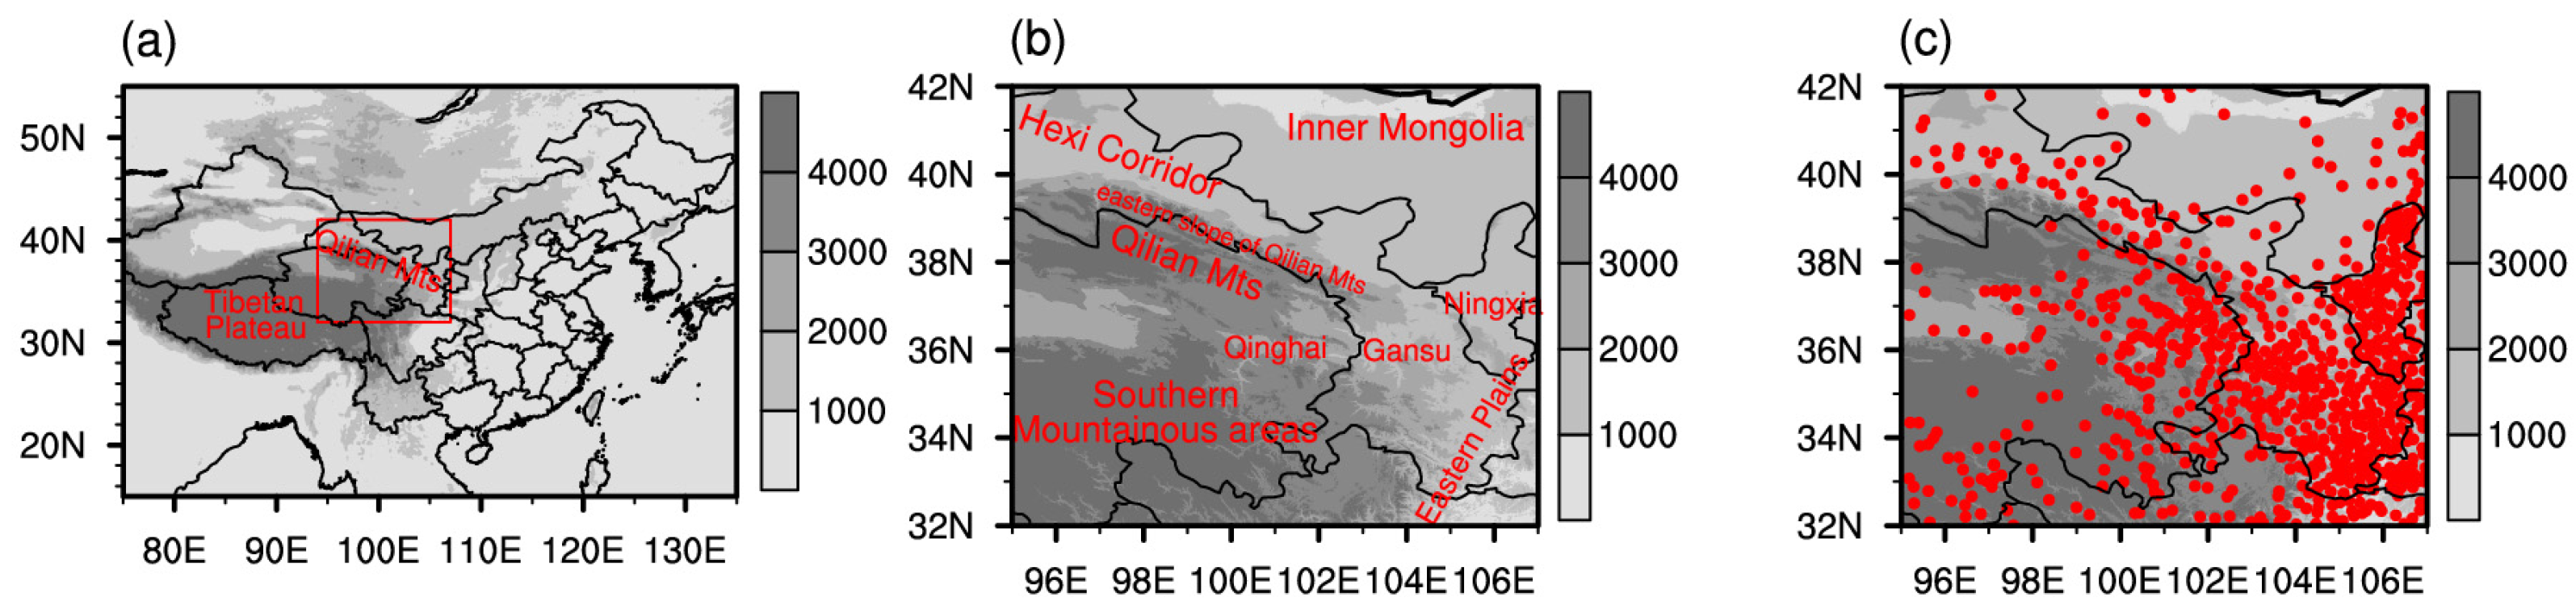
2. Data and Methods
3. Results
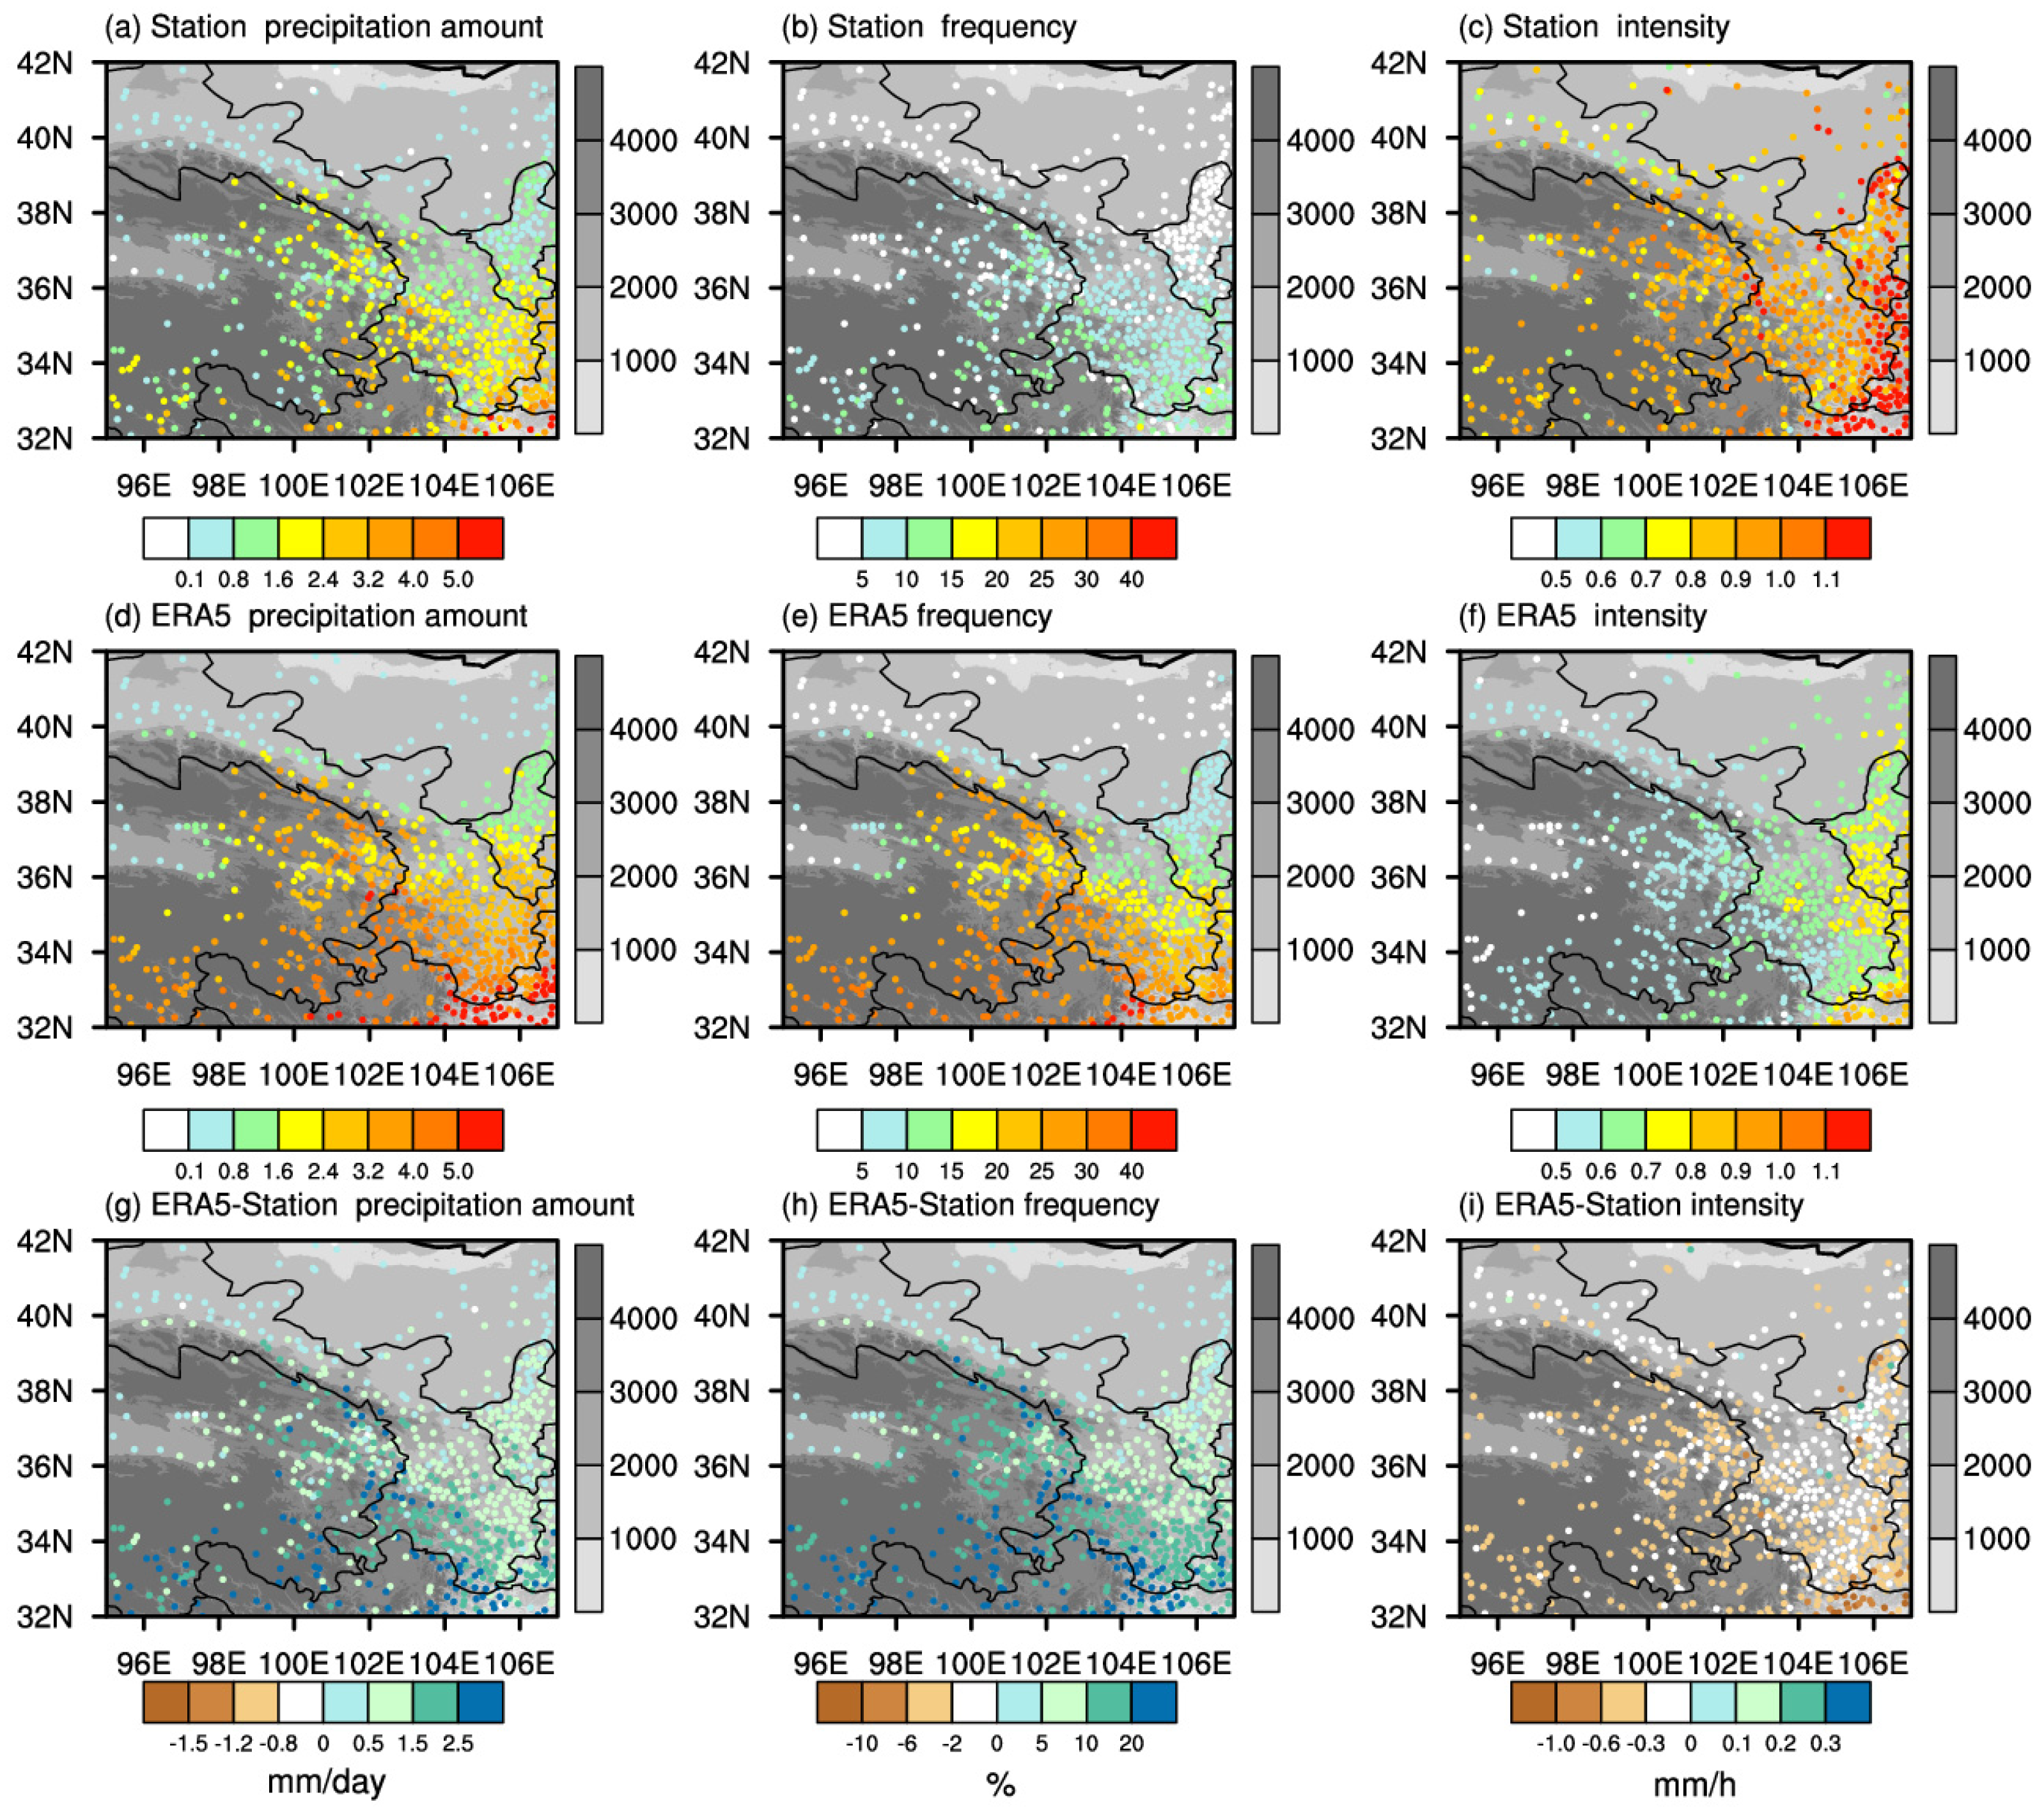
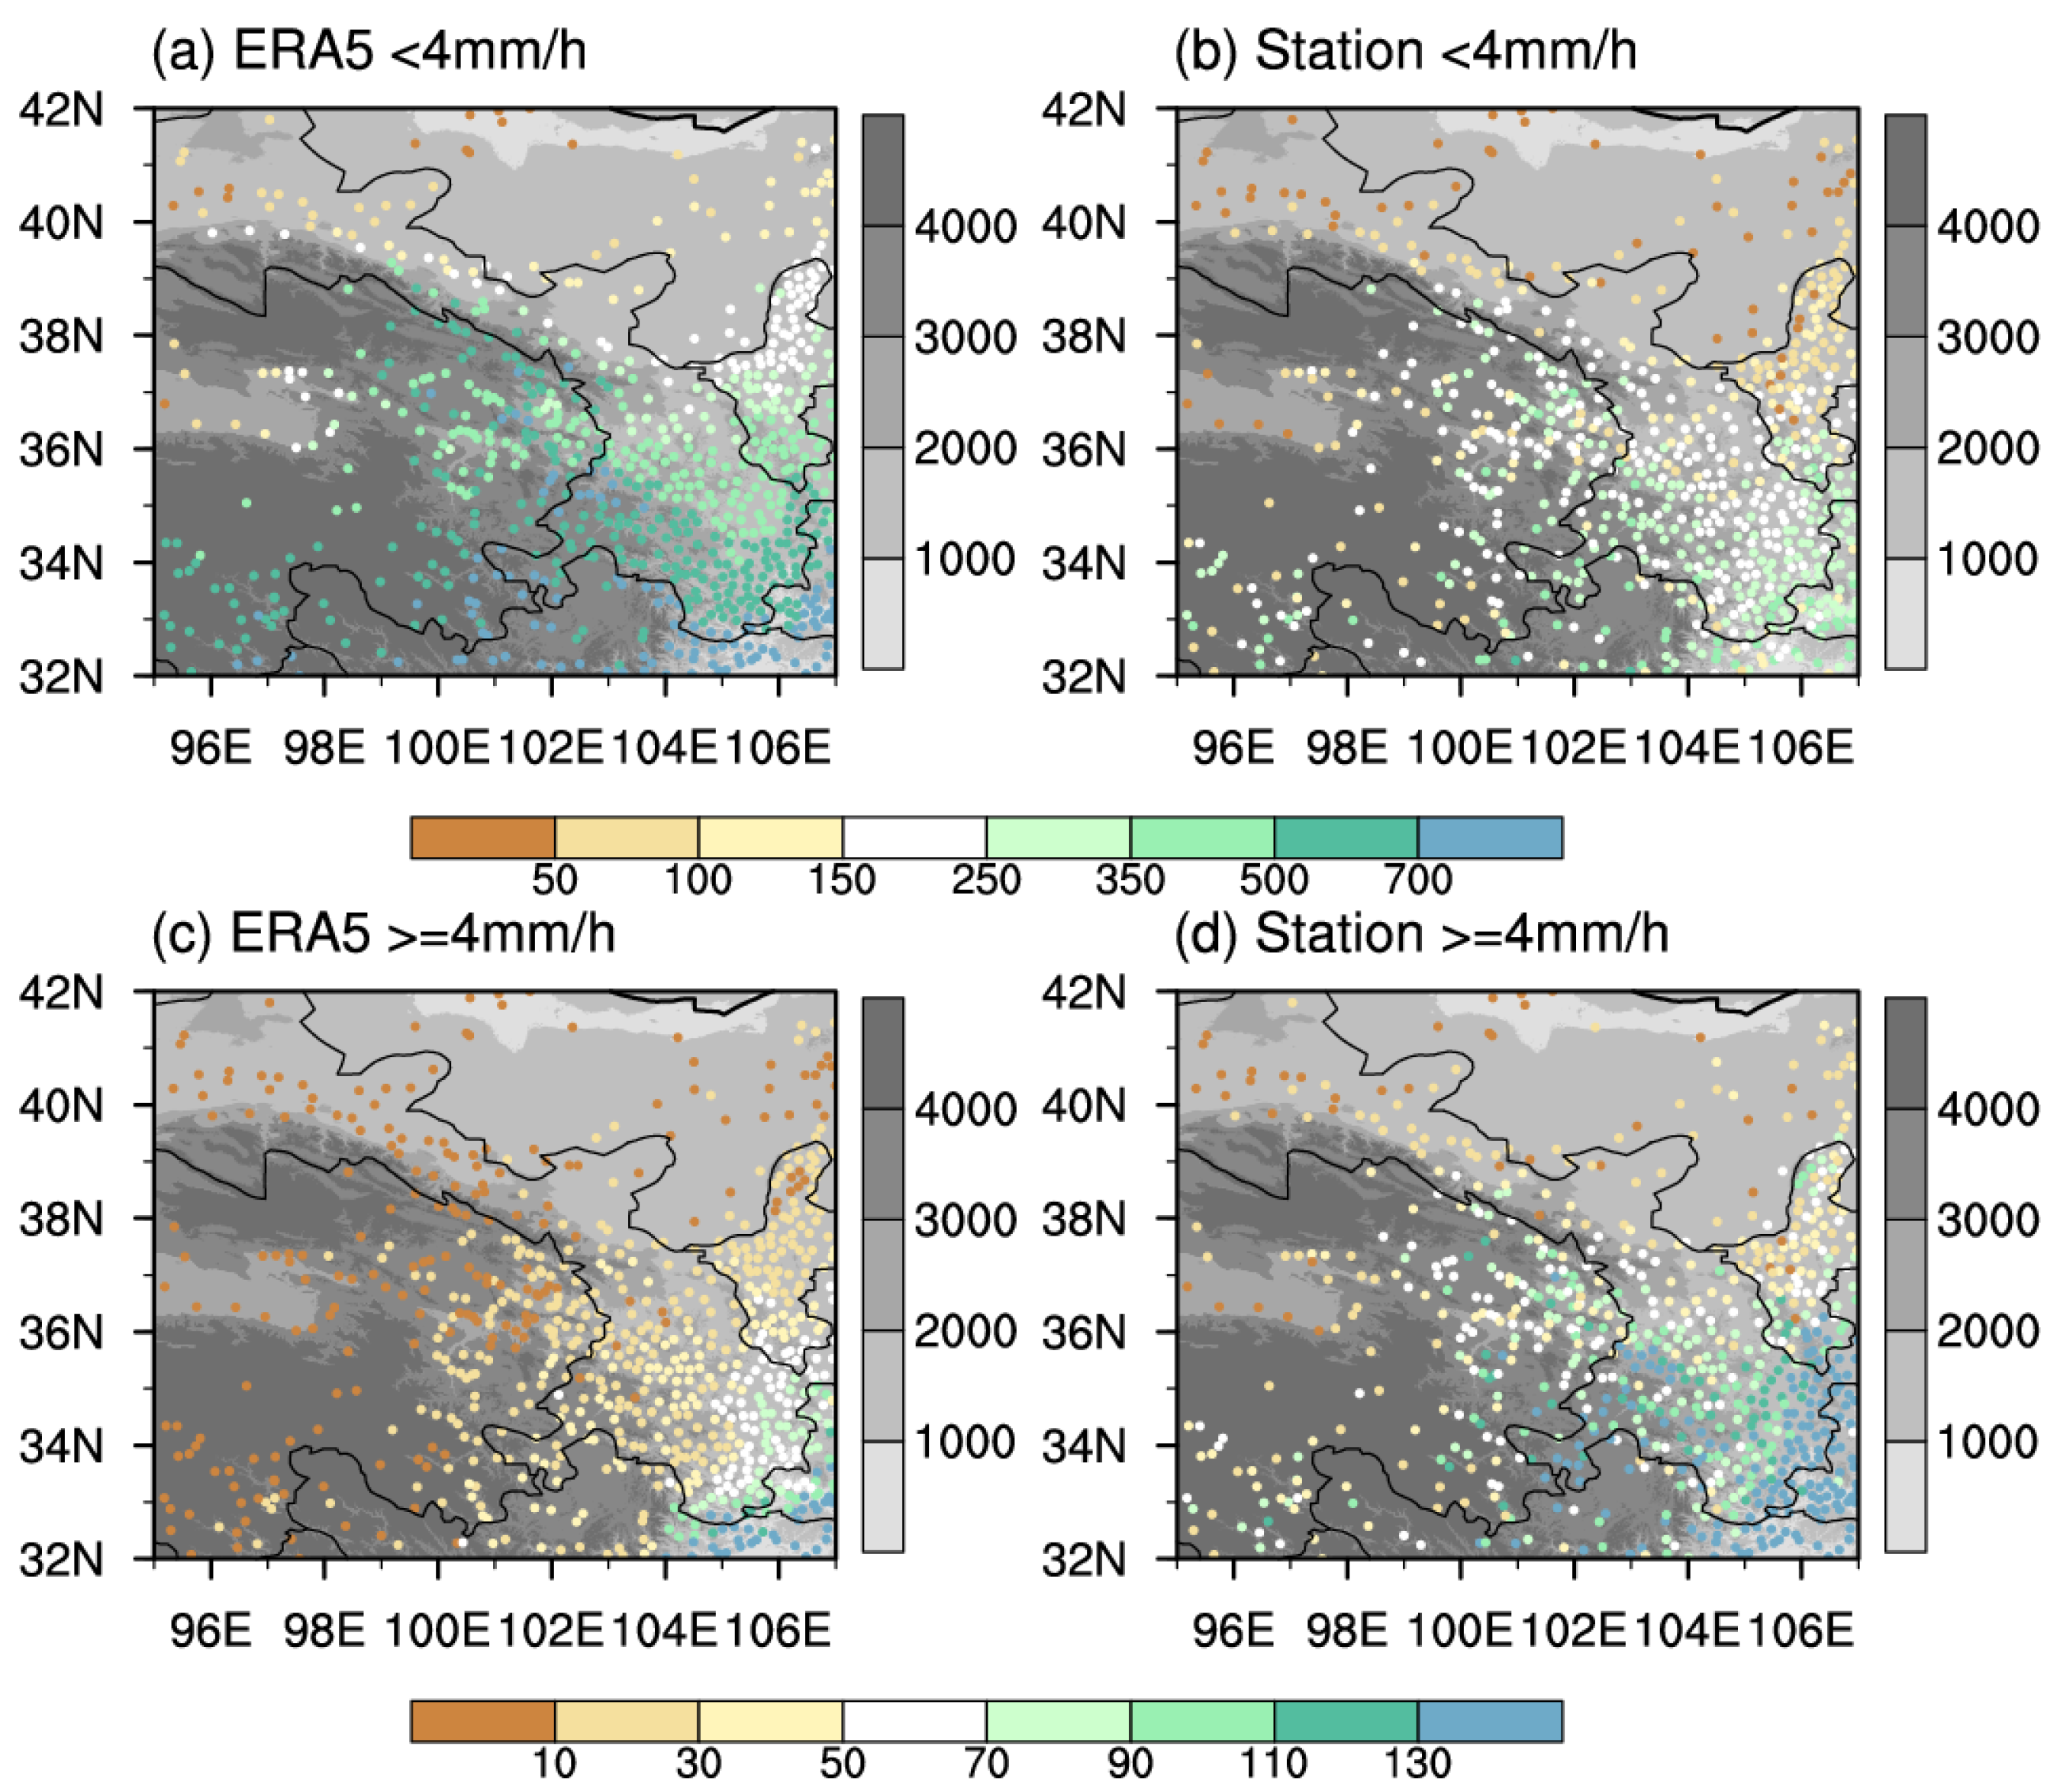
3.1. Mean Precipitation Amount, Frequency, and Intensity
3.2. Diurnal Variation
4. Discussion
5. Conclusions
- (1)
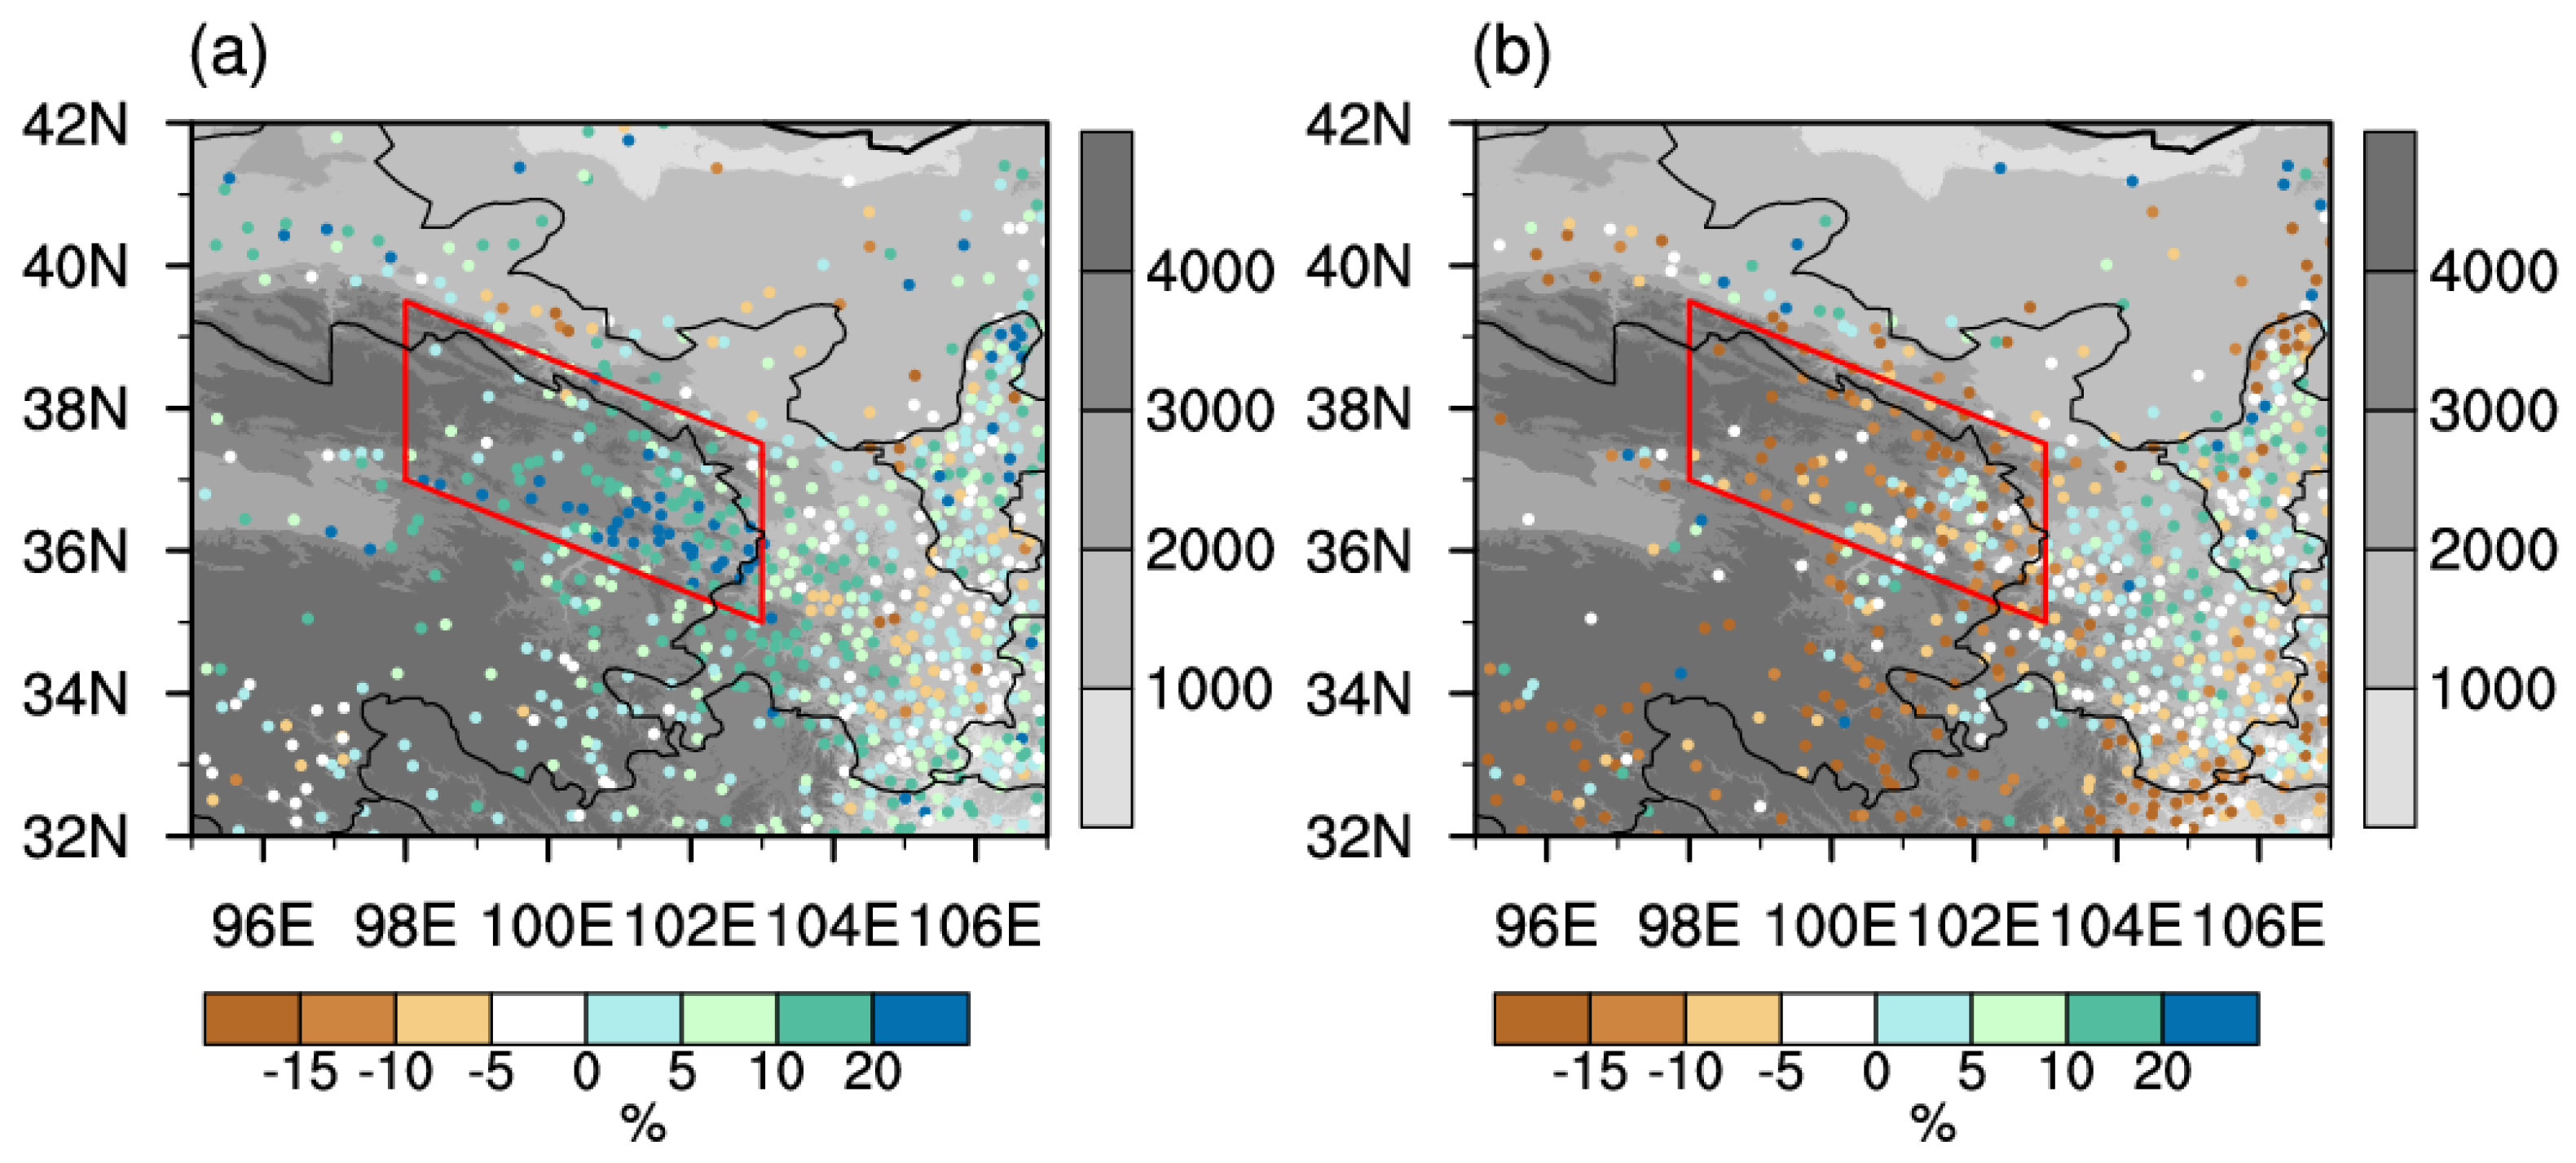
- Comparing hourly frequency and intensity showed that ERA5 overestimated precipitation amount and frequency, and underestimated intensity at most stations around the Qilian Mountains and its surrounding area. ERA5 underestimated heavy precipitation with intensity greater than 4 mm h−1, which was most evident over mountainous areas. Weaker precipitation with intensity smaller than 4 mm h−1 is generally overestimated.
- (2)
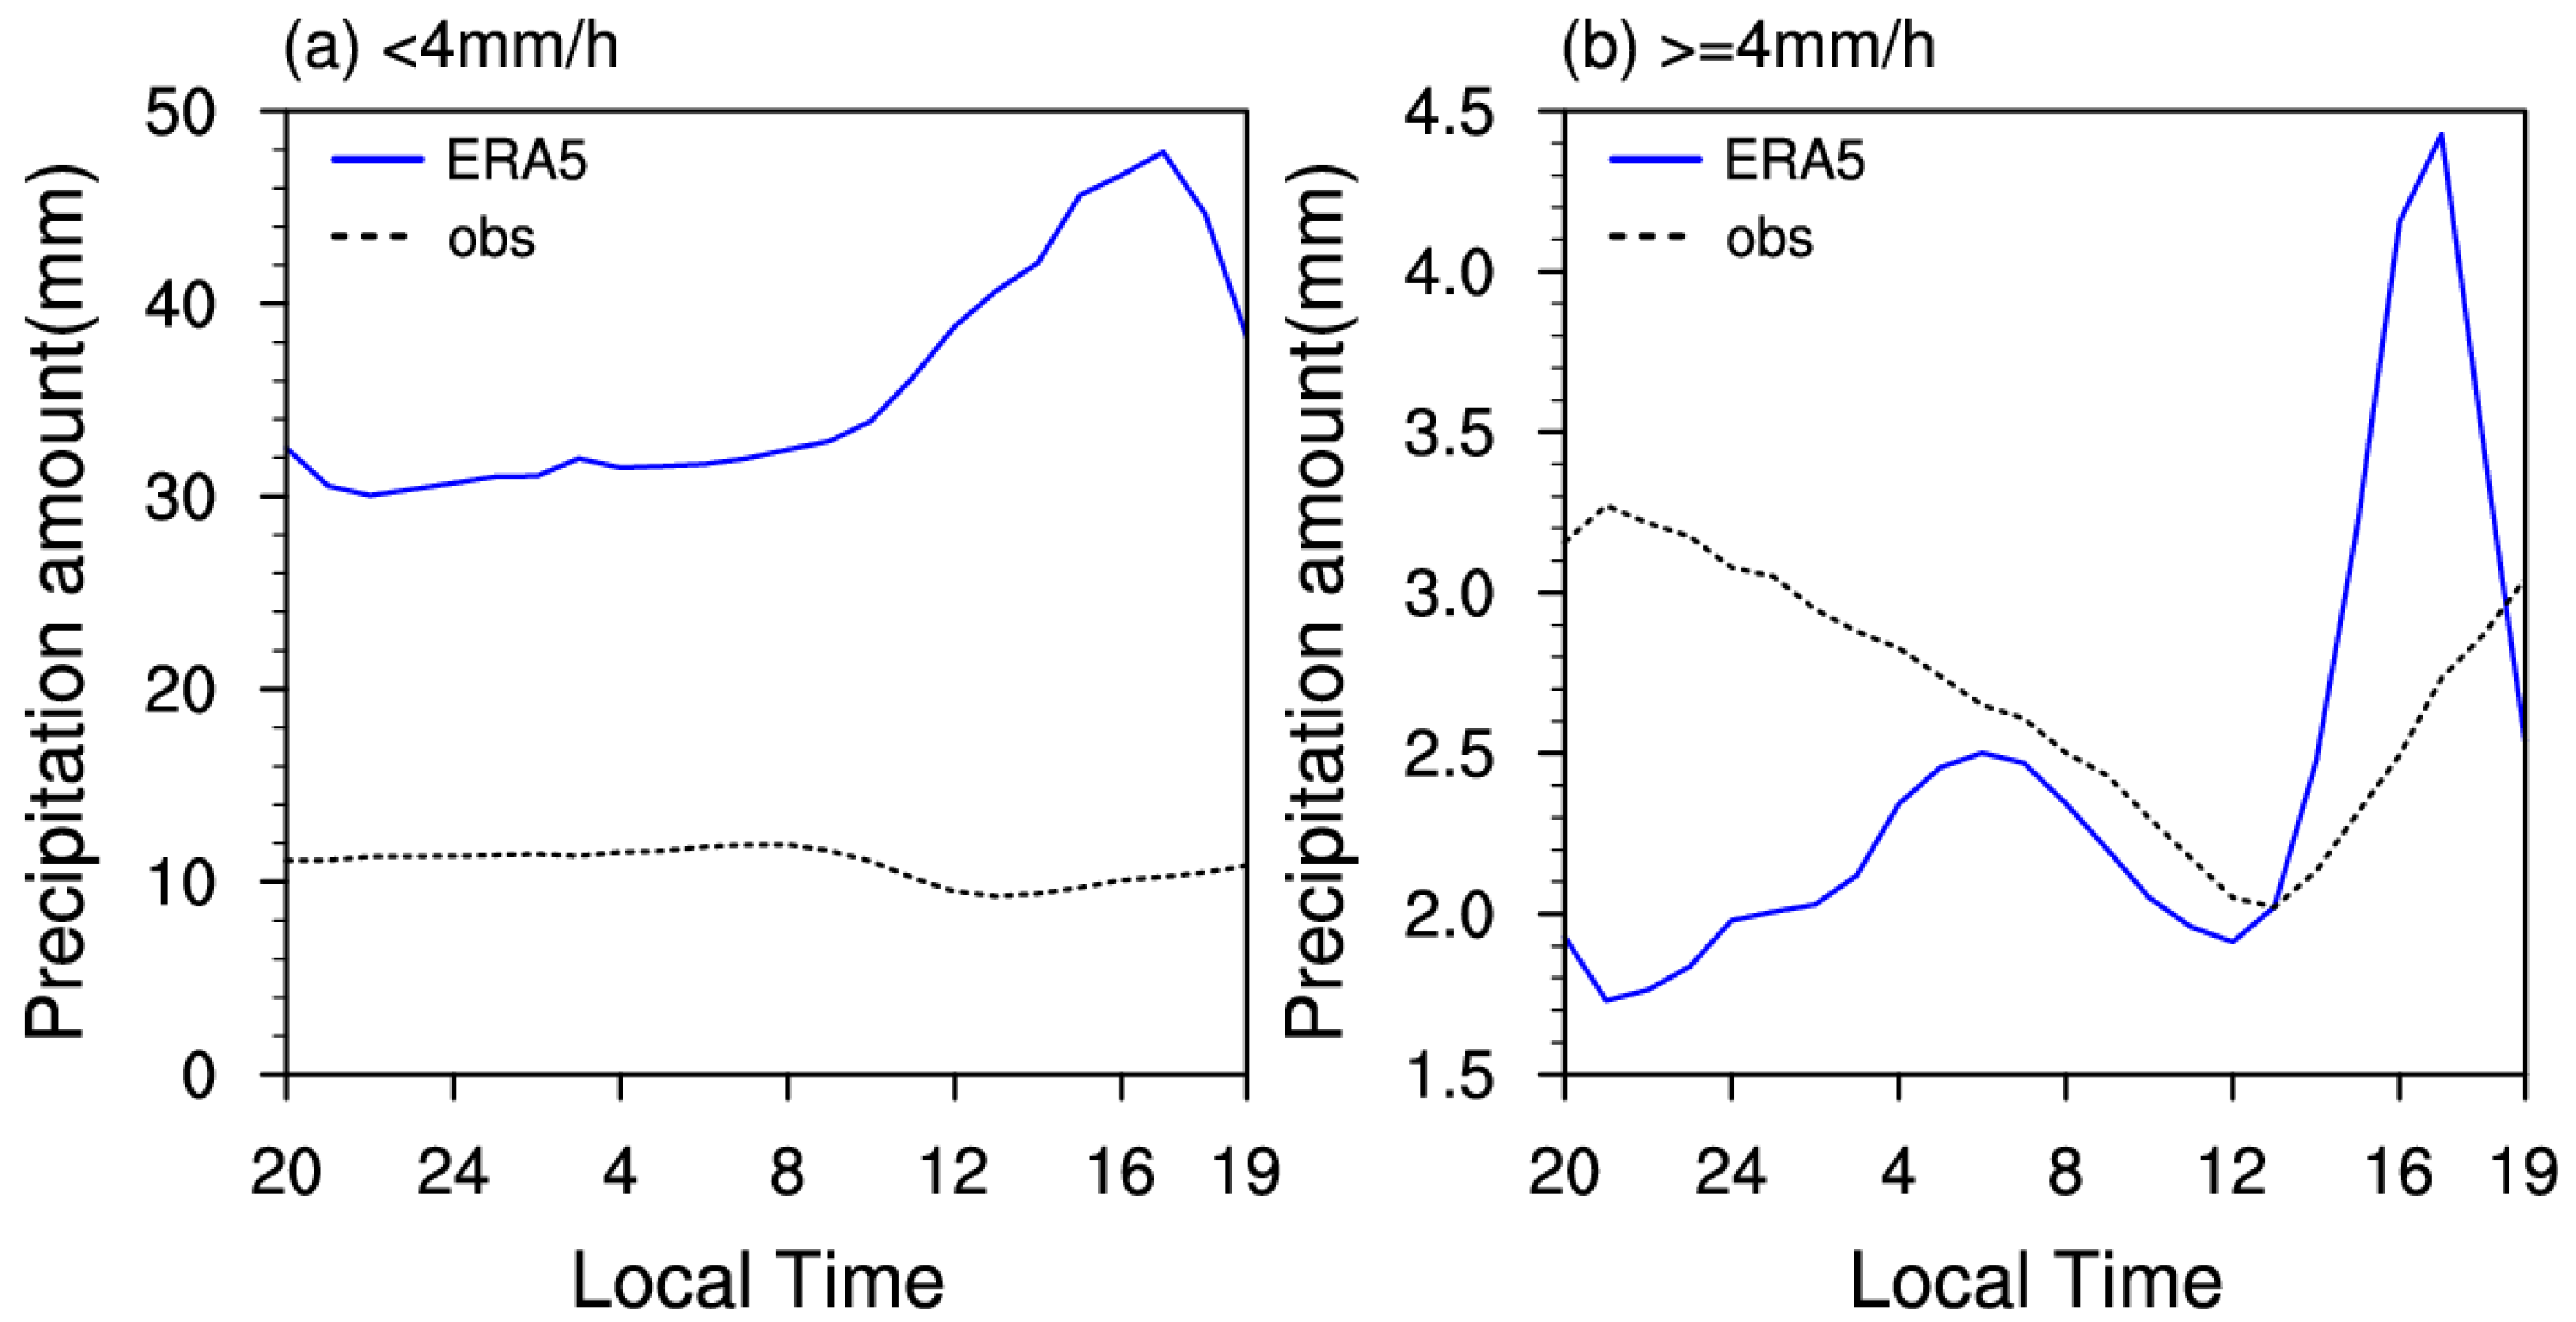
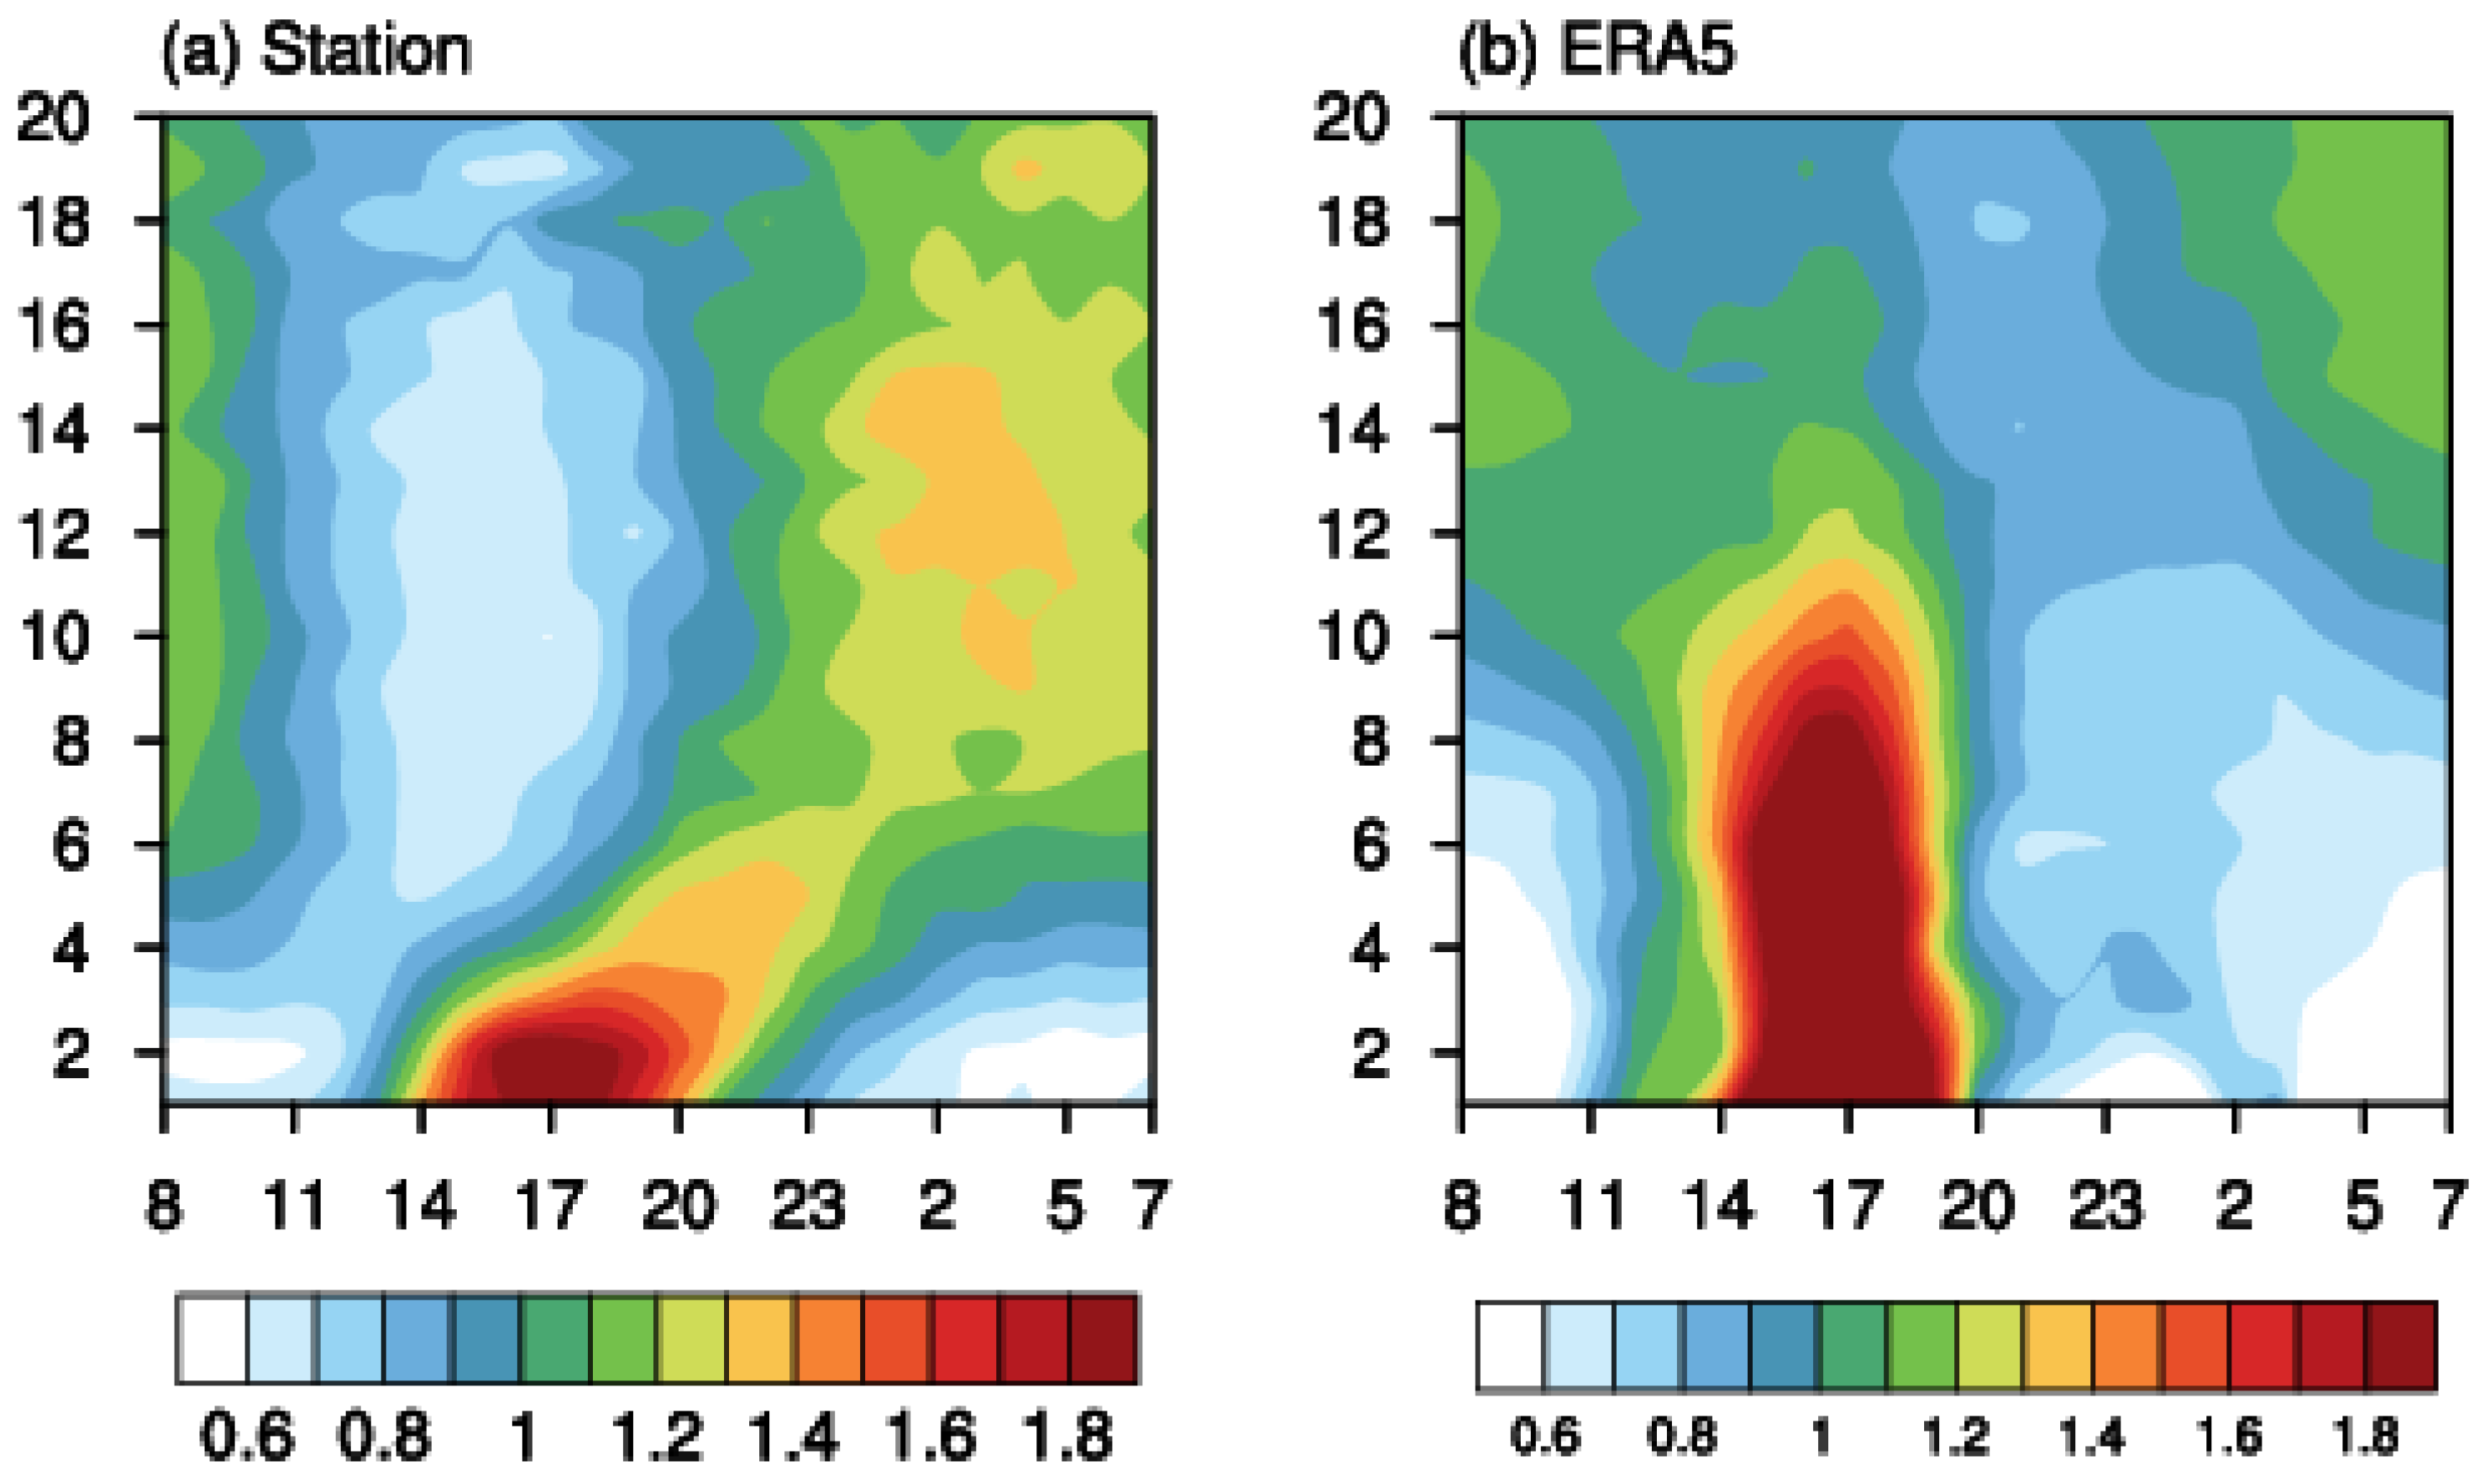
- ERA5 data showed large deviation in representing diurnal variation around the Qilian Mountains and their surroundings. For different intensities of rainfall, ERA5 basically reproduced a late-afternoon peak, while the nocturnal peak appeared in gauge observations, especially for weak rainfall. Investigating rainfall events with different durations showed that ERA5 reasonably represented the afternoon peak for events shorter than 4 h, but showed evident bias for longer events. The most evident deviation of both short and long events was located near the Qilian Mountains. The deviation of short afternoon (long nocturnal) rainfall events corresponded to precipitation frequency well.
- (3)
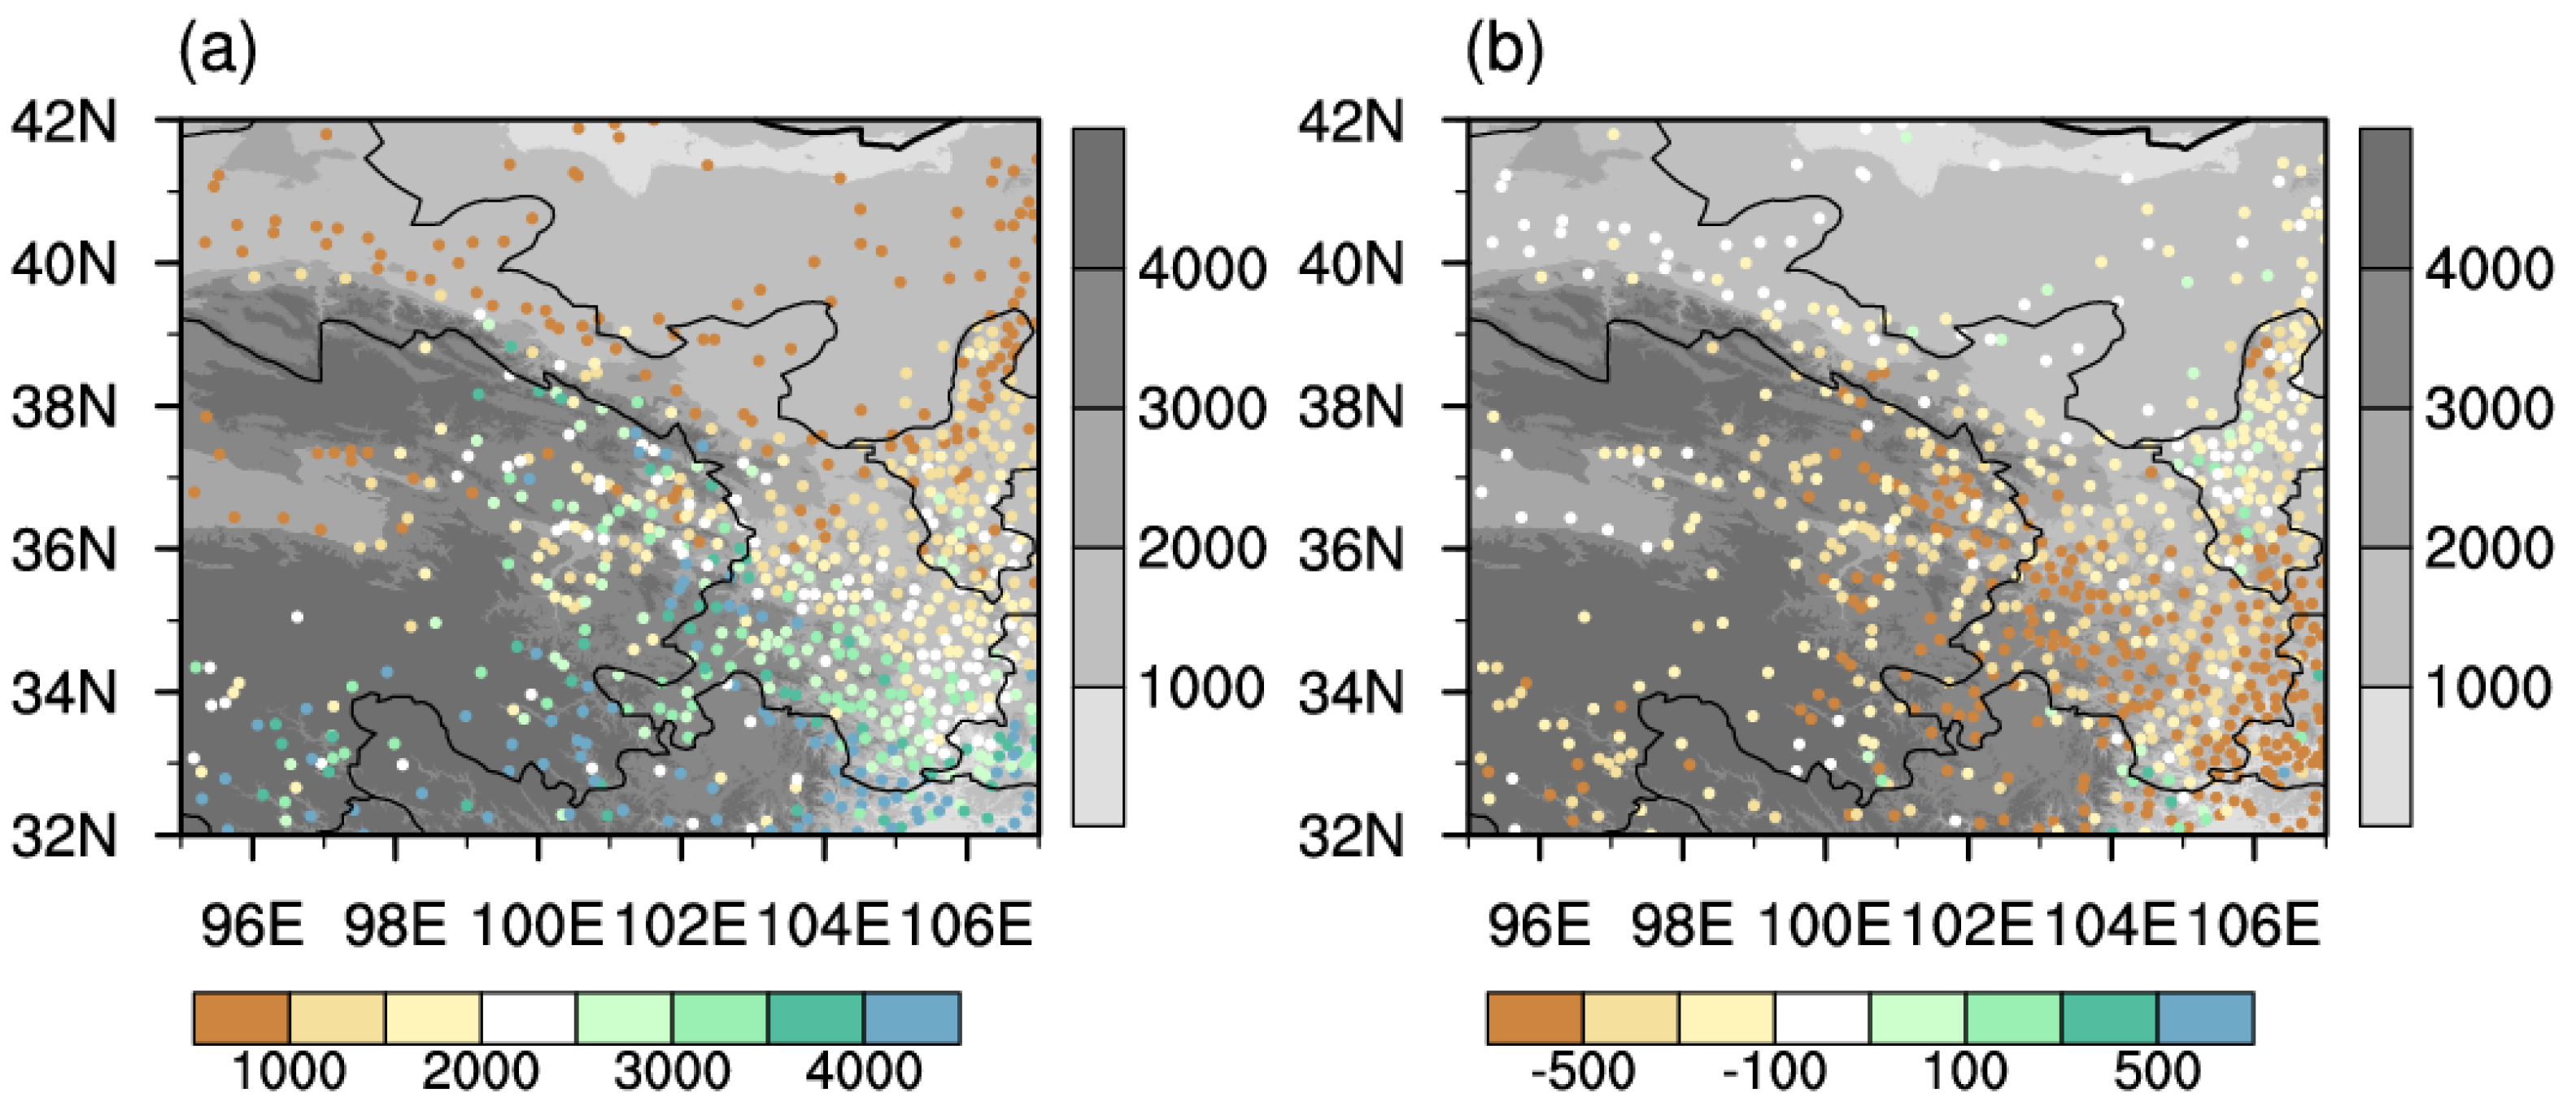
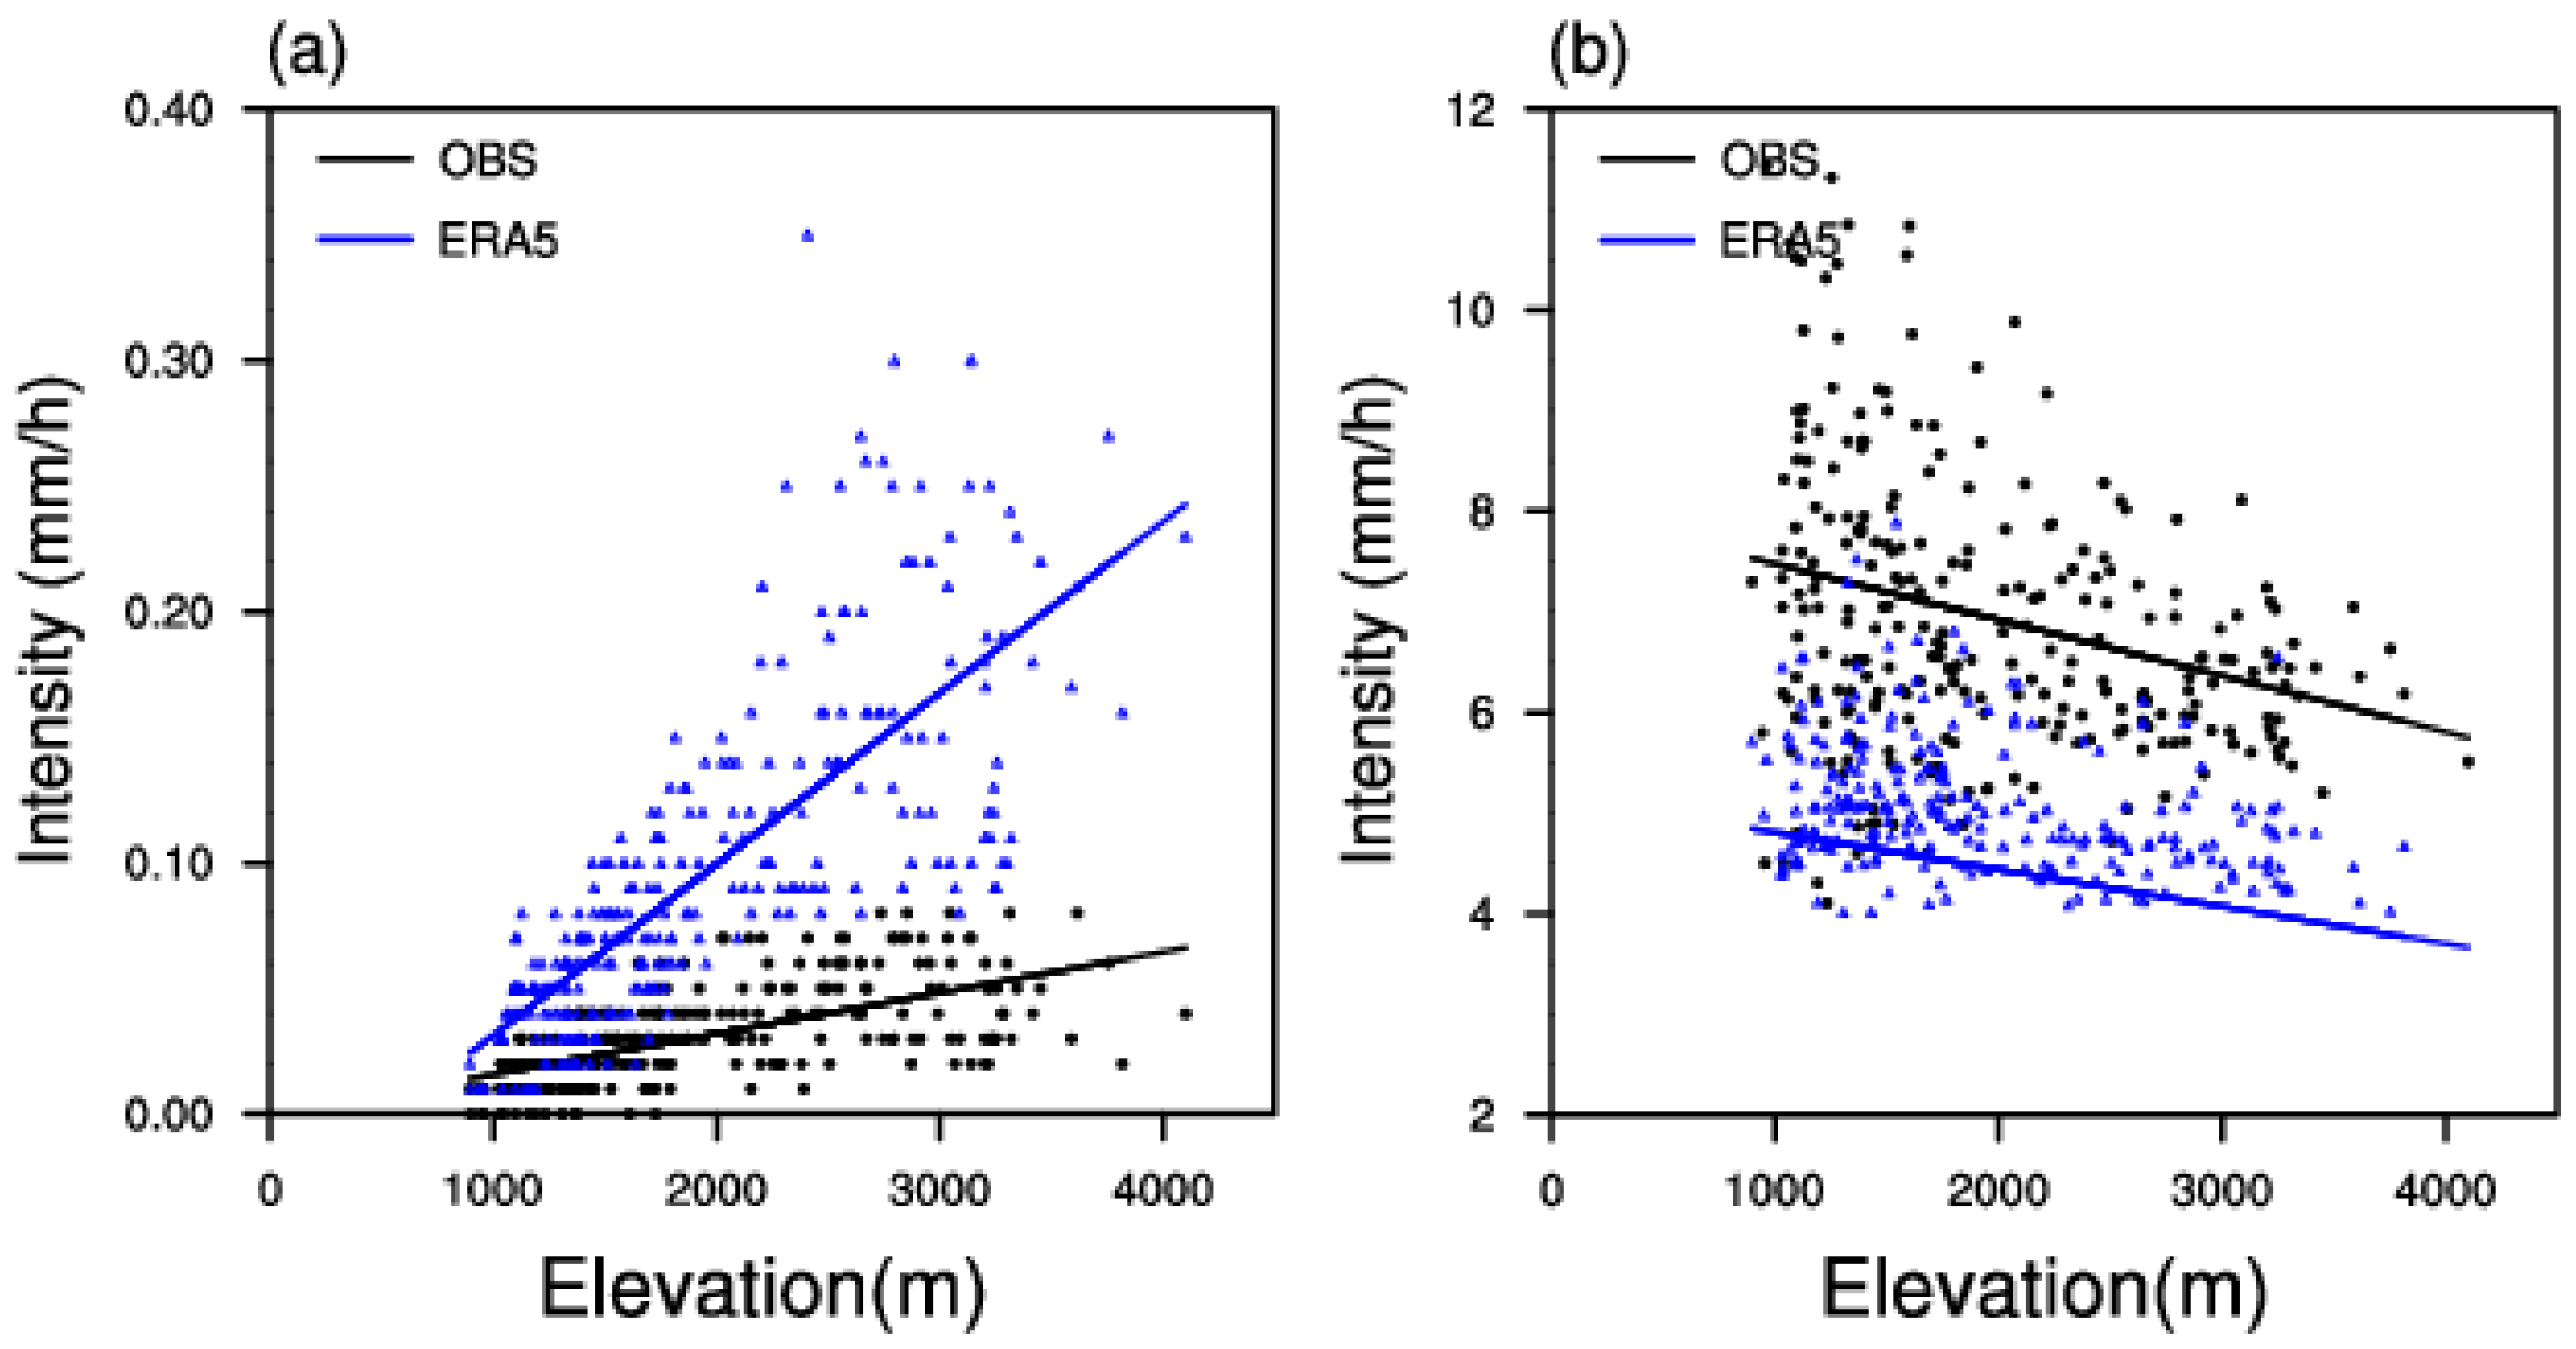
- The relationship between elevation and rainfall distribution indicated that variation in weak and heavy rainfall frequency with elevation could be reproduced in ERA5, while the trend of intensity was contrary to the observation. Deviation in weak afternoon (heavy nocturnal) rainfall intensity increased (decreased) with elevation. The bias of rainfall intensity with elevation may have been related to the distribution of surface-specific humidity with elevation.
Author Contributions
Funding
Institutional Review Board Statement
Informed Consent Statement
Data Availability Statement
Acknowledgments
Conflicts of Interest
References
- Trenberth, K.E.; Dai, A.; Rasmussen, R.M.; Parsons, D.B. The changing character of precipitation. Bull. Am. Meteorol. Soc. 2015, 84, 1205–1217. [Google Scholar] [CrossRef]
- Kidd, C.; Huffman, G. Global precipitation measurement. Meteorol. Appl. 2011, 18, 334–353. [Google Scholar] [CrossRef]
- Donat, M.G.; Lowry, A.L.; Alexander, L.V.; O’Gorman, P.A.; Maher, N. More extreme precipitation in the world’s dry and wet regions. Nat. Clim. Chang. 2016, 6, 508–513. [Google Scholar] [CrossRef]
- Tarek, M.; Brissette, F.P.; Arsenault, R. Evaluation of the ERA5 reanalysis as a potential reference dataset for hydrological modelling over North America. Hydrol. Earth Syst. Sci. 2020, 24, 2527–2544. [Google Scholar] [CrossRef]
- Zhang, L.; Li, X.; Cao, Y.; Nan, Z.; Wang, W.; Ge, Y.; Wang, P.; Yu, W. Evaluation and integration of the top-down and bottom-up satellite precipitation products over mainland China. J. Hydrol. 2020, 581, 124456. [Google Scholar] [CrossRef]
- Bosilovich, M.G.; Chen, J.Y.; Robertson, F.R.; Adler, R.F. Evaluation of global precipitation in reanalyses. J. Appl. Meteorol. Climatol. 2008, 47, 2279–2299. [Google Scholar] [CrossRef]
- Dee, D.P.; Balmaseda, M.; Balsamo, G.; Engelen, R.; Thepaut, J.N. Toward a consistent reanalysis of the climate system. Bull. Am. Meteorol. Soc. 2014, 95, 1235–1248. [Google Scholar] [CrossRef]
- Hersbach, H.; Bell, B.; Berrisford, P.; Hirahara, S.; Horanyi, A.; Muñoz-Sabater, J.; Nicolas, J.; Peubey, C.; Radu, R.; Schepers, D.; et al. The ERA5 global reanalysis. Q. J. R. Meteorol. Soc. 2020, 146, 1999–2049. [Google Scholar] [CrossRef]
- Beck, H.E.; Pan, M.; Roy, T.; Weedon, G.P.; Pappenberger, F. Daily evaluation of 26 precipitation datasets using Stage-IV gauge-radar data for the CONUS. Hydrol. Earth Syst. Sci. 2019, 23, 207–224. [Google Scholar] [CrossRef] [Green Version]
- Nogueira, M. Inter-comparison of ERA-5, ERA-Interim and GPCP rainfall over the last 40 years: Process-based analysis of systematic and random differences. J. Hydrol. 2020, 583, 124632. [Google Scholar] [CrossRef]
- Malayeri, A.K.; Saghafian, B.; Raziei, T. Performance evaluation of ERA5 precipitation estimates across Iran. Arab. J. Geosci. 2021, 14, 1–18. [Google Scholar] [CrossRef]
- Jiao, D.; Xu, N.; Yang, F.; Xu, K. Evaluation of spatial-temporal variation performance of ERA5 precipitation data in China. Sci. Rep. 2021, 11, 17956. [Google Scholar] [CrossRef] [PubMed]
- Jiang, Q.; Li, W.; Fan, Z.; He, X.; Sun, W.; Chen, S.; Wen, J.; Gao, J.; Wang, J. Evaluation of the ERA5 reanalysis precipitation dataset over Chinese Mainland. J. Hydrol. 2021, 595, 125660. [Google Scholar] [CrossRef]
- Muschinski, T.; Katz, J.I. Trends in hourly rainfall statistics in the United States under a warming climate. Nat. Clim. Chang. 2013, 3, 577–580. [Google Scholar] [CrossRef]
- Cattoen, C.; Robertson, D.E.; Bennett, J.C.; Wang, Q.J.; Carey-Smith, T.K. Calibrating Hourly Precipitation forecasts with Daily Observations. J. Hydrometeorol. 2020, 21, 1655–1673. [Google Scholar] [CrossRef]
- Qin, S.; Wang, K.; Wu, G.; Ma, Z. Variability of hourly precipitation during the warm season over eastern China using gauge observations and ERA5. Atmos. Res. 2021, 264, 105872. [Google Scholar] [CrossRef]
- Hu, X.; Yuan, W. Evaluation of ERA5 precipitation over the eastern periphery of the Tibetan plateau from the perspective of regional rainfall events. Int. J. Climatol. 2021, 41, 2625–2637. [Google Scholar] [CrossRef]
- Amjad, M.; Yilmaz, M.T.; Yucel, I.; Yilmaz, K.K. Performance evaluation of satellite-and model-based precipitation products over varying climate and complex topography. J. Hydrol. 2020, 584, 124707. [Google Scholar] [CrossRef]
- Chen, Y.; Sharma, S.; Zhou, X.; Yang, K.; Li, X.; Niu, X.; Hu, X.; Khadka, N. Spatial performance of multiple reanalysis precipitation datasets on the southern slope of central Himalaya. Atmos. Res. 2021, 250, 105365. [Google Scholar] [CrossRef]
- Derin, Y.; Yilmaz, K.K. Evaluation of multiple satellite-based precipitation products over complex topography. J. Hydrometorol. 2014, 15, 1498–1516. [Google Scholar] [CrossRef] [Green Version]
- Bui, H.T.; Ishidaira, H.; Shaowei, N. Evaluation of the use of global satellite–gauge and satellite-only precipitation products in stream flow simulations. Appl. Water Sci. 2019, 9, 53. [Google Scholar] [CrossRef] [Green Version]
- Crossett, C.C.; Betts, A.K.; Dupigny-Giroux, L.-A.L.; Bomblies, A. Evaluation of Daily Precipitation from the ERA5 Global Reanalysis against GHCN Observations in the Northeastern United States. Climate 2020, 8, 148. [Google Scholar] [CrossRef]
- Zhao, P.; Li, Y.; Guo, X.; Xu, X.; Liu, Y.; Tang, S.; Xiao, W.; Shi, C.; Ma, Y.; Yu, X.; et al. The Tibetan Plateau surface-atmosphere coupling system and its weather and climate effects: The Third Tibetan Plateau Atmospheric Scientific Experiment. Acta Meteorol. Sin. 2018, 76, 833–860. [Google Scholar] [CrossRef]
- Yuan, X.; Yang, K.; Lu, H.; He, J.; Sun, J.; Wang, Y. Characterizing the features of precipitation for the Tibetan Plateau among four gridded datasets: Detection accuracy and spatio-temporal variabilities. Atmos. Res. 2021, 264, 105875. [Google Scholar] [CrossRef]
- Huang, J.; Li, Y.; Fu, C.; Chen, F.; Fu, W.; Dai, A.; Shinoda, M.; Ma, Z.; Guo, W.; Li, Z.; et al. Dryland climate change: Recent progress and challenges. Rev. Geophys. 2017, 55, 719–778. [Google Scholar] [CrossRef]
- Zhang, Q.; Zhao, Y.; Fan, S. Development of hourly precipitation datasets for national meteorological stations in China. Torrential Rain Disaster 2016, 35, 182–186. [Google Scholar]
- Brown, B.G.; Atger, F.; Brooks, H.; Wilson, L. Recommendations for the verification and intercomparison of QPFs and PQPFs from operational NWP models. Revision 2008, 2, 2009-1. [Google Scholar]
- Zhou, T.; Yu, R.; Chen, H.; Dai, A.; Pan, Y. Summer precipitation frequency, intensity, and diurnal cycle over China: A comparison of satellite data with rain gauge observations. J. Clim. 2008, 21, 3997–4010. [Google Scholar] [CrossRef]
- Yu, R.; Xu, Y.; Zhou, T.; Li, J. Relation between rainfall duration and diurnal variation in the warm season precipitation over central eastern China. Geophys. Res. Lett. 2007, 34, L13703. [Google Scholar] [CrossRef] [Green Version]
- Yu, R.; Li, J.; Zhang, Y.; Chen, H. Improvement of rainfall simulation on the steep edge of the Tibetan Plateau by using a finite-difference transport scheme in CAM5. Clim. Dyn. 2015, 45, 2937–2948. [Google Scholar] [CrossRef]
- Yu, R.; Li, J. Hourly rainfall changes in response to surface air temperature over eastern contiguous China. J. Clim. 2012, 25, 6851–6861. [Google Scholar] [CrossRef]
- Wang, L.; Chen, R.; Song, Y.; Yang, Y.; Liu, J.; Han, C.; Liu, Z. Precipitation–altitude relationships on different timescales and at different precipitation magnitudes in the Qilian Mountains. Theor. Appl. Climatol. 2018, 134, 875–884. [Google Scholar] [CrossRef]
- Li, L.; Li, J.; Chen, H.; Yu, R. Diurnal variations of summer precipitation over the Qilian Mountains in Northwest China. J. Meteorol. Res. 2019, 33, 18–30. [Google Scholar] [CrossRef]
- Keil, C.; Röpnack, A.; Craig, G.C.; Schumann, U. Sensitivity of quantitative precipitation forecast to height dependent changes in humidity. Geophys. Res. Lett. 2008, 35(9), L09812. [Google Scholar] [CrossRef] [Green Version]
- Song, Y.; Liu, Y.; Ding, Y. A study of surface humidity changes in China during the recent 50 years. Acta Meteorol. Sin. 2012, 26, 541–553. [Google Scholar] [CrossRef]
- Zhang, J.; Zhao, T.; Li, Z.; Li, C.; Li, Z.; Ying, K.; Shi, C.; Jiang, L.; Zhang, W. Evaluation of Surface Relative Humidity in China from the CRA-40 and Current Reanalyses. Adv. Atmos. Sci. 2021, 38, 1958–1976. [Google Scholar] [CrossRef]
- Keil, C.; Heinlein, F.; Craig, G.C. The convective adjustment time-scale as indicator of predictability of convective precipitation. Q. J. R. Meteorol. Soc. 2014, 140, 480–490. [Google Scholar] [CrossRef]
- Li, F.; Chavas, D.R.; Reed, K.A.; Dawson, D.T., II. Climatology of severe local storm environments and synoptic-scale features over North America in ERA5 reanalysis and CAM6 simulation. J. Clim. 2020, 33, 8339–8365. [Google Scholar] [CrossRef]
- Sun, J.; Ma, X.; Dai, K. Analysis of Unsuccessful Forecasts of Several Weak Rainfall Processes in Beijing. Meteorol. Mon. 2018, 44, 26–41. [Google Scholar]
- Yu, R.; Zhou, T.; Xiong, A.; Zhu, Y.; Li, J. Diurnal variations of summer precipitation over contiguous China. Geophys. Res. Lett. 2007, 34, L01704. [Google Scholar] [CrossRef] [Green Version]
- Liu, L.; Feng, J.; Chu, R.; Zhou, Y.; Uene, K. The diurnal variation of precipitation in monsoon season in the Tibetan Plateau. Adv. Atmos. Sci. 2002, 19, 365–378. [Google Scholar]
- Singh, P.; Nakamura, K. Diurnal variation in summer precipitation over the central Tibetan Plateau. J. Geophys. Res. 2009, 114, D20107. [Google Scholar] [CrossRef]
- Chen, H.M.; Yuan, W.H.; Li, J.; Yu, R.C. A possible cause for different diurnal variations of warm season rainfall as shown in station observations and TRMM 3B42 data over the southeastern Tibetan Plateau. Adv. Atmos. Sci. 2012, 29, 193–200. [Google Scholar] [CrossRef]


Publisher’s Note: MDPI stays neutral with regard to jurisdictional claims in published maps and institutional affiliations. |
© 2022 by the authors. Licensee MDPI, Basel, Switzerland. This article is an open access article distributed under the terms and conditions of the Creative Commons Attribution (CC BY) license (https://creativecommons.org/licenses/by/4.0/).
Share and Cite
He, M.; Chen, H.; Yu, R. Evaluation of Warm-Season Rainfall Diurnal Variation over the Qilian Mountains in Northwest China in ERA5 Reanalysis. Atmosphere 2022, 13, 674. https://doi.org/10.3390/atmos13050674
He M, Chen H, Yu R. Evaluation of Warm-Season Rainfall Diurnal Variation over the Qilian Mountains in Northwest China in ERA5 Reanalysis. Atmosphere. 2022; 13(5):674. https://doi.org/10.3390/atmos13050674
Chicago/Turabian StyleHe, Mu, Haoming Chen, and Rucong Yu. 2022. "Evaluation of Warm-Season Rainfall Diurnal Variation over the Qilian Mountains in Northwest China in ERA5 Reanalysis" Atmosphere 13, no. 5: 674. https://doi.org/10.3390/atmos13050674
APA StyleHe, M., Chen, H., & Yu, R. (2022). Evaluation of Warm-Season Rainfall Diurnal Variation over the Qilian Mountains in Northwest China in ERA5 Reanalysis. Atmosphere, 13(5), 674. https://doi.org/10.3390/atmos13050674