Abstract
China has imposed an ultra-low emissions (ULE) standards policy regarding the emission concentrations of the thermal power industry, and the region of the Fen-Wei Plain (China), which is an important area regarding blue-sky protection, is in urgent need of accelerating the transformation of its thermal power units to conform with China’s ULE standards. Based on China’s high-resolution thermal power industry emission inventory, this study used the Comprehensive Air Quality Model with extensions (CAMX) to examine emissions from the thermal power industry and the associated impacts on the atmospheric environment of the Fen-Wei Plain. (1) Spatially, the highest emissions and the greatest air quality contributions were concentrated in the Shanxi and Henan areas, which are regions that have considerable power generation capacity. (2) In terms of species, NOX represented the largest air quality contribution and registered the smallest reduction. (3) Temporally, emission sources presented the greatest contributions in summer. (4) In terms of policy evaluation, implementation of ULE standards resulted in the reduction of the contribution of thermal power industry emissions to air quality by 56.82%, 27.44%, and 44.55% for SO2, NOX, and PM2.5, respectively. The results reflect the current levels of pollution on the Fen-Wei Plain attributable to the thermal power industry and provide insight in relation to decision-making processes regarding regional air quality management.
1. Introduction
In recent years, China’s power system has been dominated by thermal power generation (total installed capacity in 2018: 1.14 × 10⁹ kW). Between 2016 and 2018, China’s thermal power plants generated 70.4% of the country’s electricity [1], and the associated SO2, NOX, and particulate matter (PM) emissions accounted for 27–28%, 24–30%, and 8–11% of China’s total anthropogenic emissions, respectively [1,2]. Coal-fired power plants are a major source of atmospheric emissions in China. Therefore, control of thermal power plants is very important regarding improvement of the quality of the atmospheric environment.
In 2014, China’s central government approved the transfer of control of thermal power plants to the local government [3]. Consequently, to increase gross domestic product (GDP), local governments approved the construction of a large number [4] of thermal power plants. In the following years, the installed capacity of thermal and power generation increased. In 2015, the installed capacity of the thermal power industry in China was 9.90 × 10⁸ kW [3], and in 2018, it was 1.14 × 10⁹ kW [5]. From an environmental perspective, the State Council proposed that the thermal power industry should achieve complete transformation to meet the ultra-low emissions (ULE) standards (35, 50, and 10 mg/m3 of SO2, NOX, and PM at standard oxygen levels, respectively) by 2020 [5,6].
The Fen-Wei Plain is considered one of the most polluted areas in China. From 2010 to 2017, the concentration load of PM2.5 and SO2 in the atmosphere remained high, and haze pollution occurred frequently in both autumn and winter [7,8,9]. Thus, the Fen-Wei Plain has been included as an important region in the battle for blue-sky preservation. The thermal power industry is one of the major industries of the Fen-Wei Plain region, and its transformation to meet ULE standards has resulted in substantial reductions of associated emissions. However, the proportion of upgraded coal-burning power plants to achieve ultra-low emissions of the thermal power industry on the Fen-Wei Plain is lower than that of both the “2 + 26” cities (refers to the “2 + 26” cities in Beijing-Tianjin-Hebei and its surroundings, “2” refers to Beijing and Tianjin, “26” refers to Shijiazhuang, Tangshan, Langfang, Baoding, Cangzhou, Hengshui, Xingtai, and Handan in Hebei Province, Taiyuan, Yangquan, Changzhi, and Jincheng in Shanxi Province, Jinan, Zibo, Jining, Dezhou, Liaocheng, Binzhou, and Heze in Shandong Province, Zhengzhou, Kaifeng, Anyang, Hebi, Xinxiang, Jiaozuo, and Puyang in Henan Province) and the Yangtze River Delta region [10]. Therefore, it is very important to study the impact of the ultra-low transformation of the thermal power plan and the associated air pollutant emissions on the quality of the atmospheric environment of the Fen-Wei Plain. To address these problems, it is essential to examine the contribution to air quality of the emissions of the thermal power industry on the Fen-Wei Plain.
Many previous studies have investigated the contribution to the atmospheric environment of emissions from the thermal power industry on national, regional, and city scales. For example, on the national scale, the thermal power industry emissions and contributions to the ambient atmospheric environment have been simulated in China [11,12,13,14,15], India [16], and Japan [17]. On the regional scale, the contributions of thermal power emissions to airborne SO2 concentration in the Chengdu–Chongqing Economic Zone [18] and airborne PM2.5 concentration in the Beijing–Tianjin–Hebei region [19,20,21,22] have been simulated. On the city scale, the contributions of thermal power industry emissions to the ambient atmospheric environment (i.e., PM2.5 or PM10 concentration) have been explored in relation to various cities, e.g., Beijing [23], Jiangsu [24,25], and Shandong [26]. Recently, regional environmental problems have become increasingly prominent, and important areas, such as the “2 + 26” cities, Fen-Wei Plain, and Yangtze River Delta region have become national strategic areas of China’s Blue Sky Protection Campaign. However, recent research does not reflect the impact on air quality of the implementation of the latest ULE standards regarding the thermal power industry of the Fen-Wei Plain. Therefore, using the CAMX air quality model, this study examined the impact on air quality of the ULE standards imposed on the thermal power industry of the Fen-Wei Plain.
To the best of our knowledge, since the implementation of a series of national emission standards for the thermal power industry in China, this study might be the first to examine the contribution of thermal power industry emissions to air quality on the Fen-Wei Plain, using the corresponding emission inventory. The major innovations of this study comprise the following two aspects: (1) Comprehensive Air Quality Model with extensions (CAMx) was a popular source-oriented model, which particularly specializes in capturing synergistic effects among multiple pollutants involved in different atmospheric physical processes and chemical reactions, and was used in this paper to reflect the real emission characteristics to investigate the impact of thermal power emissions on air quality on the Fen-Wei Plain; (2) the effect of the implementation of ULE standards on the thermal power industry of the Fen-Wei Plain was evaluated.
The main objective of this study was to explore the overall impact on air quality of the emissions of the thermal power industry on the Fen-Wei Plain in 2015 and 2018. The remainder of the paper is organized as follows. The methods proposed for the emission inventory and the air quality simulation are described in Section 2. In Section 3, the contribution results are thoroughly analyzed, and specific policy-related suggestions are offered regarding control of thermal power industry emissions. Section 4 concludes the paper and suggests possible directions for future research.
2. Materials and Methods
This study used the high spatial and temporal resolution Thermal Power Industry Emission Inventory (HPEC) and CAMX model version 6.8 to examine the emissions of the thermal power industry on the Fen-Wei Plain and their contribution to air quality. The study area is described in Section 2.1. Details of HPEC, the emission factors and the model simulation are presented in Section 2.2, Section 2.3 and Section 2.4, respectively, together with descriptions of the corresponding analytical techniques. Section 2.5 explains how the mitigation effects of the ULE standards policy were investigated using a historical scenario of thermal power industry emissions.
2.1. Study Area
The Fen-Wei Plain (33°33′–38°42′ N, 106°20′–114°7′ E), which comprises the Fen-he Plain, Wei-he Plain, and Taiyuan terrace, is the largest impingement plain in the middle reaches of the Yellow River (Figure 1). Including some cities in Shaanxi and Henan, the total area of the Fen-Wei Plain is approximately 10,000 km2. Through ARCGISv10.6 software, the scale of thermal power enterprises in each city in this region is displayed. (Figure 2). In 2018, 6 of the 20 cities in China with the poorest air quality were located on the Fen-Wei Plain, with a proportion of average good days of 54.3% and an average PM2.5 concentration of 58 mg/m3 (National Ecological and Environmental Quality Overview, 2018).
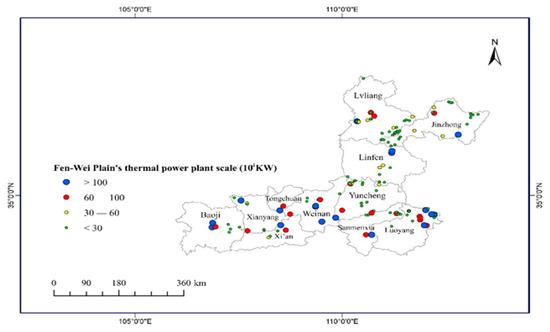
Figure 1.
Location and distribution of thermal power generating capacity on the Fen-Wei Plain.
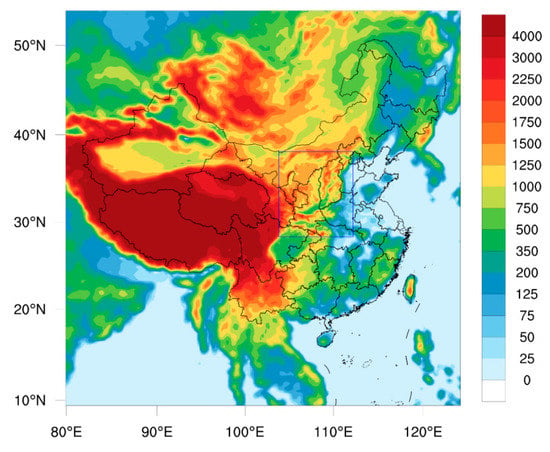
Figure 2.
Schematic of the nested grids used for the simulation.
This study incorporated the Xi Xian New Area into Xianyang and the Yangling Demonstration Area into Xi’an, considering administrative divisions and areal coverage. The distribution of thermal power enterprises is shown in Figure 3. It can be seen that the thermal power enterprises in Jinzhong, Lvliang, and Luoyang are reasonably concentrated, distributed mainly in Shanxi and Henan.
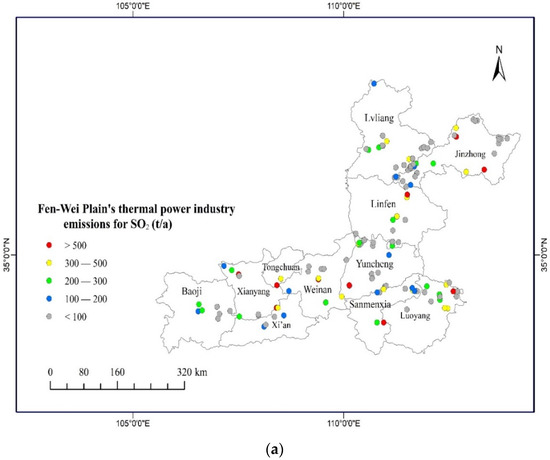
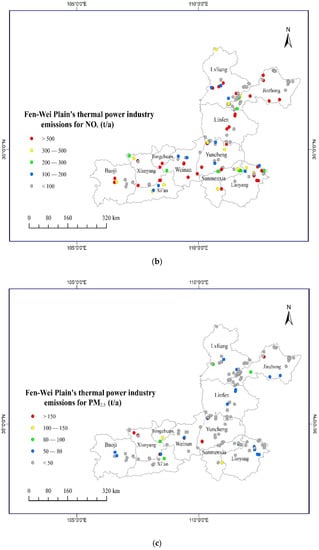
Figure 3.
Spatial distribution of the thermal power industry emissions (2018) on the Fen-Wei Plain: (a) SO2, (b) NOX, and (c) PM2.5.
2.2. Emission Estimation
This study adopted the HPEC for the Fen-Wei Plain area. HPEC is a list established by our research team [27], which provides detailed information regarding process equipment, environmental protection measures, and production capacity of 143 thermal power enterprises on the Fen-Wei Plain. The geographical location of each power plant was validated using Google Earth®.
The main method to establish the list is Formula (1) [27]. According to the online monitoring annual pollutant concentration data and the theoretical smoke volume of fuel, the emission factors of each thermal power enterprise are obtained as Equation (3). The emissions of each thermal power enterprise are estimated by combining the fuel consumption of environmental statistics enterprises. For an enterprise without CEMS, the emission concentration of the enterprise is represented by the statistical eigenvalues of the same type of unit and the same standard.
where is the emissions, , EF is the emission factor, , AC is environmental statistical fuel consumption, , n distinguishes different cities; i distinguishes between different power plants, CAVG is the statistical mean of emission concentration, , is the hourly mean value of pollutant concentration at the online monitoring outlet, , j is the number of the outlet, h is the number of running hours, Oph is the monitoring hours included in the analysis, and V is the theoretical smoke volume, (the smoke volume of other fuels can be estimated by referring to the Manual of the Coefficient of Production and Emission of Industrial Pollution Sources in the First National Pollution Source Census).
The emissions of SO2, NOX, PM2.5, PM10, CO, black carbon (BC), and volatile organic compounds (VOCS) in the production processes of the power plants are estimated based on the unit level. The geographic locations and power generation capacity of the power plants on the Fen-Wei Plain are shown in Figure 4. As can be seen from Figure 5, thermal power units are mainly distributed in Lvliang, Jinzhong, Yuncheng, and Luoyang of Shanxi and Henan Province, with installed capacity accounting for about 49.1%. Large-scale thermal power enterprises are mainly distributed in the south of the Fen-Wei plain, while in the north they are mostly medium- and small-scale enterprises.
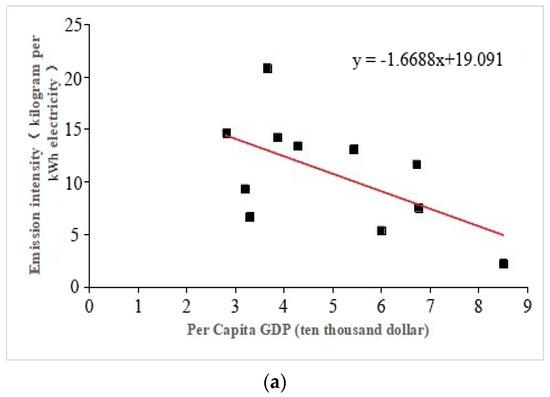
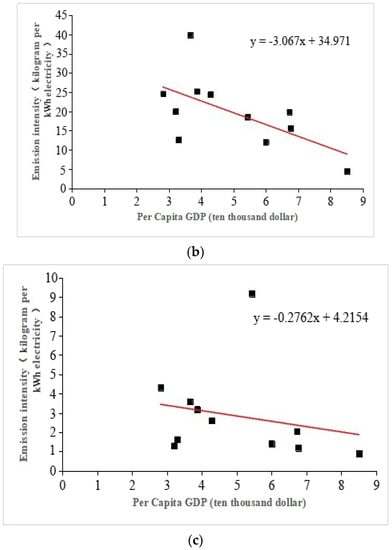
Figure 4.
Per capita gross domestic product (GDP) of 14 cities on the Fen-Wei Plain plotted against thermal power industry emissions (2018): (a) SO2, (b) NOX, and (c) PM2.5.
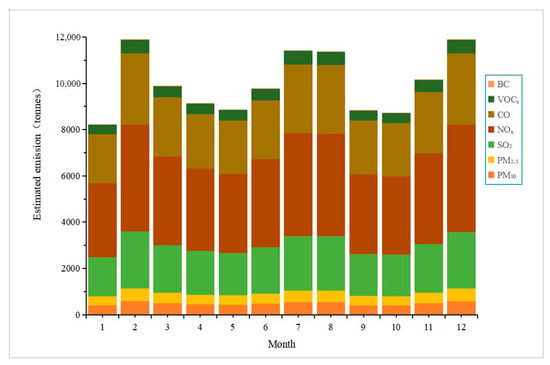
Figure 5.
Monthly emission of pollutant species by the thermal power industry on the Fen-Wei Plain in 2018.
Regarding the emission concentrations of SO2, NOx, and PM2.5 at all sites in the study, the emission concentrations in the pollutant emission inventory based on Multi-resolution Emission Inventory for China (MEIC) data are lower than those in the pollutant emission inventory based on high-resolution grid data, with a difference of 10.4–154.5 times. The spatial proportions of pollutant emission concentration stations in the two inventories are basically the same, indicating that the data sources and processing processes of the two inventories have certain reliability and authenticity.
2.3. Emission Factors
The average emission factors of pollutants from different fuel units is shown in Table 1. The emission factor of coal generating units is based on Equation (3). The non-coal generating units are not counted due to the small number of samples, which is quoted from the research results of our team [27].

Table 1.
Average emission facts of thermal power using varied fuel.
From Table 1, the emission factors of different fuel units are from high to low, which are fuel oil, coal, biomass, and gas, and the emission factors of fuel generator sets are much higher than other fuels. The overall emission factors of non-coal-fired generating units in 2018 are smaller than those in 2015, due to the continuous reduction of the scale of oil-fired generators in China in recent years, while the continuous rise of biomass power generation and gas-fired power generation, the decline in emission factors of non-coal-fired units in the Fen-wei Plain indicates that the control effect of biomass and gas-fired power generation is remarkable.
From the analysis of coal-fired units, the average SO2 emission factor of coal-fired generating units in Fen-wei Plain in 2018 was 0.24 g × kg−1 (down 64% from 2015), the average NOx emission factor was 0.41 g × kg−1 (down 50.4% from 2015), and the average pm10 emission factor was 0.06 g × kg−1 (down 59.57% from 2015), which was mainly due to the improvement of pollution prevention and control measures.
2.4. Air Quality Modeling
2.4.1. Meteorological Data
In this study, FNL reanalysis data (spatial resolution: 1° × 1°, 6-h intervals) from the US National Center for Environmental Prediction were used as boundary conditions and the background meteorological field, and a new generation mesoscale meteorological Weather Research and Forecasting model (WRF v. 3.9.1) was selected. This model is developed jointly by the US National Center for Environmental Prediction and US National Center for Atmospheric Research, and it has been demonstrated to have reasonable simulation capability in practical application.
For more accurate modeling, the simulation used two-layered grid nesting: domain D01 covered the entire area of China, and domain D02 covered the area of the Fen-Wei Plain. Domain D01 was used as the background field of the pollutant simulation, while domain D02 focused on simulating the core area of this study. The fully compressible nonstatic equation was adopted, the Arakawa C lattice scheme was adopted in the horizontal direction, and the terrain-following mass coordinate was adopted in the vertical direction. The selected central point was 35° N, 102° E, and the model was divided vertically into 31 layers with the highest layer at 50 hPa. Lambert Conformal projection is used in this study, which is suitable for China. The true_lat1 was 20° N, and the true_lat2 was 50° N. The main simulation parameters and the nested grid settings are listed in Table 2, and a schematic of the model is illustrated in Figure 6.

Table 2.
WRF model parameter settings.
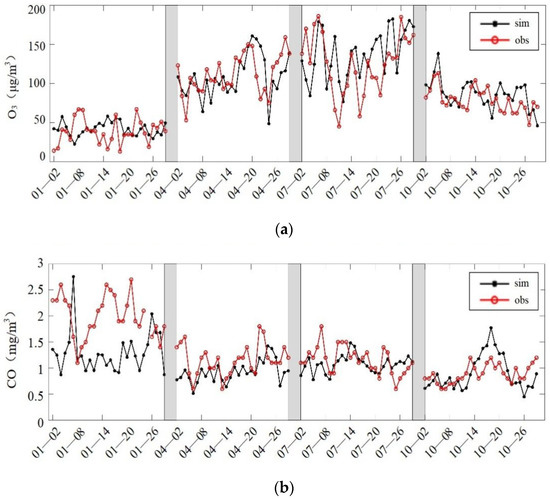
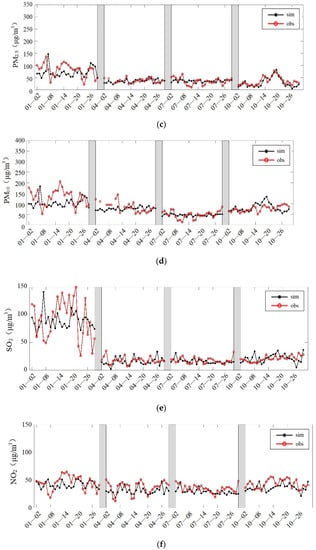
Figure 6.
Time series diagram of Lvlian: (a) O3, (b) CO, (c) PM2.5, (d) PM10, (e) SO2, (f) NO2.
The WRF topography and surface type data are based on global data of the US Geological Survey, wherein the selected SRTM3 digital elevation data have accuracy of approximately 90 m.
To improve the simulation efficiency, we select typical months to represent different seasons, and then the average of the four seasons is the annual mean. Since January, April, July, and October in northern China respectively represent the typical months of winter, spring, summer, and autumn, and according to the requirements of “Technical guidelines for environmental impact assessment- Atmospheric environment” [28], the meteorological fields in this study are selected as January, April, July, and October, which respectively represent winter, spring, summer, and autumn.
2.4.2. Model Evaluation
The CAMX model, which is a three-dimensional gridded Euler photochemical model, is based on the UAM-V model [29]. It is suitable for simulation of gaseous and particulate air pollutants on urban and regional scales. The CAMX model adopts a two-way nested grid structure that is driven by meteorological fields provided by mesoscale models, such as the WRF, Mesoscale Model5 (MM5), and Regional Atmospheric Modeling System Model (RAMS), and processed using the SMOKE, CONCEPT, and EPS3 models, making it suitable for simulation of the advection, diffusion, deposition, and chemical reaction of atmospheric pollutants. In this study, the mesoscale WRF model was used to provide the meteorological field. CAMX is suitable for urban- and regional-scale air quality simulation of tropospheric O3, acid deposition, visibility, fine particles, and pollutants. Through this model, environmental management departments can evaluate the impact on the ambient air quality of measures implemented to control multiple pollutants at different scales. The simulation time is consistent with the meteorological field.
The specific parameter settings of CAMX 6.50 adopted for the simulation conducted in this study are shown in Table 3. The selection of this parameter has been applied in many research projects, and good simulation results have been achieved. [4,30].

Table 3.
CAMX model parameter settings.
2.4.3. Verification of Model
According to the “Guidelines for the Selection of Ambient Air Quality Models (Trial)”, for the regional Euler grid model, normalized mean bias (NMB), normalized mean error (NME), and Correlation Coefficient (R) are used as the evaluation basis to judge the accuracy of the model. According to the simulated sulfur dioxide (SO2), nitrogen dioxide (NO2), ozone (O3), fine particulate matter (PM2.5), and other pollutants, the corresponding evaluation standards are given, and the evaluation standards for the simulation accuracy of 4 different pollutants as follows:
- SO2: −40% < NMB < 50%, NME < 80%, R2 > 0.3;
- NO2: −40% < NMB < 50%, NME < 80%, R2 > 0.3;
- O3: −15% < NMB < 15%, NME < 35%, R2 > 0.4;
- PM2.5: −50% < NMB < 80%, NME < 150%, R2 > 0.3.
Among them, the R is mainly used to measure the degree of linear correlation between two variables; there is also fractional bias (FB), which is used to quantitatively analyze the consistency between the simulation average of the model and the verification case monitoring average. When the model is underestimated or overestimated twice, FB will exceed the range of −67%~+67%.
2.5. Historical Scenario
To evaluate the mitigation effects attributable to the ULE standards policy, we conducted a historical scenario simulation for 2015 to compare the contribution of thermal power industry emissions to ambient atmospheric concentrations before and after the implementation of the ULE standards policy.
The emission database comprised the HPEC for the Fen-Wei Plain in 2015 [31]. Based on CEMS data in 2015, the annual average discharge concentration of conventional pollutants of each enterprise with online monitoring equipment was calculated. According to the data of low calorific value of coal burning in each enterprise, the theoretical dry smoke volume of each enterprise is calculated. Combined with the theoretical smoke volume and emission concentration information, the emission factors of each enterprise are obtained. Finally, according to the emission factor method, the pollutant discharge of each enterprise is calculated from bottom to top, as shown in Equations (1)–(3). The CAMX model was used to simulate the contribution of the historical emissions of the thermal power industry to air quality on the Fen-Wei Plain, for which the meteorological data and background emissions were similar to those of 2018.
3. Results and Discussion
Based on the methodology described above, the thermal power industry emissions on the Fen-Wei Plain and their contribution to air quality were explored. In particular, Section 3.1 presents analysis of the thermal power industry emissions on the Fen-Wei Plain with reference to a regional unit-based inventory and compares the emissions in the MEIC list. The comparison between the predicted value and the current monitoring value is in Section 3.2. The corresponding contributions to air quality concentrations, simulated using the CAMX model, are discussed in Section 3.3. Finally, the pollutant emissions from the thermal power industry on the Fen-Wei Plain and their impact on the atmospheric environment in a historical context are analyzed in Section 3.4.
3.1. Thermal Power Industry Emissions on the Fen-Wei Plain
The thermal power industry emissions on the Fen-Wei Plain in 2018 were estimated as follows: 24.8 Gg SO2, 46.7 Gg NOX, 5.8 Gg PM10, and 5.5 Gg PM2.5. To elaborate more fully, the estimation results are analyzed in terms of spatial, species, and temporal perspectives.
Regarding the spatial distribution, the regional and detailed emissions of the thermal power industry on the Fen-Wei Plain in 2018 are summarized in Figure 7. Two insightful conclusions can be drawn from the results. The first conclusion is that China’s thermal power industry emissions have considerable regional variation, with the sources of the highest emissions located mainly in certain areas. For SO2 emission, Lvliang contributed the largest share (approximately 17.52% of the total in 2018), followed closely by Luoyang (15.13%) and Jinzhong (12.00%). For NOX emission, Lvliang, Luoyang, and Jinzhong were the three largest contributors, accounting for 17.82%, 16.70%, and 11.60% of the total, respectively. For PM10, PM2.5, and BC emissions, Yuncheng made the largest contribution (14.62%, 14.81%, and 14.81%, respectively), followed by Lvliang (13.43%, 13.68%, and 13.68%, respectively) and Xianyang (12.70%, 12.14%, and 12.14%, respectively). For other pollutants, Jinzhong contributed the largest proportion of emissions (i.e., 20.15% and 18.80% for CO and VOCS, respectively), followed by Lvliang (15.83% and 16.14%, respectively) and Luoyang (14.51% and 14.97%, respectively). Activity level is the main driving factor of emissions [27], and therefore thermal power industry emissions are generally consistent with the spatial distribution of power generation, with an average Pearson correlation coefficient of 0.52 for all of the aforementioned emission pollutants. This is mainly related to installed capacity and electricity generation. In particular, large enterprises (15.04%) accounted for 49.14% of installed capacity and 50.73% of electricity generation in 2018. It is worth noting that although small enterprises have the largest number of enterprises (64.66%) and emit more pollutants than large enterprises, their installed capacity and electricity generation are the lowest (15.67% and 12.74% respectively), while medium-sized enterprises have a small number (20.30%) but their installed capacity accounts for 35.20%. Power generation accounted for 36.53%. This study found that the number of small enterprises in Lvliang, Luoyang, and Jinzhong accounted for the highest proportion (79.31%, 76.92%, and 50.00%, respectively), which indicates that large-scale and strict control of thermal power enterprises can further promote the emission reduction of air pollutants in China’s thermal power industry.
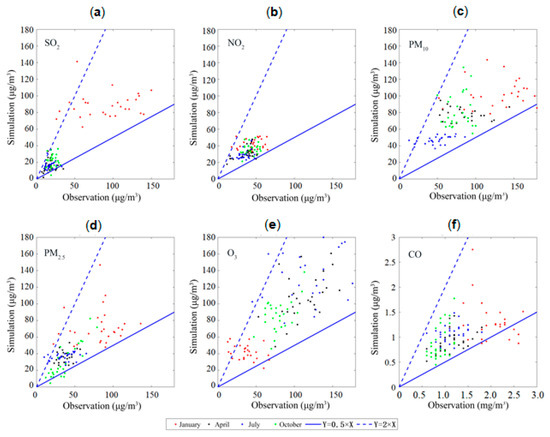
Figure 7.
Schema result validation diagram of Lvliang: (a) O3, (b) CO, (c) PM2.5, (d) PM10, (e) SO2, (f) NO2.
The second conclusion is that economic level (GDP per capita) has a negative impact on the thermal power industry emission intensity (emission per kW.h of electricity generated) on the Fen-Wei Plain at the municipal level (Figure 4). A linear regression was introduced, and both t- and F-statistics support this negative contribution statistically at a confidence level of 95% (Table 4). The reason might be that increase in per capita GDP within the region has driven government investment in pollutant treatment technology, which has led to reduction in energy consumption in the industry. It indicates that economic development is accompanied by continuous upgrading of pollutant treatment technology, i.e., the level of pollution control in economically developed areas is better.

Table 4.
Results of linear regression analysis on the relationship between economic level and thermal power industry environmental impact.
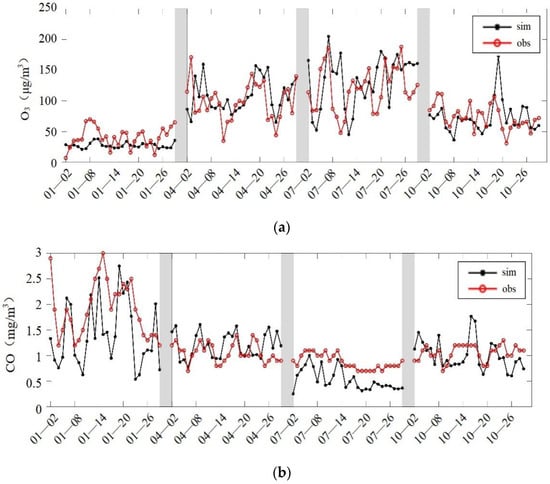
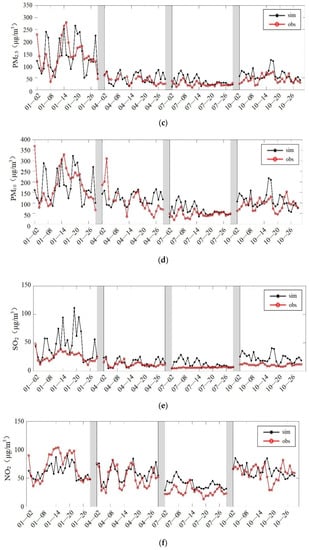
Figure 10.
Time series diagram of Xi’an: (a) O3, (b) CO, (c) PM2.5, (d) PM10, (e) SO2, (f) NO2.
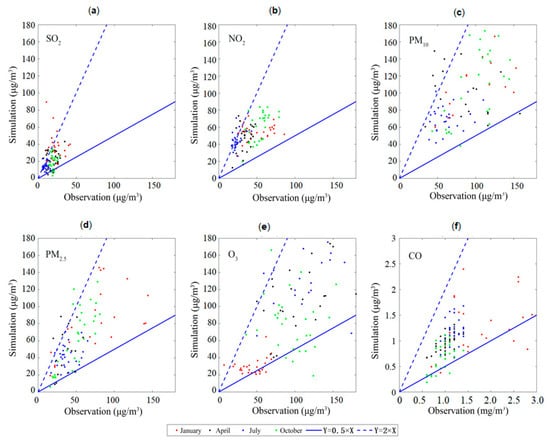
Figure 9.
Schema result validation diagram of Luoyang: (a) O3, (b) CO, (c) PM2.5, (d) PM10, (e) SO2, (f) NO2.
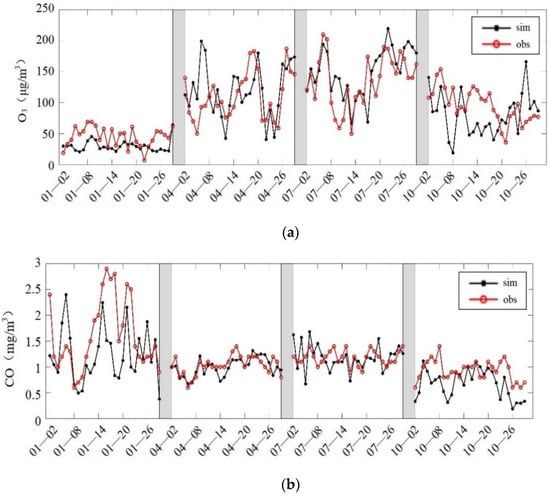
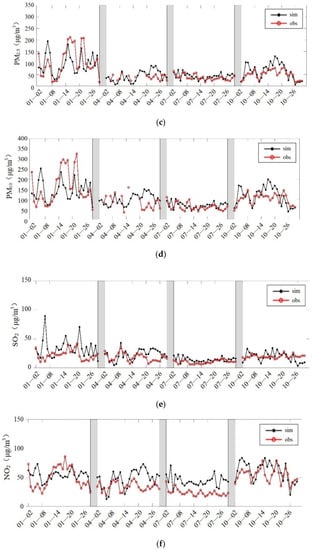
Figure 8.
Time series diagram of Luoyang: (a) O3, (b) CO, (c) PM2.5, (d) PM10, (e) SO2, (f) NO2.
Table 4.
Results of linear regression analysis on the relationship between economic level and thermal power industry environmental impact.
| Variable | Model 1 (Y is SO2; Figure 8a) | Model 2 (Y is NOX; Figure 9b) | Model 3 (Y is PM2.5; Figure 10c) | |||||||||
|---|---|---|---|---|---|---|---|---|---|---|---|---|
| Coefficient | t-Statistic | p-Value | Standard Deviation | Coefficient | t-Statistic | p-Value | Standard Deviation | Coefficient | t-Statistic | p-Value | Standard Deviation | |
| Gross Domestic Product | −0.56 | −0.12 | 0.01 | 4.75 | −0.62 | −0.06 | 0.00 | 9.72 | −0.21 | −0.09 | 0.03 | 2.29 |
| total sample(N) | 11 | 11 | 11 | |||||||||
| F-Statistic | 0.00 | 0.00 | 0.44 | |||||||||
From the perspective of species, this study focused on the emission of SO2, NOX, and PM (in the form of PM2.5). The estimated amounts of NOX, SO2, and PM2.5 emission by the thermal power industry on the Fen-Wei Plain in 2018 are 46.7, 24.8, and 5.5 Gg, respectively, i.e., the emission of NOX is 1.88 and 8.49 times greater than that of SO2 and PM2.5, respectively. From the perspective of emission concentration, the online monitoring concentrations of NOX, SO2, and PM2.5 emission by the thermal power industry on the Fen-Wei Plain are 44.2, 25.6, and 5.5 mg/m3, respectively, i.e., the emission concentration of NOX is 1.73 and 8.04 times greater than that of SO2 and PM2.5, respectively. This finding indicates that the emission of pollutant species is directly proportional to emission concentration, and that considerable scope remains for improvement regarding NOX control.
The temporal trend of monthly emission of pollutant species by the thermal power industry on the Fen-Wei Plain in 2018 is illustrated in Figure 5. Different species generally show similar patterns of monthly emission, indicating that monthly emission profiles are dominated by monthly variations in activity. The largest amount of total pollutant emissions that included 2.45 Gg SO2, 4.62 Gg NOX, 0.58 Gg PM10, and 0.55 Gg PM2.5 occurred in December, while the minimum amount of total emissions occurred in January. The ratio of monthly total pollutant emissions between the maxima and minima is within the range of 1.44–1.45, which is largely consistent with the monthly variation trend of electricity generation by the thermal power industry nationwide in 2018.
3.2. Model Verification Analysis
Three representative cities with high thermal power distribution and emissions in the Fenwei Plain were selected, the Lvliang site (code 2183A), Luoyang site (1811A), and Xi’an site (1462A), for simulation results verification and analysis. The main selected indicators are shown in Table 5, Table 6 and Table 7, and the results are shown in Figure 6, Figure 7, Figure 8, Figure 9, Figure 10 and Figure 11.

Table 5.
2183A station (Lvliang) evaluation index.

Table 6.
1811A station (Luoyang) evaluation index.

Table 7.
1462A station (Xi’an) evaluation index.
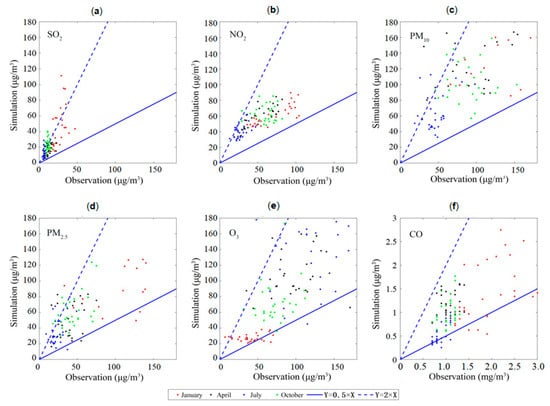
Figure 11.
Schema result validation diagram of Xi’an: (a) O3, (b) CO, (c) PM2.5, (d) PM10, (e) SO2, (f) NO2.
Among them, R2 between the PM2.5 simulation result and the observed value is between 0.66 and 0.77, and the simulation effect is good. It can also be seen from the time series diagram that the model captures the change trend of PM2.5 well. The SO2 simulation effect of the Luoyang site (1811A) is slightly worse, with a correlation coefficient of 0.33. The main reason may be that the inventory used in the simulation is MEIC2016, but the actual emissions of SO2 and NO2 in 2018 are lower than the inventory, resulting in an overestimation of the simulation. Circumstances in turn make the O3 concentration underestimated.
According to the “Guidelines for Selection of Ambient Air Quality Models (Trial)”, the simulation accuracy of the 6 conventional factors meets the relevant accuracy requirements.
3.3. Air Quality Contribution
The contribution of emissions from the thermal power industry on the Fen-Wei Plain to air quality was investigated using the CAMX model, and the results are analyzed in terms of incremental concentrations and incremental rates (%) from spatial, species, and temporal perspectives.
The spatial distribution of the contribution of the thermal power industry on the Fen-Wei Plain to the annual mean concentration of major atmospheric pollutants in 2018 is shown in Figure 12. In terms of the urban contribution, the thermal power industry emissions mainly affected Lvliang, Sanmenxia, and Jinzhong. The largest contributions to regional air pollution of SO2 emission by the thermal power industry on the Fen-Wei Plain were found in Sanmenxia, Lvliang, and Luoyang (8.90%, 8.10%, and 7.77%, respectively); the largest contributions of NOX were found in Lvliang, Sanmenxia, and Jinzhong (17.07%, 11.88%, and 7.84%, respectively), and the largest contributions of PM2.5 were found in Jinzhong, Lvliang, and Luoyang (1.97%, 1.77%, and 1.15%, respectively). The underlying reason is that the spatial distribution is dominated by the comprehensive impact of power generation and air pollution control measurement coverage. The simulation results derived in this study show that the contributions of Lvliang, Sanmenxia, and Jinzhong are greatest, associated with relatively large power generation (i.e., 208.6 × 10⁶, 204.78 × 10⁶, and 221.8 × 10⁶ kWh, respectively).
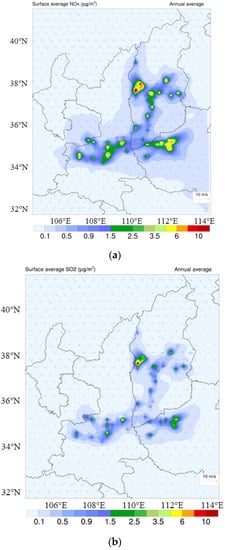
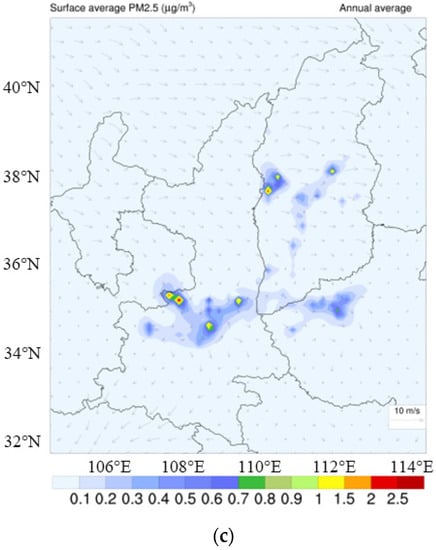
Figure 12.
Contribution of air pollutants emitted by the thermal power industry on the Fen-Wei Plain in 2018 to ambient concentration in terms of incremental concentrations: (a) NOX, (b) SO2, and (c) PM2.5.
The air quality impact in important areas, such as the cities of the “Guanzhong Area” is of particular interest following the implementation of China’s Blue Sky Protection Campaign. The contribution of the thermal power industry on the Fen-Wei Plain to the ambient environment in such areas in 2018 was investigated. In the “Guanzhong Area” cities, the thermal power industry on the Fen-Wei Plain contributes more to the concentration of major air pollutants in Tongchuan (4.35%, 6.02%, and 0.95% for SO2, NOX, and PM2.5, respectively), Xi’an (1.61%, 1.73%, and 0.52%, respectively), and Xianyang (1.36%, 1.53%, and 0.47%, respectively).
In terms of species, this research mainly explored the contributions of SO2, NOX, and PM2.5. In 2018, the thermal power industry on the Fen-Wei Plain contributed 4.21%, 5.74%, and 0.86% to the annual mean concentration of SO2, NOX, and PM2.5, respectively. It indicates that NOX makes a substantial contribution to the regional pollutant concentration, and that considerable scope remains for improvement regarding NOX control. The results show that the contribution proportion of each component in different cities in the Fenhe and Weihe plain is basically the same, and PM2.5 is mainly affected by FPRM + FCRS, POA + SOA, and PNO3 (Figure 13). It indicates that the particulate matter of thermal power industry is mainly primary pollution in most areas of Fen-Wei Plain, and primary particulate matter is mainly FPRM + FCRS. However, the proportion of nitrate in the secondary particulate matter is larger, which is related to the larger NOx emissions in the thermal power industry, and is also related to the oxidation of NOx more easily than SO2.
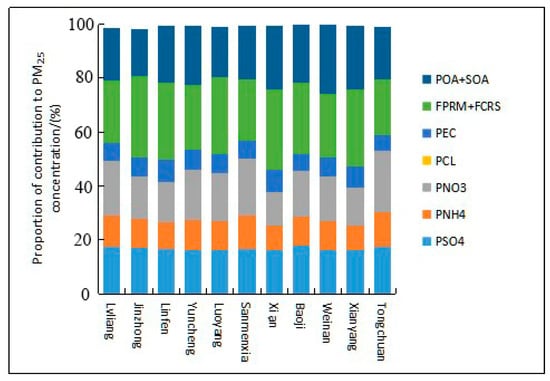
Figure 13.
The proportion of each particle in the annual average concentration of total PM2.5 in Fen-Wei Plain (%).
From the temporal perspective, the contribution of the thermal power industry on the Fen-Wei Plain to the annual mean concentration of major air pollutants was explored in different seasons (Figure 14).
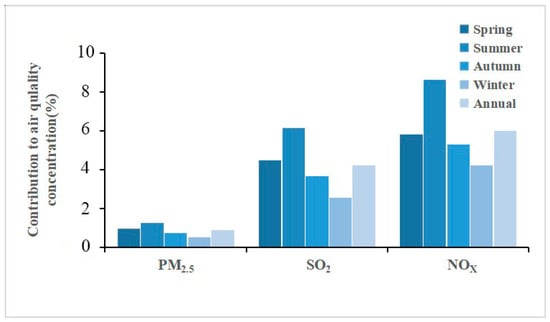
Figure 14.
Contribution of air pollutants emitted by the thermal power industry on the Fen-Wei Plain to air quality concentration in 2018.
In this study, January, April, July, and October were selected to represent winter, spring, summer, and autumn, respectively [7]. Simulation results show that the greatest contributions are in summer (i.e., 6.16%, 8.34%, and 1.26% for SO2, NOX, and PM2.5, respectively) and the smallest contributions are in winter (i.e., 2.54%, 3.93%, and 0.51% for SO2, NOX, and PM2.5, respectively), similar to the findings of [23]. Although the contribution concentration of pollutants is consistent with the distribution of pollutant emissions, atmospheric diffusion conditions are better in summer, which means air pollution is generally lighter in this season [31]. Figure 15. shows the contribution of sulfate (PSO4), granular ammonium salt (PNH4), granular nitrate (PNO3), granular chloride ion (PCL), primary element carbon (PEC), fine particulate matter and fine crustal particles (FPRM + FCRS), primary organic aerosol and secondary organic aerosol (POA + SOA) to PM2.5 concentration. The results show that the contribution proportion of different components is mainly affected by season, and winter has the greatest influence on PM2.5.
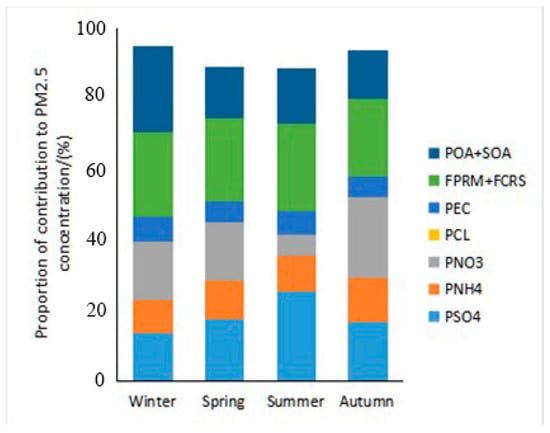
Figure 15.
The proportion of particulate matter to the average concentration of PM2.5 in each season in Fen-Wei Plain (%).
3.4. Scenario Analysis
The emissions of the thermal power industry on the Fen-Wei Plain in 2015 were estimated as follows: 58.1 Gg SO2, 65.2 Gg NOX, 11.4 Gg PM10, and 9.9 Gg PM2.5. For the historical scenario of 2015, the contribution of the thermal power industry on the Fen-Wei Plain to the annual mean concentration of major air pollutants is displayed in Figure 16. In comparison with the historical scenario, the current scenario reveals a striking downtrend in contribution concentrations averaged across the Fen-Wei Plain. The analysis regarding the reduction of emissions focuses on two issues: emissions cuts and ratios.
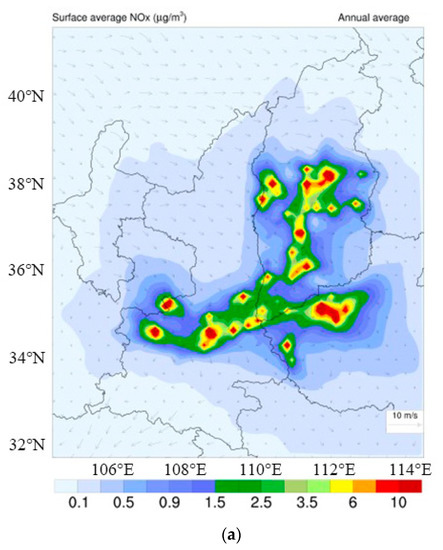
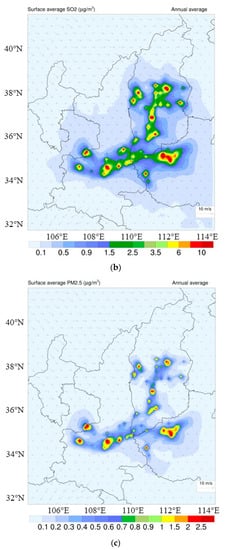
Figure 16.
Contribution of air pollutants emitted by the thermal power industry on the Fen-Wei Plain to ambient concentration in the historical scenario in terms of incremental concentrations: (a) NOX, (b) SO2, and (c) PM2.5.
From the species perspective, we find that between 2015 and 2018, the annual emissions of SO2, NOX, and PM2.5 by the thermal power industry on the Fen-Wei Plain decreased by 32.29, 17.48, and 4.34 Gg, respectively, and that the reduction rates were 56.82%, 27.44%, and 44.55%, respectively. Such substantial reduction in contributions is closely related to the stricter limiting values of the current standards, with levels of stringency across all processes, surpassing the previous standards by up to 30%, 50%, and 50% for SO2, NOX, and PM2.5, respectively (GB13223-2003). However, the NOX limit for the thermal power industry remains high. Therefore, technological improvements could have great potential regarding the control of NOX emission by the thermal power industry in the future. It is worth noting that although the absolute cut in NOX emission is relatively large, the reduction proportion is the smallest of the main pollutants. In other words, the volume of NOX remains large and has a certain potential to reduce emissions. Therefore, the next step should focus on NOX emission reduction.
Taking SO2 as an example, the spatial distribution reveals that Luoyang, Linfen, and Jinzhong were the three areas with the largest cuts in emissions with reductions of 9.89, 5.98, and 5.63 Gg, respectively. Conversely, the emissions in Lvliang increased rather than decreased. Therefore, Lvliang provides targeted opportunities for optimization and adjustment of the structure and layout of the regional thermal power industry to alleviate air pollutant emissions. The areas of Weinan, Xi’an, and Xianyang showed the highest emission reduction ratios (i.e., 83.80%, 83.01%, and 77.49%, respectively) with relatively small reductions. Thus, for these three cities, the scale control and pollutant control of the regional thermal power industry are better.
4. Conclusions
This study marked the first attempt to simulate the contribution of the thermal power industry on the Fen-Wei Plain to air quality at the regional scale. The high-resolution HPEC emissions inventory was introduced to the CAMX model to systematically explore the contribution of the main pollutant emissions to air quality. The simulation results indicated the following. (1) From the spatial perspective, the air quality contributions were highly concentrated in the Shanxi and Henan areas with high levels of power generation. (2) Among the main pollutants, NOX made the largest contribution to air quality. (3) From the temporal perspective, the largest (smallest) contribution to air quality concentrations occurred in summer (winter). (4) In terms of policy evaluation, the results verified the efficacy of the current standards implemented in 2014, which have resulted in a substantial reduction in the contribution to air quality by 12.99–47.79%.
Many related topics require further investigation in future research. First, investigation of the public health impact of the thermal power industry would be an insightful extension. Second, it is important to explore the effects of local GDP, the proportion of tertiary industry, meteorological diffusion conditions, and other factors regarding the contribution of the thermal power industry to ambient air quality. We will continue to research the impact of air pollutants associated with the thermal power industry on the Fen-Wei Plain.
Author Contributions
L.C.: Conceptualization, Project administration, Funding acquisition; T.W.: Writing—Original Draft, Supervision; X.B.: Methodology, Funding acquisition; Z.Z.: Resources; J.Q.: Writing—Review & Editing; X.X.: Writing; J.T.: Methodology; M.H.: Validation; P.W.: Data Curation; M.S.: Visualization. In addition, X.B. and J.T. are responsible for ensuring that the descriptions are accurate and agreed by all authors. All authors have read and agreed to the published version of the manuscript.
Funding
This work is supported by grants from the National Natural Science Foundation of China (No. 72174125) and Fundamental Research Funds for the Central Universities (buctrc202133). This work is supported by grants from Shaanxi Provincial Key Research and Development Program (No.2021SF-501 and No.2021SF-498).
Institutional Review Board Statement
Not applicable.
Informed Consent Statement
Not applicable.
Data Availability Statement
Not applicable.
Acknowledgments
Thanks to everyone who contributed to this article.
Conflicts of Interest
The authors declare not conflicts of interest.
References
- National Bureau of Statistics. China Statistical Yearbook. Available online: http://www.stats.gov.cn/tjsj/ndsj/2019/indexch.htm (accessed on 7 February 2022).
- Ministry of Ecology and Environment the People’s Republic of China. China Environmental Statistics Annual Report. Available online: http://www.mee.gov.cn/hjzl/sthjzk/sthjtjnb/ (accessed on 3 February 2022).
- Zeng, M.; Zhang, P.; Yu, S.K.; Liu, H. Overall review of the overcapacity situation of China’s thermal power industry: Status quo, policy analysis and suggestions. Renew. Sustain. Energy Rev. 2017, 76, 768–774. [Google Scholar] [CrossRef]
- Bo, X.; Xue, X.; Xu, J.; Du, X.; Zhou, B.; Tang, L. Aviation’s emissions and contribution to the air quality in China. Atmos. Environ. 2019, 201, 121–131. [Google Scholar] [CrossRef]
- Ministry of Ecology and Environment of the People’s Republic of China. Work Plan of Full Implementing Ultra-Low Emission Policy and Energy Saving Transformation for Coal-Fired Power Plants. Available online: https://www.mee.gov.cn/gkml/hbb/bwj/201512/t20151215_319170.htm (accessed on 19 February 2022).
- Ministry of Ecology and Environment of the People’s Republic of China. Upgrade and Retrofit Plan for Coal-Fired Power Plants Aiming at Energy Savings and Emissions Reduction for 2014–2020. Available online: https://www.mee.gov.cn/gkml/hbb/gwy/201409/t20140925_289556.htm (accessed on 19 February 2022).
- Wang, X.Y.; Lei, Y.; Yan, L.; Liu, T.; Zhang, Q.; He, K.B. A unit-based emission inventory of SO2, NOx and PM for the Chinese iron and steel industry from 2010 to 2015. Sci. Total Environ. 2019, 676, 18–30. [Google Scholar] [CrossRef] [PubMed]
- Li, X.M.; Xie, P.H.; Li, A.; Xu, J.; Ren, H.M.; Ren, B.; Li, Y.Y.; Li, J. Study of aerosol characteristics and sources using MAX-DOAS measurement during haze at an urban site in the Fenwei Plain. J. Environ. Sci. 2021, 107, 1–13. [Google Scholar] [CrossRef]
- Dong, Z.; Li, L.; Lei, Y.; Wu, S. The economic loss of public health fromPM2.5 pollution in the Fenwei Plain. Environ. Sci. Pollut. Res. 2020, 28, 2415–2425. [Google Scholar] [CrossRef]
- Li, X.; Xia, J. Analysis of the Transformation of Production Factors in the Economic Transition in the Yangtze River Delta. Transit. Yangtze River Delta 2015, 5, 145–158. [Google Scholar] [CrossRef]
- Tang, L.; Qu, J.B.; Mi, Z.F.; Bo, X.; Chang, X.Y.; Anadon, L.D.; Wang, S.Y.; Xue, X.D.; Li, S.B.; Wang, X.; et al. Substantial emission reductions from Chinese power plants after the introduction of ultra-low emissions standards. Nat. Energy 2019, 4, 929–938. [Google Scholar] [CrossRef]
- Xue, W.; Xu, Y.; Wang, J.; Tang, X. Ambient air quality impact of emissions from thermal power industry. China Environ. Sci. 2016, 36, 1281–1288. [Google Scholar] [CrossRef]
- Zhang, Y.; Bo, X.; Zhao, Y.; Nielsen, C.P. Benefits of current and future policies on emissions of China’s coalfired power sector indicated by continuous emission monitoring. Environ. Pollut. 2019, 251, 415–424. [Google Scholar] [CrossRef]
- Tong, D.; Zhang, Q.; Davis, S.J.; Liu, F.; Zheng, B.; Geng, G.N.; Xue, T.; Li, M.; Hong, C.P.; Lu, Z.F.; et al. Targeted emission reductions from global super-polluting power plant units. Nat. Sustain. 2018, 1, 59–68. [Google Scholar] [CrossRef] [Green Version]
- Yang, H.; Zhang, Y.X.; Zheng, C.H.; Wu, X.C.; Chen, L.H.; Fu, J.S.; Gao, X. Cost estimate of the multi-pollutant abatement in coal-fired power sector in China. Energy 2018, 161, 523–535. [Google Scholar] [CrossRef]
- Guttikunda, S.K.; Jawahar, P. Atmospheric emissions and pollution from the coal-fired thermal power plants in India. Atmos. Environ. 2014, 92, 449–460. [Google Scholar] [CrossRef]
- Kondo, A.; Shimadera, H.; Chinzaka, M. Impact on Air Quality by Increase in Air Pollutant Emissions from Thermal Power Plants. Int. J. Geomate 2017, 12, 50–56. [Google Scholar] [CrossRef]
- Yi, P.; Duan, N.; Xu, Y.; Yu, H. Effects of Coal-Fired Thermal Power Industry Development on the Atmospheric Environment in the Chengdu-Chongqing Economic Zone. Res. Environ. Sci. 2012, 25, 1107–1114. [Google Scholar] [CrossRef]
- Du, X.; Xu, J.; Liu, H.; Liu, J.; He, Y.; Dang, H.; Meng, F. Contribution of Power Plant Emissions to PM2.5 during Heavy Pollution Periods. Res. Environ. Sci. 2016, 29, 475–482. [Google Scholar] [CrossRef]
- Bo, X.; Wang, G.; Wen, R.; He, Y.; Ding, F.; Wu, C.; Meng, F. Air pollution effect of the thermal power plants in Beijing-Tianjin-Hebei region. China Environ. Sci. 2015, 35, 364–373. [Google Scholar]
- Chen, B.X. Emission Characteristics of the Thermal Power Industry in Beiiing-TianJin-Hebei Region and Its Impact on the Air Quality; Zhe Jiang University: Hangzhou, China, 2016. [Google Scholar]
- Zhou, C.Y. Emission Characteristics of the Main Coal-Consumption Industries in Beiiing-TianJin-Hebei Region and its Impact on Hazy; Zhe Jiang University: Hangzhou, China, 2018. [Google Scholar]
- Wang, L.; Li, P.; Yu, S.; Mehmood, K.; Li, Z.; Chang, S.; Liu, W.; Rosenfeld, D.; Flagan, R.C.; Seinfeld, J.H. Predicted impact of thermal power generation emission control measures in the Beijing-TianjinHebei region on air pollution over Beijing, China. Sci. Rep. 2018, 8, 934–943. [Google Scholar] [CrossRef]
- Tian, Y.; Shen, H. Temporal and Spatial Evolution of Industrial Development and Air Pollutant Emission in Jiangsu Province. Environ. Monit. 2017, 9, 1674–6732. [Google Scholar] [CrossRef]
- Zhao, X.; Zhu, F.; Wang, S.; Sun, X.; Xu, J. Simulation Study of the Impacts of Ultra-low Emission Implemented in Thermal Power Plants on PM2.5 Mass Concentration in Ambient Air of Jiangsu Province. Electr. Power 2019, 52, 167–172. [Google Scholar] [CrossRef]
- Kan, H.; Bo, X.; Qu, J.; Yang, C.; Wu, P.; Tian, F.; Mo, H.; Zhao, X.; Zhou, X. Air quality impacts of power plant emissions in Hainan Province, 2015. China Environ. Sci. 2019, 39, 428–439. [Google Scholar] [CrossRef]
- Qu, J.; Wang, P.; Bo, X.; Xue, X.; Dong, G.; Cui, L.; Kang, M.; Wang, T.; Tang, L.; Zhu, F.; et al. Inventory and Distribution Characteristics of China’s Thermal Power Emissions Under Ultra-Low Reconstruction. Environ. Sci. Technol. 2020, 41, 3969–3975. [Google Scholar]
- Ministry of Ecology and Environment of the People’s Republic of China. Technical Guidelines for Environmental Impact Assessment—Atmospheric Environment. Available online: https://www.mee.gov.cn/ywgz/fgbz/bz/bzwb/other/pjjsdz/201808/t20180814_451386.shtml (accessed on 15 February 2022).
- Uarporn, N.; Zhen, L.; Till, S.; Greg, Y. Modeling intercontinental transport of ozone in North America with CAMx for the Air Quality Model Evaluation International Initiative (AQMEII) Phase 3. Atmos. Chem. Phys. 2017, 17, 9931–9943. [Google Scholar] [CrossRef] [Green Version]
- Tang, L.; Xue, X.D.; Jia, M.; Jing, H.; Wang, T.; Zhen, R.Q.; Huang, M.T.; Tian, J.; Guo, J.; Li, L.; et al. Iron and steel industry emissions and contribution to the air quality in China. Atmos. Environ. 2020, 237, 117668. [Google Scholar] [CrossRef]
- Cui, J.; Qu, J.; Bo, X.; Chang, X.; Feng, X.; Mo, H.; Li, S.; Zhao, Y.; Zhu, F.; Ren, Z. High resolution power emission inventory for China based on CEMS in 2015. China Environ. Sci. 2018, 38, 2062–2074. [Google Scholar] [CrossRef]
Publisher’s Note: MDPI stays neutral with regard to jurisdictional claims in published maps and institutional affiliations. |
© 2022 by the authors. Licensee MDPI, Basel, Switzerland. This article is an open access article distributed under the terms and conditions of the Creative Commons Attribution (CC BY) license (https://creativecommons.org/licenses/by/4.0/).