Article

Influence of Ambient Atmospheric Environments on the Mixing State and Source of Oxalate-Containing Particles at Coastal and Suburban Sites in North China

1
Key Laboratory of Physical Oceanography, College of Oceanic and Atmospheric Sciences, Ocean University of China, Qingdao 266100, China
2
Guangdong Provincial Engineering Research Center for On-Line Source Apportionment System of Air Pollution, Institute of Mass Spectrometry and Atmospheric Environment, Jinan University, Guangzhou 510632, China
3
Key Lab of Marine Environmental Science and Ecology, Ministry of Education, Ocean University of China, Qingdao 266100, China
4
Environment Research Institute, Shandong University, Qingdao 266237, China
*
Authors to whom correspondence should be addressed.
Atmosphere 2022, 13(5), 647; https://doi.org/10.3390/atmos13050647
Submission received: 20 March 2022 / Revised: 14 April 2022 / Accepted: 15 April 2022 / Published: 20 April 2022
(This article belongs to the Section Air Quality)

Abstract

:
Photodegradation is a key process impacting the lifetime of oxalate in the atmosphere, but few studies investigated this process in the field due to the complex mixing and sources of oxalate. Oxalate-containing particles were measured via single-particle aerosol mass spectrometry at coastal and suburban sites in Qingdao, a coastal city in North China in the summer of 2016. The mixing state and influence of different ambient conditions on the source and photodegradation of oxalate were investigated. Generally, 6.3% and 12.3% of the total particles (by number) contained oxalate at coastal and suburban sites, respectively. Twelve major types of oxalate-containing particles were identified, and they were classified into three groups. Biomass burning (BB)-related oxalate–K and oxalate–carbonaceous particles were the dominant groups, respectively, accounting for 68.9% and 13.6% at the coastal site and 72.0% and 16.8% at the suburban site. Oxalate–Heavy metals (HM)-related particles represented 14.6% and 9.3% of the oxalate particles at coastal and suburban sites, respectively, which were mainly from industrial emissions (Cu-rich, Fe-rich, Pb-rich), BB (Zn-rich), and residual fuel oil combustion (V-rich). The peak area of oxalate at the coastal site decreased immediately after sunrise, while it increased during the daytime at the suburban site. However, the oxalate peak area of Fe-rich particles at both sites decreased after sunrise, indicating that iron plays an important role in oxalate degradation in both environments. The decay rates (k) of Fe-rich and BB-Fe particles at the coastal site (−0.978 and −0.859 h−1, respectively), were greater than those at the suburban site (−0.512 and −0.178 h−1, respectively), owing to the high-water content of particles and fewer oxalate precursors. The estimated k values of oxalate peak area for different ambient conditions were in the same order of magnitude, which can help establish or validate the future atmospheric models.

1. Introduction

Carboxylic acids are important organics in the troposphere. Dicarboxylic acids have high water solubility owing to the existence of two carboxyl groups and mainly exist as liquid and particles in the atmosphere [1,2]. Oxalate is the most abundant dicarboxylic acid in atmospheric aerosols. Oxalate can affect the properties of cloud condensation nuclei and ice nuclei and thus influence the cloud formation, and earth radiation balance [3,4,5,6].
Oxalate can be produced via the heterogeneous oxidation and aqueous oxidation of volatile organic compounds (VOCs) and emitted directly from biomass combustion, fossil fuel combustion, and vehicle exhaust [2,6,7,8,9]. Glyoxal, glyoxylic acid, pyruvic acid, methylglyoxal, and other intermediates produced by VOCs oxidation are important organic precursors of oxalate [10,11,12]. Several factors affect the formation of aqueous-phase oxalate, including relative humidity and liquid water content [10,13,14]. Moreover, oxalate is mixed with secondary species (e.g., sulfate, nitrate, and ammonium), metals, and black carbon in the atmosphere, which may further affect the formation of aqueous-phase oxalate and the hygroscopicity of oxalate particles [15].
Numerous studies have been conducted on oxalate production and degradation in atmospheric particulate matter, focusing on the mixing of oxalate and transition metals, especially iron (Fe) [6,10,16,17,18]. Fe can accelerate the production of OH radicals by Fenton reaction, thereby facilitating the oxidation of oxalate organic precursors to oxalate [17,19]. Moreover, Fe has an important effect on oxalate degradation. Several studies have shown that during the daytime, the decrease in the oxalate concentration in cloud droplets is related to the increase in Fe concentration [20,21]. Modeling results have shown that the photoreduction of the oxalate–Fe (III) complex may account for 99% of the total oxalate degradation and is thus the main oxalate sink [10,22]. However, the model study including the degradation process usually underestimated the particulate oxalate concentration [22], indicating parameters obtained from the bulk cloud water may not properly assess the processes in deliquescent particles [6]. In the past decade, online mass spectrometry has been widely developed in China. Single-particle aerosol mass spectrometry (SPAMS) can be used to monitor the size and composition mixing state of individual aerosol particles and semi-quantitatively analyze the change in particle composition [23]. The photolysis mechanism and subsequent reaction of oxalate–Fe (III) in several regions, including Guangzhou and Hong Kong, have also been studied [15,17,24]. In our previous study on oxalate-containing particles in Hong Kong, we combined single-particle and bulk measurements for the first time. The results showed that Fe considerably influenced oxalate degradation after sunrise, and oxalate concentration was reduced by approximately 20% through Fe-mediated photochemical degradation [6]. In addition, the decay of oxalate in different mixing state varied a lot, which largely explained the bulk measurements based on the mixed concentrations of oxalate and iron may overestimate their effects. These studies highlight the importance to study the decay rates of oxalate with different mixing states in variable ambient environments.
Qingdao is located at the southern tip of the Shandong Peninsula in North China and is adjacent to the Yellow Sea in the southeast, which is an important transport channel for East Asian and polluted anthropogenic atmospheric particles to the Northwest Pacific Ocean. In this study, oxalate particles at one coastal site (LiuqingHe Scenic Spot [LQH]) and one suburban site (the Ocean University of China [OUC]) in Qingdao were measured via SPAMS during the summer of 2016. Unlike Hong Kong, as a northern coastal city, Qingdao showed a different ambient environment, that the sources and process of oxalate particles experienced may be distinct in these three sites, which provides indications about the spatial variability. The similarities and differences in the mixing states, sources, and diurnal degradation of oxalate-containing particles containing heavy metals (HMs) detected at the two sites were analyzed.

2. Experimental Section

2.1. Sampling

The two sampling sites were located at LQH (36.13° N, 120.62° E) and OUC (36.17° N, 120.50° E), separated by approximately 11.4 km (Figure S1). LQH is a typical seaside station located beside the main road and only 100 m from the ocean, while OUC is a typical suburban station located along a main road and surrounded by many small restaurants.
The individual particles at LQH were measured online using a single-particle aerosol mass spectrometer (Hexin Analytical Instrument Co., Ltd., Guangzhou, China) from 7 to 17 August 2016, while those at OUC were measured from 19 to 23 August and from 31 August to 7 September 2016. During the whole sampling campaign at the LQH site, the average T and RH were 28.5 °C and 87.2%, with ranges of 25.0–33.7 °C and 42.0–99.0%, respectively. OUC site showed a similar average T (27.4 °C), but much less RH (71.1%). The WS is similar at these two sites, with the average WS being 1.7 and 1.3 m/s at LQH and OUC, respectively.

2.2. Online Instruments and Data Analysis

The detection methods and principles of SPAMS have been previously reported in detail [23]. Briefly, a single-particle aerosol mass spectrometer mainly consists of an aerodynamic lens, laser system, and bipolar time-of-flight mass spectrometer. During sampling, the inlet was set at a height of 4 m on a roof of a container at the coastal site, and 8 m on an academic building at the suburban site. The atmospheric particles were dried by a drying tube before entering the instrument. Then, the dry particles were introduced into the spectrometer using an aerodynamic lens. The particles were focused onto the centerline of the inlet, and they achieved a specific velocity when exiting the aerodynamic lens. The particles entered a laser system consisting of two continuous-mode diodes (neodymium-doped yttrium aluminum garnet [Nd:YAG]) laser beams (532 nm), and their aerodynamic diameters were calculated by the laser system. Finally, the particles that arrived at the bipolar time-of-flight mass spectrometer were desorbed/ionized by the Nd:YAG laser (266 nm). Subsequently, the positive and negative ions were detected using the bipolar time-of-flight mass spectrometer. The vacuum aerodynamic diameter (dva) of the measured individual aerosol particles was calibrated using standard polystyrene latex spheres with diameters of 0.2–2.0 μm.
The single-particle mass spectrum data were processed using the YAADA2.1 toolkit (www.yaada.org, accessed on 30 September 2016), which is based on MATLAB. Moreover, 6,364,529 and 7,319,747 particles were collected from the LQH and OUC sites, respectively, of which 670,887 and 1,718,778 were chemically analyzed to obtain both positive and negative ion spectra. Oxalate-containing particles were identified by a marker ion of m/z −89[HC2O4] according to a relative peak area (RPA) of >0.5% [2,10,25]. According to this definition, 42,226 and 211,180 oxalate-containing particles were obtained, accounting for 6.3% and 12.3% of the total particles at LQH and OUC sites, respectively. These mass spectra of the oxalate-containing particles were classified according to the adaptive resonance theory based on a neural network algorithm (ART-2a), with a learning rate of 0.05, a vigilance factor of 0.7, and 20 iterations. The ART-2a is an effective way to intelligently find clustering in a data set with a large number of variables [26]. In this study, the ART-2a procedure automatically generated 651 clusters of particles based on the presence and intensity of ion peaks. The first 252 clusters, representing over 98% of all of the ionized oxalate-containing particles, were considered important and further classified into 12 major groups according to mass spectrum similarities, particle size distributions, and temporal variations. The clusters that could not be manually classified were labeled “undefined”.

2.3. Screening of Five HM-Containing Particles

Owing to the higher abundance, and considering their stability constant and solubility of HM complexed with oxalate-containing particles, this study focused on Fe, V, Cu, Zn, and Pb ions [6]. Fe-containing particles were screened according to a peak area (PA) of m/z 56 > 50 and a PA ratio of 56[Fe]+/54[Fe]+ > 3 [6,10,27]. The V-containing particles were identified by the marker ions 51[V]+ (PA > 50) and 67[VO]+ [6,10,28,29]. The Cu-containing particles were identified by the marker ions 63[Cu]+ (PA > 50) and 65[Cu]+ [6,10,23]. The Zn-containing particles were identified by the marker ions 64[Zn]+ (PA > 50) and 66[Zn]+ [6,10,30]. The Pb-containing particles were identified by the marker ion 208[Pb]+ (PA > 50) [6,10,31,32].

3. Results and Discussion

3.1. General Characteristics of SPAMS Particles

The particle statistics of the individual metals are listed in Table 1. Of the total particles (by number) at the LQH sampling site, 6.3% contained oxalate, while 3.4%, 6.4%, 3.4%, 1.7%, and 0.5% contained Fe, V, Cu, Pb, and Zn, respectively. The proportion of oxalate-containing particles at OUC (12.3%) was considerably higher than that at LQH. Likewise, the proportion of HM-containing particles was higher, except for V-containing particles [33,34].
Furthermore, 30.1% and 25.3% of the oxalate-containing particles at LQH and OUC were associated with the abovementioned five HMs. At LQH, Fe was the most abundant HM (by particle number) associated with oxalate-containing particles, accounting for 36.4% of the oxalate-HM particles, followed by Cu (28.4%), V (28.3%), Pb (24.7%), and Zn (8.7%). In contrast, at OUC, Cu was the most abundant HM (by particle number), accounting for 40.4% of the oxalate-HM particles, followed by Fe (31.1%), V (28.9%), Pb (17.7%), and Zn (14.6%). The mixing states of oxalate with HMs at these sites differed from those of cities in South China. In Hong Kong and Guangzhou, Pb was the most abundant HM (by particle number), accounting for 47.7% and 32.0% of the oxalate-HM particles, respectively [6,10]. The different ambient atmospheric environments, e.g., industry and energy consumption structures, may cause the variable mixing states of oxalate and HMs in different regions.

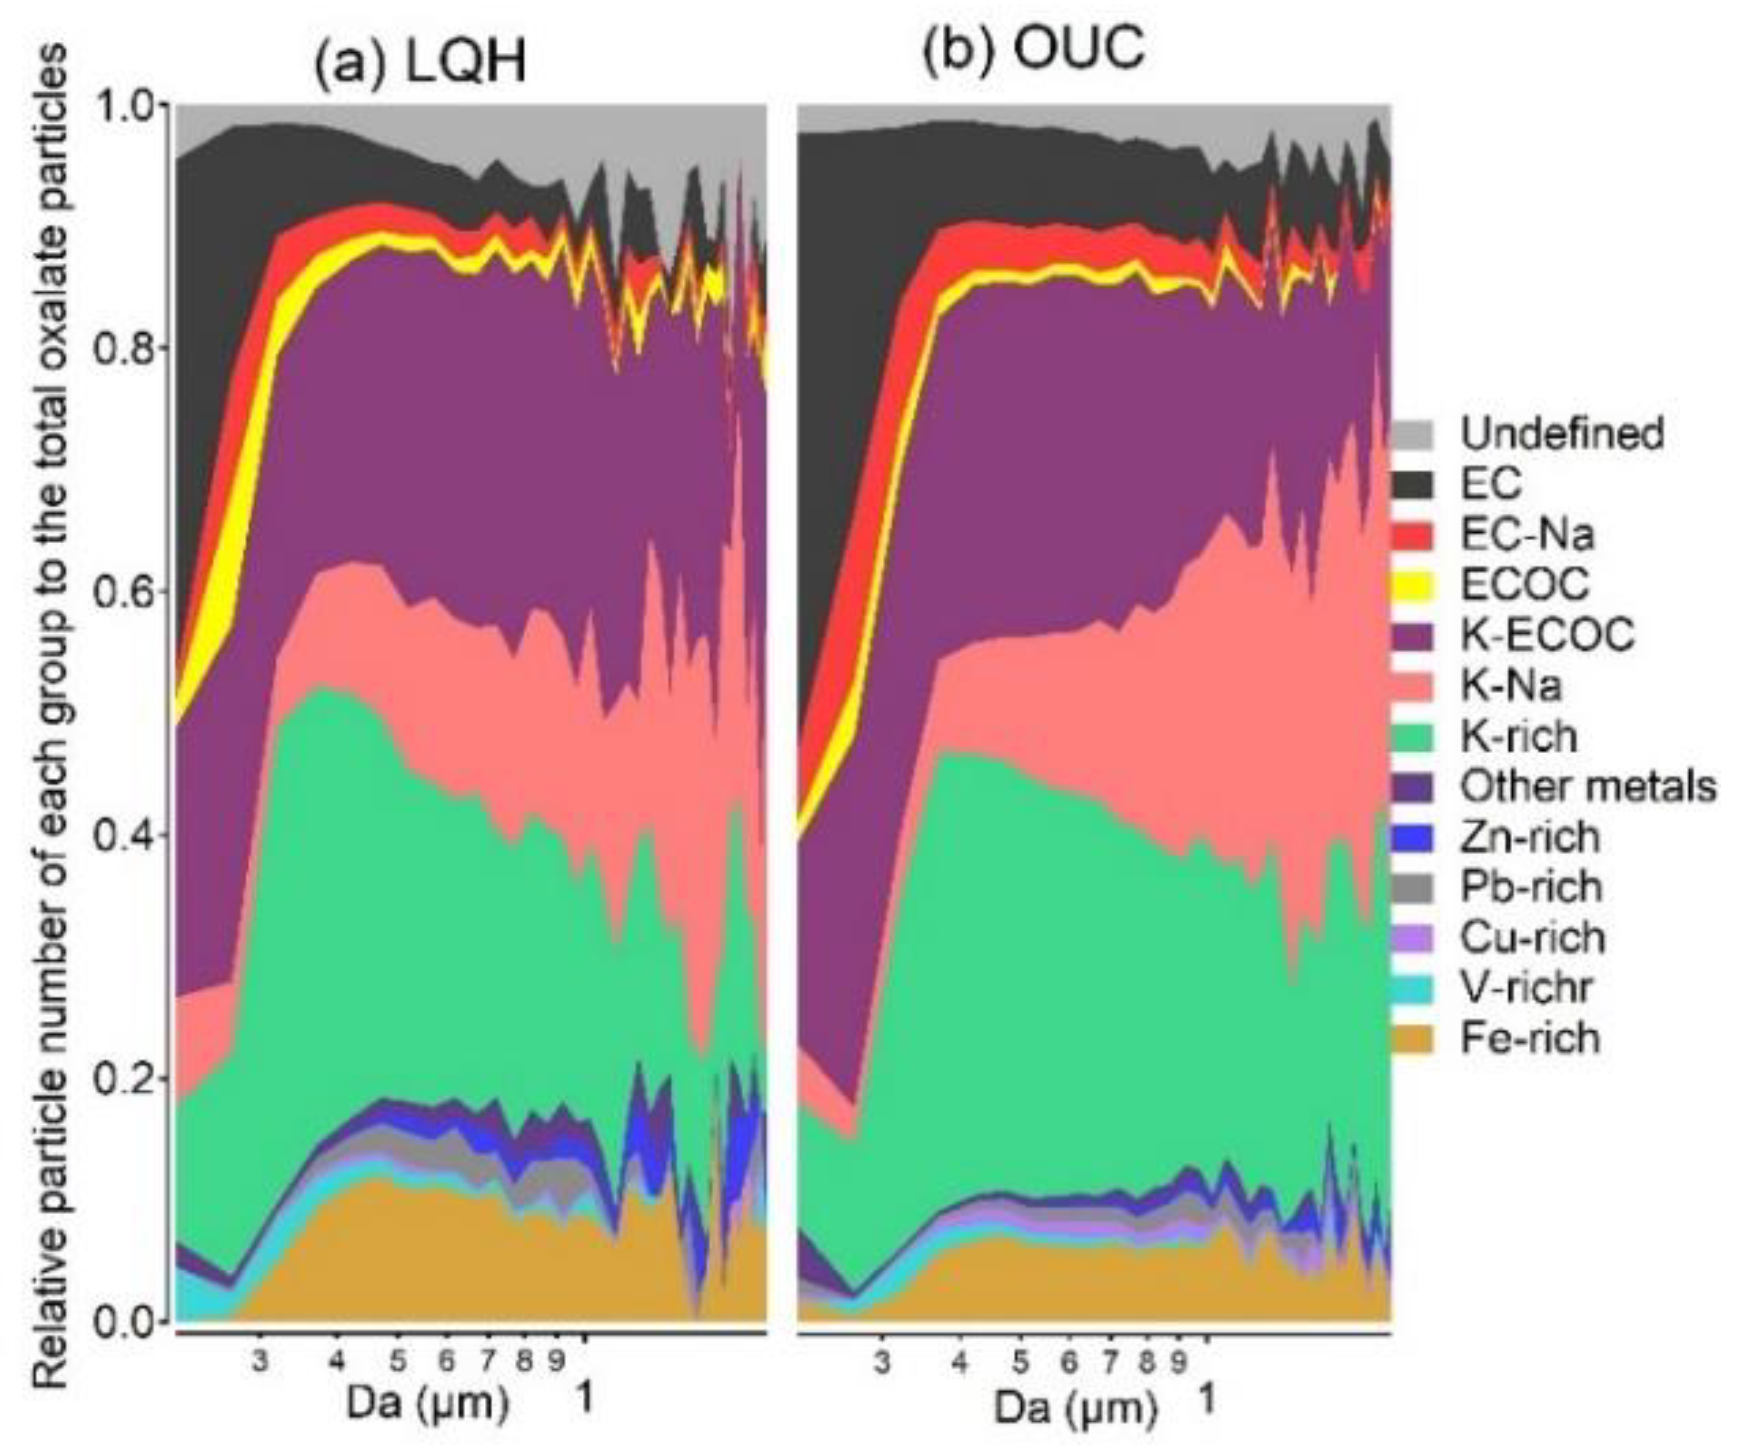
3.2. Individual Characteristics of Oxalate-Containing Particles

To identify the characteristics and sources of individual oxalate-containing particles, we separated the oxalate particles into 12 major groups. Table 2 presents the statistics of the classified groups of oxalate particles. The average spectra of these 12 major groups and the undefined group can be found in Figure S2. Figure 1 shows the size-resolved contributions of each group to the total oxalate particles (by particle number). The temporal trends of the meteorological factors and the number fraction of various oxalate-containing particle groups during the sampling period at LQH and OUC are shown in Figure 2a,b, respectively. The time series of the percent contributions by individual groups to total particle number at LQH and OUC are shown in Figure S3a,b, respectively. The number fractions of selected ion markers associated with single-particle types at LQH and OUC are shown in Figure S4a,b, respectively.
Here, we briefly introduce the mass spectra of the 12 oxalate groups, as previous studies have already identified similar particle types and discussed their composition in detail [6,10,35,36,37,38].
Oxalate–K-related particles
The positive spectra of K-rich, K–Na, and K-elemental carbon-organic carbon (K-ECOC) oxalate-related particles featured 39[K]+ as the highest ion peak (Figure S2). In addition, the positive spectrum of the K–Na particles featured 23[Na]+ as the second-highest ion peak, and that of K–ECOC particles featured typical elemental and organic carbon ion clusters (such as 12[C2]+, 36[C3]+, 27[C2H3]+ and 43[C2H3O]+). The negative spectra of the three oxalate–K-related particle types featured strong sulfate signals at −97[HSO4] and nitrate signals at −46[NO2] and −62[NO3]. The negative spectrum of the K–Na particles featured phosphate signals at −79[PO3].
These three oxalate–K-related groups were the dominant particles at both sites, accounting for 68.9% and 72.0% of the total particles at LQH and OUC, respectively (Table 2). In addition, the temporal variations in K-rich, K–Na, and K–ECOC particles were similar at both LQH and OUC sites (Figure S3). The particle size of K–Na particles was larger than K-rich and K–ECOC particles at both sites (Figure 1). Most of these three oxalate–K-related particles were mixed with CN, CNO, and levoglucosan (LEV) (Figure S4), which are considered good tracers for biomass burning (BB), suggesting that these three oxalate–K-related particles originated from BB [35,39,40,41]. In addition, this group of particles also showed a signal from −79[HPO4] (Figure S2), suggesting vegetative debris may be mixed during the biomass burning process [42].
Oxalate–carbonaceous-related particles
Three oxalate–carbonaceous-related particle types were identified. Elemental carbon (EC), EC–Na, and ECOC particles exhibited typical elemental carbon ion clusters (12[C]+/−, 24[C2]+/−, 36[C3]+/−, 48[C4]+/−, and 60[C5]+/−), with 36[C3]+ as the dominant fragment (Figure S2). The positive spectrum of the EC–Na particles featured an intense 23[Na]+, and the ECOC particles exhibited typical organic carbon ion clusters (such as 27[C2H3]+, 37[C3H]+, and 43[C2H3O]+). The negative spectra of these three oxalate–carbonaceous-related particles featured strong sulfate signals at −97[HSO4] and weak nitrate signals at −46[NO2] and −62[NO3].
Furthermore, these three oxalate–carbonaceous-related particle types accounted for 13.6% and 16.8% of the total particles at the LQH and OUC sites, respectively (Table 2). At both LQH and OUC, EC accounted for a more significant proportion of small particles than EC–Na and ECOC (Figure 1). At both LQH and OUC, the three oxalate–carbonaceous-related particle types exhibited a comparable temporal variation to the three oxalate–K-related particle types (Figure 2 and Figure S3), suggesting similar sources or atmospheric processes of both particle types. Moreover, most of the three oxalate–carbonaceous-related particles were mixed with CN, CNO, and LEV (Figure S4), which confirmed the existence of a BB emission source [35,39,41,43].
Oxalate–HM-related particles
The oxalate–HM particles included Fe-, V-, Pb-, Zn-, Cu-rich particles, and particles containing other metals. The positive spectrum of Fe-rich particles featured strong signals at 54/56[Fe]+ and some signals at 23[Na]+ and 39[K]+. The negative spectrum featured strong sulfate signals at −97[HSO4] and weak nitrate and phosphate signals at −46[NO2], −62[NO3], and −79[PO3]. Similar to the positive spectrum of Fe-rich particles, those of Pb- and Cu-rich particles featured strong signals at 208/209[Pb]+ and 63/65[Cu]+, respectively, with some signals at 23[Na]+ and 39[K]+. The negative spectrum featured strong sulfate signals at −97[HSO4] and weak nitrate signals at −46[NO2] and −62[NO3]. The positive spectrum of V-rich particles featured strong signals at 51[V]+ and 67[VO]+; weak signals at 23[Na]+, 27[Al]+/[C2H3]+, and 56[Fe]+; and elemental carbon signals (such as 12[C2]+ and 36[C3]+). The negative spectrum featured strong sulfate signals at −97[HSO4] and weak nitrate signals at −46[NO2] and −62[NO3]. The positive spectrum of Zn-rich particles featured strong signals at 64/66/68[Zn]+ and 99/101/103[ZnCl]+ and weak signals at 23[Na]+, 27[Al]+/[C2H3]+, 39[K]+, and 43[C2H3O]+. The negative spectrum featured strong nitrate and phosphate signals at −46[NO2], −62[NO3], and −79[PO3] and weak signals at −26[CN], −42[CNO], −35[Cl], −59/−73[LEV], and −97[HSO4]. The LEV signals suggest that some Zn-rich particles were from BB [44,45]. The positive spectra of other metal-containing particles featured signals at 27[Al]+, 40/56[Ca]+/[CaO]+, 52[Cr]+, and 55[Mn]+, while the negative spectra featured signals at −97[HSO4], −46[NO2], and −62[NO3].
At LQH and OUC, Fe-rich particles accounted for 8.8% and 5.7% of the total oxalate particles, respectively (Table 2). At both LQH and OUC, the time series of Fe-rich particles is different from these oxalate-K-related particle types (Figure 2 and Figure S3), suggesting that the Fe-rich particles may be from sources other than BB, such as industrial emissions [30,46]. In addition, most of the Fe-rich particles were also mixed with CN, CNO, and LEV (Figure S4), which may be due to the mixing between Fe particles and BB particles.
Compared with the contribution of Fe-rich particles, those of the V-, Pb-, Zn-, and Cu-rich groups were minor. At both LQH and OUC, Pb- and Cu-rich particles exhibited a comparable time series to Fe-rich particles, suggesting that they were from similar sources, such as industrial emissions [47,48,49,50,51]. The time series in Zn-rich particles was different from that in Fe-rich particles. Previous studies have found Zn-rich particles in emissions from waste incineration [52,53]. We also found high CN and LEV loadings in Zn-rich particles. Bulk measurements revealed relatively abundant Zn emissions from BB [44,45]. Moreover, 98% and 80% (by particle number) of Zn-rich particles exhibited LEV signals at LQH and OUC sites, respectively (Figure S4), suggesting that they were mostly related to BB. Compared to marine air mass, almost no V-rich particles occurred in the oxalate-containing particles during continental air mass control, suggesting that the V particles were mainly emitted by marine vessels through residual fuel oil combustion [28,29,34,42,54,55,56,57].
At the two sites, the overall contributions of different sources to oxalate were similar. However, at LQH, there were almost no oxalate-containing particles during marine air mass control (1.4% in Table S1), but 12.4% of the total particles were related to oxalate under continental air mass. At OUC, the number of oxalate particles during the continental air mass control period (13.4%) was approximately twice that during the marine-source air mass–dominated period (7.2%). The oxalate–K and oxalate–carbonaceous particles showed higher contributions during the continental air mass control period (Table S1). These findings suggest that the oxalate-containing particles at both sites were mainly from BB emission inland air masses. We also noticed at both LQH and OUC sites, that almost all oxalate particles mixed with sulfate and nitrate (Figure S4), suggesting a secondary formation of oxalate particles [6,15]. However, the OUC site had more abundant nitrate than LQH (Figures S2 and S4), indicating the suburban site was influenced by more human activity compared with that at the coastal site [58].

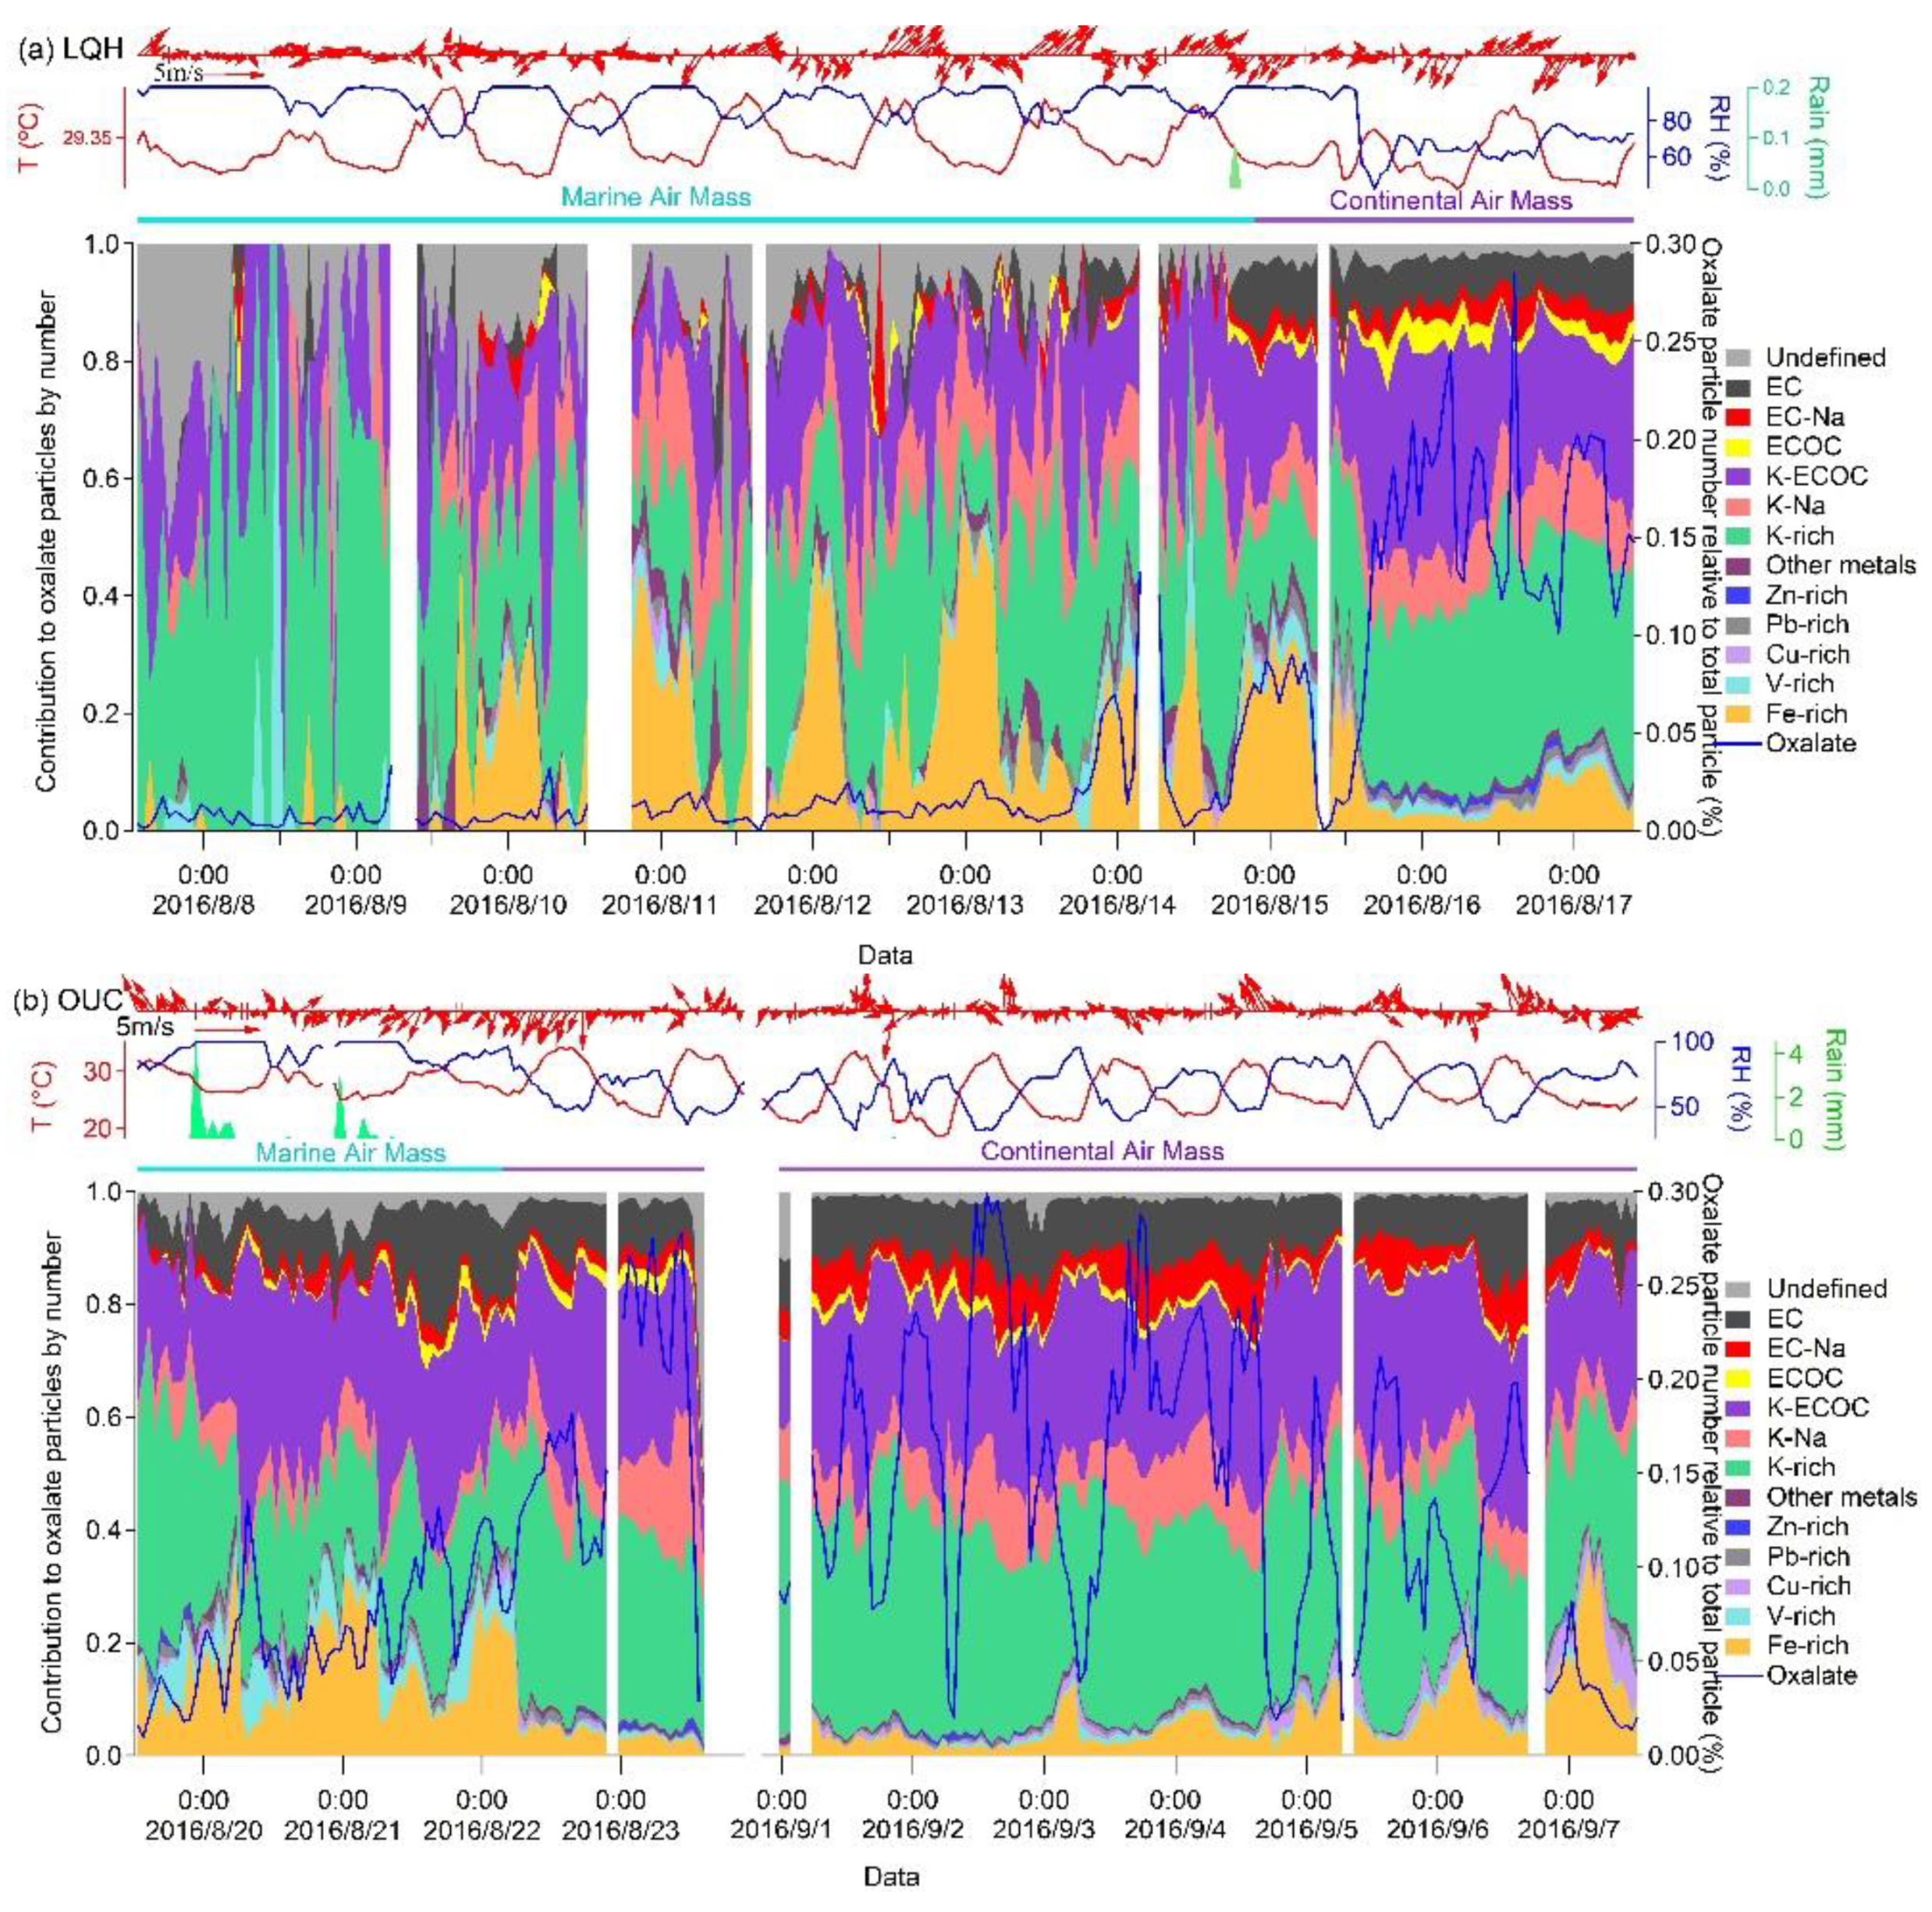
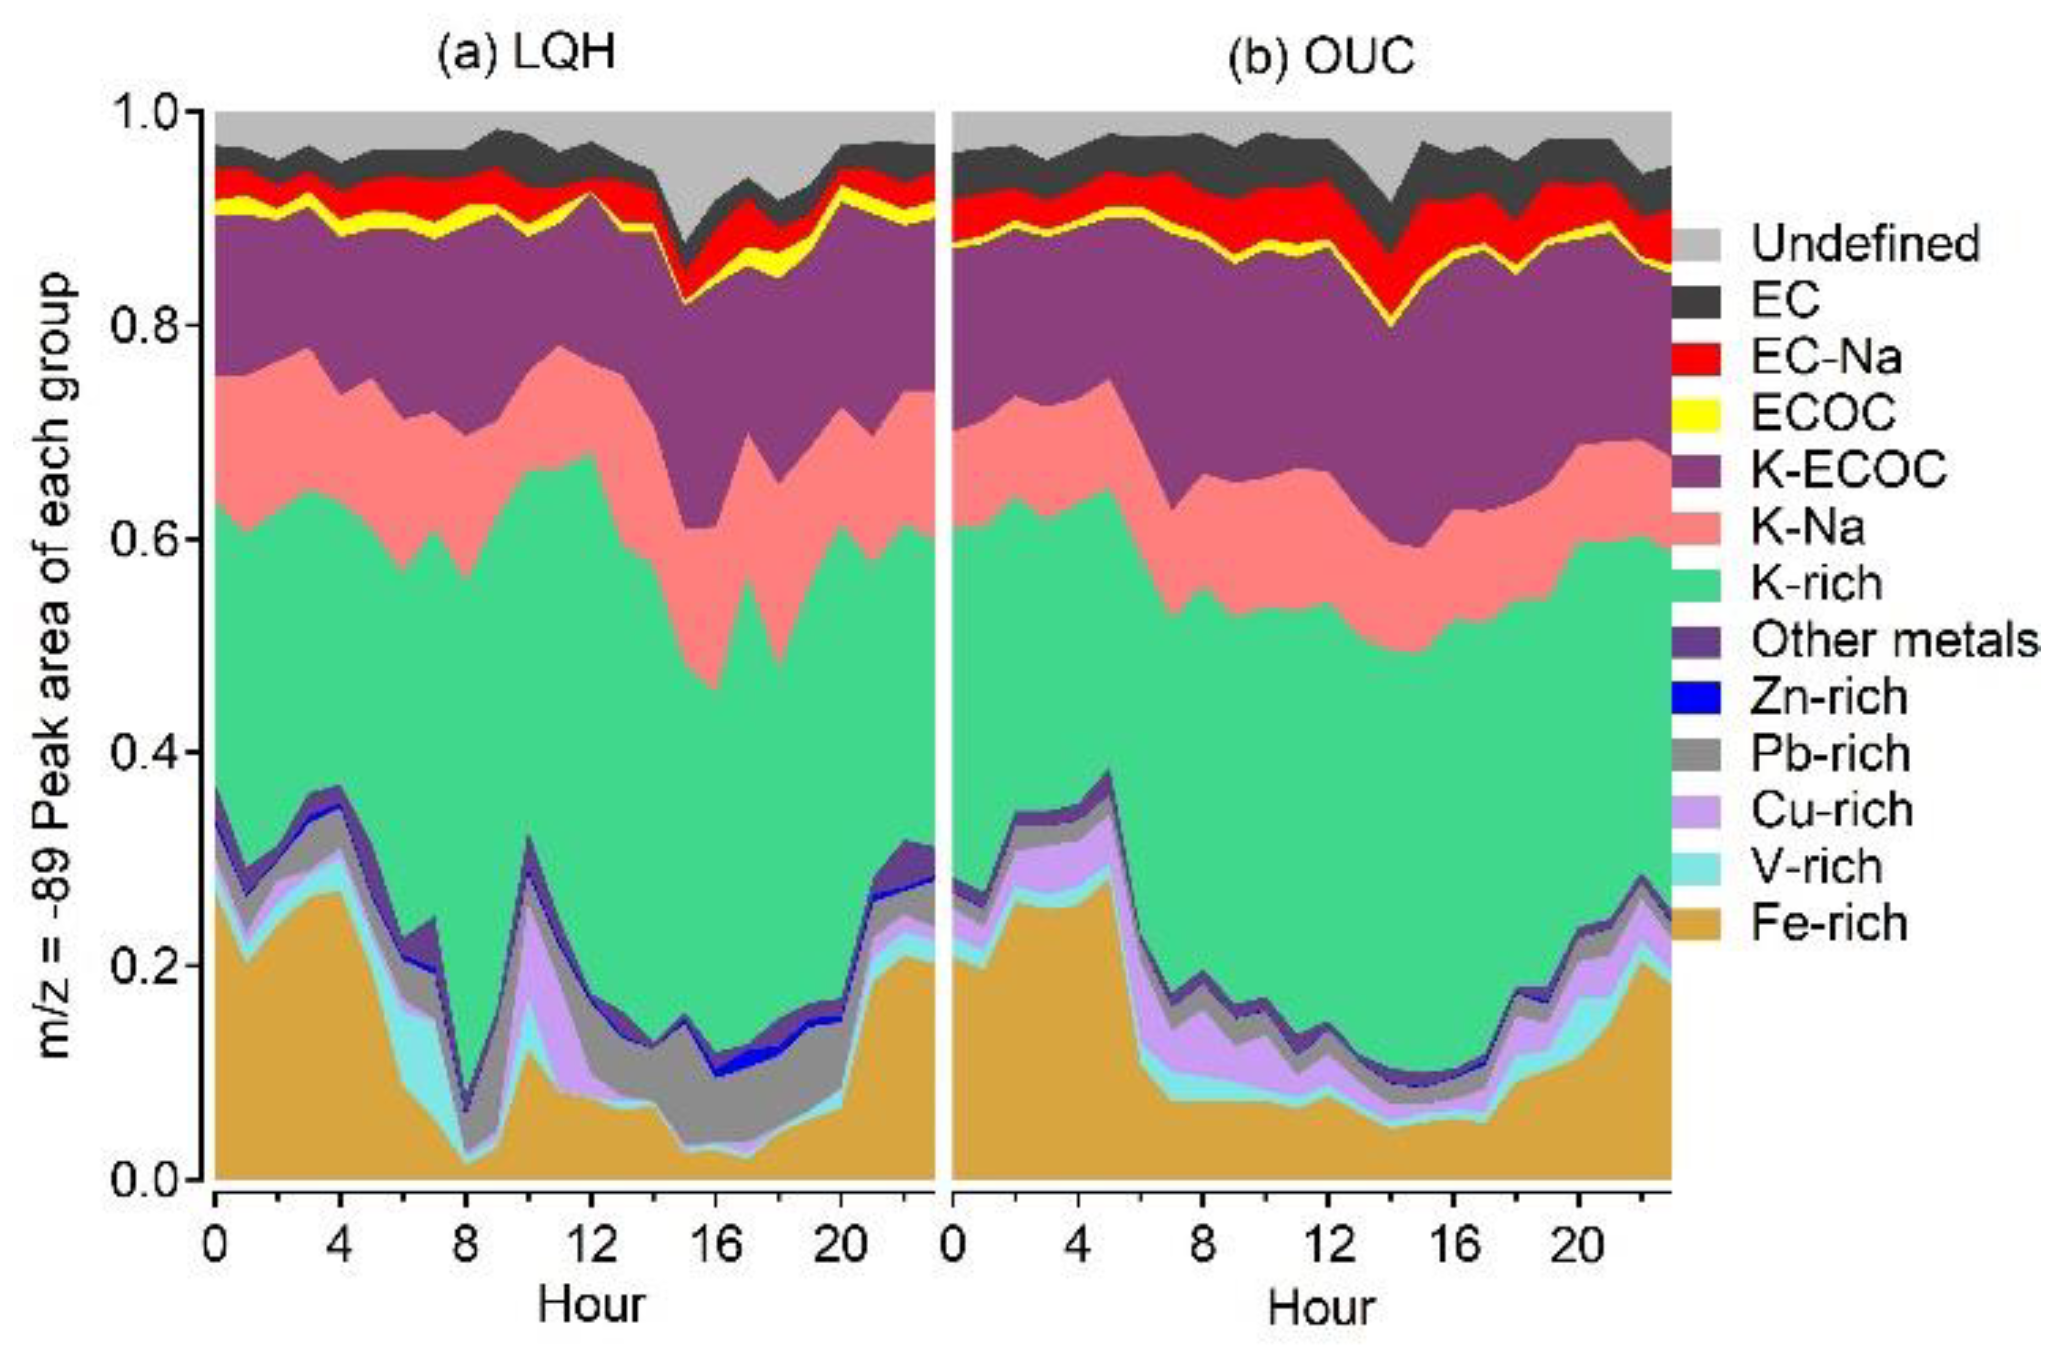
3.3. Diurnal Variation in Oxalate-Containing Particles

The average diurnal variations in meteorological parameters, particle number, and PA/RPA of oxalate-containing particles with m/z −89 are illustrated in Figure 3. The oxalate particle number, PA, and RPA showed similar diurnal variations; thus, we selected a PA of m/z −89 to illustrate the diurnal characteristics of oxalate-containing particles. The diurnal variation in oxalate at LQH was different from that at OUC. At the coastal site, the PA of oxalate decreased from 5:00 a.m. onwards after sunrise, which indicated that photodegradation was a key decay mechanism. The PA of oxalate at LQH began to increase from 10:00 a.m. onwards, and approximately 50% of oxalate was decomposed over 5 h. However, the PA of oxalate at OUC increased from 6:00 a.m. onwards, and the PA for daytime was broad. The difference in diurnal variation suggests a distinct source and decay process. A similar sharp decay of oxalate after sunrise has been reported in Hong Kong, which suggests that the oxalate source was limited to the rural coastal site, so that the formation rate was less than the decay rate (k), resulting in a considerable decrease in the number of oxalate particles [6]. In contrast, OUC is a typical suburban site with more human activity and small surrounding restaurants, resulting in the emission of a large number of oxalate-containing particles from BB/cooking [2,6,7,8,9]. Moreover, both sites showed a decrease in the number of oxalate-Fe-containing particles (Figure 3f); the particles at LQH decayed faster than those at OUC and were detected 1 h earlier. The sun rises earlier at LQH than at OUC, explaining the difference in the diurnal variations in oxalate–Fe particles at both sites under ambient conditions. Moreover, the abundant source of oxalate-containing particles at OUC due to the residential areas and small surrounding restaurants may be responsible for the difference in the total diurnal variations in the particles.
According to previous studies, PA provides more information than particle number and is recommended over RPA to track the variations in low-intensity species [5,6]. The average diurnal variations in the relative contributions to different classified oxalate groups of PA (m/z −89) are shown in Figure 4. The diurnal variations in oxalate particle number and RPA exhibited similar trends (Figures S7 and S8). At LQH, Fe-rich particles accounted for the main decrease in oxalate PA after sunrise (Figure 4). At OUC, although the PA of oxalate increased after sunrise owing to the contribution of oxalate–K-related particles, the oxalate PA in Fe-rich particles decreased, consistent with the trend for LQH. On average, the contribution of Fe-rich particles decreased from 27% to 1% and from 28% to 7% after sunrise at LQH and OUC, respectively. Similar diurnal variations were found in oxalate particle number and RPA (m/z = −89, SI Figures S7 and S8).

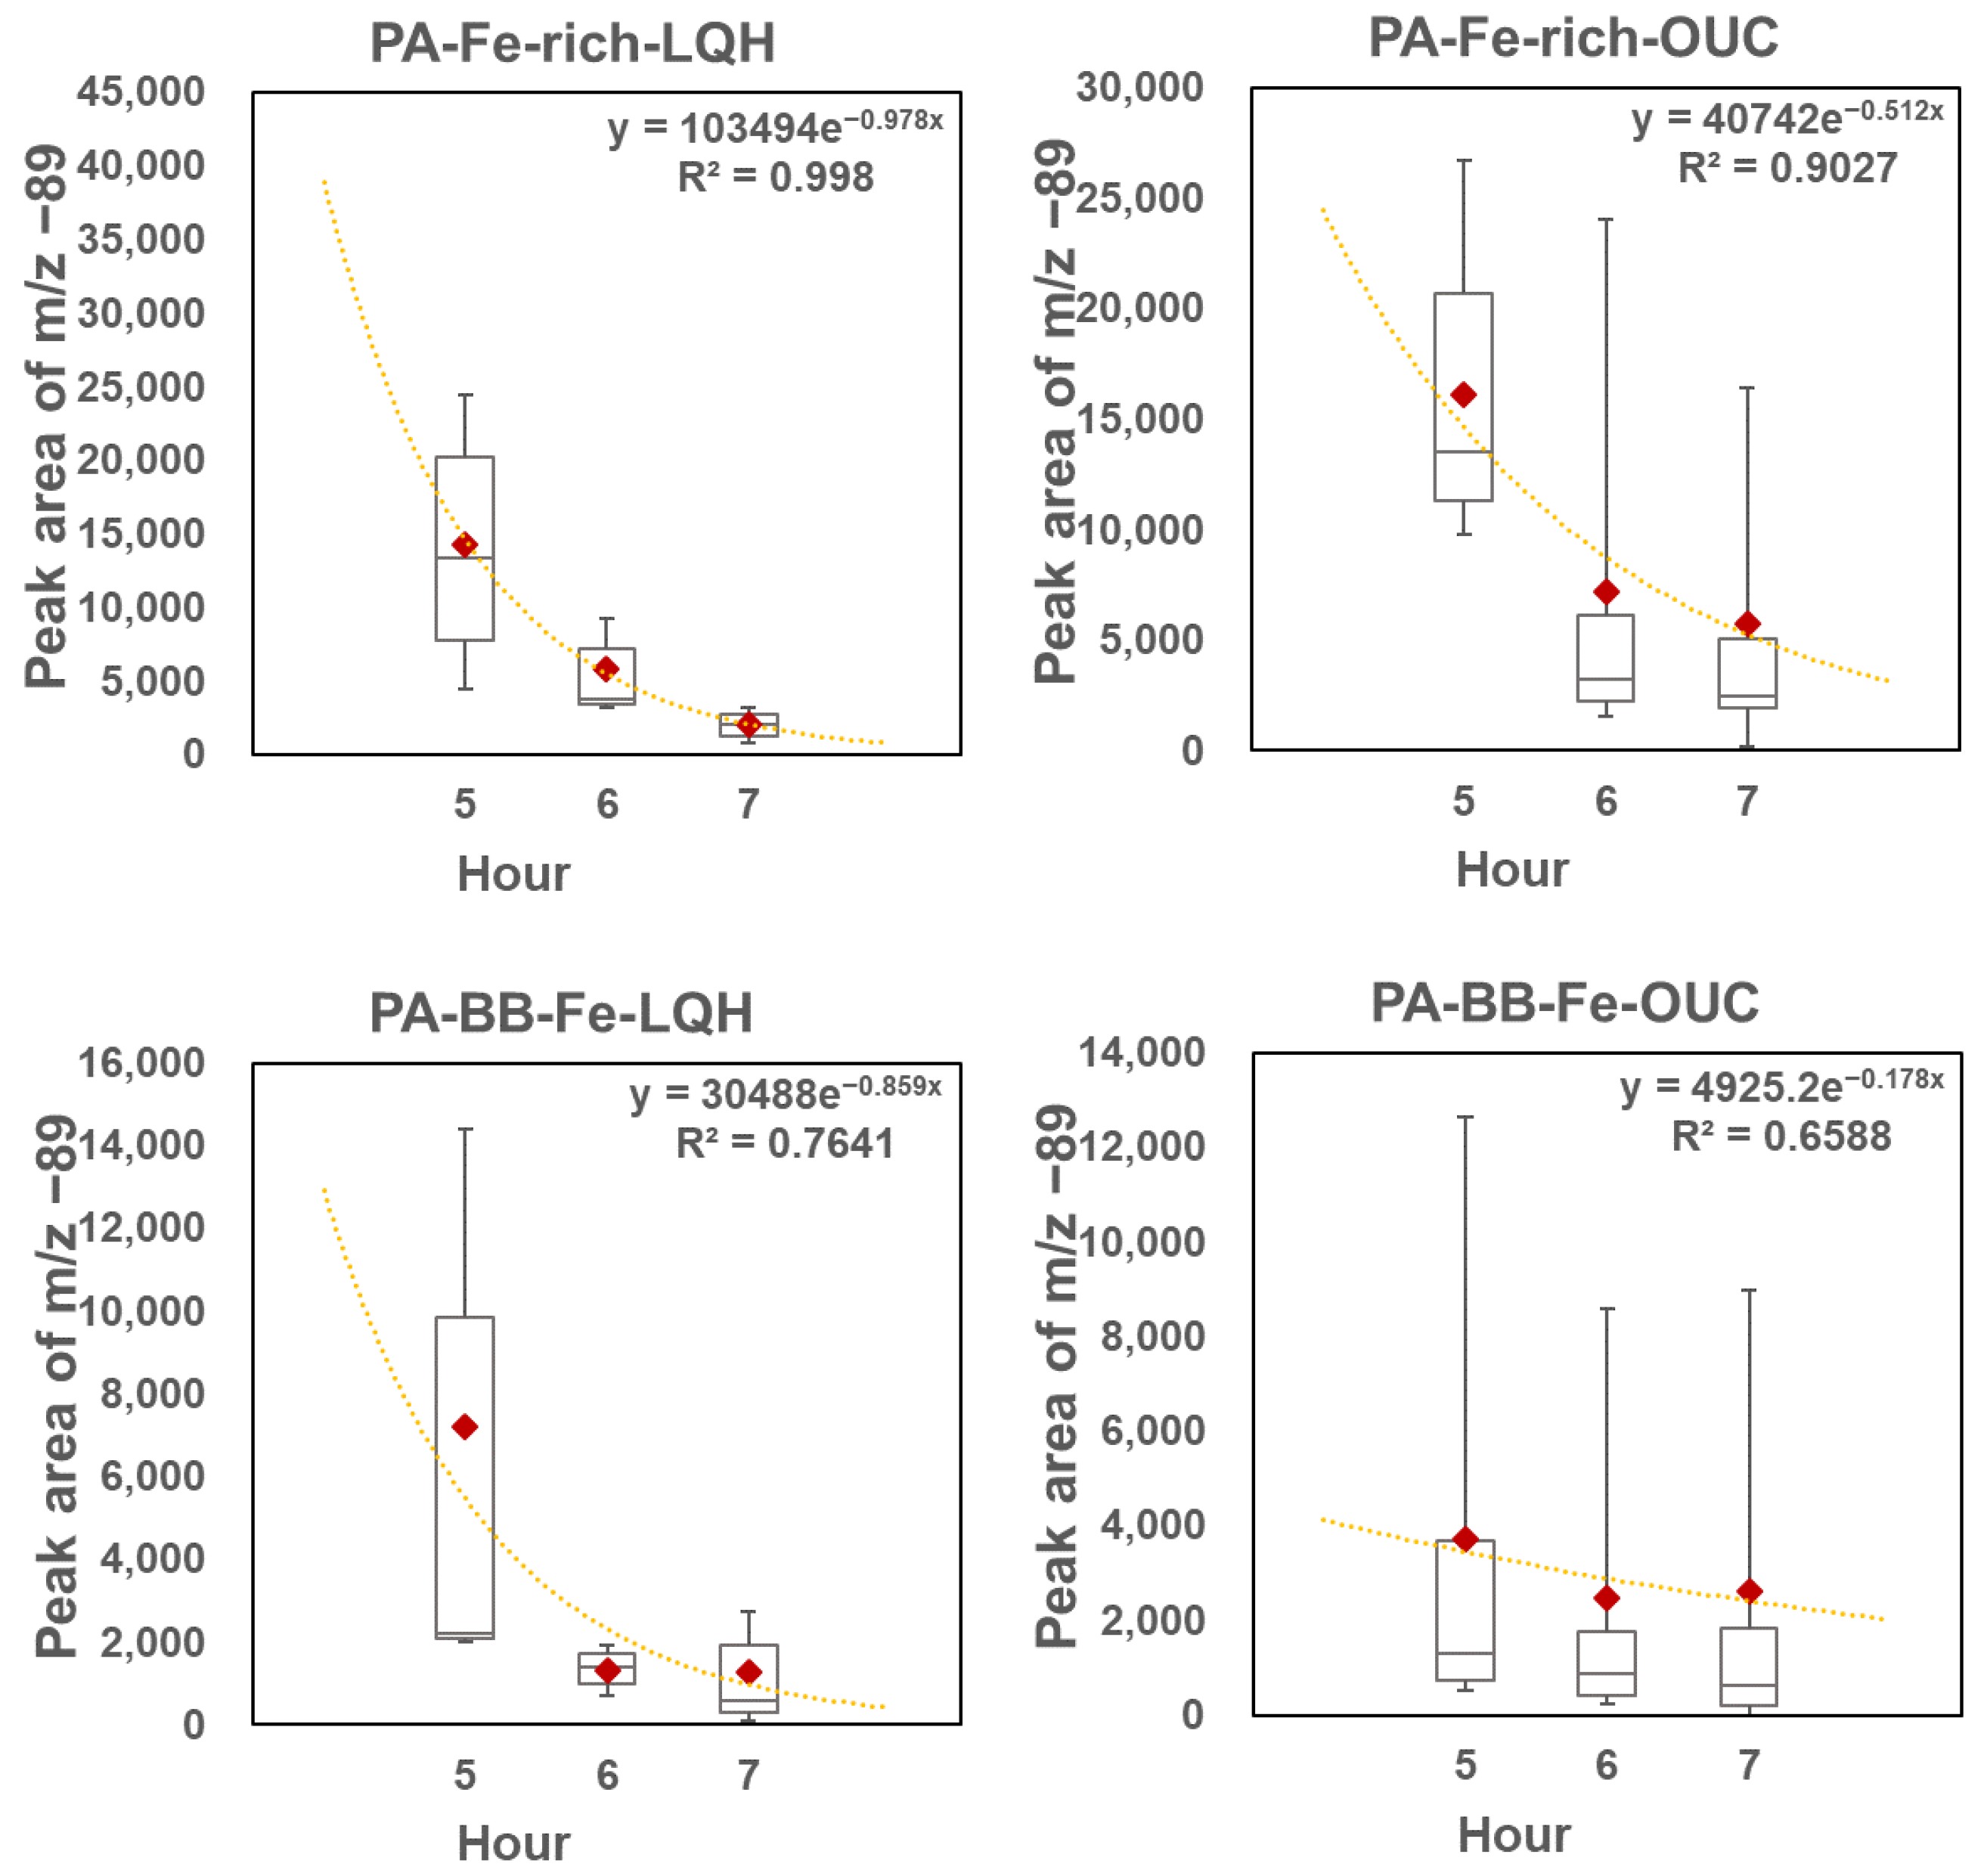
3.4. Decay of Oxalate in Different Oxalate–Fe Particle Types

The PAs of the oxalate in all Fe-containing oxalate particles decreased after sunrise at both LQH and OUC (Figure 3 and Figure 4). To identify the relative contributions of different Fe-containing oxalate particles to oxalate decay in the morning, we examined the diurnal variations in all 12 groups of oxalate particles. Only Fe-rich particles and oxalate–K-related particles (from BB) showed considerable diurnal variations. Other groups had few particle numbers, and the uncertainty was too large; hence, we could not consider them. To determine whether the presence of Fe influenced the diurnal variation in BB particles, we separated BB particles into two subgroups: BB-Fe (containing Fe [m/z 56] particles) and BB-noFe (without Fe [m/z 56] particles). Both sites exhibited a rapid decay of BB-Fe particles (Figure S5c,d), suggesting the importance of Fe in oxalate photodegradation. Only a slight decrease in the number of oxalate particles associated with BB-noFe was observed at LQH, while the number of oxalate particles increased at OUC. Similar diurnal variations of oxalate were observed at LQH and the Hong Kong site, as both Hong Kong and the coastal LQH sites are similar receptor sites. To compare the decay characteristics of oxalate in different ambient environments, we calculated the decay rate k of oxalate PA (m/z −89) (Figure 5) and RPA (m/z −89) (Figure S6).
The oxalate PA intensity decay points for Fe-rich and BB-Fe particles were fitted to exponential curves (Figure 5). The k values of Fe-rich and BB-Fe particles at LQH were −0.978 and −0.859 h−1, respectively, which were greater than those of the corresponding particles at OUC (−0.512 and −0.178 h−1, respectively). The k values of Fe-rich particles were greater than those of BB-Fe particles, especially at OUC. The k of BB-Fe particles at OUC was very low, which may be because the residents began to cook after sunrise and primary emissions of some BB-Fe particles or BB particles were mixed with Fe-containing particles. According to our previous studies, the k of oxalate in Fe-rich particles and BB-Fe particles in Hong Kong were −0.6 and −0.23 h−1, respectively, from February to April [6].
The k of Fe-containing oxalate particles depends on several factors, including aerosol acidity, particle water content, Fe content, oxalate speciation, and the presence of other ligands that may form complexes with oxalate [6,59,60,61,62]. Several factors can cause a higher k of oxalate at LQH. First, the marine-source air mass usually has a high particle water content, which enhances the Fe-mediated photochemical degradation of oxalate. Moreover, BB is low, and thus, only a few oxalate precursors are emitted, such as methylglyoxal and glyoxal, which cannot produce many oxalate particles compared with the case in OUC [10,11,12]. The previously studied Hong Kong site was also beside a marine environment, but the studies were from February to April, during which solar radiation is weaker than that in Qingdao during summer; thus, the k of oxalate at the Hong Kong site was less than that at LQH. However, a previous study observed similar k values between the Hong Kong and OUC sites [6].

4. Conclusions

In this study, we conducted SPAMS measurements to analyze individual oxalate-containing and HM-containing particles in the summer of 2016 at a coastal site LQH and a suburban site OUC in Qingdao. Generally, 6.3% and 12.3% of the total particles (by number) at LQH and OUC were associated with oxalate, with 30.1% and 25.3% of oxalate-containing particles being associated with HMs, respectively. Oxalate–K-related particles (68.9% at LQH and 72.0% at OUC) and oxalate–carbonaceous-related particles (13.6% at LQH and 16.8% at OUC) were associated with BB during the study campaign. Fe-, Cu-, and Pb-rich particles in oxalate–HM-related particles were mainly from industrial emissions. The number of BB-related particles increased during continental air mass control at both sites.
The diurnal variation in oxalate-containing particles showed a decrease at LQH and an increase at OUC in oxalate PA after sunrise. However, the oxalate PA in Fe-rich and BB-Fe particles at both LQH and OUC decreased after sunrise, suggesting that Fe plays an important role in oxalate degradation. In summer, the intense solar radiation in Qingdao may cause higher k of Fe-rich (−0.978 h−1) and BB-Fe particles (−0.859 h−1) at LQH than in winter/spring in Hong Kong. Compared with LQH, the OUC site with heavy traffic and human activities had higher primary emissions and oxalate precursors, resulting in higher oxalate production during the early morning and a higher oxalate generation rate than the decay rate. Low liquid water content and solar radiation may also induce lower k of Fe-rich and BB-Fe particles: −0.512 and −0.178 h−1, respectively.
Our results highlight the importance of involving transition metals and their chemical processes with oxalate or other low-molecular-weight organic acids in air quality and global climate models. Oxalate is an effective CCN candidate to form cloud condensation nuclei and ice nuclei due to its high-water solubility, affecting the climate [3,4,5]. Iron-mediated photodegradation of oxalate is a crucial factor affecting its lifetime [10,22]. Recent models that do not include the iron-mediated photodegradation of oxalate usually overestimate the oxalate concentration, while models including this process usually underestimate the concentration [22,63,64]. This might suggest that the bulk liquid chemistry mechanism from the laboratory study may not be proper for the deliquesced individual particles. From another perspective, this iron-mediated oxalate photochemical decay process can supply abundant ROS and further enhance the atmospheric oxidizing capacity [6]. Meanwhile, the changes between Fe(III) and Fe(II) also increase the Fe solubility, which is essential to regulate the marine ecosystem once deposited into the open ocean by air mass transportation [6,65]. Thus, the oxalate sources statistic and k values estimation for different ambient conditions is critical to improving the atmospheric chemistry model.

Supplementary Materials

The following supporting information can be downloaded at: https://www.mdpi.com/article/10.3390/atmos13050647/s1, Table S1: Classified groups of oxalate particles for marine and continental air mass at LQH and OUC; Figure S1: The location of the two observation sites; Figure S2: Average mass spectra of 12 major oxalate-containing particle types classified using the Art-2a clustering algorithm; Figure S3: Time trends of the major types of oxalate-containing particles, plotted by ratio of oxalate group particle number to total particle number at (a) LQH and (b) OUC; Figure S4: Number fraction of selected ion markers associated with single-particle types at (a) LQH and (b) OUC; Figure S5: Diurnal variations of oxalate (m/z −89) PA (a), and RPA (b) in Fe-rich particles and oxalate (m/z −89) PA (c), and RPA (d) in BB-Fe particles and oxalate (m/z −89) PA (e), and RPA (f) in BB-noFe particles; Figure S6: Average decay estimation of oxalate intensity in different oxalate-Fe complexes. (Plotted by particle RPA of m/z −89; box and error bars represent the 10th, 25th, 50th 75th, and 90th percentiles; and the red diamond represents the mean); Figure S7: Average diurnal variation in classified oxalate groups (contribution of relative particle number from each classified group to that of the total oxalate particles) at (a) LQH and (b) OUC; Figure S8: Average diurnal variation in classified oxalate groups (contribution of m/z −89 RPA from each classified group to that of the total oxalate particles) at (a) LQH and (b) OUC.

Author Contributions

Conceptualization, Y.Z. (Yang Zhou) and L.L.; investigation, X.L. (Xiaodong Li), L.F. and H.X.; methodology, X.L. (Xiaodong Li), L.L., L.F., H.X., X.L. (Xiaohuan Liu), Y.Z. (Yujiao Zhu), J.Q., H.G. and Z.Z.; validation, Y.Z. (Yang Zhou), Y.Z. (Yunhui Zhao), Y.Z. (Yanjing Zhang), W.L. and L.S.; formal analysis, Y.Z. (Yunhui Zhao) and Y.Z. (Yanjing Zhang); supervision, Y.Z. (Yang Zhou); project administration, Y.Z. (Yang Zhou); funding acquisition, Y.Z. (Yang Zhou) and L.L.; writing—original draft, Y.Z. (Yunhui Zhao); writing—review and editing, Y.Z. (Yunhui Zhao), Y.Z. (Yang Zhou), L.L. and L.S. All authors have read and agreed to the published version of the manuscript.

Funding

This research was funded by the National Natural Science Foundation of China (Grant No. 41875155, 41905106, 41776086), and the National Key Basic Research Project of China (2019YFA0607004).

Institutional Review Board Statement

Not applicable.

Informed Consent Statement

Not applicable.

Data Availability Statement

Not applicable.

Acknowledgments

We thank NOAA, Air Resources Laboratory for supplying backward trajectory calculation software.

Conflicts of Interest

The authors declare no conflict of interest.

References

  1. Chebbi, A.; Carlier, P. Carboxylic acids in the troposphere, occurrence, sources, and sinks: A review. Atmos. Environ. 1996, 30, 4233–4249. [Google Scholar] [CrossRef]
  2. Yang, F.; Chen, H.; Wang, X.; Yang, X.; Du, J.; Chen, J. Single particle mass spectrometry of oxalic acid in ambient aerosols in Shanghai: Mixing state and formation mechanism. Atmos. Environ. 2009, 43, 3876–3882. [Google Scholar] [CrossRef]
  3. Kerminen, V.-M. Relative roles of secondary sulfate and organics in atmospheric cloud condensation nuclei production. J. Geophys. Res. Atmos. 2001, 106, 17321–17333. [Google Scholar] [CrossRef]
  4. Ma, Q.; He, H.; Liu, C. Hygroscopic properties of oxalic acid and atmospherically relevant oxalates. Atmos. Environ. 2013, 69, 281–288. [Google Scholar] [CrossRef]
  5. Zhou, Y.; Huang, X.H.H.; Griffith, S.M.; Li, M.; Li, L.; Zhou, Z.; Wu, C.; Meng, J.; Chan, C.K.; Louie, P.K.K.; et al. A field measurement based scaling approach for quantification of major ions, organic carbon, and elemental carbon using a single particle aerosol mass spectrometer. Atmos. Environ. 2016, 143, 300–312. [Google Scholar] [CrossRef]
  6. Zhou, Y.; Zhang, Y.; Griffith, S.M.; Wu, G.; Li, L.; Zhao, Y.; Li, M.; Zhou, Z.; Yu, J.Z. Field Evidence of Fe-Mediated Photochemical Degradation of Oxalate and Subsequent Sulfate Formation Observed by Single Particle Mass Spectrometry. Environ. Sci. Technol. 2020, 54, 6562–6574. [Google Scholar] [CrossRef]
  7. Huang, X.-F.; Yu, J.Z.; He, L.-Y.; Yuan, Z. Water-soluble organic carbon and oxalate in aerosols at a coastal urban site in China: Size distribution characteristics, sources, and formation mechanisms. J. Geophys. Res. Atmos. 2006, 111, D22212. [Google Scholar] [CrossRef]
  8. Narukawa, M.; Kawamura, K.; Takeuchi, N.; Nakajima, T. Distribution of dicarboxylic acids and carbon isotopic compositions in aerosols from 1997 Indonesian forest fires. Geophys. Res. Lett. 1999, 26, 3101–3104. [Google Scholar] [CrossRef] [Green Version]
  9. Yamasoe, M.A.; Artaxo, P.; Miguel, A.H.; Allen, A.G. Chemical composition of aerosol particles from direct emissions of vegetation fires in the Amazon Basin: Water-soluble species and trace elements. Atmos. Environ. 2000, 34, 1641–1653. [Google Scholar] [CrossRef]
  10. Gong, H.; Cheng, C.; Li, M.; Yang, S.; Zhou, Q.; Zhong, Q.E.; Zhang, Y.; Xie, Y.; Zhou, Z. The enhanced mixing states of oxalate with metals in single particles in Guangzhou, China. Sci. Total Environ. 2021, 783, 146962. [Google Scholar] [CrossRef]
  11. Lim, Y.B.; Tan, Y.; Perri, M.J.; Seitzinger, S.P.; Turpin, B.J. Aqueous chemistry and its role in secondary organic aerosol (SOA) formation. Atmos. Chem. Phys. 2010, 10, 10521–10539. [Google Scholar] [CrossRef] [Green Version]
  12. Tilgner, A.; Herrmann, H. Radical-driven carbonyl-to-acid conversion and acid degradation in tropospheric aqueous systems studied by CAPRAM. Atmos. Environ. 2010, 44, 5415–5422. [Google Scholar] [CrossRef]
  13. Cheng, C.; Wang, G.; Meng, J.; Wang, Q.; Cao, J.; Li, J.; Wang, J. Size-resolved airborne particulate oxalic and related secondary organic aerosol species in the urban atmosphere of Chengdu, China. Atmos. Res. 2015, 161–162, 134–142. [Google Scholar] [CrossRef]
  14. Lin, Q.; Yang, Y.; Fu, Y.; Jiang, F.; Zhang, G.; Peng, L.; Lian, X.; Bi, X.; Li, L.; Chen, D.; et al. The reductions of oxalate and its precursors in cloud droplets relative to wet particles. Atmos. Environ. 2020, 235, 117632. [Google Scholar] [CrossRef]
  15. Cheng, C.; Li, M.; Chan, C.K.; Tong, H.; Chen, C.; Chen, D.; Wu, D.; Li, L.; Wu, C.; Cheng, P.; et al. Mixing state of oxalic acid containing particles in the rural area of Pearl River Delta, China: Implications for the formation mechanism of oxalic acid. Atmos. Chem. Phys. 2017, 17, 9519–9533. [Google Scholar] [CrossRef] [Green Version]
  16. Furukawa, T.; Takahashi, Y. Oxalate metal complexes in aerosol particles: Implications for the hygroscopicity of oxalate-containing particles. Atmos. Chem. Phys. 2011, 11, 4289–4301. [Google Scholar] [CrossRef] [Green Version]
  17. Zhang, G.; Lin, Q.; Peng, L.; Yang, Y.; Jiang, F.; Liu, F.; Song, W.; Chen, D.; Cai, Z.; Bi, X.; et al. Oxalate Formation Enhanced by Fe-Containing Particles and Environmental Implications. Environ. Sci. Technol. 2019, 53, 1269–1277. [Google Scholar] [CrossRef]
  18. Tao, Y.; Murphy, J.G. The Mechanisms Responsible for the Interactions among Oxalate, pH, and Fe Dissolution in PM2.5. ACS Earth Space Chem. 2019, 3, 2259–2265. [Google Scholar] [CrossRef]
  19. Tong, H.; Arangio, A.M.; Lakey, P.S.J.; Berkemeier, T.; Liu, F.; Kampf, C.J.; Brune, W.H.; Pöschl, U.; Shiraiwa, M. Hydroxyl radicals from secondary organic aerosol decomposition in water. Atmos. Chem. Phys. 2016, 16, 1761–1771. [Google Scholar] [CrossRef] [Green Version]
  20. Lin, Q.; Bi, X.; Zhang, G.; Yang, Y.; Peng, L.; Lian, X.; Fu, Y.; Li, M.; Chen, D.; Miller, M.; et al. In-cloud formation of secondary species in iron-containing particles. Atmos. Chem. Phys. 2019, 19, 1195–1206. [Google Scholar] [CrossRef] [Green Version]
  21. Sorooshian, A.; Wang, Z.; Coggon, M.M.; Jonsson, H.H.; Ervens, B. Observations of Sharp Oxalate Reductions in Stratocumulus Clouds at Variable Altitudes: Organic Acid and Metal Measurements During the 2011 E-PEACE Campaign. Environ. Sci. Technol. 2013, 47, 7747–7756. [Google Scholar] [CrossRef] [PubMed] [Green Version]
  22. Weller, C.; Tilgner, A.; Bräuer, P.; Herrmann, H. Modeling the Impact of Iron–Carboxylate Photochemistry on Radical Budget and Carboxylate Degradation in Cloud Droplets and Particles. Environ. Sci. Technol. 2014, 48, 5652–5659. [Google Scholar] [CrossRef] [PubMed]
  23. Li, L.; Huang, Z.; Dong, J.; Li, M.; Gao, W.; Nian, H.; Fu, Z.; Zhang, G.; Bi, X.; Cheng, P.; et al. Real time bipolar time-of-flight mass spectrometer for analyzing single aerosol particles. Int. J. Mass Spectrom. 2011, 303, 118–124. [Google Scholar] [CrossRef]
  24. Zhou, Y.; Huang, X.H.; Bian, Q.; Griffith, S.M.; Louie, P.K.K.; Yu, J.Z. Sources and atmospheric processes impacting oxalate at a suburban coastal site in Hong Kong: Insights inferred from 1 year hourly measurements. J. Geophys. Res. Atmos. 2015, 120, 9772–9788. [Google Scholar] [CrossRef] [Green Version]
  25. Sullivan, R.C.; Prather, K.A. Investigations of the Diurnal Cycle and Mixing State of Oxalic Acid in Individual Particles in Asian Aerosol Outflow. Environ. Sci. Technol. 2007, 41, 8062–8069. [Google Scholar] [CrossRef]
  26. Song, X.-H.; Hopke, P.K.; Fergenson, D.P.; Prather, K.A. Classification of Single Particles Analyzed by ATOFMS Using an Artificial Neural Network, ART-2A. Anal. Chem. 1999, 71, 860–865. [Google Scholar] [CrossRef]
  27. Furutani, H.; Jung, J.; Miura, K.; Takami, A.; Kato, S.; Kajii, Y.; Uematsu, M. Single-particle chemical characterization and source apportionment of iron-containing atmospheric aerosols in Asian outflow. J. Geophys. Res. Atmos. 2011, 116, D18204. [Google Scholar] [CrossRef]
  28. Ault, A.P.; Gaston, C.J.; Wang, Y.; Dominguez, G.; Thiemens, M.H.; Prather, K.A. Characterization of the Single Particle Mixing State of Individual Ship Plume Events Measured at the Port of Los Angeles. Environ. Sci. Technol. 2010, 44, 1954–1961. [Google Scholar] [CrossRef]
  29. Healy, R.M.; O’Connor, I.P.; Hellebust, S.; Allanic, A.; Sodeau, J.R.; Wenger, J.C. Characterisation of single particles from in-port ship emissions. Atmos. Environ. 2009, 43, 6408–6414. [Google Scholar] [CrossRef]
  30. Moffet, R.C.; de Foy, B.; Molina, L.T.; Molina, M.J.; Prather, K.A. Measurement of ambient aerosols in northern Mexico City by single particle mass spectrometry. Atmos. Chem. Phys. 2008, 8, 4499–4516. [Google Scholar] [CrossRef] [Green Version]
  31. Lu, J.; Ma, L.; Cheng, C.; Pei, C.; Chan, C.K.; Bi, X.; Qin, Y.; Tan, H.; Zhou, J.; Chen, M.; et al. Real time analysis of lead-containing atmospheric particles in Guangzhou during wintertime using single particle aerosol mass spectrometry. Ecotoxicol. Environ. Saf. 2019, 168, 53–63. [Google Scholar] [CrossRef] [PubMed]
  32. Zhang, Y.; Wang, X.; Chen, H.; Yang, X.; Chen, J.; Allen, J.O. Source apportionment of lead-containing aerosol particles in Shanghai using single particle mass spectrometry. Chemosphere 2009, 74, 501–507. [Google Scholar] [CrossRef] [PubMed]
  33. Bie, S.; Yang, L.; Zhang, Y.; Huang, Q.; Li, J.; Zhao, T.; Zhang, X.; Wang, P.; Wang, W. Source appointment of PM2.5 in Qingdao Port, East of China. Sci. Total Environ. 2021, 755, 142456. [Google Scholar] [CrossRef] [PubMed]
  34. Zhou, L.; Li, M.; Cheng, C.; Zhou, Z.; Nian, H.; Tang, R.; Chan, C.K. Real-time chemical characterization of single ambient particles at a port city in Chinese domestic emission control area — Impacts of ship emissions on urban air quality. Sci. Total Environ. 2022, 819, 153117. [Google Scholar] [CrossRef] [PubMed]
  35. Bi, X.; Zhang, G.; Li, L.; Wang, X.; Li, M.; Sheng, G.; Fu, J.; Zhou, Z. Mixing state of biomass burning particles by single particle aerosol mass spectrometer in the urban area of PRD, China. Atmos. Environ. 2011, 45, 3447–3453. [Google Scholar] [CrossRef]
  36. Bi, X.; Dai, S.; Zhang, G.; Qiu, N.; Li, M.; Wang, X.; Chen, D.; Peng, P.a.; Sheng, G.; Fu, J.; et al. Real-time and single-particle volatility of elemental carbon-containing particles in the urban area of Pearl River Delta region, China. Atmos. Environ. 2015, 118, 194–202. [Google Scholar] [CrossRef]
  37. Cai, Q.-L.; Dai, X.-R.; Li, J.-R.; Tong, L.; Hui, Y.; Cao, M.-Y.; Li, M.; Xiao, H. The characteristics and mixing states of PM2.5 during a winter dust storm in Ningbo of the Yangtze River Delta, China. Sci. Total Environ. 2020, 709, 136146. [Google Scholar] [CrossRef]
  38. Chen, Y.; Liu, H.; Yang, F.; Zhang, S.; Li, W.; Shi, G.; Wang, H.; Tian, M.; Liu, S.; Huang, R.; et al. Single particle characterization of summertime particles in Xi’an (China). Sci. Total Environ. 2018, 636, 1279–1290. [Google Scholar] [CrossRef]
  39. Chen, J.; Li, C.; Ristovski, Z.; Milic, A.; Gu, Y.; Islam, M.S.; Wang, S.; Hao, J.; Zhang, H.; He, C.; et al. A review of biomass burning: Emissions and impacts on air quality, health and climate in China. Sci. Total Environ. 2017, 579, 1000–1034. [Google Scholar] [CrossRef] [Green Version]
  40. Chen, Y.; Yang, F.; Mi, T.; Cao, J.; Shi, G.; Huang, R.; Wang, H.; Chen, J.; Lou, S.; Wang, Q. Characterizing the composition and evolution of and urban particles in Chongqing (China) during summertime. Atmos. Res. 2017, 187, 84–94. [Google Scholar] [CrossRef]
  41. Wang, H.; An, J.; Shen, L.; Zhu, B.; Xia, L.; Duan, Q.; Zou, J. Mixing state of ambient aerosols in Nanjing city by single particle mass spectrometry. Atmos. Environ. 2016, 132, 123–132. [Google Scholar] [CrossRef]
  42. Dall’Osto, M.; Beddows, D.C.S.; McGillicuddy, E.J.; Esser-Gietl, J.K.; Harrison, R.M.; Wenger, J.C. On the simultaneous deployment of two single-particle mass spectrometers at an urban background and a roadside site during SAPUSS. Atmos. Chem. Phys. 2016, 16, 9693–9710. [Google Scholar] [CrossRef] [Green Version]
  43. Xu, J.; Li, M.; Shi, G.; Wang, H.; Ma, X.; Wu, J.; Shi, X.; Feng, Y. Mass spectra features of biomass burning boiler and coal burning boiler emitted particles by single particle aerosol mass spectrometer. Sci. Total Environ. 2017, 598, 341–352. [Google Scholar] [CrossRef] [PubMed]
  44. Akbari, M.Z.; Thepnuan, D.; Wiriya, W.; Janta, R.; Punsompong, P.; Hemwan, P.; Charoenpanyanet, A.; Chantara, S. Emission factors of metals bound with PM2.5 and ashes from biomass burning simulated in an open-system combustion chamber for estimation of open burning emissions. Atmos. Pollut. Res. 2021, 12, 13–24. [Google Scholar] [CrossRef]
  45. Khamkaew, C.; Chantara, S.; Janta, R.; Pani, S.K.; Prapamontol, T.; Kawichai, S.; Wiriya, W.; Lin, N.-H. Investigation of Biomass Burning Chemical Components over Northern Southeast Asia during 7-SEAS/BASELInE 2014 Campaign. Aerosol Air Qual. Res. 2016, 16, 2655–2670. [Google Scholar] [CrossRef]
  46. Setyan, A.; Flament, P.; Locoge, N.; Deboudt, K.; Riffault, V.; Alleman, L.Y.; Schoemaecker, C.; Arndt, J.; Augustin, P.; Healy, R.M.; et al. Investigation on the near-field evolution of industrial plumes from metalworking activities. Sci. Total Environ. 2019, 668, 443–456. [Google Scholar] [CrossRef]
  47. Arndt, J.; Healy, R.M.; Setyan, A.; Flament, P.; Deboudt, K.; Riffault, V.; Alleman, L.Y.; Mbengue, S.; Wenger, J.C. Characterization and source apportionment of single particles from metalworking activities. Environ. Pollut. 2021, 270, 116078. [Google Scholar] [CrossRef]
  48. Lu, H.; Zhu, Z.; Wang, S. A full-scale analysis of chemical characteristics of PM2.5 and PM10 during haze and non-haze episodes in Cixi city, China. Atmos. Pollut. Res. 2020, 11, 1000–1008. [Google Scholar] [CrossRef]
  49. Zhao, L.; Xu, Y.; Hou, H.; Shangguan, Y.; Li, F. Source identification and health risk assessment of metals in urban soils around the Tanggu chemical industrial district, Tianjin, China. Sci. Total Environ. 2014, 468-469, 654–662. [Google Scholar] [CrossRef]
  50. Zhao, S.; Chen, L.; Yan, J.; Chen, H. Characterization of lead-containing aerosol particles in Xiamen during and after Spring Festival by single-particle aerosol mass spectrometry. Sci. Total Environ. 2017, 580, 1257–1267. [Google Scholar] [CrossRef]
  51. Zhang, J.; Huang, X.; Chen, Y.; Luo, B.; Luo, J.; Zhang, W.; Rao, Z.; Yang, F. Characterization of lead-containing atmospheric particles in a typical basin city of China: Seasonal variations, potential source areas, and responses to fireworks. Sci. Total Environ. 2019, 661, 354–363. [Google Scholar] [CrossRef] [PubMed]
  52. Chang, M.B.; Huang, C.K.; Wu, H.T.; Lin, J.J.; Chang, S.H. Characteristics of heavy metals on particles with different sizes from municipal solid waste incineration. J. Hazard. Mater. 2000, 79, 229–239. [Google Scholar] [CrossRef]
  53. Walsh, D.C.; Chillrud, S.N.; Simpson, H.J.; Bopp, R.F. Refuse Incinerator Particulate Emissions and Combustion Residues for New York City during the 20th Century. Environ. Sci. Technol. 2001, 35, 2441–2447. [Google Scholar] [CrossRef] [PubMed]
  54. Ault, A.P.; Moore, M.J.; Furutani, H.; Prather, K.A. Impact of Emissions from the Los Angeles Port Region on San Diego Air Quality during Regional Transport Events. Environ. Sci. Technol. 2009, 43, 3500–3506. [Google Scholar] [CrossRef]
  55. Pattanaik, S.; Huggins, F.E.; Huffman, G.P.; Linak, W.P.; Miller, C.A. XAFS Studies of Nickel and Sulfur Speciation in Residual Oil Fly-Ash Particulate Matters (ROFA PM). Environ. Sci. Technol. 2007, 41, 1104–1110. [Google Scholar] [CrossRef] [PubMed]
  56. Wang, H.; Shen, L.; Yin, Y.; Chen, K.; Chen, J.; Wang, Y. Characteristics and mixing state of aerosol at the summit of Mount Tai (1534 m) in Central East China: First measurements with SPAMS. Atmos. Environ. 2019, 213, 273–284. [Google Scholar] [CrossRef]
  57. Zhou, Y.; Wang, Z.; Pei, C.; Li, L.; Wu, M.; Wu, M.; Huang, B.; Cheng, C.; Li, M.; Wang, X.; et al. Source-oriented characterization of single particles from in-port ship emissions in Guangzhou, China. Sci. Total Environ. 2020, 724, 138179. [Google Scholar] [CrossRef]
  58. Li, Z.; Walters, W.W.; Hastings, M.G.; Song, L.; Huang, S.; Zhu, F.; Liu, D.; Shi, G.; Li, Y.; Fang, Y. Atmospheric nitrate formation pathways in urban and rural atmosphere of Northeast China: Implications for complicated anthropogenic effects. Environ. Pollut. 2022, 296, 118752. [Google Scholar] [CrossRef]
  59. Jeong, J.; Yoon, J. pH effect on OH radical production in photo/ferrioxalate system. Water Res. 2005, 39, 2893–2900. [Google Scholar] [CrossRef]
  60. Weller, C.; Horn, S.; Herrmann, H. Photolysis of Fe(III) carboxylato complexes: Fe(II) quantum yields and reaction mechanisms. J. Photochem. Photobiol. A Chem. 2013, 268, 24–36. [Google Scholar] [CrossRef]
  61. Weller, C.; Horn, S.; Herrmann, H. Effects of Fe(III)-concentration, speciation, excitation-wavelength and light intensity on the quantum yield of iron(III)-oxalato complex photolysis. J. Photochem. Photobiol. A Chem. 2013, 255, 41–49. [Google Scholar] [CrossRef]
  62. Wang, Z.; Xiao, D.; Liu, J. Diverse redox chemistry of photo/ferrioxalate system. RSC Adv. 2014, 4, 44654–44658. [Google Scholar] [CrossRef]
  63. Ervens, B.; Feingold, G.; Frost, G.J.; Kreidenweis, S.M. A modeling study of aqueous production of dicarboxylic acids: 1. Chemical pathways and speciated organic mass production. J. Geophys. Res. Atmos. 2004, 109, D15205. [Google Scholar] [CrossRef]
  64. Crahan, K.K.; Hegg, D.; Covert, D.S.; Jonsson, H. An exploration of aqueous oxalic acid production in the coastal marine atmosphere. Atmos. Environ. 2004, 38, 3757–3764. [Google Scholar] [CrossRef]
  65. Takahashi, Y.; Furukawa, T.; Kanai, Y.; Uematsu, M.; Zheng, G.; Marcus, M.A. Seasonal changes in Fe species and soluble Fe concentration in the atmosphere in the Northwest Pacific region based on the analysis of aerosols collected in Tsukuba, Japan. Atmos. Chem. Phys. 2013, 13, 7695–7710. [Google Scholar] [CrossRef] [Green Version]
Figure 1. Size-resolved contributions of classified oxalate-containing particle groups to the total oxalate particles (by number percentage) at (a) LiuqingHe Scenic Spot [LQH] and (b) Ocean University of China [OUC].
Atmosphere 13 00647 g001
Figure 2. Time trends of meteorological factors, the relative particle number of oxalate-containing particles, and the contribution of each group to the total oxalate particles (by number) at (a) LQH and (b) OUC.
Atmosphere 13 00647 g002
Figure 3. Diurnal variations in meteorological parameters (temperature (a); relative humidity, RH (b)) and particle number (c), PA (d), and RPA (e) of oxalate (m/z −89) in oxalate-containing particles and PA of oxalate in oxalate-Fe particles (f).
Atmosphere 13 00647 g003
Figure 4. Average diurnal variations in classified oxalate groups (contribution of m/z −89 PA from each classified group to that of the total oxalate particles) at (a) LQH and (b) OUC.
Atmosphere 13 00647 g004
Figure 5. Average decay estimation of oxalate intensity in different oxalate-Fe complexes. (Plotted by particle PA of m/z −89; box and error bars represent the 10th, 25th, 50th, 75th, and 90th percentiles; and the red diamond represents the mean).
Atmosphere 13 00647 g005
Table 1. Particle number statistics captured by SPAMS.
Individual ParticlesTotal ParticleOxalateFeVCuPbZn
LQHNumber67088742226226294293422776116723099
% in total particle 6.3%3.4%6.4%3.4%1.7%0.5%
OUCNumber171877821118066465950511372273603730847
% in total particle 12.3%3.9%5.5%8.0%2.1%1.8%
OxalateOxalate-HMsOxalate-FeOxalate-VOxalate-CuOxalate-PbOxalate-Zn
LQHNumber422261272046363596361231451105
% in Oxalate100.0%30.1%11.0%8.5%8.6%7.4%2.6%
% in Oxalate-metals 100.0%36.4%28.3%28.4%24.7%8.7%
% in each HMs 20.5%8.4%15.9%26.9%35.7%
OUCNumber2111805332416559153852156294487792
% in Oxalate100.0%25.3%7.8%7.3%10.2%4.5%3.7%
% in Oxalate-metals 100.0%31.1%28.9%40.4%17.7%14.6%
% in each HMs 24.9%16.2%15.7%26.2%25.3%
Table 2. Groups of oxalate particles classified according to the Art-2a method.
LQHOUC
GroupsNumberFractionNumberFraction
K-rich13,50732.0%70,35433.3%
K-ECOC11,07826.2%60,61028.7%
K-Na453110.7%21,20910.0%
EC30807.3%20,9639.9%
EC-Na14723.5%11,1385.3%
ECOC11772.8%33861.6%
Fe-rich37258.8%11,9835.7%
V-rich7881.9%27621.3%
Pb-rich6601.6%15180.7%
Zn-rich2410.6%3660.2%
Cu-rich2050.5%19460.9%
Other metals5081.2%11550.5%
Undefined12543.0%37901.8%
Oxalate42,2266.3%211,18012.3%
mass670,887100.0%1,718,778100.0%
Publisher’s Note: MDPI stays neutral with regard to jurisdictional claims in published maps and institutional affiliations.

