Article

Revisiting a Mei-Yu Front Associated with Heavy Rainfall over Taiwan during 6–7 June 2003

1
Department of Atmospheric Sciences, SOEST, University of Hawaii at Mānoa, Honolulu, HI 96822, USA
2
Department of Atmospheric Sciences, National Central University, Zhongli 32001, Taiwan
*
Author to whom correspondence should be addressed.
Atmosphere 2022, 13(5), 644; https://doi.org/10.3390/atmos13050644
Submission received: 10 March 2022 / Revised: 16 April 2022 / Accepted: 18 April 2022 / Published: 19 April 2022
(This article belongs to the Special Issue Feature Papers in Meteorological Science)

Abstract

:
During 6–7 June 2003, a Mei-Yu jet/front system over Southern China is characterized by appreciable horizontal temperature contrast below the 850 hPa level (>8 K), where the cold, dry, postfrontal northeasterlies converge with the warm, moist southwesterly flow, and above the 400–hPa level (>18 K) associated with an upper-level front. The frontal baroclinic zone tilts northward with a slope of ~1/100. During the passage of a midlatitude trough, the upper-level jet/front system advances southeastward. The thermally direct circulation across the subsynoptic low-level jet (SLLJ)/Mei-Yu front system, coupled with dynamic forcing aloft on the equatorial side of the entrance region of a subsynoptic upper-level jet (SULJ), provides a favorable environment for the development of a frontal cyclone over Southern China. A southwesterly marine boundary layer jet (MBLJ) develops between the deepening Mei-Yu frontal cyclone and the West Pacific Subtropical High (WPSH). The MBLJ transports moisture from the northern South China Sea (NSCS) to Southern China. All three jets (SULJ, SLLJ, and MBLJ) interact together during the deepening of the Mei-Yu frontal cyclone with positive feedback effects of latent heat release. On 7 June 2003, as the Mei-Yu front arrives near the Taiwan area, the warm, moist, and unstable air associated with the MBLJ decelerates as it approaches the Central Mountain Range (CMR). The warm, moist, and unstable air is orographically lifted by the CMR and enhances the vertical motion already present with the frontal zone. A region of widespread heavy rainfall develops, with a maximum of more than 350 mm/day, over a region extending from the southwestern coast of Taiwan to the windward slopes of the CMR.

1. Introduction

The early summer rainy season over the Taiwan area (Mei-Yu) mainly occurs during the seasonal transition between late May and mid-June; see [1,2] and others. In an early study, G. Chen and Chang [3] diagnosed the structure of a Mei-Yu front that resulted in significant flooding over the Taiwan area during 10–15 June 1978. They suggested that the western section, around 115° E, of the composite Mei-Yu system exhibited several features during its mature stage that are commonly seen in an equivalent barotropic tropical disturbance, e.g., weak temperature gradients and almost no vertical tilt. The intense convection and thermally direct circulation associated with the Mei-Yu system appear to be driven by the Conditional Instability of the Second Kind (CISK) process and Ekman pumping.
Recently, Hsiao and Chen [4] re-examined this system over Southern China using the European Centre for Medium-Range Weather Forecasts (ECMWF) Reanalysis (ERA-40) with data from 23 vertical levels [5] every 6 hours. In contrast to G. Chen and Chang [3], they determined that this Mei-Yu front possessed moist baroclinic features similar to other Mei-Yu systems that occurred during the Taiwan Area Mesoscale Experiment (TAMEX) [2,6,7,8,9] and in recent studies; see [10,11,12,13] and others. In the study by G. Chen and Chang [3], the basic baroclinic features, e.g., a thermal contrast of 5–7 K in the low levels, an upper-level jet/front with tropopause folding, a marked northward vertical tilt, and a secondary thermally direct circulation, are not captured by the time-averaged composite analysis and vorticity budget calculations due to the use of filtered and subjectively analyzed 240 km grid data at four pressure levels (850, 700, 500, and 400 hPa).
G. Chen et al. [14] diagnosed the development of a mesoscale Mei-Yu frontal cyclone associated with a heavy rainfall event over Taiwan on 6–7 June 2003 using the gridded analysis from the ECMWF Tropical Ocean Global Atmosphere (TOGA advanced) data and piecewise potential vorticity (PV) inversion. The dataset has a horizontal 1.125° x 1.125° grid spacing at 11 pressure levels (1000, 925, 850, 700, 500, 400, 300, 250, 200, 150, and 100 hPa) every 6 h. They also suggest that the Mei-Yu frontal disturbance is characterized by negligible thermal gradients and very little vertical tilt. Furthermore, they suggest that the deepening of the mesoscale frontal cyclone is caused by a CISK process and Ekman pumping, through positive feedback by cumulus convection. In this study, the structure and secondary circulation of this case are re-examined and compared with those studied in other cases. Our goal is to confirm that the Mei-Yu frontal characteristics of this case are consistent with the baroclinic features found during TAMEX and recent studies [15]. Furthermore, we demonstrate that, for this case, the coupling between the thermally direct secondary circulation and the dynamic forcing aloft is important for the spin-up of the frontal cyclone.
Another prominent feature associated with the Mei-Yu system is the subsynoptic low-level jet (SLLJ) in the 850 to 700 hPa layer [14,16,17] ahead of the Mei-Yu trough. C.-S. Chen et al. [18] studied a heavy rainfall event over Southwestern Taiwan during 6–8 June 2003 and suggest that the 850 hPa SLLJ serves as a conveyor belt, bringing in moisture from the NSCS to Southwestern Taiwan. This problem will be re-examined as our studies [15,19] suggest that the SLLJ is an integral part of the secondary circulation associated with the Mei-Yu jet/front system.
For a heavy rainfall event over Taiwan during 10–12 June 2012 [13], a strong southwesterly low-level jet (LLJ) at the 950 hPa level, extending from the NSCS to the Taiwan area, with large horizontal moisture fluxes (>360 g kg−1 m s−1) is present. This is the marine boundary layer jet (MBLJ), which is another type of LLJ, as identified by Tu et al. [19,20]. These studies show that the MBLJ is distinctly different from the SLLJ, and that it plays a dominant role in the horizontal transport of moisture from the NSCS to the Taiwan area. On the contrary, the warm, moist tongue in the frontal zone is related to the rising motion associated with the Mei-Yu jet/front system. In the absence of a nearby tropical cyclone, the occurrence of an MBLJ is related to the relatively large subsynoptic pressure gradients between a deeper Mei-Yu trough and a more pronounced West Pacific Subtropical High (WPSH) than the mean state in June [19,20]. We would like to confirm that an MBLJ is also present for the 6–7 June 2003 case. The importance of the horizontal moisture transport by the MBLJ to the spin-up of a frontal cyclone and heavy rainfall events over the Taiwan area during 6–7 June 2003 will also be investigated.
In this study, the data sources and methods are detailed in Section 2. The synoptic weather conditions and the depiction of the Mei-Yu jet/front system are presented in Section 3. In Section 4, the secondary circulation across the jet/front system is diagnosed. The coupling between the moist baroclinic forcing and the dynamic forcing aloft during the development of the frontal cyclone is explained in Section 5. The moisture transport by the MBLJ is examined in Section 6 and major new results are summarized in Section 7.

2. Data and Methods

The National Centers for Environmental Prediction (NCEP) Climate Forecast System Reanalysis (CFSR) data [21] with a 0.5° × 0.5° grid at 6 h intervals and 37 pressure levels are used to delineate: (1) the synoptic weather conditions and mesoscale disturbances in the frontal zone; (2) the structure of the Mei-Yu jet/front system; and (3) the horizontal moisture fluxes associated with the MBLJ from the NSCS to the Taiwan area. Rainfall data recorded at surface stations and by the Automatic Rainfall and Meteorological Telemetry System [19,22] are used to depict the heavy rainfall events over Taiwan.
A vertical cross-section along 117° E is constructed to delineate the vertical structure of the Mei-Yu jet/front system. Similar to Tu et al. [19], we construct a northwest–southeast cross-section (Figure 1) to identify the possible existence of the MBLJ. Furthermore, a 925 hPa Hovmöller diagram along this line is used to determine the relationship between the moisture transport by the MBLJ and the heavy rainfall event over Taiwan during 6–8 June 2003.
The vertically integrated water vapor transport (IVT) [19,23,24] is defined as
I V T = Q λ 2 + Q ϕ 2
The vertically integrated moisture transport (Q) components in the zonal (λ) and meridional (ϕ) directions are given as follows.
Q λ = 1 g P 0 P 1 q u d p
Q ϕ = 1 g P 0 P 1 q v d p
where q is the specific humidity (g kg−1), u is the zonal wind (m s−1), υ is the meridional wind (m s−1), g is the acceleration due to gravity (m s−2), P0 is surface pressure, and P1 is the 850 hPa level pressure.
The two-dimensional frontogenesis function [4] is defined as
F = 1 θ θ x u x θ x + v x θ y θ y u y θ x + v y θ y
where u and v are the horizontal winds and θ is the potential temperature (K).
The Ertel potential vorticity (EPV) [25,26] is calculated by
E P V = 1 ρ η · θ
where ρ is the density (kg m−3), η is the absolute vorticity (s−1), and θ is the potential temperature (K).

3. Evolution of Weather Patterns

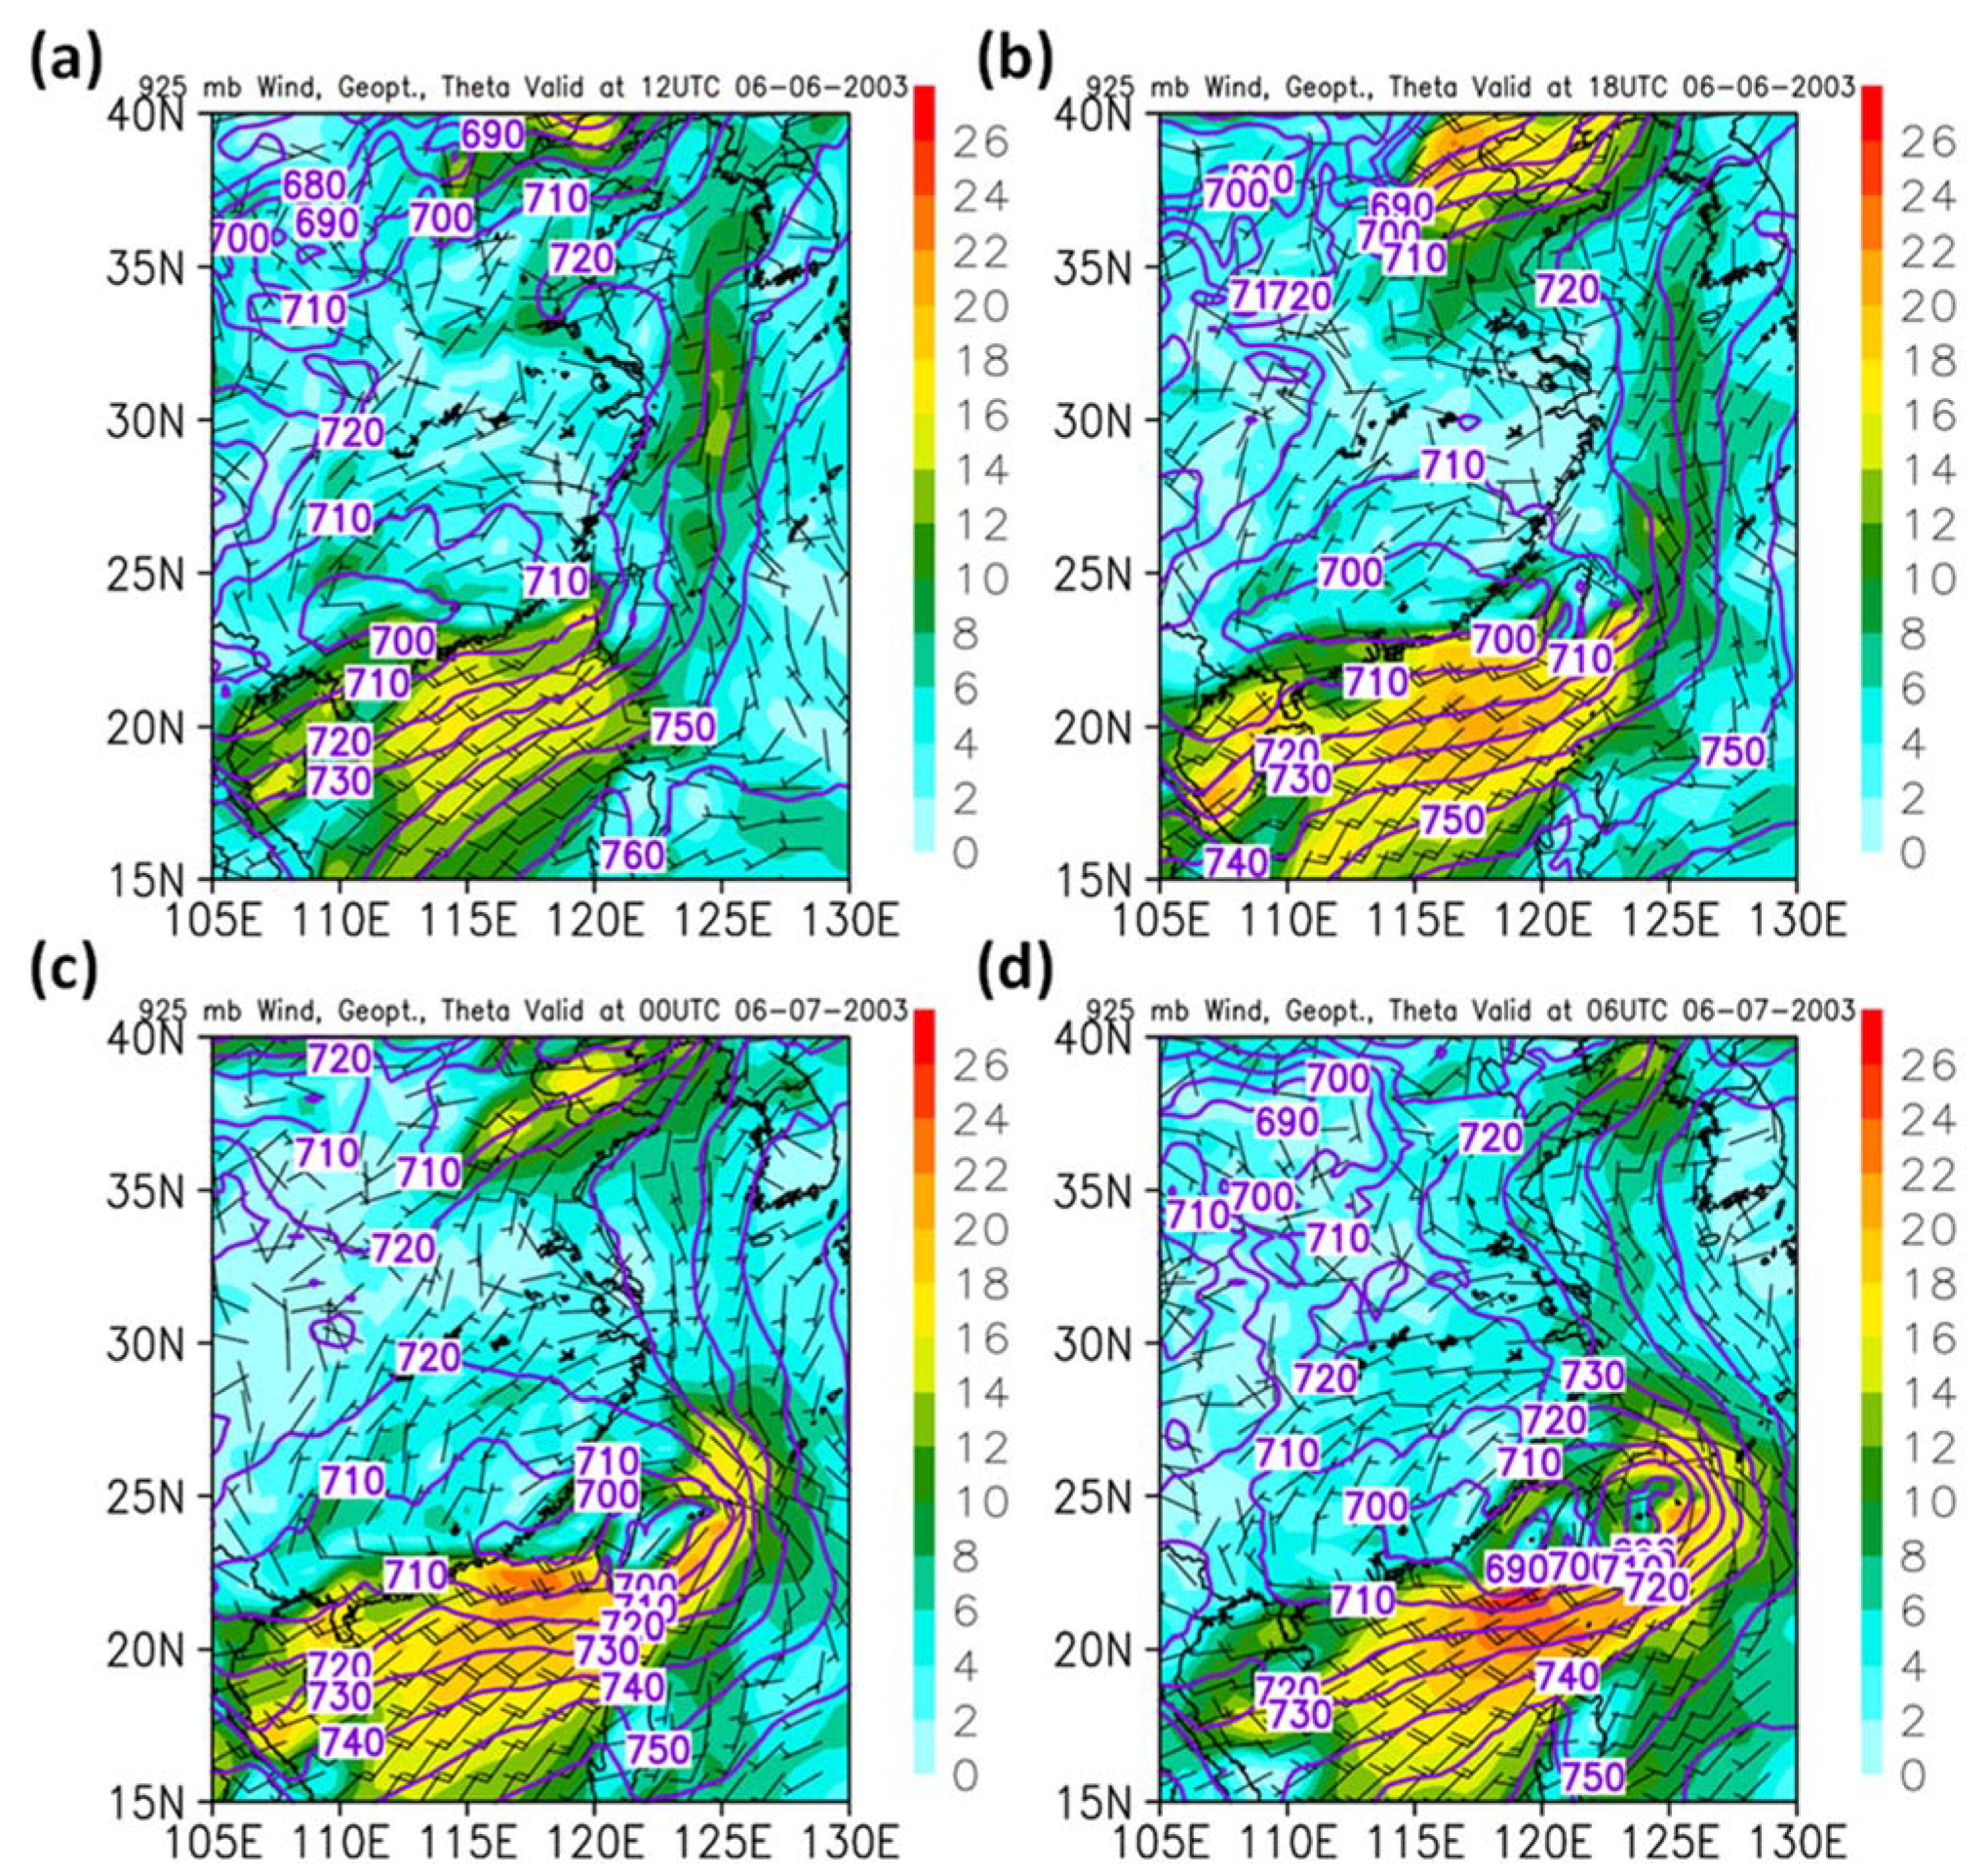
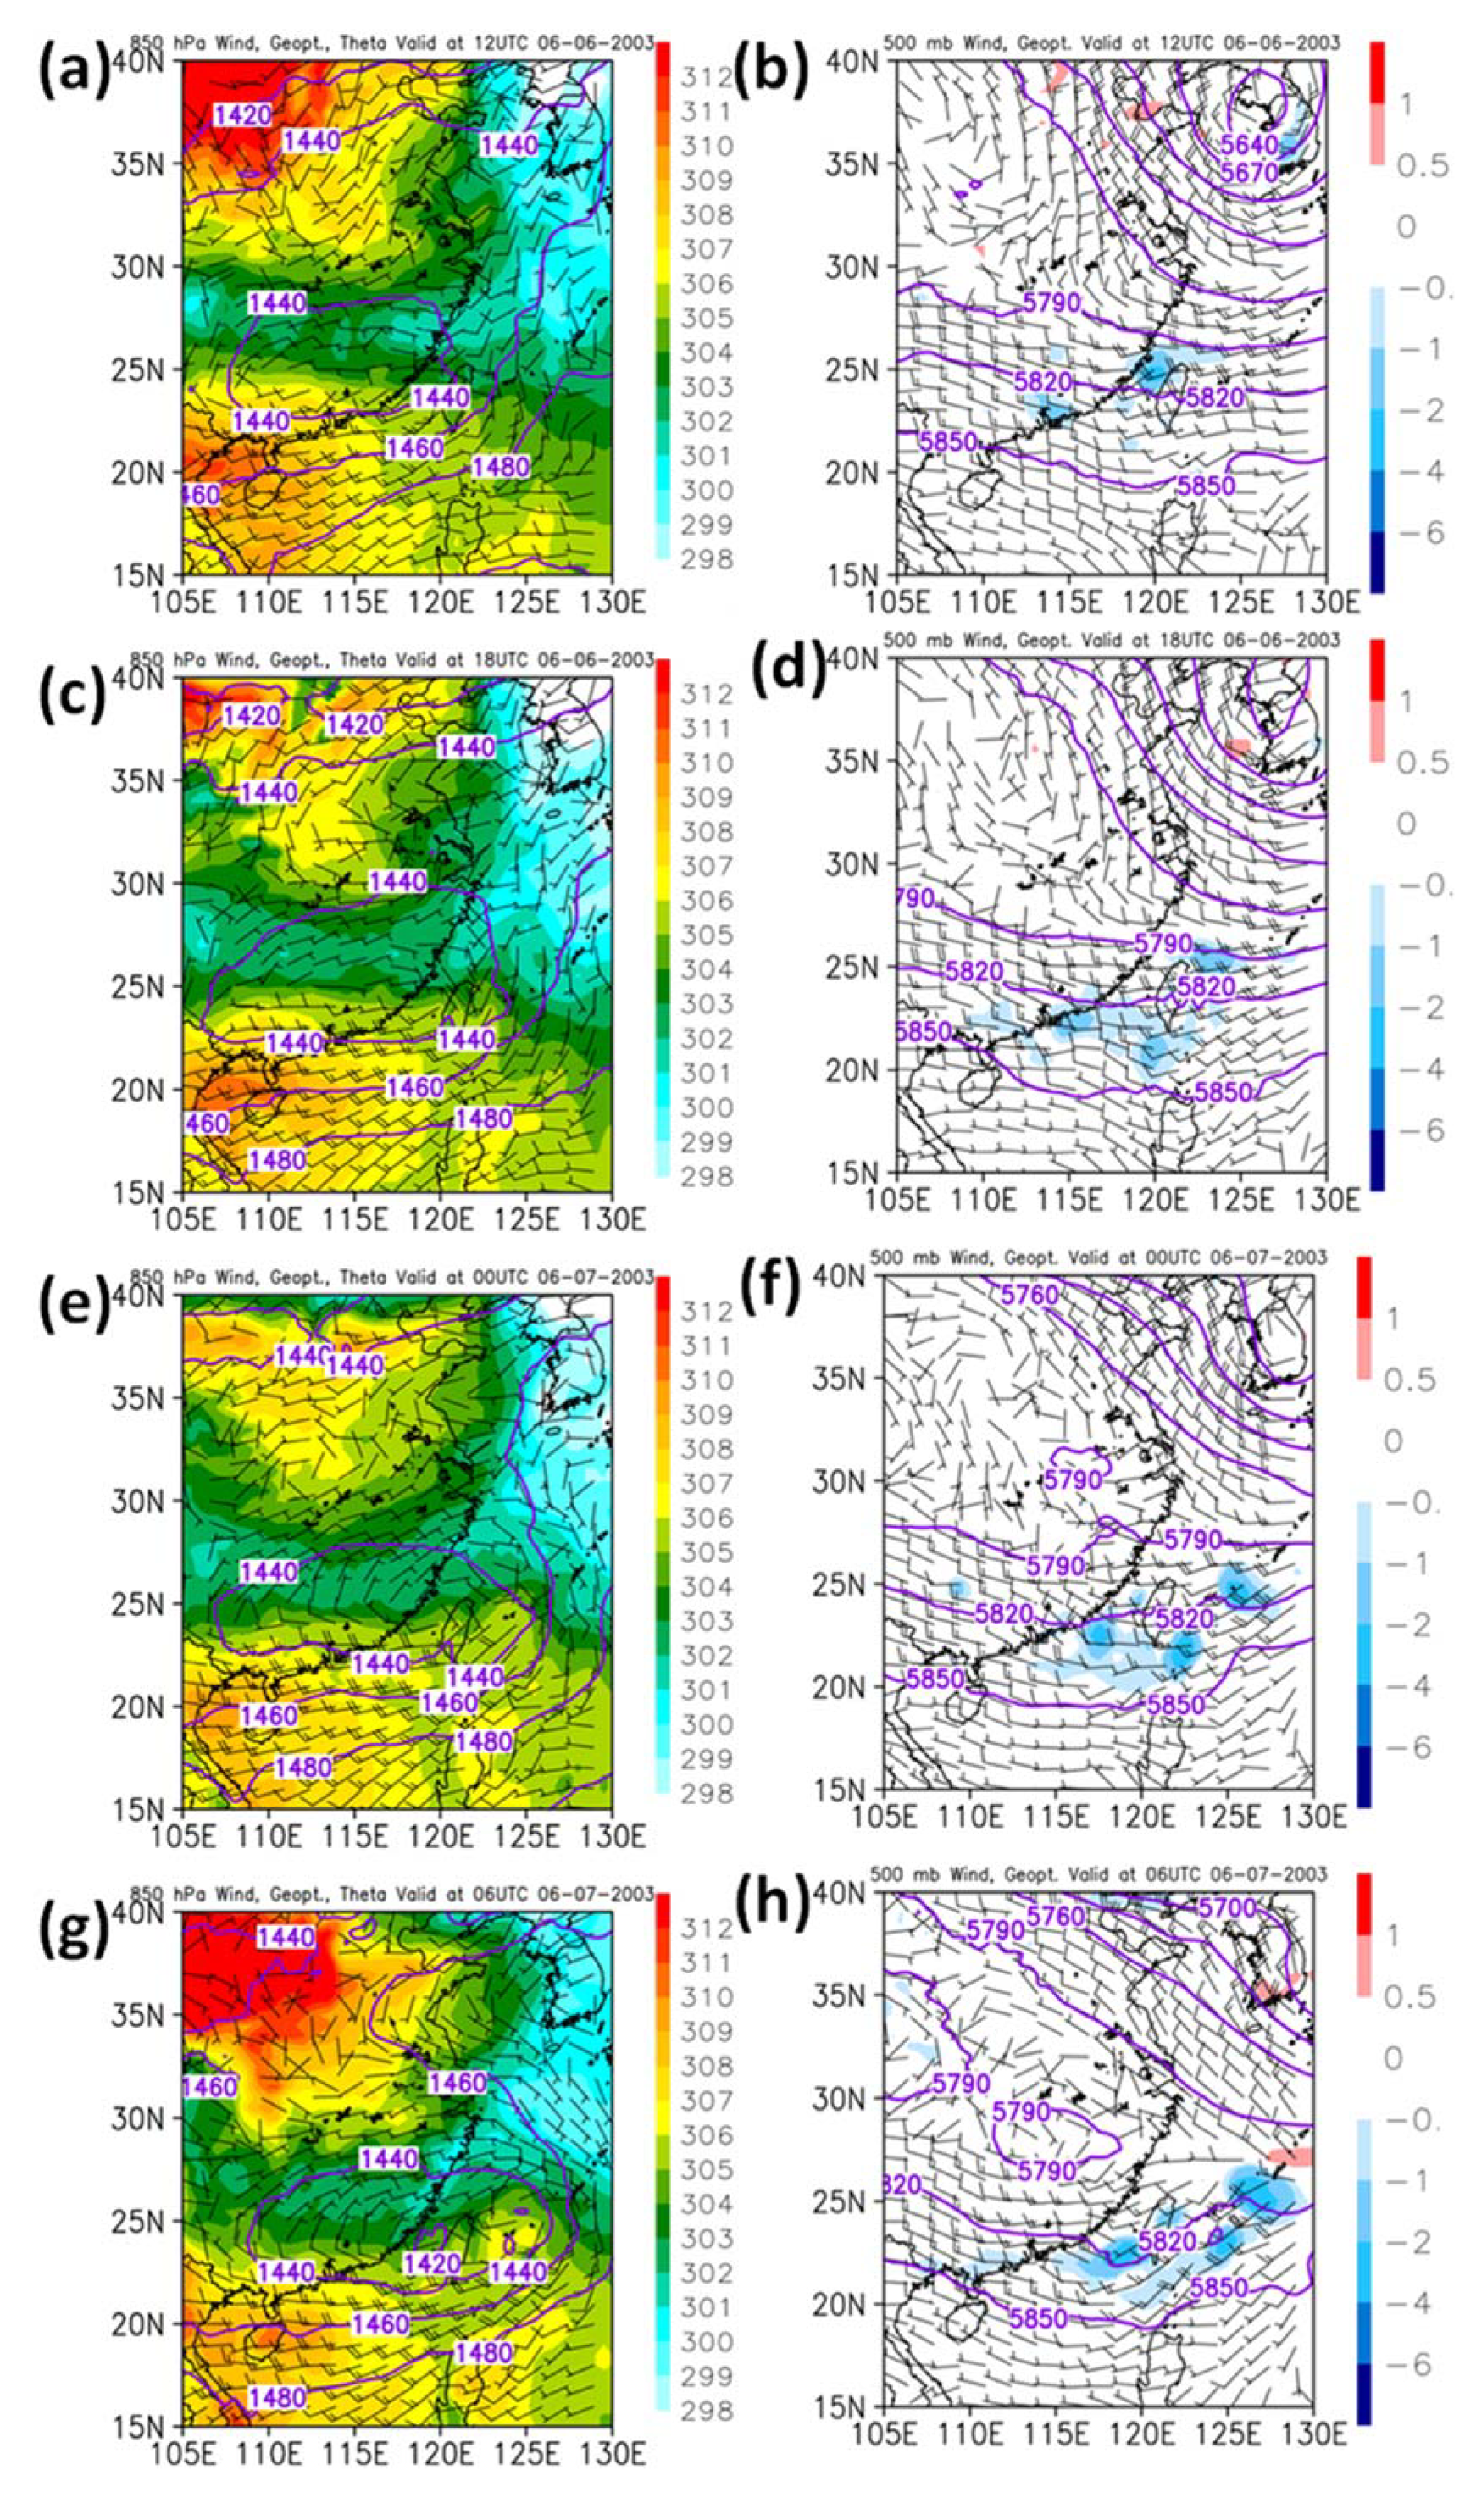
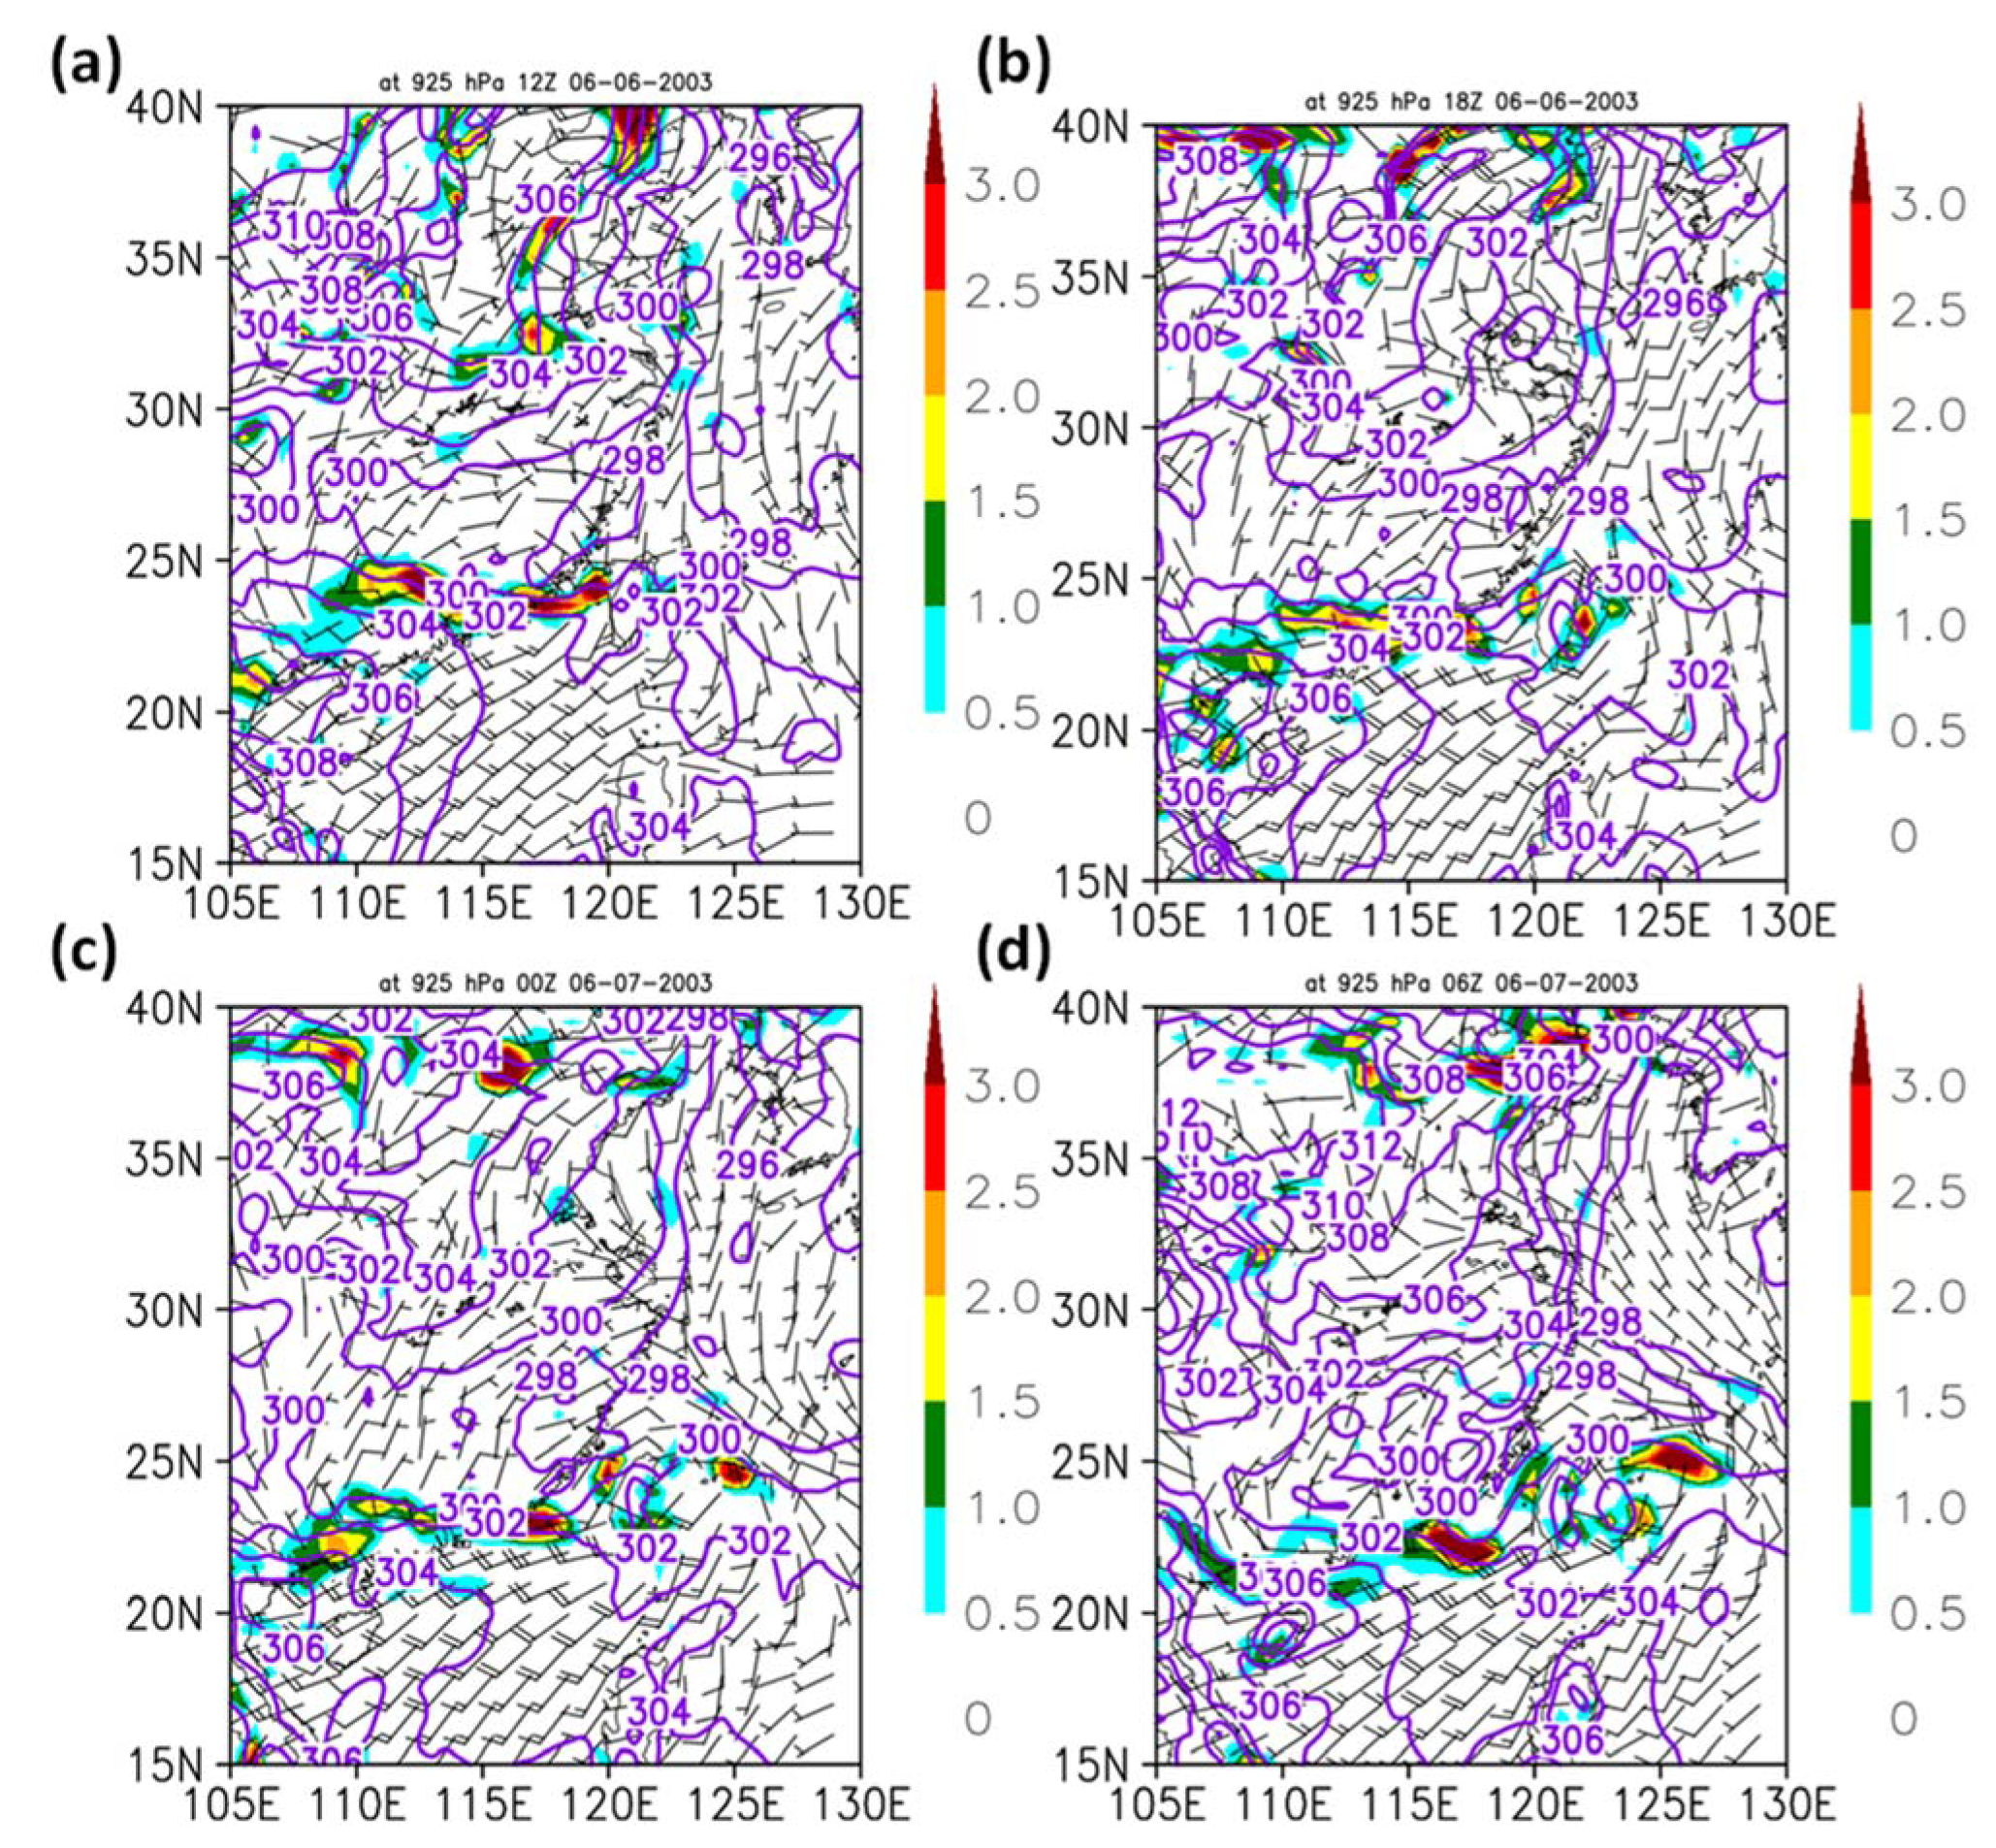
During 1200 UTC 6 through 0600 UTC 7 June 2003 (Figure 2), the presence of an east–west-oriented Mei-Yu front over Southern China is evident from the CFSR geopotential heights and winds at 925 hPa. At 1200 UTC 6 June, a Mei-Yu frontal cyclone develops over Southern China around 112° E and 24° N (Figure 2a) under prevailing 500 hPa westerlies over the Yun-Guei Plateau (Figure 3b). The cyclone subsequently deepens and migrates southeastward toward the northern Taiwan Strait (Figure 2b,c). At 0600 UTC 7 June, the frontal cyclone extends from Southern China to the ocean off the Eastern Taiwan coast. With the deepening and expansion of the frontal cyclone, the southwesterly monsoon flow over the NSCS strengthens and exceeds 20 m s−1 after 1800 UTC 6 June (Figure 2). Large thermal contrasts exist along the E–W-orientated frontal zone between the cold, dry, postfrontal northeasterlies and prefrontal warm, moist southwesterly flow (Figure 4). At 1800 UTC 6 June, the north–south thermal contrast across the frontal zone along 117° E at the 925 hPa level is relatively large (≥8 K) (Figure 4b). During 0600 UTC 6 June–0600 UTC 7 June, the Mei-Yu frontal zone advances southward and reaches the Southern China coast. A pronounced axis of frontogenesis is diagnosed along the Mei-Yu frontal boundary (Figure 4).
At the 850 hPa level, a sub-synoptic cyclonic circulation is evident over Southeastern China (Figure 3) with a windshear line between the warm southwesterly flow and cold northeasterly flow. From 0600 UTC 6 June to 0600 UTC 7 June, it deepens, expands, and moves southeastward. At 0600 UTC 7 June, the circulation center is off the Central Taiwan coast (23° N, 118° E) (Figure 3g). During 1200 UTC 4 June–0000 UTC 7 June, a mid-latitude trough at the 500 hPa level migrates eastward with northerly winds behind the trough (Figure 3b,d,f). The intrusion of cold northerly winds from Northern China toward the Southern China Plain behind the propagating mid-latitude trough is evident. The winds south of the deepening Mei-Yu disturbance turn clockwise with height, from 850 hPa southwesterlies to 500 hPa westerlies (Figure 2, Figure 3 and Figure 4), indicating the presence of warm air advection. The 500 hPa vertical motion shows rising (sinking) motion ahead (behind) the 925 hPa frontal zone, where the frontogenesis has a maximum.
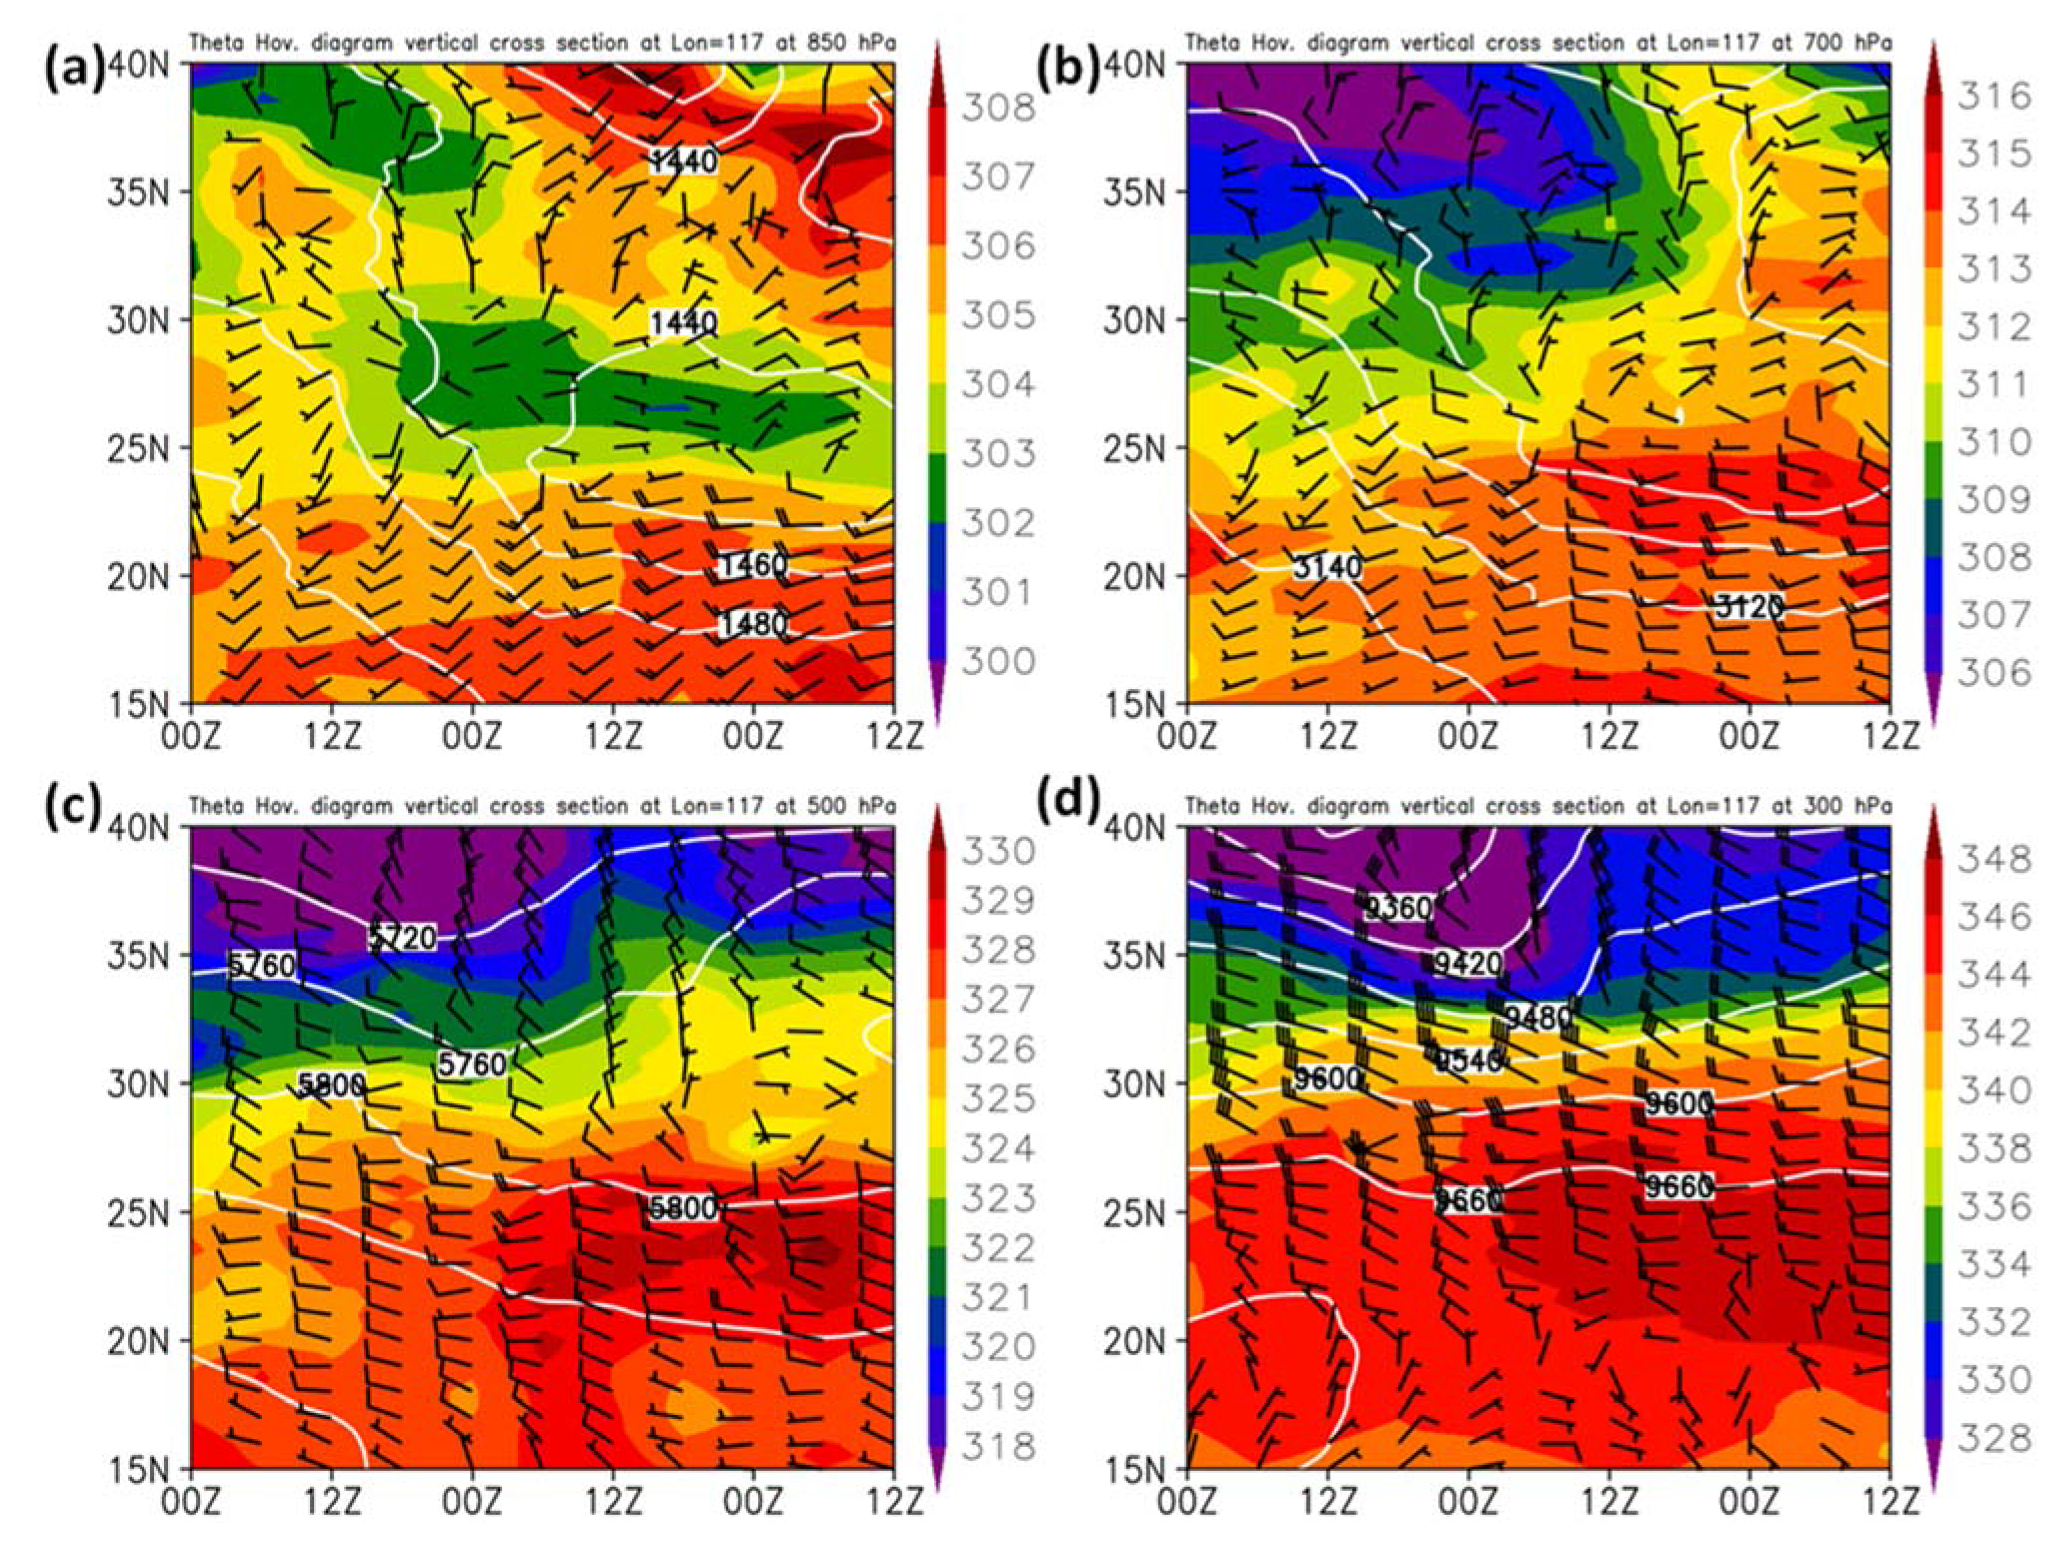
Figure 5 shows the latitude–time cross-sections of winds, geopotential height, and potential temperature at four different levels (850, 700, 500, and 300 hPa) along 117° E. From 0000 UTC 5 June to 0000 UTC 6 June, the advection of cold air by the northerly winds behind the 850 hPa mid-latitude trough is evident (Figure 5a). In the meantime, the eastern end of the Mei-Yu frontal cyclone propagates across 117° E around 1800 UTC 5 June, with cold northeasterlies behind the southward-moving Mei-Yu front. At 1800 UTC 6 June, the thermal contrast between the prefrontal southwesterly flow and postfrontal winds is as large as 8 K. Over the China Plain, the potential temperature exhibits diurnal variations due to daytime heating/nighttime cooling (Figure 5a).
At the 700 hPa level, the intrusion of cold air from the mid-latitudes to Southern China (~40° to 28° N) is also evident (Figure 5b) as the trough crosses 117° E over Northern China around 0600 UTC 6 June and migrates to the Sea of Japan. The cold air advection from the north behind a mid-latitude trough, during 0000 UTC 5 June–1200 UTC 6 June, occurs at all levels and the baroclinic zone has a northward tilt with respect to height (Figure 5). The largest thermal contrast (>18 K), between the intruding cold northwesterlies and the west/southwesterlies over Southern China, occurs at the 300 hPa level with the presence of a subsynoptic upper-level jet (SULJ). During 1800 UTC 5 June–1200 UTC 6 June, the SULJ associated with the upper-level front due to thermal winds exceeds 40 m s−1.
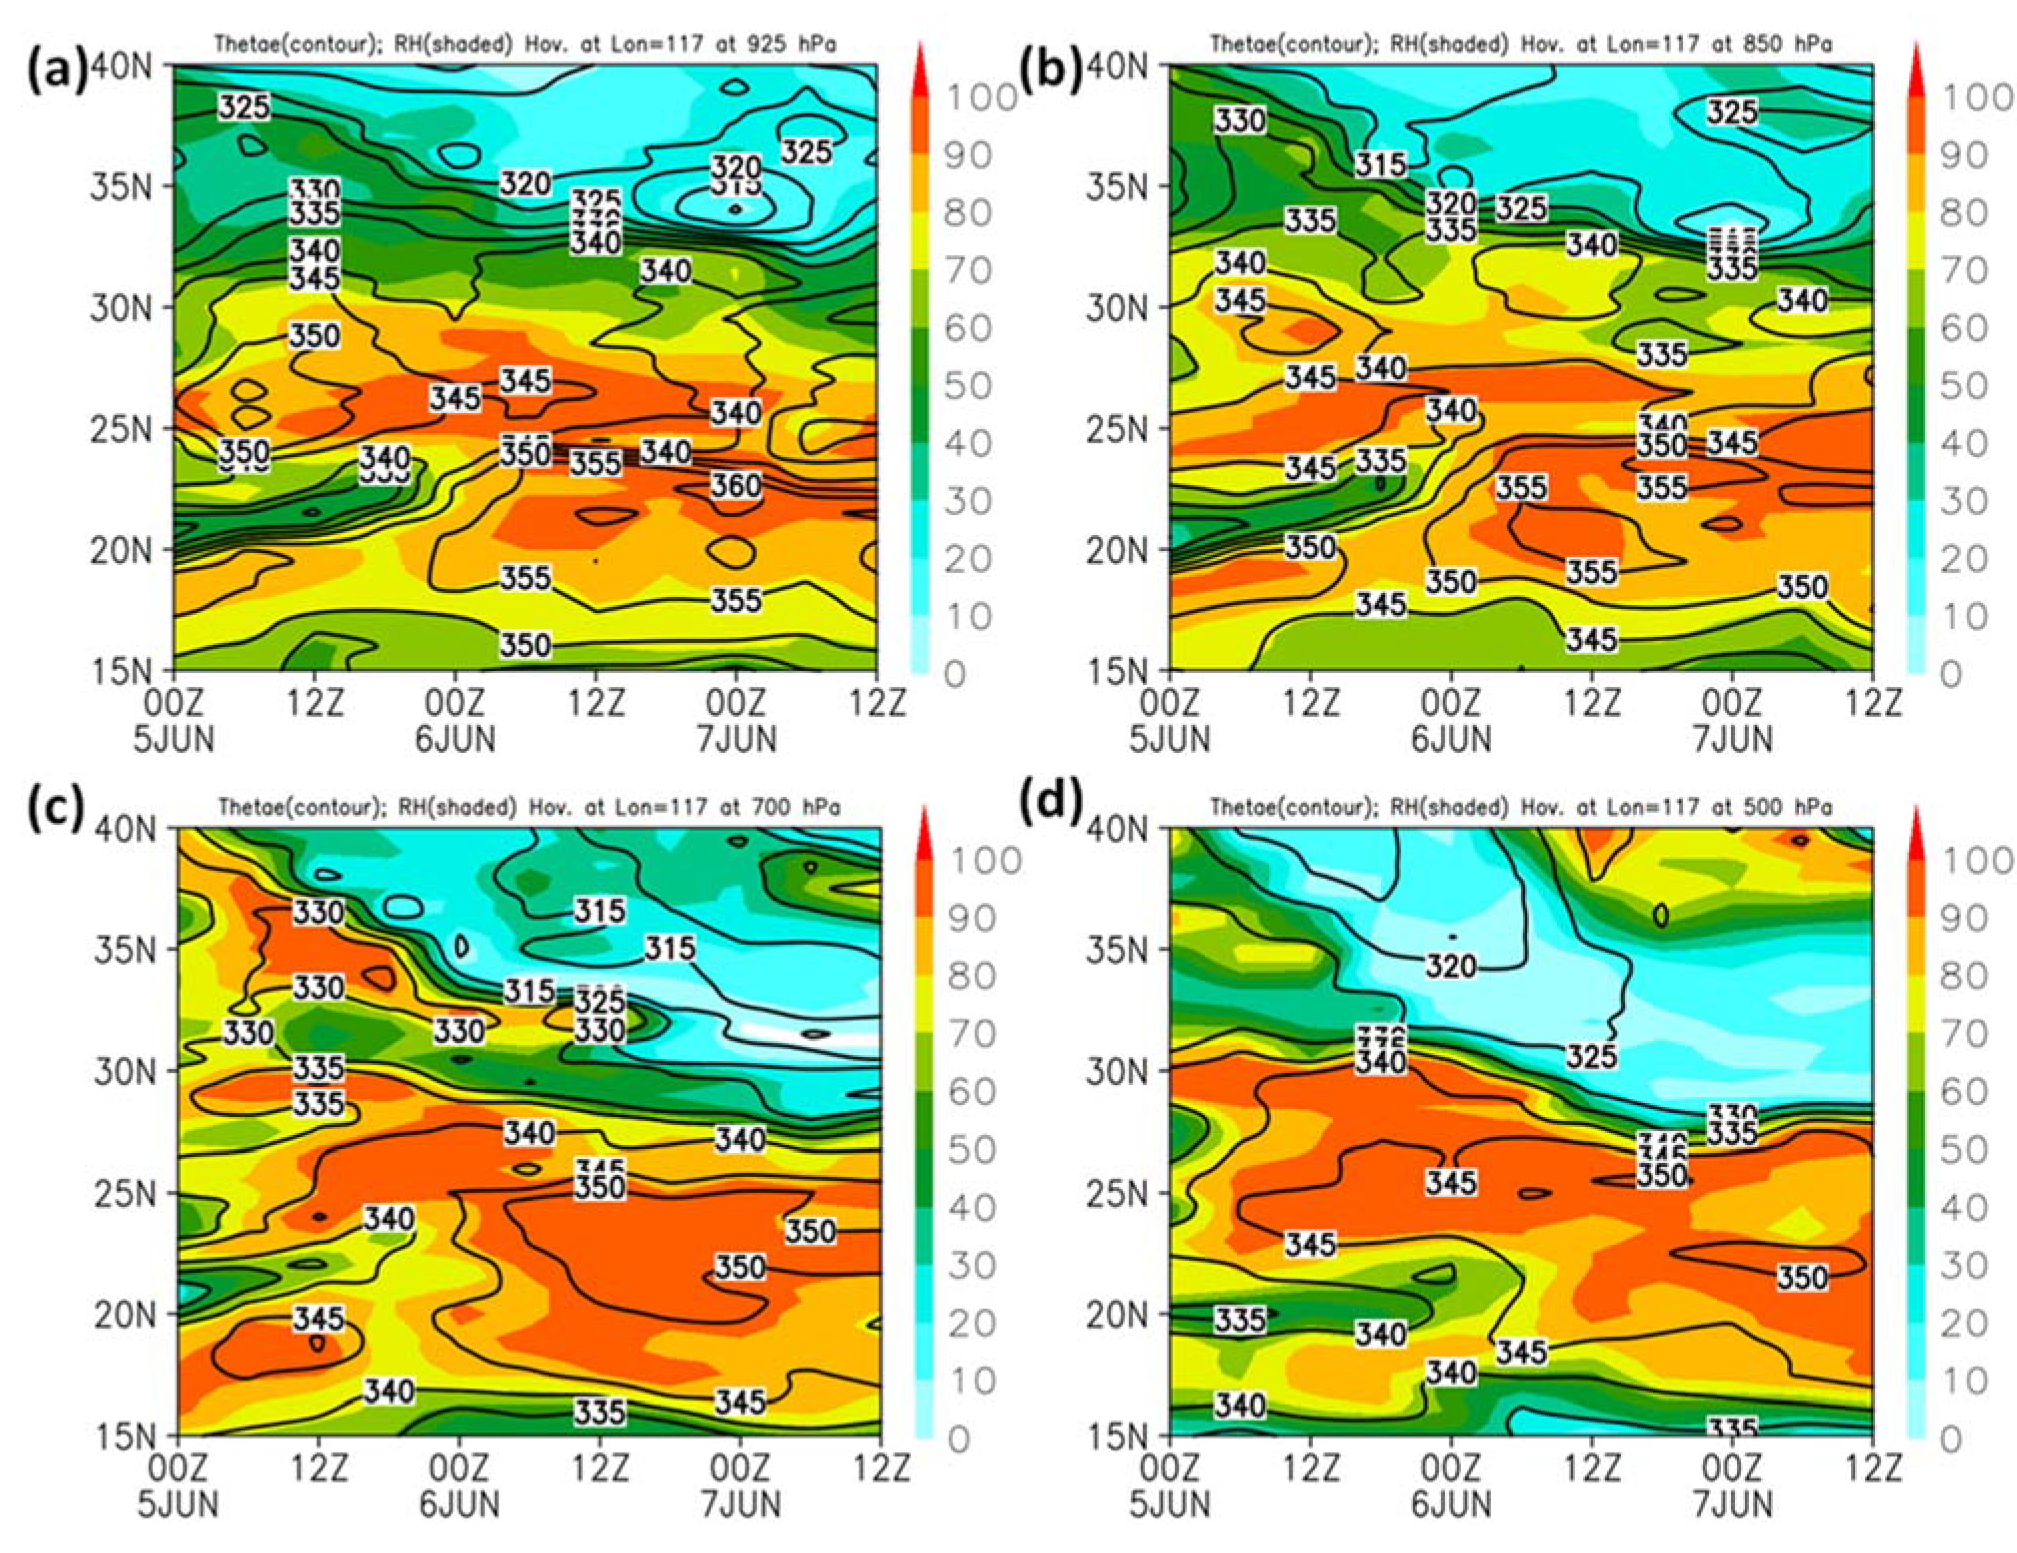
Latitude–time cross-sections of θe at four different levels (925, 850, 700, and 500 hPa) along 117° E are presented in Figure 6. The postfrontal southward-propagating cold, dry, and low θe polar air is apparent at all levels, especially in the mid-troposphere. An area of maximum θe (greater than 345 K) with RH greater than 90% exists around 24–27° N at all four levels. A moist tongue extends vertically in the frontal zone due to the vertical motion associated with the Mei-Yu front. It is important to note that as the Mei-Yu cyclone deepens, the high θe air (greater than 350 K) occurs in the low levels associated with the strengthening of the southwesterly monsoon. After 0000 UTC 6 June, the highest θe air (greater than 360 K) is found at the 925 hPa level (Figure 6a).
In summary, based on the evolution of weather patterns, it is apparent that the Mei-Yu system possesses the following characteristics: (1) a large thermal contrast, greater than 8 K, below the 850 hPa level, between the cold, dry northeasterlies behind the front and the warm, moist southwesterly monsoon flow; (2) a pronounced axis of frontogenetical forcing along the frontal boundary in the low levels; (3) significant warm air advection in the prefrontal atmosphere with winds turning clockwise with height; (4) northward tilt of the baroclinic zone; (5) rising (sinking) motion at the 500 hPa level, ahead of (behind) the 850 hPa frontal zone; (6) large temperature gradients associated with the upper-level frontal zone with an SULJ of more than 40 m s−1. These features are in sharp contrast to the semitropical disturbance, with an equivalent barotropic, weak temperature gradient system due to Ekman pumping (CISK), suggested by G. Chen and Chang in the 10–15 June 1978 case [3] over Southern China.

4. The Secondary Circulation across the Mei-Yu Jet/Front System

In the 6–7 June 2003 case, the SLLJ peaking at the 850 hPa level could be driven by a CISK mechanism induced by mesoscale convective systems (MCSs) [14]. However, several diagnostic and modeling studies attributed the SLLJs associated with other Mei-Yu fronts to a mass–momentum adjustment process driven by moist baroclinic forcing associated with the deepening of the frontal cyclone; see [27,28,29,30] and others. This discrepancy will be further investigated in this section.
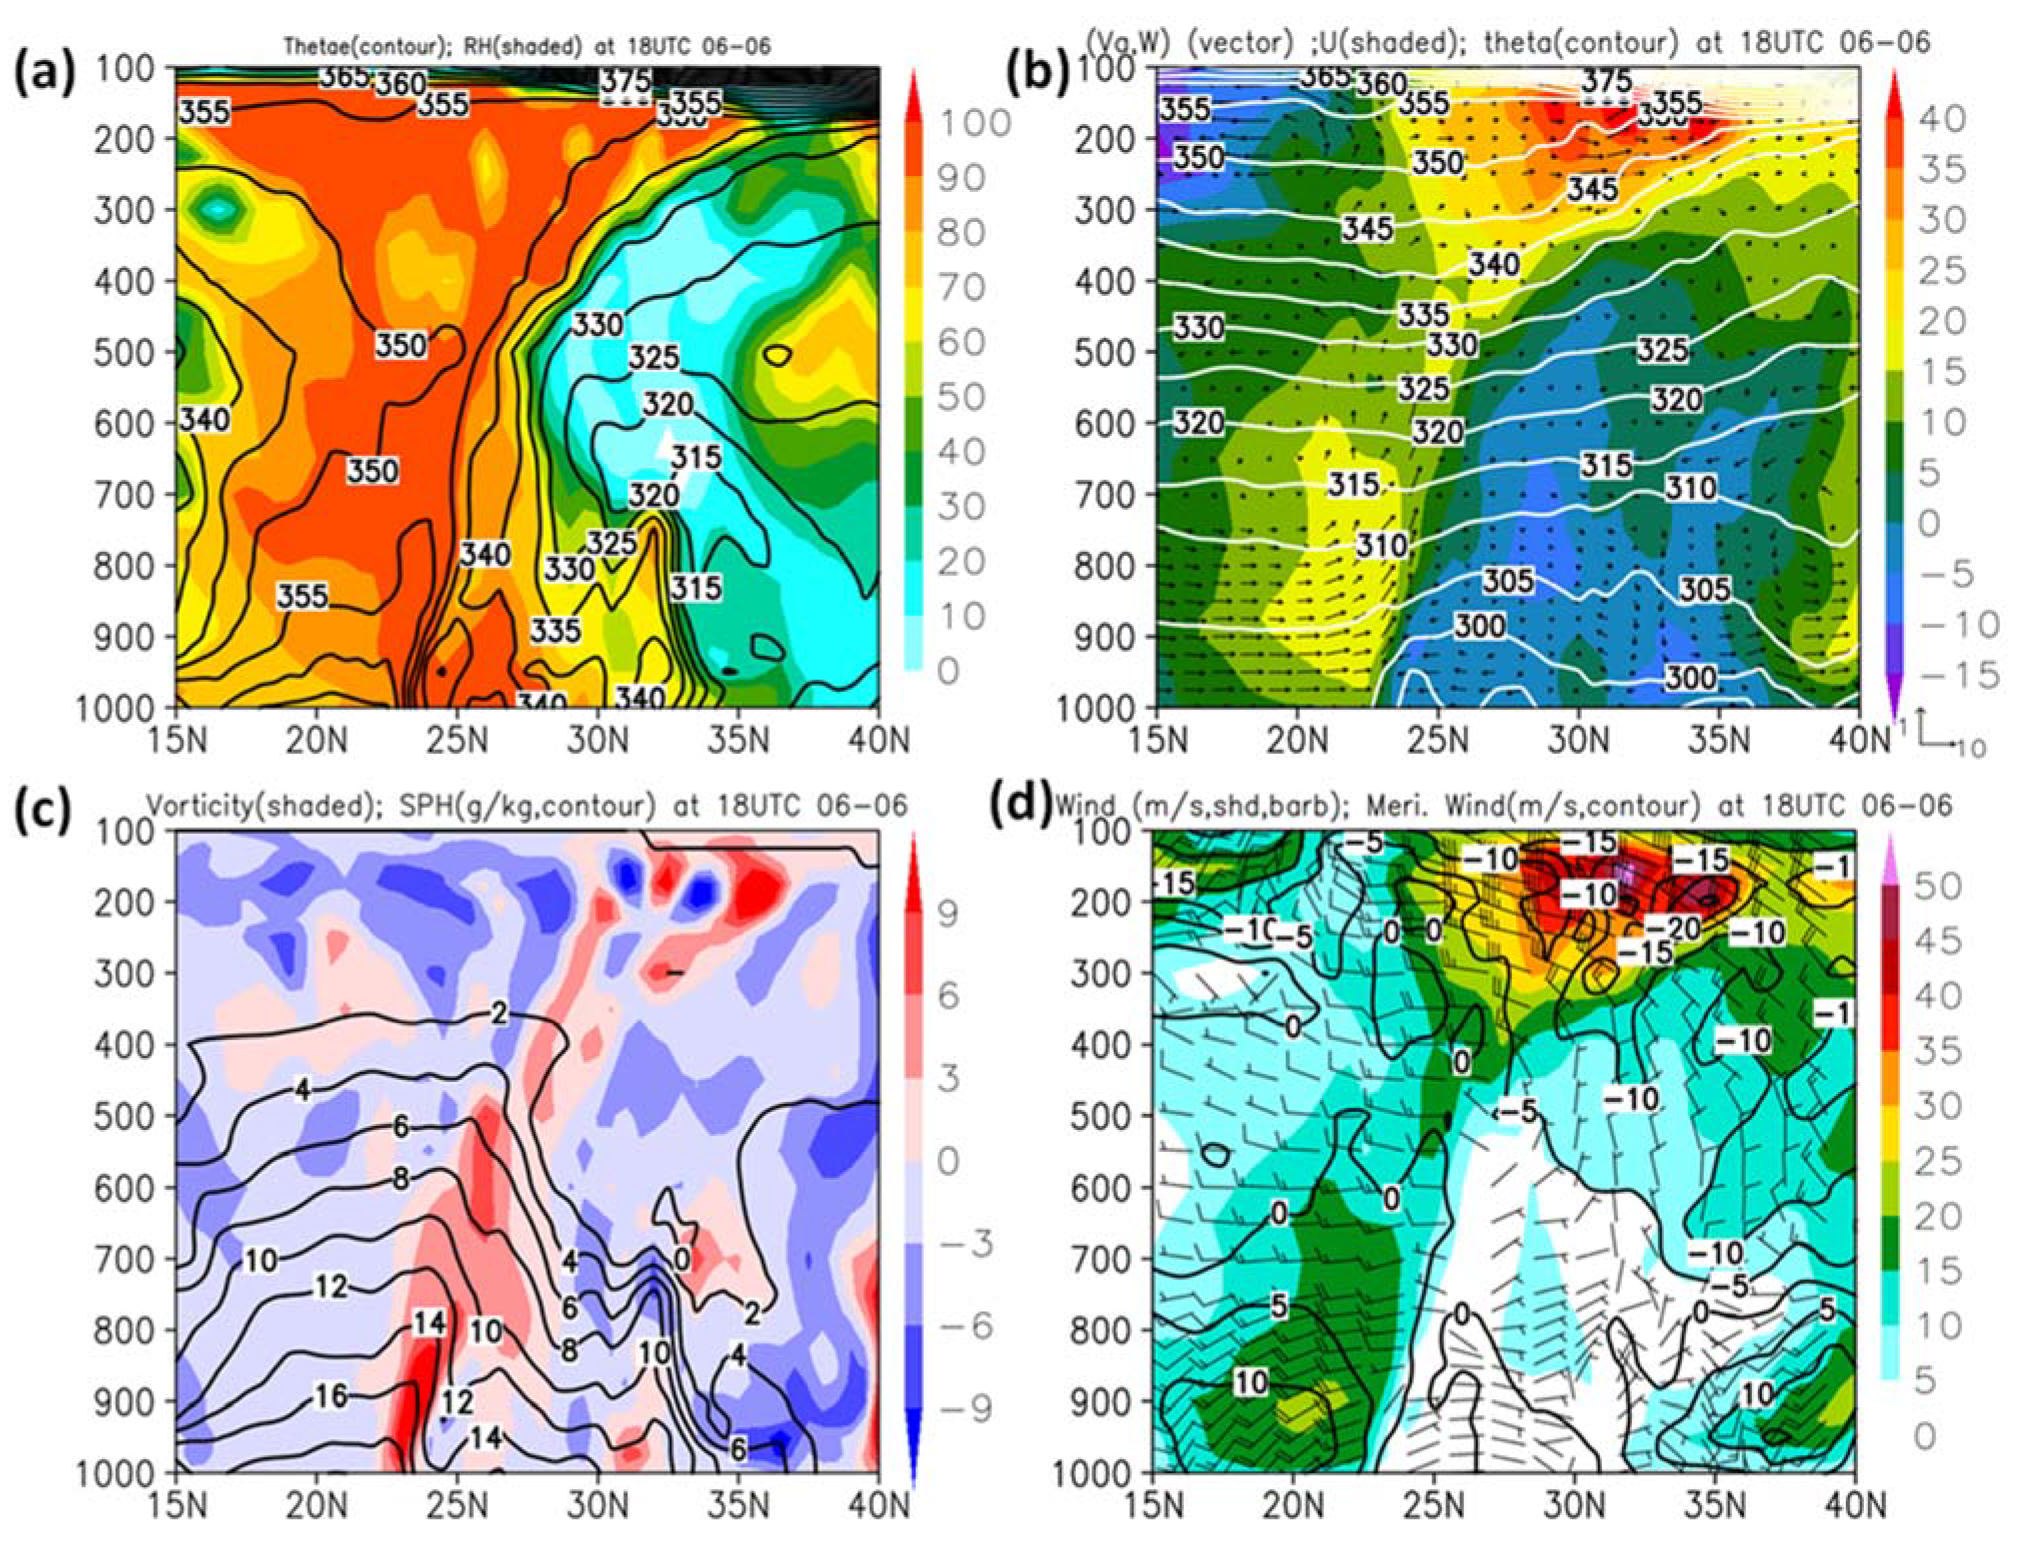
From the vertical cross-sections along 117° E at 1800 UTC 6 June (0200 LT 7 June), the prefrontal low-level high θe air (Figure 7a) is transported vertically upward by rising motion in the frontal zone (Figure 7b). The rising motion is located above the surface cold front (Figure 7b). The θ and θe gradients between the postfrontal cold, dry air and the prefrontal warm, moist air are greatest near the surface around 23° N (Figure 7a,b). The relative vorticity has a maximum axis in the frontal zone, which tilts northward (Figure 7c). Hence, in contrast to G. Chen et al. [14], the frontal zone exhibits appreciable temperature contrast (>8 K) and moisture gradients in the lowest levels with a marked vertical tilt (~1/100). Additionally, the horizontal winds (Figure 7d) have an SLLJ core near 21° N, with an SULJ farther to the north around 32° N due to thermal winds. There are cross geopotential height contour ageostrophic winds perpendicular to the frontal surface (Figure 7b) associated with both the SLLJ and the SULJ (Figure 7d). Figure 8 reveals the presence of tropopause folding associated with an upper-level front, with descending motions transporting the high-PV stratospheric air downward, as found in TAMEX studies [6,7,27]. The secondary circulation across this jet/front system is remarkably similar to the TAMEX Intensive Observing period (IOP) #5 case [27]. From the energy conversions associated with the SLLJ calculated from model results [31], the intensification of the SLLJ is due to the increase in nondivergent kinetic energy (kND). The SLLJ is generated from the potential energy through the cross-contour divergent winds and converted into kND via a process through the transverse secondary circulation across the jet/front system.

5. Coupling between the Secondary Circulation and Dynamic Forcing Aloft

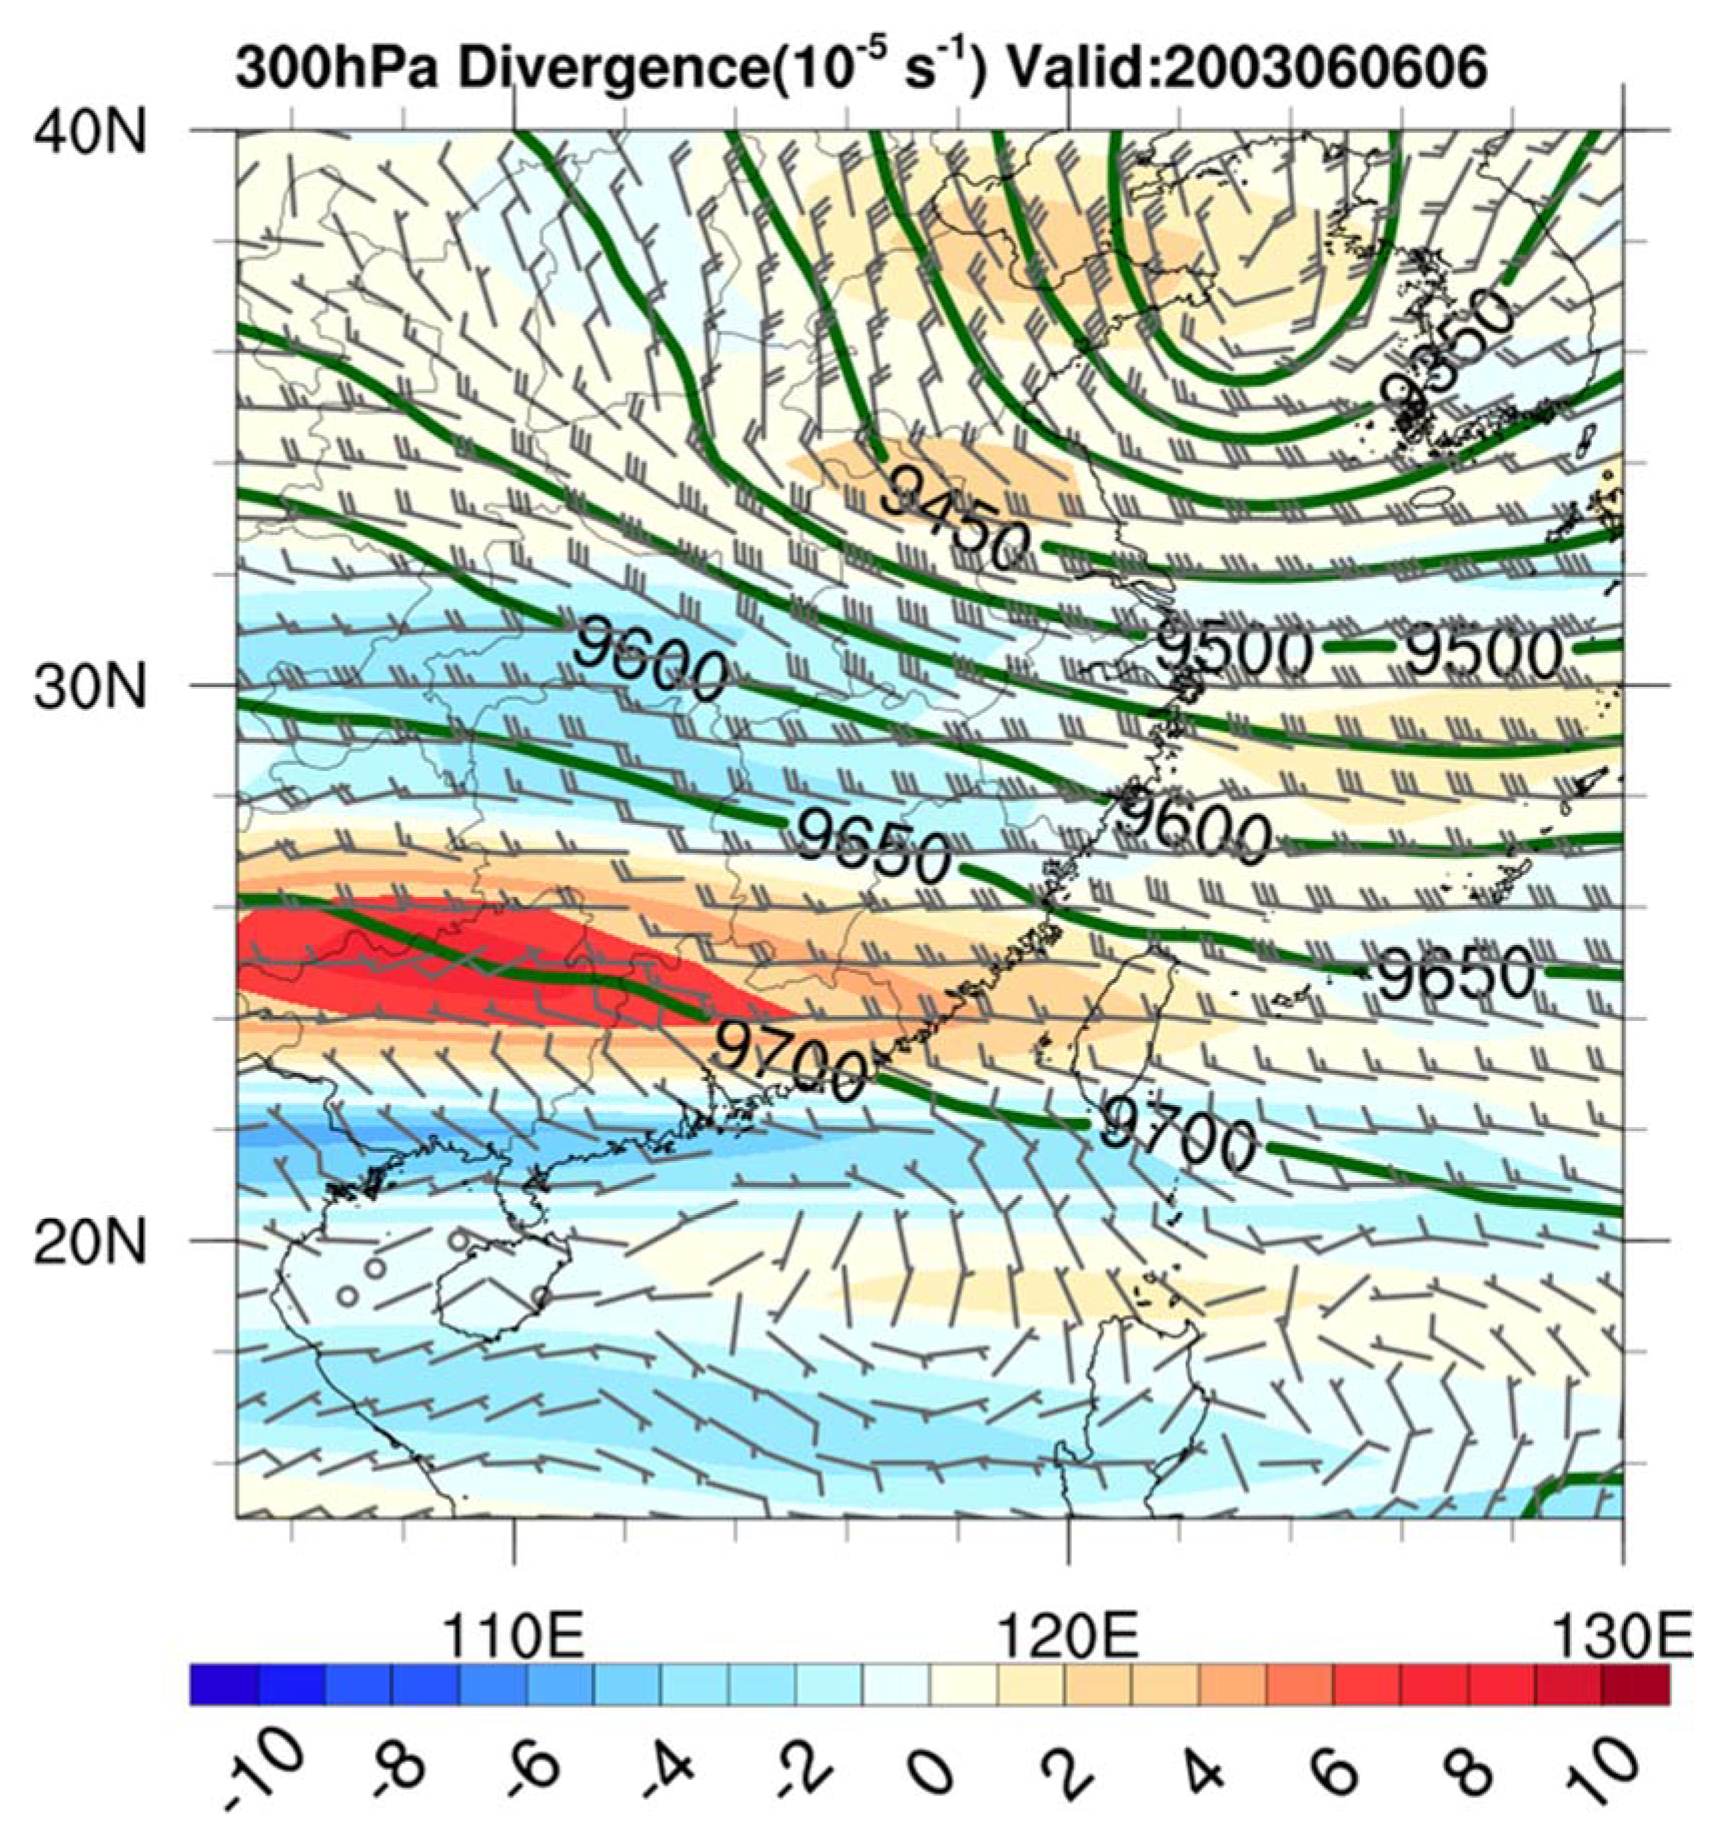
The spin-up of the frontal cyclone in the 6–7 June 2003 case occurs after the southward shift of the SULJ into the Southern China Plain (Figure 5d). The 300 hPa chart shows that, at 0600 UTC 6 June, the spin-up of the frontal cyclone over South/Southwestern China occurs when the cyclone is south of the entrance region of the SULJ with upper-level divergence (Figure 9). In this case, the low-level baroclinic forcing (Figure 4) is coupled with dynamic forcing aloft. In the TAMEX IOP #5 case (1–2 June 1987), model results [28] show that latent heat release provides positive feedback for the deepening of the frontal cyclone. With latent heating, the areal-averaged baroclinic conversion rate over the frontal cyclone increases and is more than five times greater in the upper levels [28]. The synoptic setting for the deepening of the frontal cyclone is remarkably similar to those found for heavy rainfall events over Korea associated with the summer monsoon [32,33]. The coupling between the low-level baroclinic forcing and the dynamic forcing aloft also occurs during TAMEX IOP #3 (20–23 May 1987) [34]. These results suggest that the large-scale organization of this Mei-Yu jet/front system and the development of the Mei-Yu frontal cyclone is not due to Ekman pumping (CISK), as suggested by G. Chen et al. [14] for the same case.

6. Moisture Transport and Heavy Rainfall over Taiwan

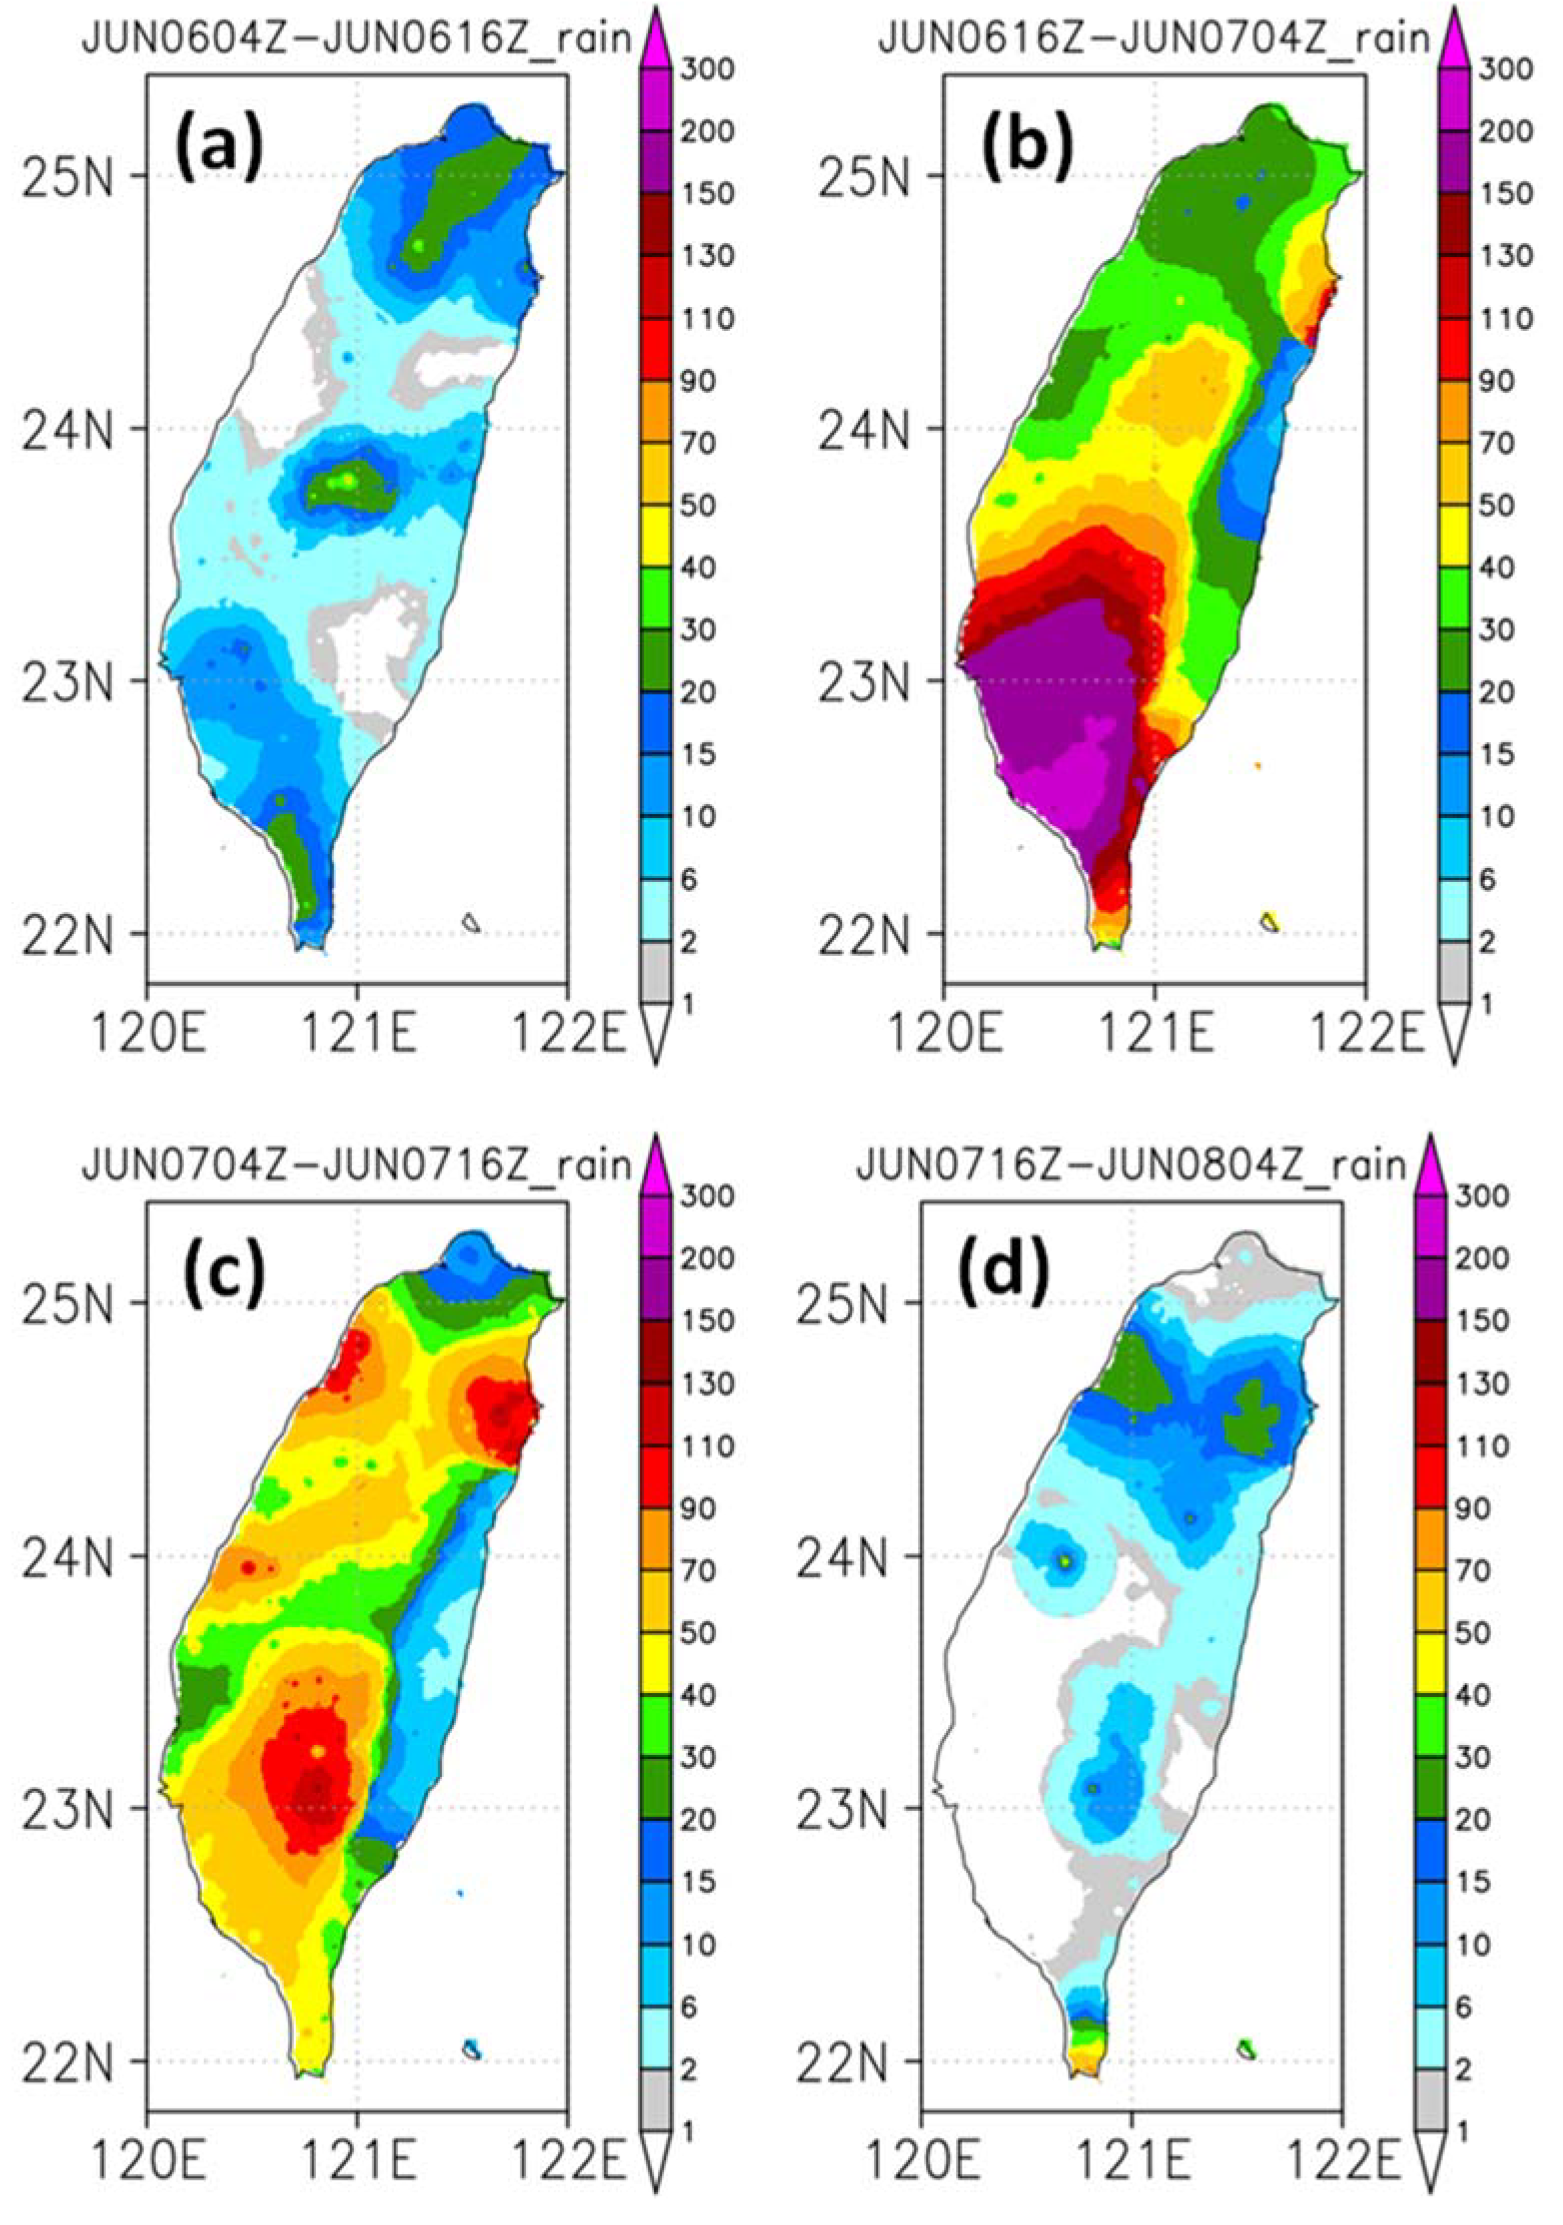
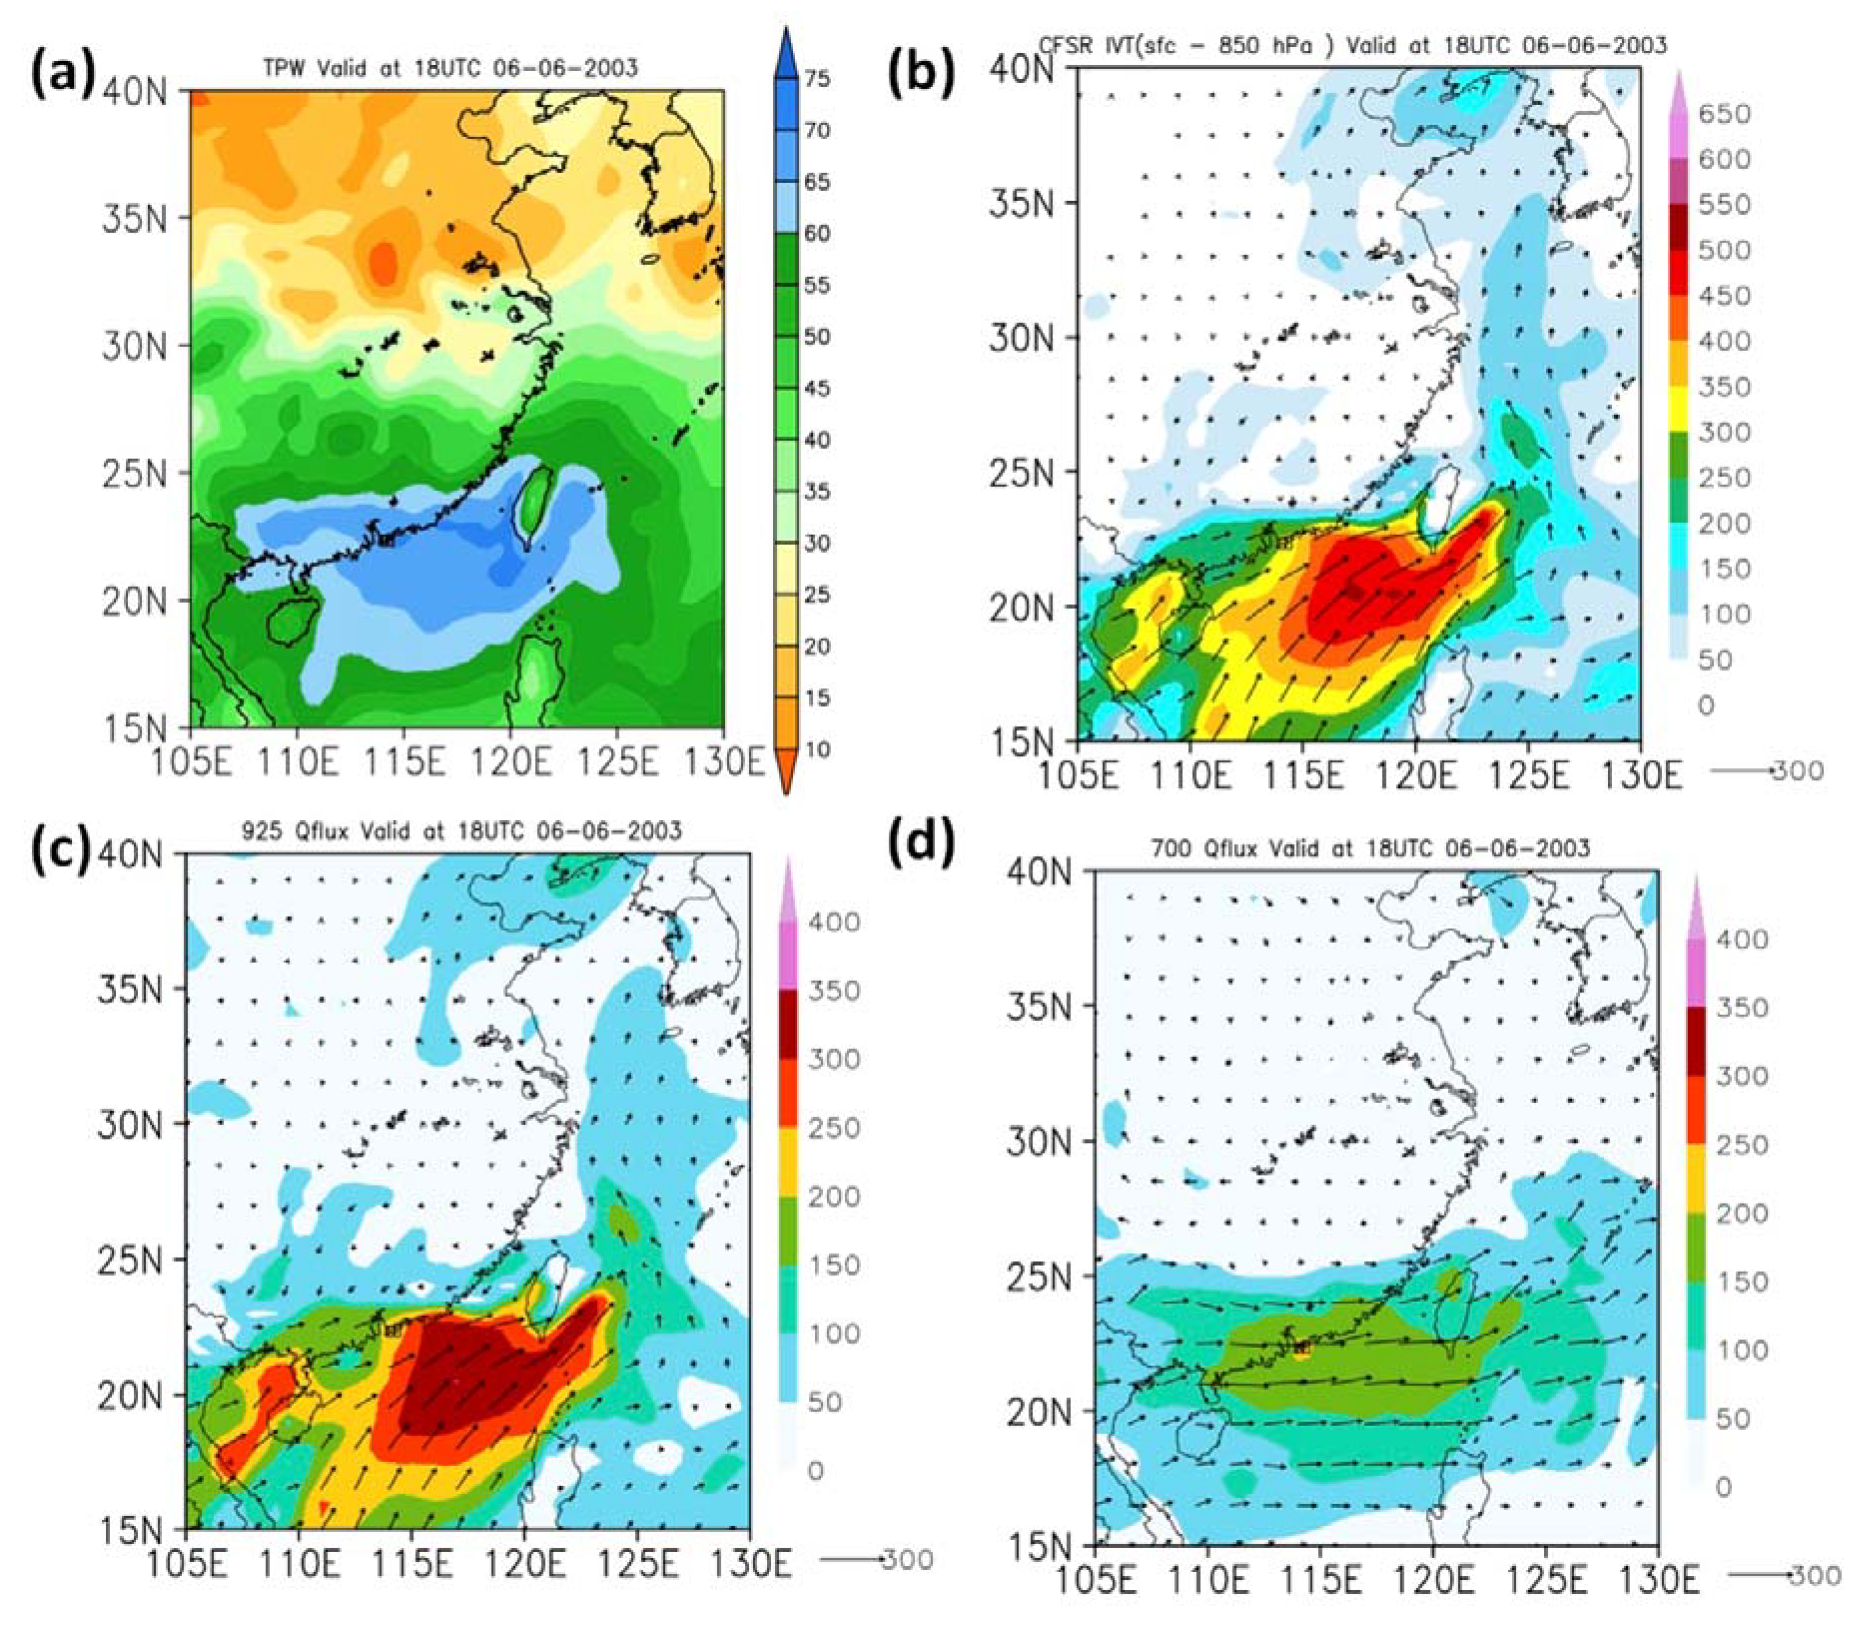
During 0000–1200 LT 7 June, the 12-hour rainfall accumulation (Figure 10a–d) was greater than 200 mm at almost all stations in Southwestern Taiwan, and daily rainfall accumulations were greater than 350 mm. This region of heavy rainfall extended from the southwestern coastal areas (near Kaohsiung City, black dot in Figure 1) to the Central Mountain Range (CMR) [24].
The moisture transport from the NSCS to the Taiwan area mainly occurred in the marine boundary layer (MBL) rather than within the 850 hPa to 700 hPa layer. At 1800 UTC 6 June (0200 LT 7 June), the total precipitable water (TPW) (Figure 11a) over most regions of the NSCS was greater than 65 mm. Large southwesterly IVT below the 850 hPa level, greater than 450 kg m−1 s−1 (Figure 11b), extended from the NSCS to Taiwan, impinging on the Taiwan terrain. Large horizontal moisture fluxes occurred at the 925 hPa level (greater than 300 g kg−1 m s−1) (Figure 11c) due to the presence of the MBLJ upstream of Taiwan, with wind speed greater than 20 m s−1 (Figure 4b and Figure 12a). These conditions were also found in the 11–12 June 2012 case [13].
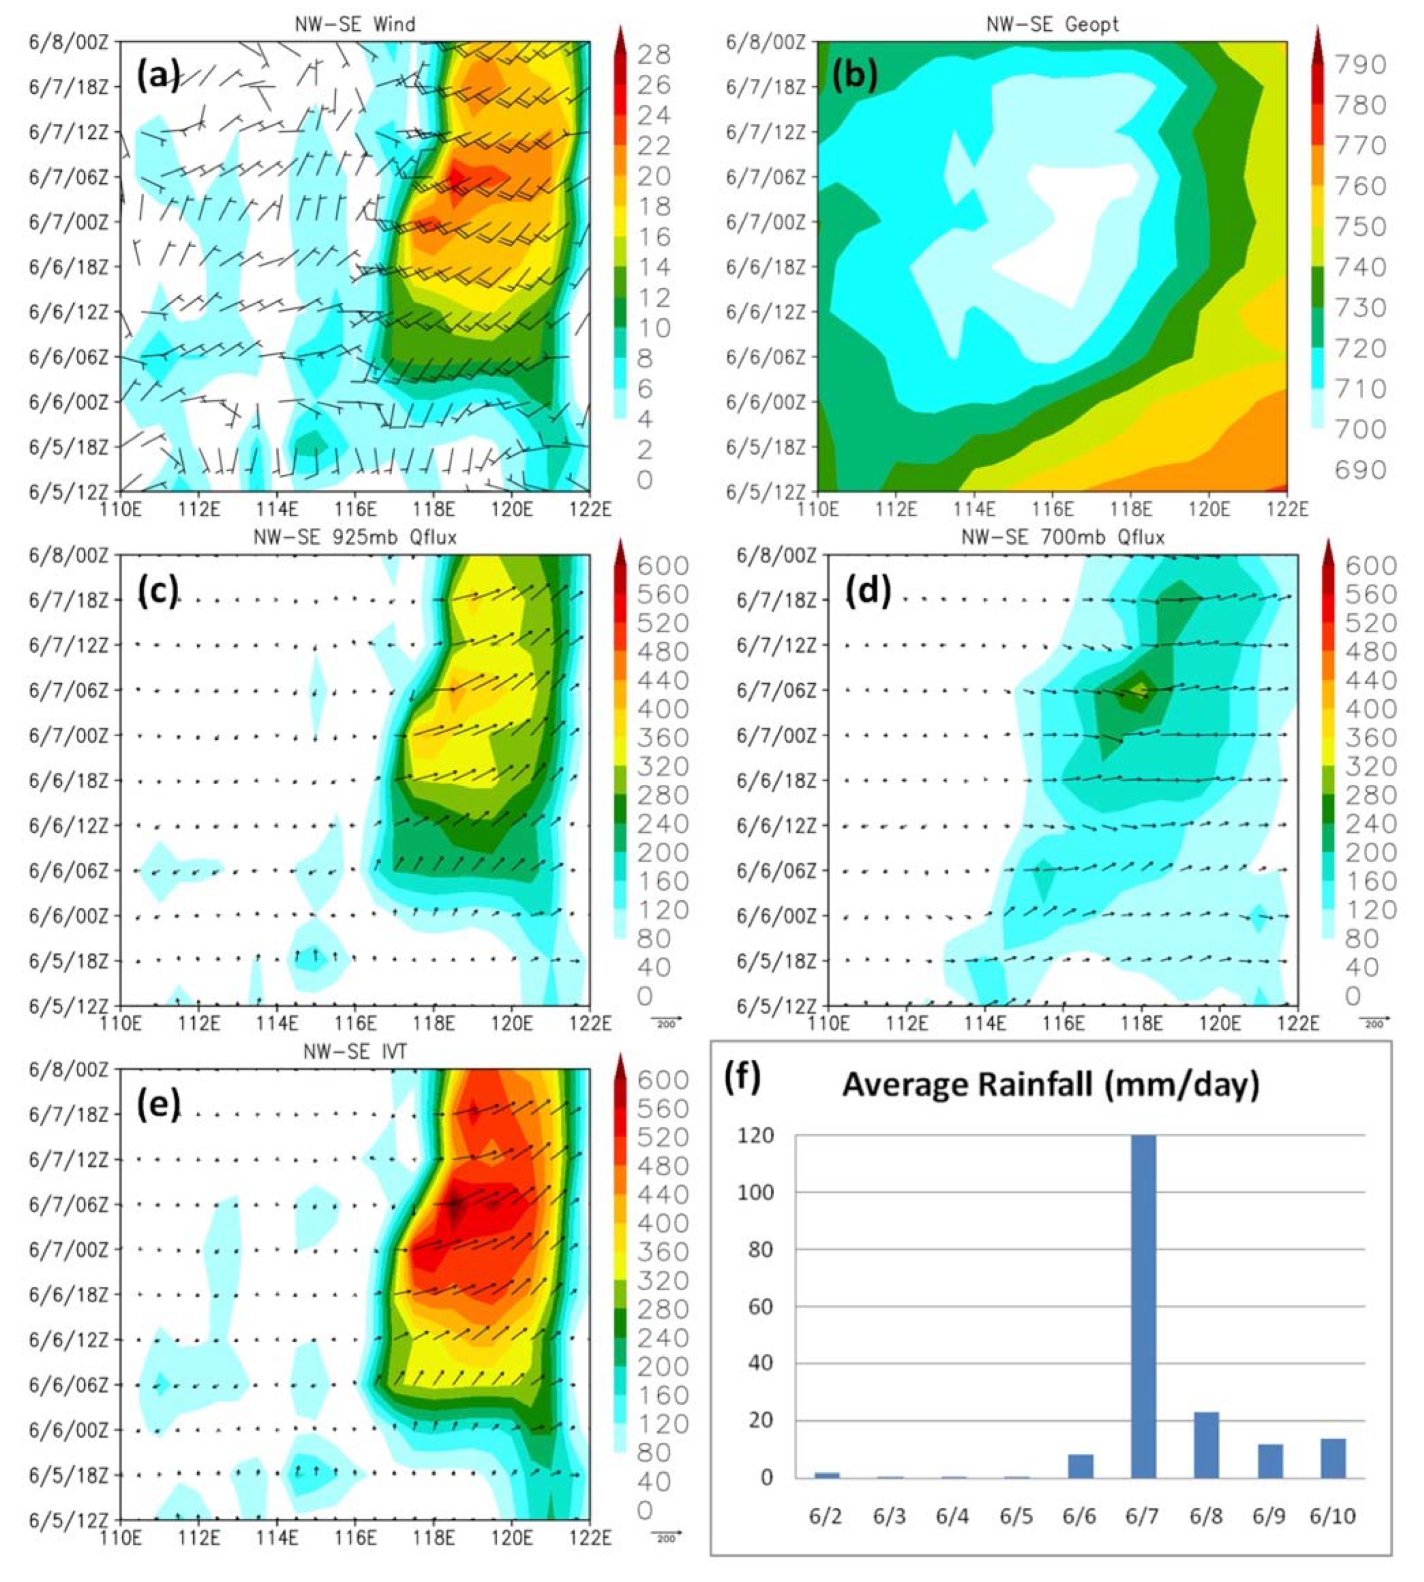
The Hovmöller diagrams from 1200 UTC (2000 LT) 5 June to 0000 UTC (0800 LT) 8 June (Figure 12), along the northwest–southeast (NW–SE) cross-section in Figure 1, show the evolution of low-level winds, geopotential height, and horizontal moisture transport during the period. With the deepening of the frontal cyclone (Figure 2 and Figure 12b), a strong, low-level southwesterly flow started to pick up in the evening of 6 June, with increasing horizontal moisture fluxes. From 1800 UTC 6 June (0200 LT 7 June) to 1800 UTC 7 June (0200 LT 8 June), the southwesterly MBLJ was greater than 20 m s−1 (Figure 12a), due to enhanced subsynoptic pressure gradients (Figure 12b) associated with the development of the frontal cyclone. Figure 12d shows a much smaller moisture transport above the 850 hPa level than within the MBL (Figure 12c,e). During this period, large horizontal moisture fluxes occurred below the 850 hPa level (Figure 12c,d), with IVT greater than 450 kg m−1 s−1 (Figure 12e). This is also the period of heavy rainfall over Southwestern Taiwan (Figure 12f), as described in Tu et al. [20]. It is apparent that moisture transport by the MBLJ provides the moisture source for cumulus convection, leading to the spin-up of the frontal cyclone through the feedback effects from latent heat release. The deepening frontal cyclone increases the pressure gradient between the Mei-Yu trough and the WPSH, intensifying the MBLJ and further deepening the frontal cyclone through a positive feedback process.
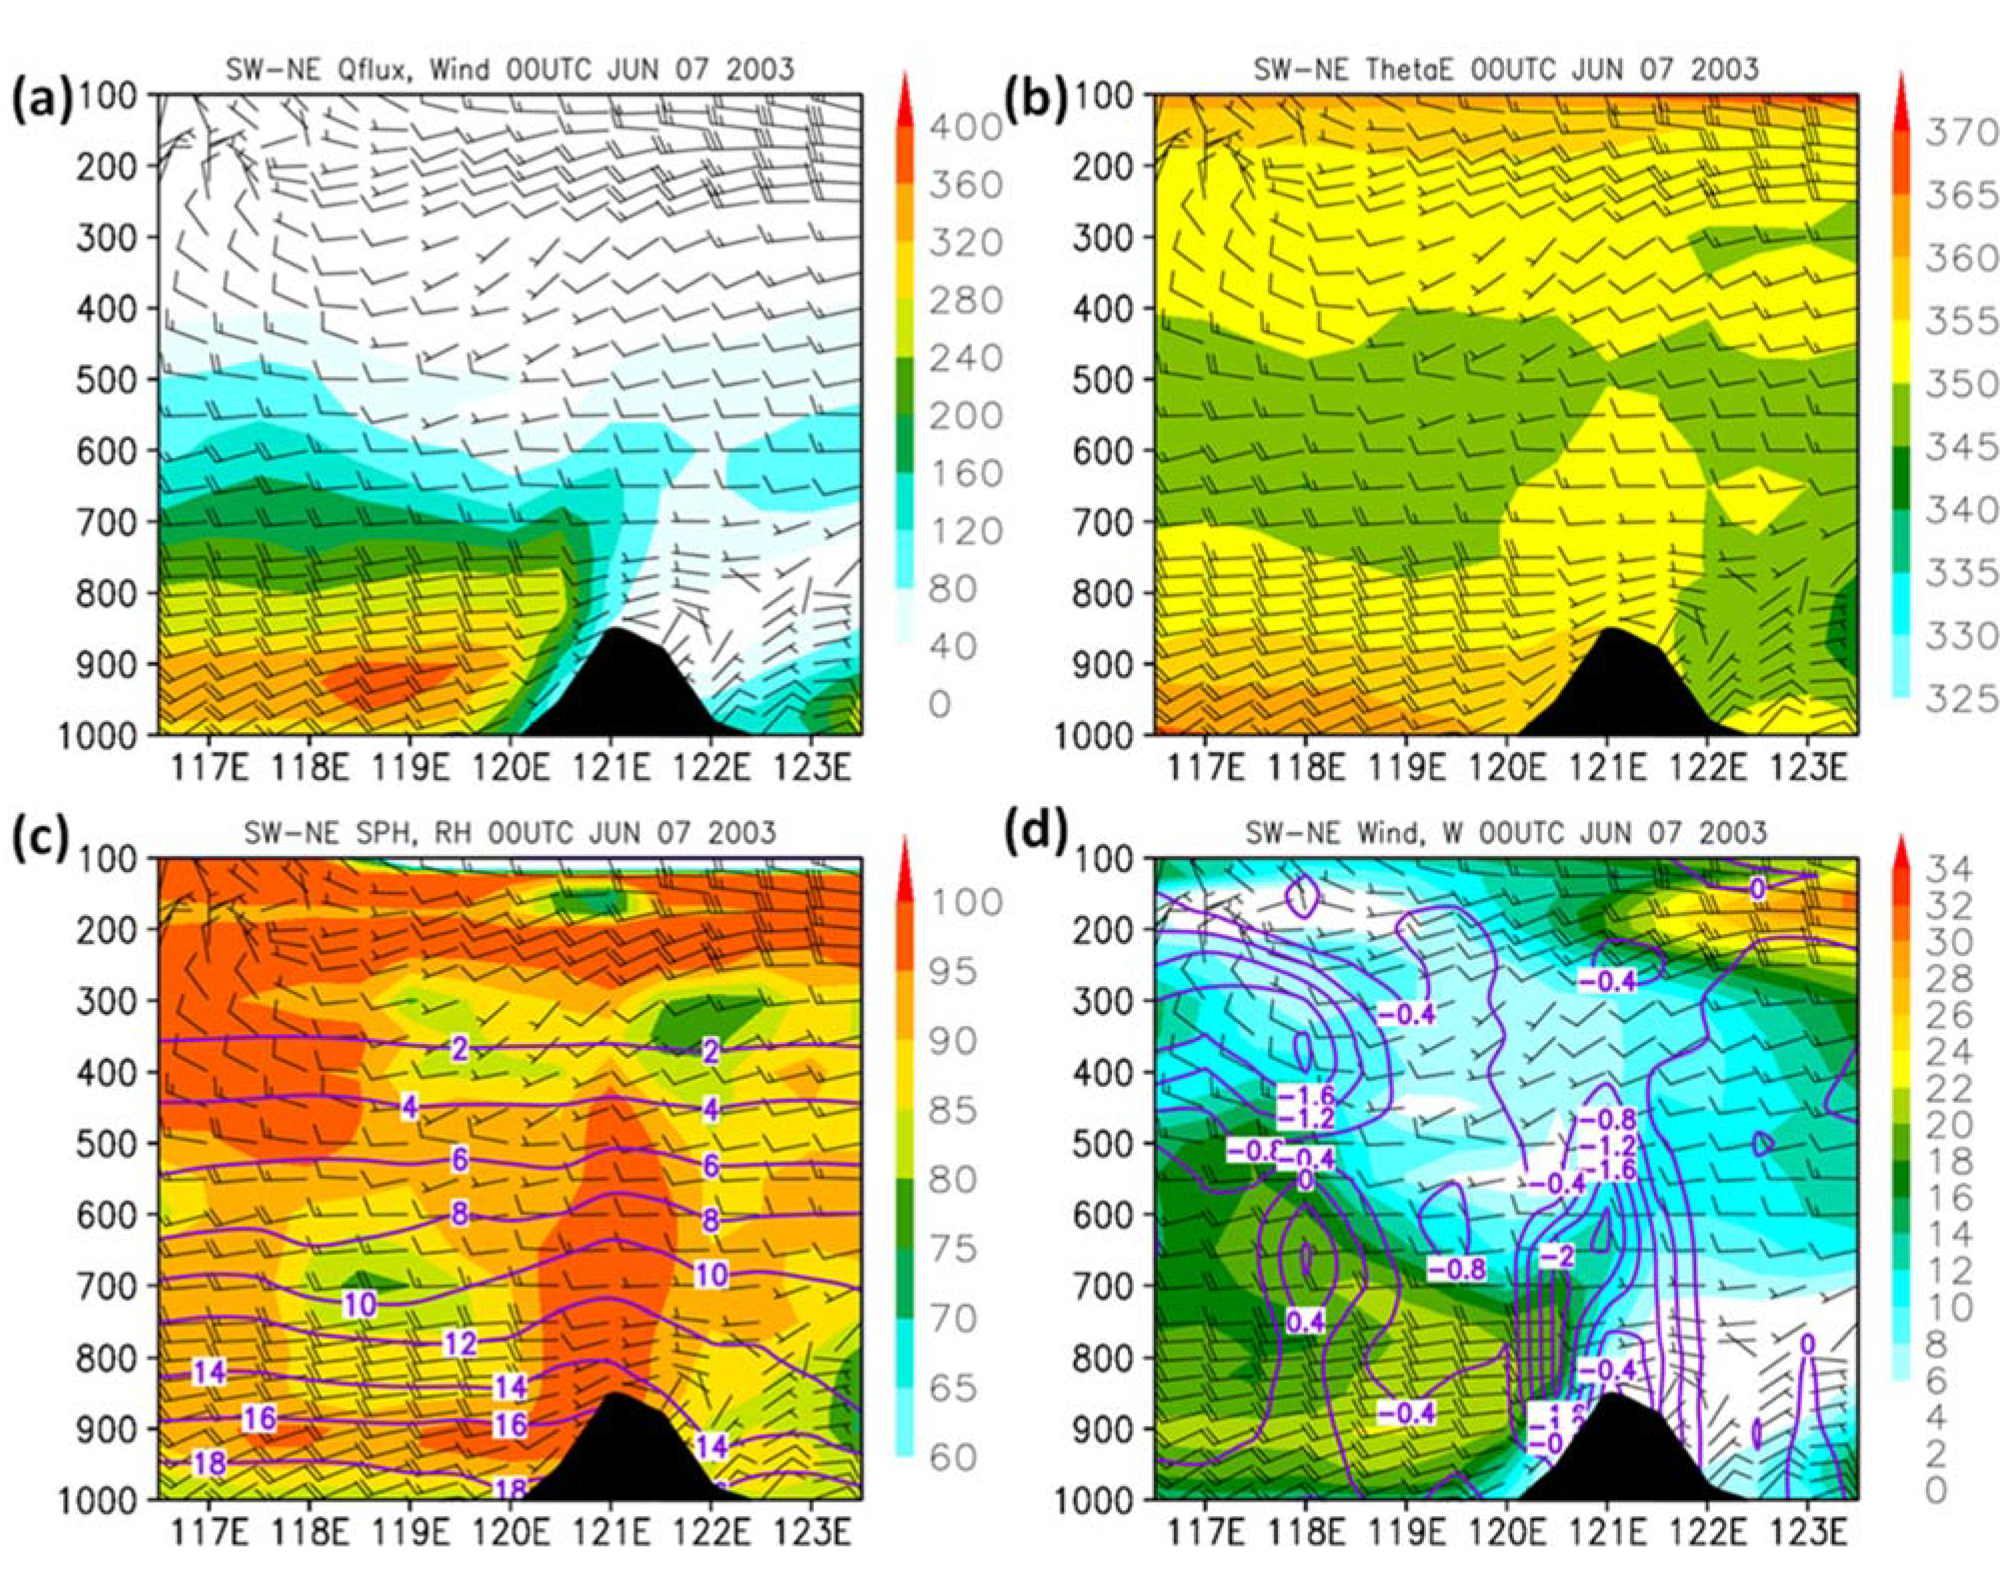
The NE–SW cross-section along the red line in Figure 1 at 0000 UTC 7 June 2003 shows the moisture transport from the NSCS to the Taiwan area (Figure 13). One of the most striking features is that the largest horizontal moisture fluxes and strongest winds occur below the 900 hPa level associated with the MBLJ, rather than at the 850 hPa to 700 hPa levels associated with the SLLJ. Furthermore, the high θe air (>360 K) is mainly confined to the lowest levels below 900 hPa (Figure 13a,b). The warm, moist, low-level southwesterlies have a notable southerly wind component (Figure 13b,c), impinging on Taiwan’s topography with rising motion due to flow deceleration (Figure 13c), orographic blocking, and orographic lifting (Figure 13d). Heavy rainfall occurs along the southwestern Taiwan coast, extending inland toward the windward slopes of the CMR, consistent with Tu et al. [19]; see their Figure 9. A moist tongue, with RH greater than 95% in the coastal area, extends upward over the windward slopes (Figure 13c). A similar situation also occurs along the Southern China coast [35,36], except that the CMR is higher than the low hilly terrain along the Southern China coast. A schematic diagram is given in Figure 14.

7. Summary

In this study, characteristics of the Mei-Yu jet/front that occurred during 6–7 June 2003 are diagnosed. A close examination is conducted on the interaction among the SLLJ, the SULJ, and the MBLJ on the spin-up of a frontal cyclone embedded in the Mei-Yu trough, and on the localized island effects on the development of the heavy rainfall event over Southwestern Taiwan on 7 June 2003.
This Mei-Yu frontal system possesses the following characteristics: (1) a large thermal contrast, greater than 8 K, below the 850 hPa level, between the postfrontal cold northeasterlies and the prefrontal warm, moist southwesterly monsoon flow; (2) a pronounced axis of frontogenetical forcing along the frontal boundary in the low levels; (3) warm air advection in the prefrontal atmosphere; (4) northward tilt of the baroclinic zone with a slope about 1/100; (5) large temperature gradients associated with the upper-level frontal zone with an SULJ greater than 40 m s−1; (6) a thermally direct circulation driven by a moist baroclinic process; (7) descending motion associated with the thermally direct circulation in the upper troposphere, which transports the high-PV stratospheric air downward with tropopause folding.
For this case, a pronounced frontal cyclone develops within the Mei-Yu trough north of the Southern China coast. The frontal cyclone at 925 hPa first appears in the leeside of the Yun-Gui Plateau during 0600–1200 UTC 6 June beneath 500 hPa westerlies over the plateau. The development of the frontal cyclone occurs when an upper-level jet/front system advances southward during the passage of a mid-latitude trough. The rising motion associated with the Mei-Yu jet/front system is coupled with upper-level divergence on the equatorial side of the SULJ entrance region, which provides the dynamic forcing aloft for the release of potential instability and the subsequent deepening of the frontal cyclone.
In the low levels, the MBLJ brings in moisture from the northern South China Sea to the frontal zone. The MBLJ is associated with the subsynoptic pressure gradients between the frontal cyclone and the WPSH. The release of latent heat feeds back to the frontal cyclone as it migrates southeastward. As the frontal cyclone deepens, the secondary circulation associated with the Mei-Yu jet/front system strengthens, with a larger baroclinic conversion rate in the frontal zone. Furthermore, the pressure gradients between the Mei-Yu trough and the WPSH also increase. As a result, the MBLJ strengthens with more effective moisture transport and results in further deepening of the frontal cyclone through a positive feedback process. Thus, in response to baroclinic forcing and upper-level dynamical forcing, all three jets (SULJ, SLLJ, and MBLJ) interact together during the deepening of the frontal cyclone with positive feedback effects of latent heat release.
On 7 June 2003, as the Mei-Yu front arrived in the Taiwan area, widespread heavy rainfall (daily accumulation greater than 350 mm) occurred over Southwestern Taiwan in a moist environment with total precipitable water greater than 65 mm. The MBLJ, with a jet core around the 925 hPa level, brings in significant moisture, with an IVT greater than 450 kg m−1 s−1 below the 850 hPa level, from the tropics to the Taiwan area. In addition to rising motion in the frontal zone, the warm, moist, unstable MBLJ decelerates and is orographically blocked and lifted by the CMR. This results in the development of widespread heavy rainfall, extending from the Southwestern Taiwan coast to the windward slopes.

Author Contributions

Conceptualization, Y.-L.C.; methodology, Y.-L.C., C.-K.W. and C.-C.T.; formal analysis, C.-K.W. and C.-C.T.; investigation, F.H.; writing—original draft preparation, C.-K.W. and Y.-L.C.; writing—review and editing, Y.-L.C.; visualization, C.-K.W. and C.-C.T.; project administration, Y.-L.C. and P.-L.L.; funding acquisition, Y.-L.C., P.-L.L. and C.-C.T. All authors have read and agreed to the published version of the manuscript.

Funding

This work is funded by the National Science Foundation under Grant AGS-1142558 to the University of Hawai‘i at Manoa. It is also partially funded by the Ministry of Science and Technology (MOST) under Grants MOST 104-2923-M-008-003-MY5 and MOST 107-2111-M-008-038, and the Featured Areas Research Center Program within the framework of the Higher Education Sprout Project by the Ministry of Education (MOE) to the National Central University.

Institutional Review Board Statement

This is School of Ocean and Earth Science and Technology contribution number 11500.

Informed Consent Statement

Not Applicable.

Data Availability Statement

The CFSR data is available from NCEP; The rainfall data is available from the Central Weather Bureau, Taiwan.

Acknowledgments

We thank May Izumi, David Hitzl, and Rachael Eichelberger-Iga for editing the text.

Conflicts of Interest

The authors declare no conflict of interest.

References

  1. Kuo, Y.H.; Chen, G.T.J. The Taiwan area mesoscale experiment (TAMEX): An overview. Bull. Amer. Meteor. Soc. 1990, 71, 488–503. [Google Scholar] [CrossRef] [Green Version]
  2. Chen, Y.L.; Zhang, Y.X.; Hui, N.B. Analysis of a surface front during the early summer rainy season over Taiwan. Mon. Wea. Rev. 1989, 117, 909–931. [Google Scholar] [CrossRef] [Green Version]
  3. Chen, G.T.J.; Chang, C.P. The structure and vorticity budget of an early summer monsoon trough (Mei-Yu) over southeastern China and Japan. Mon. Wea. Rev. 1980, 108, 942–953. [Google Scholar] [CrossRef] [Green Version]
  4. Hsiao, F.; Chen, Y.L. Revisiting the structure and characteristics of an early summer monsoon trough over South China in 1975. SOLA. 2014, 10, 194–198. [Google Scholar] [CrossRef] [Green Version]
  5. Uppala, S.M.; KÅllberg, P.W.; Simmons, A.J.; Andrae, U.; Bechtold, V.d.; Fiorino, M.; Gibson, J.K.; Haseler, J.; Hernandez, A.; Kelly, G.A.; et al. The ERA-40 re-analysis. Quart. J. Roy. Meteor. Soc. 2005, 131, 2961–3012. [Google Scholar] [CrossRef]
  6. Chen, Y.L.; Hui, N.B. Analysis of a relatively dry front during the Taiwan Area Mesoscale Experiment. Mon. Wea. Rev. 1992, 120, 2442–2468. [Google Scholar] [CrossRef] [Green Version]
  7. Chen, Y.L.; Hui, N.B. Analysis of a shallow front during the Taiwan Area Mesoscale Experiment. Mon. Wea. Rev. 1990, 118, 2649–2667. [Google Scholar] [CrossRef] [Green Version]
  8. Trier, S.B.; Parsons, D.B.; Matejka, T.J. Observations of a subtropical cold front in a region of complex terrain. Mon. Wea. Rev. 1990, 118, 2449–2470. [Google Scholar] [CrossRef]
  9. Chen, Y.L. Some synoptic-scale aspects of the surface fronts over southern China during TAMEX. Mon. Wea. Rev. 1993, 121, 50–64. [Google Scholar] [CrossRef] [Green Version]
  10. Chen, C.Y.; Chen, Y.L.; Chen, C.S.; Lin, P.L.; Liu, C.L. Revisiting the heavy rainfall event over northern Taiwan on 3 June 1984. Terr. Atmos. Ocean. Sci. 2013, 24, 999–1020. [Google Scholar] [CrossRef] [Green Version]
  11. Tu, C.C.; Chen, Y.L.; Chen, C.S.; Lin, P.L.; Lin, P.H. A comparison of two heavy rainfall events during the Terrain-influenced Monsoon Rainfall Experiment (TiMREX) 2008. Mon. Wea. Rev. 2014, 142, 2436–24631. [Google Scholar] [CrossRef]
  12. Tu, C.C.; Chen, Y.L.; Lin, P.L.; Huang, M.Q. Analysis and simulations of a heavy rainfall event associated with the passage of a shallow front over Northern Taiwan on 2 June 2017. Mon. Wea. Rev. 2022, 150, 505–528. [Google Scholar] [CrossRef]
  13. Chen, L.; L, Y.; Chu, Y.J.; Chen, C.S.; Tu, C.C.; Teng, J.H.; Lin, P.L. Analysis and simulations of a heavy rainfall event over northern Taiwan during 11–12 June 2012. Mon. Wea. Rev. 2018, 146, 2697–2715. [Google Scholar] [CrossRef]
  14. Chen, G.T.J.; Wang, C.C.; Chang, S.W. A diagnostic case study of Mei-yu frontogenesis and development of wavelike frontal disturbances in the subtropical environment. Mon. Wea. Rev. 2008, 136, 41–61. [Google Scholar] [CrossRef]
  15. Chen, Y.L.; Tu, C.C.; Hsiao, F.; Chen, C.S.; Lin, P.L.; Lin, P.H. An overview of Low-Level Jets (LLJs) and their roles on heavy rainfall over the Taiwan area during the early summer rainy season. Meteorology 2022, 1, 64–112. [Google Scholar] [CrossRef]
  16. Chen, G.T.J.; Yu, C. Study of low-level jet and extremely heavy rainfall over northern Taiwan in the Mei-Yu Season. Mon. Wea. Rev. 1988, 116, 884–8912. [Google Scholar] [CrossRef] [Green Version]
  17. Chen, G.T.J.; Wang, C.C.; Lin, D.T.W. Characteristics of low-level jets over northern Taiwan in the Mei-Yu season and their relationship to heavy rain events. Mon. Wea. Rev. 2005, 133, 20–43. [Google Scholar] [CrossRef] [Green Version]
  18. Chen, C.S.; Lin, Y.L.; Peng, W.C.; Liu, C.L. Investigation of a heavy rainfall event over southwestern Taiwan associated with a subsynoptic cyclone during the 2003 Mei-Yu season. Atmos. Res. 2010, 95, 235–254. [Google Scholar] [CrossRef]
  19. Tu, C.C.; Chen, Y.L.; Lin, P.L.; Du, Y. Characteristics of the marine boundary layer jet over the South China Sea during the early summer rainy season of Taiwan. Mon. Wea. Rev. 2019, 147, 457–475. [Google Scholar] [CrossRef]
  20. Tu, C.C.; Chen, Y.L.; Lin, P.L.; Lin, P.H. The relationship between the boundary layer moisture transport from the South China Sea and heavy rainfall over Taiwan. Terr. Atmos. Ocean. Sci. 2020, 31, 159–176. [Google Scholar] [CrossRef]
  21. Saha, S.; Moorthi, S.; Pan, H.L.; Wu, X.R.; Wang, J.D.; Nadiga, S.; Tripp, P.; Kistler, R.; Woollen, J.; Behringer, D.; et al. The NCEP climate forecast system reanalysis. Bull. Amer. Meteor. Soc. 2010, 91, 1015–10581. [Google Scholar] [CrossRef]
  22. Kerns, B.; Chen, Y.L.; Chang, M.Y. The diurnal cycle of winds, rain and clouds over Taiwan during the Mei-Yu, summer, and autumn regimes. Mon. Wea. Rev. 2010, 138, 497–516. [Google Scholar] [CrossRef]
  23. Zhu, Y.; Newell, R.E. A proposed algorithm for moisture fluxes from atmospheric rivers. Mon. Wea. Rev. 1998, 126, 725–735. [Google Scholar] [CrossRef]
  24. Lavers, D.A.; Villarini, G.; Allan, R.P.; Wood, E.F.; Wade, A.J. The detection of atmospheric rivers in atmospheric reanalyses and their links to British winter floods and the large-scale climatic circulation. J. Geophys. Res. 2012, 117, D20106. [Google Scholar] [CrossRef]
  25. Rossby, C.G. Planetary flow patterns in the atmosphere. Quart. J. Roy. Meteor. Soc. 1940, 66, 68–87. [Google Scholar]
  26. Ertel, H. Ein neuer hydrodynamischer Wirbelsatz. Meteor. Z. 1942, 59, 277–281. [Google Scholar]
  27. Chen, Y.L.; Chen, X.A.; Zhang, Y.X. A diagnostic study of the low-level jet during TAMEX IOP 5. Mon. Wea. Rev. 1994, 122, 2257–2284. [Google Scholar] [CrossRef] [Green Version]
  28. Chen, Y.L.; Chen, X.A.; Chen, S.; Kuo, Y.H. A numerical study of the low-level jet during TAMEX IOP 5. Mon. Wea. Rev. 1997, 125, 2583–2604. [Google Scholar] [CrossRef]
  29. Chen, X.A.; Chen, Y.L. Development of low-level jets during TAMEX. Mon. Wea. Rev. 1995, 123, 1695–1719. [Google Scholar] [CrossRef] [Green Version]
  30. Chen, Y.L.; Tseng, S.F. Comments on “The intensification of the low-level jet during the development of mesoscale convective systems on a Mei-Yu front”. Mon. Wea. Rev. 2000, 128, 1123–1138. [Google Scholar] [CrossRef]
  31. Chen, X.A.; Chen, Y.L. Kinetic energy budgets of the low-level jet during TAMEX IOP 5. J. Meteor. Soc. Japan. 2002, 80, 1–19. [Google Scholar] [CrossRef] [Green Version]
  32. Shin, C.-S.; Lee, T.-Y. Development mechanisms for the heavy rainfalls of 6–7 August 2002 over the middle of the Korean Peninsula. J. Meteor. Soc. Japan 2005, 83, 683–709. [Google Scholar] [CrossRef] [Green Version]
  33. Park, C.; Son, S.; Kim, J.-H. Role of baroclinic trough in triggering vertical motion during summertime heavy rainfall events in Korea. J. Atmos. Sci. 2021, 78, 1687–1702. [Google Scholar] [CrossRef]
  34. Chen, -L.Y.; Li, J. Large-scale conditions favorable for the development of heavy precipitation during TAMEX IOP 3. Mon. Wea. Rev. 1995, 123, 2978–3002. [Google Scholar] [CrossRef] [Green Version]
  35. Du, Y.; Chen, G.X. Climatology of low-level jets and their impact on rainfall over southern China during the early-summer rainy season. J. Climate 2019, 32, 8813–8833. [Google Scholar] [CrossRef]
  36. Du, Y.; Chen, G.X.; Han, B.; Mai, C.; Bai, L.; Li, M. Convection initiation and grow that the coast of South China. Part I: Effect of the marine boundary layer jet. Mon. Wea. Rev. 2020, 148, 3847–3869. [Google Scholar] [CrossRef]
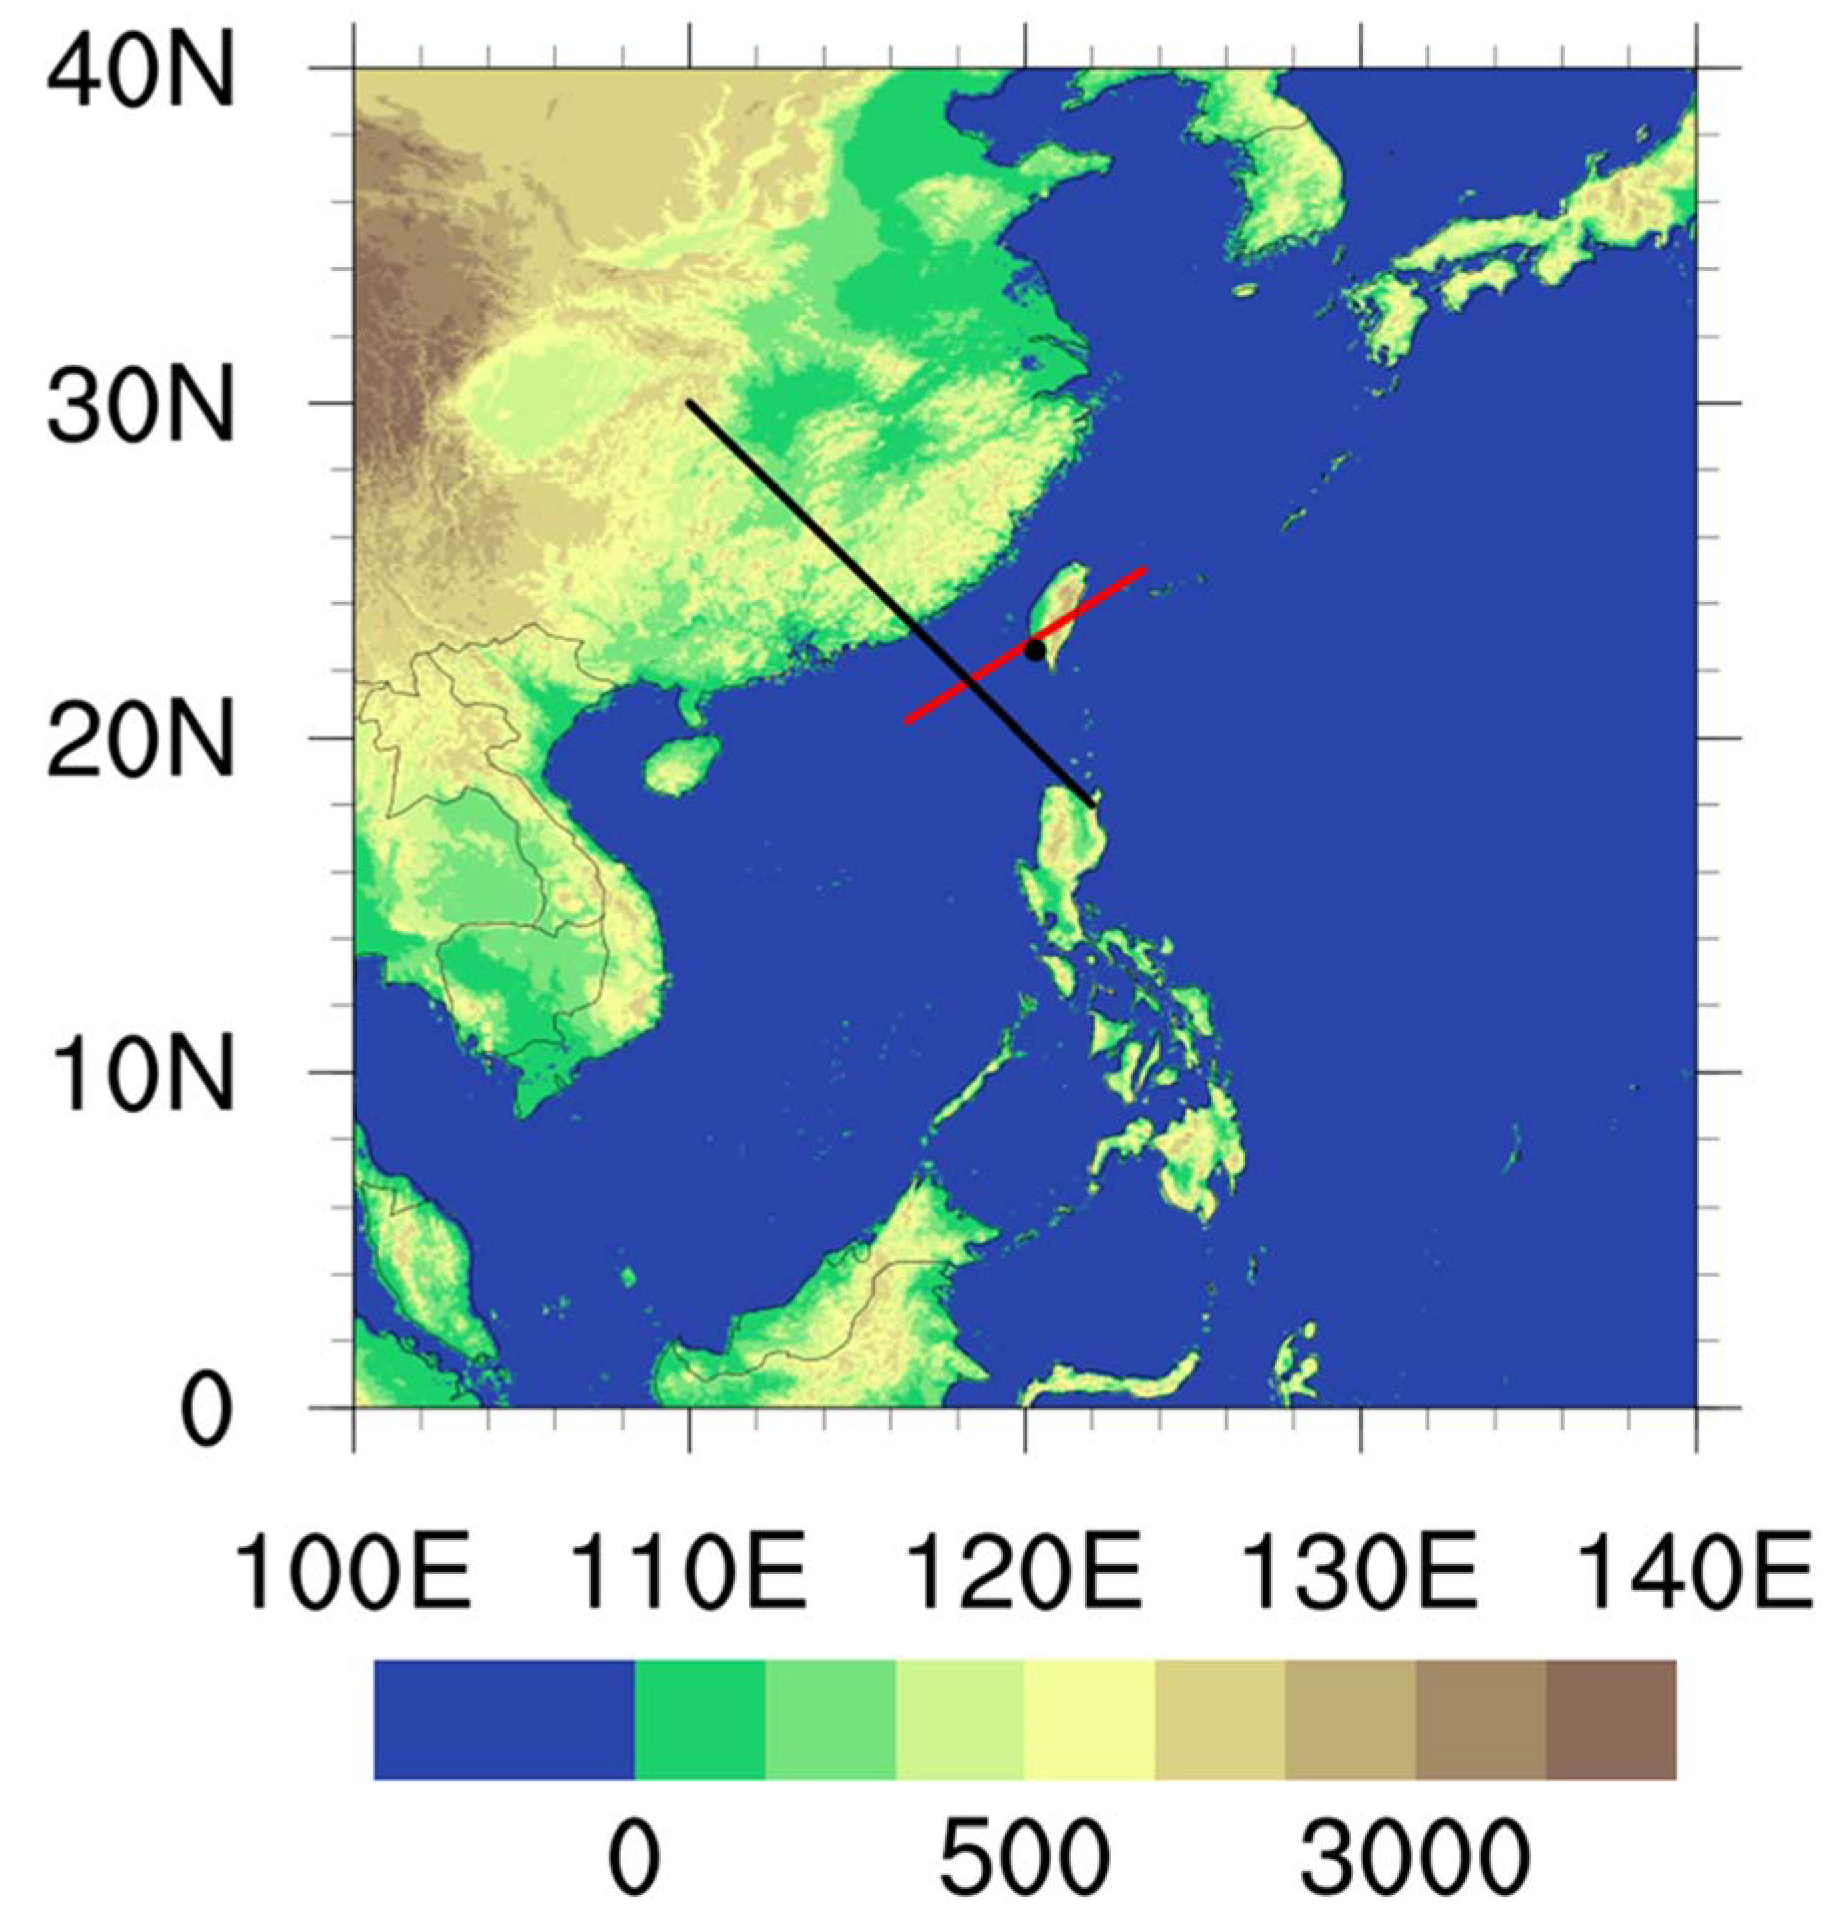
Figure 1. Terrain height (m). The black line is the NW–SE cross-section line. The red line is the NE–SW cross-section line. The black dot indicates the location of Kaohsiung City.
Atmosphere 13 00644 g001
Figure 2. The CFSR geopotential height (gpm, contoured), wind speed (V; m s−1, shaded), and winds (m s−1) (full barb and half barb represent 10 and 5 m s−1, respectively) at 925 hPa at (a) 1200 UTC (2000 LT) 6 June; (b) 1800 UTC 6 June (0200 LT 7 June); (c) 0000 UTC (0800 LT) 7 June; and (d) 0600 UTC (1400 LT) 7 June 2003.
Atmosphere 13 00644 g002
Figure 3. The CFSR geopotential height (gpm, contoured), potential temperature (K, shaded), and winds (V; m s−1) (full barb and half barb represent 10 and 5 m s−1, respectively) at 850 hPa at (a) 1200 UTC (2000 LT) 6 June; (c) 1800 UTC 6 June (0200 LT 7 June); (e) 0000 UTC (0800 LT) 7 June; and (g) 0600 UTC (1400 LT) 7 June 2003. (b,d,f,h) are at the same time as (a,c,e,g), respectively, but for vertical motion (Pa s−1, shaded), geopotential height (gpm, contoured), and wind (V; m s−1) at 500 hPa.
Atmosphere 13 00644 g003
Figure 4. The CFSR frontogenesis at 925 hPa (10−9 K m−1 s−1), winds (V; m s−1, full barb and half barb represent 10 and 5 m s−1, respectively), and potential temperature (K, purple lines every 2 K) at (a) 1200 UTC (2000 LT) 6 June; (b) 1800 UTC 6 June (0200 LT 7 June); (c) 0000 UTC (0800 LT) 7 June; and (d) 0600 UTC (1400 LT) 7 June 2003.
Atmosphere 13 00644 g004
Figure 5. The CFSR latitude–time cross-section along 117° E for winds (V; m s−1, full barb and half barb represent 10 and 5 m s−1, respectively), potential temperature (K, shaded), and geopotential height (gpm, solid white lines) from 0000 UTC 5 June to 1200 UTC 7 June at (a) 850 hPa; (b) 700 hPa; (c) 500 hPa; and (d) 300 hPa.
Atmosphere 13 00644 g005
Figure 6. The CFSR latitude–time cross-section along 117° E for equivalent potential temperature (K, contoured every 5 K) and relative humidity (shaded every 10%) at (a) 925 hPa; (b) 850 hPa; (c) 700 hPa; and (d) 500 hPa.
Atmosphere 13 00644 g006
Figure 7. Vertical cross-section along 117° E at 1800 UTC 6 June (0200 LT 7 June). (a) Equivalent potential temperature (K, black lines) and relative humidity (%, shaded); (b) secondary circulation (vectors, vertical motion: Pa s−1; ageostrophic winds: m s−1), zonal winds (u) (m s−1, shaded), and potential temperature (K, solid lines); (c) specific humidity (g kg−1, solid line) and relative vorticity (s−1, shaded); and (d) horizontal winds (V; m s−1) (full barb and half barb represent 10 and 5 m s−1, respectively), horizontal wind speed (m s−1, shaded), and meridional winds (v) (m s−1, contoured).
Atmosphere 13 00644 g007
Figure 8. The CFSR latitude–height cross-sections along 117° E. (a) Ertel’s potential vorticity (PVU, dashed lines) and potential temperature (K, black contours); (b) absolute vorticity (10−5 s−1, contoured); (c) EPV (PVU, dashed lines) and zonal winds (u) (m s−1, shaded); and (d) EPV (PVU, dashed lines) and vertical velocity (Pa s−1, shaded) at 1800 UTC 6 June (0200 LT 7 June) 2003. PVU = 10−6 m2 K kg−1 s−1.
Atmosphere 13 00644 g008
Figure 9. The CFSR divergence at 300 hPa (10−5 s−1), winds (V; m s−1, full barb and half barb represent 10 and 5 m s−1, respectively), and geopotential height (gpm, dark green lines) at 0600 UTC (1400 LT) 6 June 2003.
Atmosphere 13 00644 g009
Figure 10. The total 12-hour accumulated rainfall (mm) during (a) 12–24 LT 6 June; (b) 0–12 LT 7 June; (c) 12–24 LT 7 June; and (d) 0–12 LT 8 June 2003.
Atmosphere 13 00644 g010
Figure 11. (a) The CFSR total precipitable water (TPW; kg m−2); (b) the CFSR integrated vapor transport (IVT; kg m−1 s−1) in the boundary layer (sfc-850 hPa); (c) moisture flux (g kg−1 m s−1) at 925 hPa; and (d) same as (c) but for 700 hPa at 1800 UTC 6 June (0200 LT 7 June) 2003.
Atmosphere 13 00644 g011
Figure 12. The CFSR Hovmöller diagram along the NW–SE line (black line in Figure 1) from 1200 UTC (2000 LT) 5 June to 0000 UTC (0800 LT) 8 June 2003: (a) 925 hPa winds (V; m s−1) (a full barb and half barb represent 10 and 5 m s−1, respectively; (b) 925 hPa geopotential height (gpm); (c) 925 hPa horizontal moisture flux vector (qV; g kg−1 m s−1); (d) 700 hPa horizontal moisture flux vector (qV; g kg−1 m s−1); (e) integrated vapor transport (IVT; kg m−1 s−1) in the boundary layer (below 850 hPa); (f) time series of island-scale areal-averaged daily rainfall over Taiwan from rain gauges (mm) during 2–10 June (LT) 2003.
Atmosphere 13 00644 g012
Figure 13. The CFSR vertical cross-section along the NE–SW line (red line in Figure 1) at 0000 UTC (0800 LT) 7 June 2003. (a) horizontal moisture flux (qV; g kg−1 m s−1, shaded) and winds (V; m s−1) (full barb and half barb represent 10 and 5 m s−1, respectively); (b) equivalent potential temperature (K, shaded) and winds (V; m s−1); (c) specific humidity (g kg−1, contoured), relative humidity (%, shaded), and winds (V; m s−1); (d) winds (V; m s−1) and vertical motion (Pa s−1, contoured).
Atmosphere 13 00644 g013
Figure 14. A schematic diagram showing the moisture transport from the NSCS toward Taiwan and rising motion due to flow deceleration, blocking, and lifting by the Central Mountain Range (CMR).
Atmosphere 13 00644 g014
Publisher’s Note: MDPI stays neutral with regard to jurisdictional claims in published maps and institutional affiliations.