Abstract
In this study, the characteristics and formation mechanism of summertime isoprene, monoterpene, and toluene-derived secondary organic aerosols (SOAs) were investigated in a rural area of Guanzhong Plain, Northwest China. The variations in key indicators of primary sources indicated a significant influence of biomass burning on PM2.5 during the observation period. The concentrations of total measured SOA tracers from isoprene, monoterpene, and toluene were 40.85 ± 17.31, 24.27 ± 7.50, and 10.61 ± 0.33 ng/m3, respectively. The average ratio of cis-pinonic and pinic acids to 3-Methyl-1,2,3-butanetricarboxylic acid (MBTCA)(P/M) were 0.45 and 0.85 by day and by night, respectively. The low ratio in the daytime was mainly due to the stronger photo-degradation and particle-to-gas distribution of semi-volatile cis-pinonic and pinic acids. The monoterpene SOA tracers were significantly correlated with levoglucosan at night (R2 = 0.51, p < 0.01), as were toluene SOA tracers and levoglucosan (R2 > 0.67, p < 0.01), indicating the significant contribution of biomass combustion to these SOAs. The mass concentration of isoprene-, monoterpenes-, and toluene-derived SOC was estimated by using the tracer yield method. The total calculated SOCs by day and by night were 0.25–0.71 (average: 0.46) and 0.26–0.78 (average: 0.42) µgC/m3, accounting for 3.35–10.58% and 3.87–13.51% of OC by day and by night, respectively.
1. Introduction
Secondary organic aerosol (SOA) is formed in the atmosphere by homogeneous [1] and the heterogeneous reaction of volatile organic compounds (VOCs) [2] and aging of primary aerosols [3]: its concentration can account for more than 50% of particulate organic compounds [4], exerting a significant influence on global climate change, regional air quality, and human health [5,6,7]. In the past decade, progress has been made in the formation mechanism of SOA, and the importance of SOA in the environment has been fully established. As for SOA precursors, global emissions of anthropogenic VOCs (e.g., aromatics) were minor compared with those of biogenic VOCs (such as terpenes) [8,9], about 90% of global SOA were believed to be formed by biogenic VOCs oxidation [10]. However, recent field studies suggested that anthropogenic SOA might be more significant than previously thought [11]. On the basis of the observation in Mexico City and extrapolation of the results to the other urban areas, Volkamer et al. [12] estimated the global anthropogenic SOA to be 3–25 Tg/yr, accounting for one third of global SOA. Therefore, studying the relative contribution of anthropogenic and biogenic VOCs to SOA is very important for studying the environmental and climatic effects of organic aerosols.
Specific SOA tracers can provide insights on precursors and processes influencing SOA formation. The identification of the isoprene SOA tracers 2-methyltetrols in the aerosols of the Amazon rainforest [1] changed the way the scientific community thought of isoprene SOA. The discovery of the low-NOx products isoprene epoxy diols [13], and the high-NOx products 2-methylglyceric acid and methacrylic acid epoxide [14] expanded the understanding of the formation pathways of isoprene SOA. In addition to isoprene, specific tracers have been determined in monoterpene SOA [15], β-caryophyllene SOA [16], and anthropogenic aromatic SOA [17]. Due to its complex chemical composition, SOA constantly migrates and changes in space and time in the atmosphere, so accurate measurement of molecular concentration and structure in SOA has become a focus of research in recent decades [18,19,20,21,22]. Previous studies have reported a variety of ways with which to estimate SOA, but these estimates are indirect or produce high/low estimated values, and research on SOA generation mechanisms must also measure SOA at a molecular level. Based on current technology, observations at the molecular level made by external in-situ measurement remain inaccurate, so the use of tracer measurement and inversion is the most direct method used in research into the SOA, and it is also the most effective way to study mechanisms of SOA generation [23]. However, due to technological limitations, the international measurement of tracers remains limited, somewhat restricting research to the environmental and health effects of SOA.
To better understand the sources of molecular distribution and mechanism of formation of SOAs in rural areas of Guanzhong Plain, Northwest China, PM2.5 samples were collected by both day and night in summer (August) at a rural site on Guanzhong Plain and were analyzed for molecular tracers of isoprene, monoterpene, and toluene-derived SOA. The effects of meteorological factors (relative humidity and temperature), particle acidity (pHIS), liquid water content (LWC), anthropogenic pollutants (levoglucosan), and secondary inorganic salts (SO42−, NO3−), and EC on the formation mechanism of BSOA tracer were also elucidated. Later, the tracer-based method was used to estimate the total contribution of these SOAs, which provided a preliminary understanding of the source of summertime SOA in the rural regions of Northwest China.
2. Experimental Work
2.1. Sample Collection
The sampling was conducted at a small village (Lincun, 34°44′ N and 109°32′ E, 354 m a.m.s.l) ~ 40 km northeast of Xi’an, the capital of Shaanxi Province (Figure 1). The sampling site is in the central part of Guanzhong Basin with no obvious point source of air pollutants in the surrounding areas. PM2.5 samples were collected twice a day (08:00–20:00 and 20:00–08:00 the next day) onto prebaked (450 °C, 6–8 h) quartz fiber filters (Whatman, QMA, USA) from 3–23 August 2016 using a Tisch Environmental (USA) PM2.5 high-volume (1.13 m3/min) sampler. Field blank samples were also collected by mounting blank filters onto the sampler for about 15 min without pumping any air. After sampling, the sample filters were immediately sealed in aluminum foil bags, then stored in a freezer (at −5 °C) before analysis.
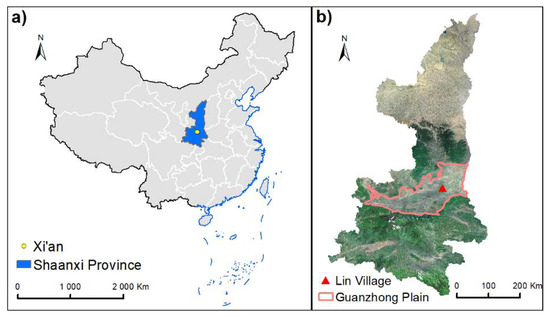
Figure 1.
Location of the sampling site in a rural area of Guanzhong Plain, Northwest China. (a) Map of China, (b) Sampling point location of Guanzhong Plain.
2.2. Determination of Chemical Compounds
A punch of the filter (including both field and blank samples, n = 42) with an area of 12.5–25 cm2 was extracted three times with a mixture of dichloromethane and methanol (2:1, v/v) each for 10 min under ultrasonication. The extracts were concentrated using a rotary evaporator under vacuum conditions and then blown down to dryness using pure nitrogen. After reaction with 50 L N,O-bis-(trimethylsilyl) trifluoroacetamide (BSTFA) with 1% trimethylsilyl chloride and 10 μL of pyridine at 70 °C for 3 h, the derivatives were determined using gas chromatography/electron ionization mass spectrometry (GC/EI-MS).
GC/EI-MS analysis of the derivatives was performed using an Agilent 7890 A GC coupled with an Agilent 5975 C MSD. GC oven temperature program and MS conditions were described elsewhere [24]. The response factors of all the measured compounds were determined by authentic standards except for several isoprene-derived SOA tracers. No significant contamination (<5% of those in the samples) was found in the blanks.
A DRI Model 2001 Atmoslytic carbon analyzer (Reno, NV, USA) was used for carbon composition analysis following the Interagency Monitoring of Protected Visual (IMPROVE-A) protocol. The main water-soluble ions were determined by Metrohm ion chromatography (Metrohm 940, Herisau, Switzerland). A Shimadzu TOC analyzer (TOC-L CPH, Kyoto, Japan) was used to study water-soluble organic carbon. For detailed analysis methods and quality control, the reader was directed to a previous study [25].
As for the calculation of aerosol LWC and in-situ particle pH (pHIS), the ISOROPIA-II model was employed.ISORROPIA-II, a thermodynamic model, was used to estimate aerosol pH and water content because direct measurement of aerosol acidity (i.e., pH) is not possible at present [26]. In applying ISORROPIA-II, “forward” mode calculation, in which inputs to the model include temperature (T), relative humidity (RH), and the total (gas + aerosol) concentrations of aerosol precursors in the air parcel; it would be more suitable for aerosol pH and water content estimation, although the concentration of NH3, HNO3, and HCl in the gas phase are unavailable in the current study. Therefore, the pH results given by the current work would be systematically underestimated by approximately one unit [27]. A detailed calculation process can be found in Li et al. [24].
3. Results and Discussion
3.1. Meteorological Conditions and Major Chemical Components
The mean day and night-time values of meteorological conditions and major chemical compositions of PM2.5 during the sampling period in the rural area of Guanzhong Basin are summarized in Table 1. Time variations of meteorological conditions are shown in the supplement (Figure S1). The average temperature and humidity during the sampling period in the daytime were 32.0 °C and 52.8%, and in the nighttime were 28.0 °C and 65.9%, respectively. Wind speed averaged 2.28 ± 0.62 m/s by day and 1.97 ± 0.45 m/s at night, and daytime and nighttime visibility were 12.17 ± 3.66 km and 10.21 ± 3.78 km, respectively. Lower wind speed and temperature are favorable for pollutant accumulation, resulting in higher PM2.5 mass concentration (64.56 ± 17.28 μg/m3) during nighttime than that during daytime (60.63 ± 9.93 μg/m3). Due to the fact that EC is mainly emitted from direct combustion sources and is chemically stable [28], the much higher concentration of EC (5.35 ± 2.21 μgC/m3) suggested the stronger anthropogenic emissions from biomass burning, coal burning and/or vehicle exhaust in the daytime. This result was consistent with the diurnal variation of K+ and levoglucosan, which are the two well-known tracers of biomass burning and present significantly higher concentrations by day. However, the mean concentrations of OC and WSOC by day were only slightly higher than those at night. This phenomenon possibly arose because the lower temperature and higher relative humidity by night (Table 1) were conducive to gas-to-particle partitioning of semi-volatile organic compounds [29]. EC, OC, and WSOC were significantly correlated with levoglucosan in Lin village (Figure 2), especially by day (R2 > 0.6), further confirming that biomass burning had a significant effect on atmospheric aerosols in that rural area.

Table 1.
Meteorological conditions, PM2.5, and chemical component mass concentration during the sampling period.
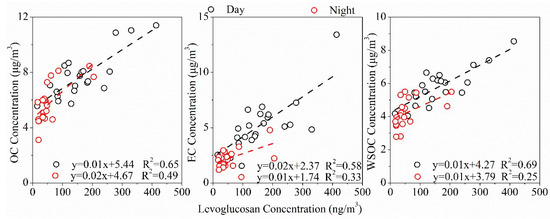
Figure 2.
Correlations of OC, EC, and WSOC with levoglucosan in the rural area of Guanzhong Plain, Northwest China.
As shown in Table 1, due to the higher temperature and solar radiation favoring atmospheric photochemical oxidation, the mean concentration of O3 by day is 80.06 ± 28.92 ppb higher than that at night (42.28 ± 24.91 ppb). The mean concentration of LWC at night (19.88 ± 7.48 μg/m3) is much higher than that by day (12.19 ± 4.66 μg/m3), because that aerosol LWC is significantly controlled by environmental relative humidity [26,30]. The mean value of pHIS by day (−0.001 ± 0.56) is significantly lower than that at night (0.25 ± 0.45), indicating that aerosols are more acidic during the day. In order to understand the contribution of various chemical components to the total mass concentration of PM2.5 in the rural area of Guanzhong Plain, the matter balance calculation of 10 major components of PM2.5 was carried out, which were organic matter (OM), black carbon, secondary inorganic salts (including SO42−, NO3−, NH4+), etc. As shown in Figure 3, it can be seen that SO42− is the most abundant component, accounting for 31.89% and 28.55% of PM2.5 during the day and night, respectively. The main reason is that there are many chemical enterprises in Guanzhong Plain, and a large amount of SO2 discharged by them leads to high loading of SO42− in the atmosphere [31]. The second highest component is OM, accounting for 20.61% and 15.07% of PM2.5 during the day and night, respectively. By contrast, the concentration and relative abundance of NO3− and NH4+ by day are both smaller than that at night, mainly because NH4NO3 becomes more volatile when the daytime temperature is higher [32].
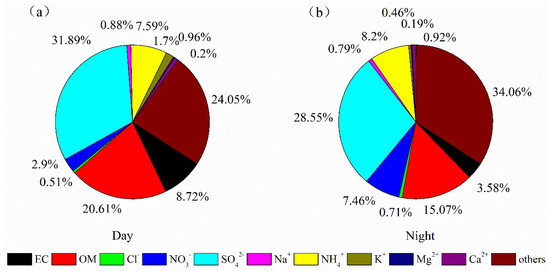
Figure 3.
Chemical composition of PM2.5 by day and by night in the rural regions of Guanzhong Plain, Northwest China: (a) for day, (b) for night.
3.2. Diurnal Variation of SOA Tracers
3.2.1. Isoprene SOA Tracers
Claeys et al. found that low-volatility secondary products generated by isoprene contributed greatly to SOA [33]. Isoprene molecules contain two carbon-carbon double bonds, so the molecules have high chemical reaction activity and can react with various oxidants (mainly OH radicals, NO3 radicals, and ozone) in the atmosphere [34]. Direct observational evidence shows that isoprene oxidation products are important components of organic aerosols in the atmosphere [33]. In this study, eight compounds formed from isoprene oxidation were determined, and the diurnal variations in their concentrations are summarized in Table 2. The sum of isoprene SOA tracers ranged 15.76–72.32 ng/m3 with an average of 36.81 ng/m3 by day and 22.10–84.43 ng/m3 with an average of 44.90 ng/m3 at night. Among these isoprene SOA tracers, C5-alkenetriols (the sum of cis-2-methyl-1,3,4-trihydroxy-1-butene, 3-methyl-2,3,4-trihydroxy-1-butene, and trans-2-methyl-1,3,4-trihydoxy-1-butene) were dominant during the sampling period with mean concentrations of 18.25 (7.16–35.16) ng/m3 by day and 18.73 (8.98–44.85) ng/m3 at night. 2-methyltetrols (the sum of 2-methylthreitol and 2-methylerythritol) averaged 10.58 by day and 16.67 ng/m3 at night, respectively. 3-methyltetrahydrofuran-3,4-diol accounts for a small fraction of the total. As shown in Figure 4, isoprene SOA tracers show significant diurnal differences, and all the measured isoprene SOA tracers present higher concentrations at night than by day (Table 2). SOA tracers are affected by a variety of factors, including emission rate and reaction rate, and meteorological conditions (temperature, solar radiation intensity, RH, and mixing layer height). The emission rate of isoprene is positively affected by solar radiation and temperature [35]. However, the lower mixing layer may facilitate the accumulation of SOA and lead to the higher concentrations observed [36]. Therefore, when the boundary layer drops at night, the pollutant is less easily diffused, and the isoprene concentration is observed to be higher at night than during the day.
Table 2.
Diurnal concentrations (ng/m3) of biogenic SOAs in PM2.5 during in Lincun.
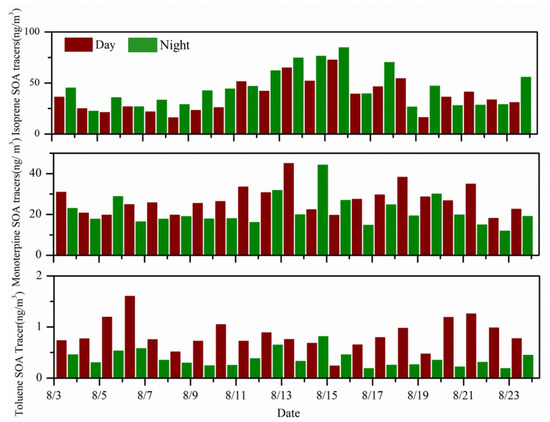
Figure 4.
Diurnal variation of mass concentration of each component of SOA tracer.
3.2.2. Monoterpene SOA Tracers
Monoterpenes account for about 10%–15% of non-methane emissions from plants, and the global annual emissions reach about 127 Tg/a [37]. The concentrations of total monoterpene SOA tracers during the sampling period averaged 27.19 (17.99–44.92) ng/m3 by day and 21.44 (11.79–44.08) ng/m3 at night in summer, with no significant diurnal differences. In summer, 3-methyl-1,2,3-butanetricarboxylic acid was the main compound (8.33–33.18 and 5.02–30.59 ng/m3 both by day and by night), the average content was two to five times the other three components combined. This difference in tracer composition can be explained by photodegradation and gas-to-particle distribution. Previous studies proposed that cis-pinonic and pinic acids are first-generation products of SOA and can be further photodegraded into higher-generation products, such as 3-methyl-1,2,3-butanic acid. Therefore, the ratio of P/M (cis-pinonic acid plus cis-pinic acid to MBTCA) can be regarded as an indicator of the aging of organic aerosols [11]. The ratio of cis-pinonic and pinic acids to 3-methyl-1,2,3-butanetricarboxylic acid (P/M) should be lower during the day when more cis-pinonic and pinic acids are photodegraded into 3-methyl-1,2,3-butanetricarboxylic acid. Indeed, in this study, the average P/M ratio by night was 0.85, which was nearly twice that during the day (0.45).
3.2.3. Toluene SOA Tracer
Volatile aromatic compounds (aromatics) are the most important anthropogenic precursors of SOA, and 50–70% of SOA in the urban atmosphere comes from benzene and its derivatives [38]. Among many anthropogenic VOCs, toluene has been considered one of the most important precursors of anthropogenic SOA, and 2,3-dihydroxy-4-oxopentanoic acid can be used as one of the tracers of toluene-derived SOA [39]. During the sampling period, the concentration of 2,3-dihydroxy-4-oxopentanoic acid was 0.84 (0.23–1.60) ng/m3 by day, which was about twice that at night of 0.37 (0.17–0.81) ng/m3. This result suggested the enhanced photochemical formation of the toluene-derived products during the day due to the higher temperature and incident solar radiation [40].
3.3. Factors Influencing the Formation of SOA
Figure 5 shows the correlations of BSOA tracers and aromatic SOA tracers with O3, temperature (T), relative humidity (RH), in-situ pH (pHIS), LWC, and levoglucosan. It can be seen from Figure 5a–c that the mass concentration of SOA produced by isoprene, monoterpene and anthropogenic aromatic hydrocarbon by day and by night has no significant linear correlation with O3 at p > 0.05, indicating that O3 volume concentration has little influence on the generation of BSOA tracers and aromatic SOA tracers of organic matter.
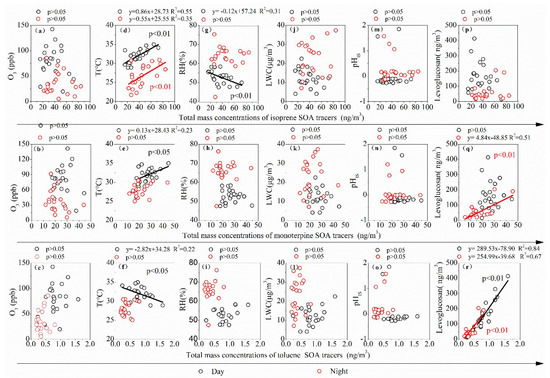
Figure 5.
Linear regressions of BSOA tracers and aromatics SOA tracer with multiple parameters: (a–c) for O3, (d–f) for temperature (T), (g–i) for relatively humidity (RH), (j–l) for in-situ pH (pHIS), (m–o) for liquid water content (LWC), and (p–r) for levoglucosan.
Figure 5d–f indicates that BSOA tracer isoprene is correlated with temperature (T) during both day and night (R2 > 0.35, p < 0.01), and monoterpene concentrations are also correlated with daytime temperature, indicating that BVOC emissions and their generation are related to temperature. The Arrhenius equation proved that higher temperatures can accelerate the reaction, so a higher temperature can accelerate the emission of bio-volatile organic compounds and the formation of SOA [39]. The mass concentration of SOA produced by anthropogenic aromatic hydrocarbons has no linear correlation with temperature and may be unaffected by temperature. The temperature measured at the sampling point can only reflect local weather conditions, not regional meteorological conditions. Therefore, only when BSOA is mainly derived from the local oxidation of BVOCs emissions and not transported over long distances, can a significant correlation between isoprene and monoterpene BSOA tracers with temperature be found.
In this study, there was a certain negative correlation between isoprene and RH in the daytime. Laboratory experiments [40] and in-situ measurements [41] proved that low RH conditions are conducive to the formation of BSOA by photochemical oxidation of isoprene BVOCs. Monoterpene BSOA tracers and aromatic SOA tracers had no correlation with RH during either the day or at night (Figure 4g–i). RH and aerosol moisture absorption components are key factors controlling aerosol LWC [42]. All the isoprene, monoterpene, and toluene products have no correlation with LWC during either the day or the night (Figure 5m–o). Higher LWC can promote the distribution of the water-soluble semi-volatile organic precursor of BSOA to the aqueous phase, further promoting the formation of BSOA [43]. However, LWC can reduce the acidity of particles, thus inhibiting the acid-catalyzed reaction to generate biogenic secondary organic aerosol (BSOA) [44]. Therefore, LWC has no significant correlation with the concentration of isoprene and monoterpene BSOA and aromatic SOA tracers in the aerosol of the central Guanzhong Plain, and with pH (pHIS) of in-situ particles.
Levoglucosan has been recognized as a significant biomass combustion tracer formed from pyrolysis of hemicellulose and cellulose [45]. There was no correlation between isoprene BSOA tracers and levoglucosan during the entire sampling process (p > 0.05), indicating that biomass combustion had little effect on isoprene formation, but there was a significant correlation between monoterpene BSOA tracer and levoglucosan at night (R2 = 0.51, p < 0.01); the toluene-derived SOA tracer was also significantly correlated with levoglucosan (R2 > 0.67, p < 0.01), indicating the strong contribution of biomass burning on these SOA formations in the rural region in summer. Some emission inventory studies revealed that biomass burning could release large amounts of isoprene, monoterpene, and toluene into the atmosphere [46,47]. Gilardoni et al. [48] directly observed a strong formation of aqueous secondary organic aerosol from biomass burning emissions.
3.4. Estimation Contribution of SOC from Isoprene, Monoterpenes, and Toluene Oxidation Products
At present, there is no direct analytical method with which to distinguish primary and secondary organic compounds in aerosols. In the current study, based on the tracer yield method proposed by Kleindienst et al. [23], isoprene, monoterpenes, and toluene-derived SOA in the rural area in summer were evaluated using the following formula:
where is the concentration of SOC generated by a specific VOC precursor i; Σi[tri] is the sum of the concentrations of tracers derived from precursor i oxidation. With these mass fractions and the measured SOA tracers in the ambient air, the SOC from different precursors can be estimated in the atmosphere. The fSOC values were reported to be 0.233 μg/μgC, 0.155 μg/μgC, and 0.0079 μg/μgC for monoterpenes, isoprene, and aromatics, respectively [23]. The results of the calculated SOC are shown in Figure 6: the SOC concentration generated by isoprene by day and at night was the highest, followed by that of monoterpene, then toluene was the lowest. The SOC generated by isoprene by day was 0.24 ± 0.10 µgC/m3, and at night was 0.29 ± 0.12 µgC/m3, which was about 20.83% higher than that by day. Monoterpene produced SOC of 0.12 ± 0.03 µgC/m3 by day, which was higher than that at night (mean 0.09 ± 0.03 µgC/m3), which was about 8.33% higher than that by day. Toluene produced SOC of 0.11 ± 0.04 µgC/m3 by day, which was about twice as high as that at night (mean 0.05 ± 0.02 µgC/m3). The total calculated SOCs by day and by night were 0.25–0.71 (average: 0.46) and 0.26–0.78 (average: 0.42) µgC/m3, accounting for 3.35–10.58% and 3.87–13.51% of OC by day and by night, respectively. The estimated value was significantly lower than that above the Pearl River Delta (38.4%) [11], and that over Beijing (urban 32.2%; rural 39.2%) [49]. It is noteworthy that the actual atmospheric conditions are quite different from those prevailing in the smog chamber test, so fSOC based on smog chamber studies may be different from the actual smog chamber reaction [50].
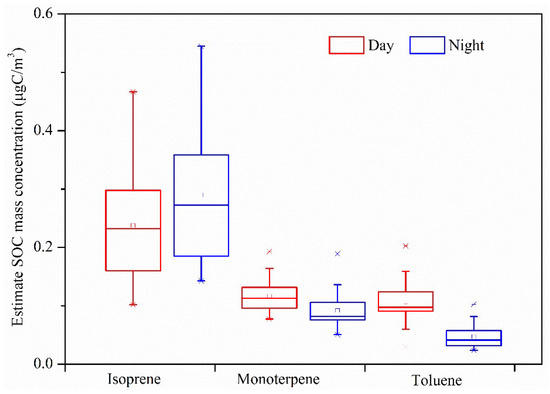
Figure 6.
Estimate SOC mass concentration by day and by night in the rural area of Guanzhong Plain, Northwest China.
4. Summary and Conclusions
The contents of SOA tracers derived from isoprene, monoterpenes, and toluene oxidation, as well as EC, OC, WSOC, levoglucosan, and inorganic ions in PM2.5 samples were determined. Correlations of PM2.5 with EC, OC, K+ and levoglucosan indicated that biomass burning had a significant effect on atmospheric aerosols in that rural area. All the measured isoprene SOA tracers present higher concentrations at night than by day because of the stronger accumulation and aqueous oxidation. Due to the higher daytime temperature and incident solar radiation, the ratio of cis-pinonic and pinic acids to 3-methyl-1,2,3-butanetricarboxylic acid (P/M) was lower during the day when more cis-pinonic and pinic acids are photodegraded into 3-methyl-1,2,3-butanetricarboxylic acid. The monoterpene SOA tracers were significantly correlated with levoglucosan at night (R2 = 0.51, p < 0.01), as were the toluene SOA tracers and levoglucosan (R2 > 0.67, p < 0.01). This finding indicated the significant contribution of biomass combustion to these SOAs. The mass concentrations of isoprene, monoterpene and toluene-derived SOC were estimated by using the tracer yield method. The total calculated SOC by day was 0.25–0.71 (average: 0.46) and 0.26–0.78 (average: 0.42) µgC/m3 by night, accounting for 3.35–10.58% and 3.87–13.51% of the total OC by day and by night, respectively.
Supplementary Materials
The following supporting information can be downloaded at: https://www.mdpi.com/article/10.3390/atmos13040634/s1, Figure S1: Temporal variation in meteorological parameters in a rural area of Guanzhong Plain, Northwest China.
Author Contributions
Data curation, X.W., X.G., W.D., Y.L., Y.Z., Y.C., W.Q., L.L. and J.L.; Methodology, X.W., X.G., W.D., S.L., M.S., Y.L., Y.Z., W.Q., L.L. and J.C.; Supervision, J.C. and J.L.; Visualization, M.S. and Y.C.; Writing—original draft, X.W. and X.G.; Writing—review & editing, J.C. and J.L. All authors have read and agreed to the published version of the manuscript.
Funding
This research was funded by National Natural Science Foundation of China (No. 41977332), Strategic Priority Research Program of Chinese Academy of Sciences (No. XDB40000000), and Youth Innovation Promotion Association CAS (No. 2020407).
Institutional Review Board Statement
Not applicable.
Informed Consent Statement
Not applicable.
Data Availability Statement
Not applicable.
Acknowledgments
This work was financially supported by the program from National Natural Science Foundation of China (No. 41977332), and the Strategic Priority Research Program of Chinese Academy of Sciences (No. XDB40000000). Jianjun Li also acknowledged the support of the Youth Innovation Promotion Association CAS (No. 2020407).
Conflicts of Interest
The authors declare no conflict of interest.
References
- Claeys, M.; Graham, B.; Vas, G.; Wu, W.; Vermeylen, R.; Pashynska, V.; Cafmeyer, J.; Cuyon, P.; Andreae, M.O.; Artaxo, P. Formation of Secondary Organic Aerosols Through Photooxidation of Isoprene. Science 2004, 303, 1173–1176. [Google Scholar] [CrossRef] [PubMed] [Green Version]
- Jang, M.; Czoschke, N.M.; Lee, S.; Kamens, R.M. Heterogeneous Atmosperic Aerosol Production by Acid-Catalyzed Particle-Phase Reactions. Science 2002, 298, 814–817. [Google Scholar] [CrossRef] [PubMed]
- Jaoui, M.; Kleindienst, T.; Lewandowski, M.; Offenberg, J.; Edney, E. Identification and Quantification of Aerosol Polar Oxygenated Compounds Bearing Carboxylic or Hydroxyl Groups. 2. Organic Tracer Compounds from Monoterpenes. Environ. Sci. Technol. 2005, 39, 5661–5673. [Google Scholar] [CrossRef] [PubMed]
- Tsigaridis, K.; Kanakidou, M. Global modelling of secondary organic aerosol in the troposphere: A sensitivity analysis. Atmos. Chem. Phys. 2003, 3, 2879–2929. [Google Scholar] [CrossRef] [Green Version]
- Eldering, A.; Hall, J.R.; Hussey, K.J.; Cass, G.R. Visibility Model Based on Satellite-Generated Landscape Data. Environ. Sci. Technol. 1996, 30, 361–370. [Google Scholar] [CrossRef]
- Pilinis, C.; Pandis, S.N.; Seinfeld, J.H. Sensitivity of direct climate forcing by atmospheric aerosols to aerosol size and composition. J. Geophys. Res. Atmos. 1995, 1001, 18739–18754. [Google Scholar] [CrossRef]
- Baltensperger, U.; Dommen, J.; Alfarra, M.R.; Duplissy, J.; Gaeggeler, K.; Metzger, A.; Facchini, M.C.; Decesari, S.; Finessi, E.; Reinnig, C.; et al. Combined determination of the chemical composition and of health effects of secondary organic aerosols: The POLYSOA project. J. Aerosol. Med. Pulm. Drug Deliv. 2008, 21, 145–154. [Google Scholar] [CrossRef]
- Piccot, S.D.; Watson, J.J.; Jones, J.W. A global inventory of volatile organic compound emissions from anthropogenic sources. J. Geophys. Res. Atmos. 1992, 97, 9897–9912. [Google Scholar] [CrossRef]
- Guenther, A.; Hewitt, C.N.; Erickson, D.; Fall, R.; Zimmerman, P. A global model of natural volatile organic compound emissions. J. Geophys. Res. Atmos. 1995, 100, 8873–8892. [Google Scholar] [CrossRef]
- Kourtchev, I.; Ruuskanen, T.; Maenhaut, W.; Kulmala, M.; Claeys, M. Observation of 2-methyltetrols and related photo-oxidation products of isoprene in boreal forest aerosols from Hyytiälä, Finland. Atmos. Chem. Phys. 2005, 5, 2761–2770. [Google Scholar] [CrossRef] [Green Version]
- Ding, X.; Wang, X.M.; Gao, B.; Fu, X.X.; He, Q.F.; Zhao, X.Y.; Yu, J.Z.; Zheng, M. Tracer-based estimation of secondary organic carbon in the Pearl River Delta, south China. J. Geophys. Res. Atmos. 2012, 117. [Google Scholar] [CrossRef]
- Volkamer, R.; Jimenez, J.L.; Martini, F.S.; Dzepina, K.; Qi, Z.; Salcedo, D.; Molina, L.T.; Worsnop, D.R.; Molina, M.J. Secondary organic aerosol formation from anthropogenic air pollution: Rapid and higher than expected. Geophys. Res. Lett. 2006, 33. [Google Scholar] [CrossRef] [Green Version]
- Paulot, F.; Crounse, J.D.; Kjaergaard, H.G.; Kürten, A.; St Clair, J.M.; Seinfeld, J.H.; Wennberg, P.O. Unexpected epoxide formation in the gas-phase photooxidation of isoprene. Science 2009, 325, 730–733. [Google Scholar] [CrossRef] [PubMed] [Green Version]
- Surratt, J.D.; Chan, A.; Eddingsaas, N.C.; Chan, M.N.; Loza, C.L.; Kwan, A.J.; Hersey, S.P.; Flagan, R.C.; Wennberg, P.O.; Seinfeld, J.H. Reactive intermediates revealed in secondary organic aerosol formation from isoprene. Proc. Natl. Acad. Sci. USA 2010, 107, 6640–6645. [Google Scholar] [CrossRef] [Green Version]
- Claeys, M.; Szmigielski, R.; Kourtchev, I.; Pieter, V.D.V.; Vermeylen, R.; Maenhaut, W.; Jaoui, M.; Kleindienst, T.E.; Lewandowski, M.; Offenberg, J.H. Hydroxydicarboxylic acids: Markers for secondary organic aerosol from the photooxidation of alpha-pinene. Environ. Sci. Technol. 2007, 41, 1628. [Google Scholar] [CrossRef]
- Eijck, A.V.; Opatz, T.; Taraborrelli, D.; Sander, R.; Hoffmann, T. New tracer compounds for secondary organic aerosol formation from β-caryophyllene oxidation. Atmos. Environ. 2013, 80, 122–130. [Google Scholar] [CrossRef]
- Offenberg, J.H.; Lewis, C.W.; Lewandowski, M.; Jaoui, M.; Kleindienst, T.E.; Edney, E.O. Contributions of toluene and alpha-pinene to SOA formed in an irradiated toluene/alpha-pinene/NO(x)/ air mixture: Comparison of results using 14C content and SOA organic tracer methods. Environ. Sci. Technol. 2007, 41, 3972–3976. [Google Scholar] [CrossRef]
- Wang, G.; Kawamura, K.; Xie, M.; Hu, S.; Gao, S.; Cao, J.; An, Z.; Wang, Z. Size-distributions of n-alkanes, PAHs and hopanes and their sources in the urban, mountain and marine atmospheres over East Asia. Atmos. Chem. Phys. 2009, 9, 8869–8882. [Google Scholar] [CrossRef] [Green Version]
- Wang, G.; Kawamura, K.; Lee, S.C.; Ho, K.F.; Cao, J.J. Molecular, Seasonal, and Spatial Distributions of Organic Aerosols from Fourteen Chinese Cities. Environ. Sci. Technol. 2006, 40, 4619–4625. [Google Scholar] [CrossRef]
- Li, J.; Wang, G.; Zhang, Q.; Li, J.; Zeng, L. Molecular characteristics and diurnal variations of organic aerosols at a rural site in the North China Plain with implications for the influence of regional biomass burning. Atmos. Chem. Phys. 2019, 19, 10481–10496. [Google Scholar] [CrossRef] [Green Version]
- Fu, P.; Kawamura, K.; Chen, J.; Miyazaki, Y. Secondary Production of Organic Aerosols from Biogenic VOCs over Mt. Fuji, Japan. Environ. Sci. Technol. 2014, 48, 8491–8497. [Google Scholar] [CrossRef] [PubMed]
- Xiang, D.; Zhang, Y.Q.; Quan-Fu, H.; Yu, Q.Q.; Wang, J.Q.; Shen, R.Q.; Song, W.; Wang, Y.S.; Wang, X.M. Significant Increase of Aromatics-Derived Secondary Organic Aerosol during Fall to Winter in China. Environ. Sci. Technol. 2017, 13, 7432–7441. [Google Scholar]
- Kleindienst, T.E.; Jaoui, M.; Lewandowski, M.; Offenberg, J.H.; Lewis, C.W.; Bhave, P.V.; Edney, E.O. Estimates of the contributions of biogenic and anthropogenic hydrocarbons to secondary organic aerosol at a southeastern US location. Atmos. Environ. 2007, 41, 8288–8300. [Google Scholar] [CrossRef]
- Li, J.; Wang, G.; Wu, C.; Cao, C.; Zhu, T. Characterization of isoprene-derived secondary organic aerosols at a rural site in North China Plain with implications for anthropogenic pollution effects. Sci. Rep. 2018, 8, 535. [Google Scholar] [CrossRef] [Green Version]
- Zhang, T.; Cao, J.J.; Tie, X.X.; Shen, Z.X.; Liu, S.X.; Ding, H.; Han, Y.M.; Wang, G.H.; Ho, K.F.; Qiang, J. Water-soluble ions in atmospheric aerosols measured in Xi’an, China: Seasonal variations and sources. Atmos. Res. 2011, 102, 110–119. [Google Scholar] [CrossRef]
- Fountoukis, C.; Nenes, A. ISORROPIA II: A computationally efficient thermodynamic equilibrium model for K+–Ca+–Mg+–NH4+–Na+–SO4−–NO3−–Cl−–H2O aerosols. Atmos. Chem. Phys. 2007, 7, 4639–4659. [Google Scholar] [CrossRef] [Green Version]
- Hennigan, C.J.; Izumi, J.; Sullivan, A.P.; Weber, R.J.; Nenes, A. A critical evaluation of proxy methods used to estimate the acidity of atmospheric particles. Atmos. Chem. Phys. 2015, 14, 2775–2790. [Google Scholar] [CrossRef] [Green Version]
- Ho, K.F.; Lee, S.C.; Cao, J.J.; Li, Y.S.; Chow, J.C.; Watson, J.G.; Fung, K. Variability of organic and elemental carbon, water soluble organic carbon, and isotopes in Hong Kong. Atmos. Chem. Phys. Discuss. 2006, 6, 4569–4576. [Google Scholar] [CrossRef] [Green Version]
- Bian, Y.X.; Zhao, C.S.; Ma, N.; Chen, J.; Xu, W.Y. A study of aerosol liquid water content based on hygroscopicity measurements at high relative humidity in the North China Plain. Atmos. Chem. Phys. 2014, 14, 6417–6426. [Google Scholar] [CrossRef] [Green Version]
- Clegg, S.L.; Brimblecombe, P.; Wexler, A.S. Brimblecombe, P.; Wexler, A.S. A Thermodynamic Model of the System H+-NH4+-Na+-SO42−-NO3−-Cl−-H2O at 298.15 K. J. Phys. Chem. A 1998, 102, 2155–2171. [Google Scholar] [CrossRef]
- Shaanxi Statistical Yearbook; Zhong Guo Tong Ji Chu Ban She: Beijing, China, 2012.
- Babu, P.; Verma, S.; Chatterjee, A.; Sharma, S.K.; Mandal, T.K. Chemical characterization of fine atmospheric particles for water-soluble ions and carbonaceous species over a tropical urban atmosphere in lower Indo-Gangetic Plain. Aerosol Air Qual. Res. 2019, 19, 129–147. [Google Scholar] [CrossRef]
- Claeys, M.; Wang, W.; Ion, A.C.; Kourtchev, I.; Gelencsér, A.; Maenhaut, W. Formation of secondary organic aerosols from isoprene and its gas-phase oxidation products through reaction with hydrogen peroxide. Atmos. Environ. 2004, 38, 4093–4098. [Google Scholar] [CrossRef]
- Wennberg, P.O.; Bates, K.H.; Crounse, J.D.; Dodson, L.G.; Mcvay, R.C.; Mertens, L.A.; Nguyen, T.B.; Praske, E.; Schwantes, R.H.; Smarte, M. Gas-Phase Reactions of Isoprene and Its Major Oxidation Products. Chem. Rev. 2018, 118, 3337–3390. [Google Scholar] [CrossRef] [PubMed] [Green Version]
- Rinne, H.; Guenther, A.B.; Greenberg, J.P. Isoprene and monoterpene fluxes measured above Amazonian rainforest and their dependence on light and temperature. Atmos. Environ. 2002, 36, 2421–2426. [Google Scholar] [CrossRef] [Green Version]
- Strader, R.; Lurmann, F.; Pandis, S.N. Evaluation of secondary organic aerosol formation in winter. Atmos. Environ. 1999, 33, 4849–4863. [Google Scholar] [CrossRef]
- Kesselmeier, J.; Staudt, M.J. Biogenic Volatile Organic Compounds (VOC): An Overview on Emission, Physiology and Ecology. J. Atmos. Chem. 1999, 33, 23–88. [Google Scholar] [CrossRef]
- Szmigielski, R.; Surratt, J.D.; Gómez-González, Y.; Pieter, V.D.V.; Kourtchev, I.; Vermeylen, R.; Blockhuys, F.; Jaoui, M.; Kleindienst, T.E.; Lewandowski, M. 3-Methyl-1,2,3-butanetricarboxylic acid: An atmospheric tracer for terpene secondary organic aerosol. Geophys. Res. Lett. 2007, 34. [Google Scholar] [CrossRef]
- Kleindienst, T.E.; Conver, T.S.; McIver, C.D.; Edney, E.O. Determination of secondary organic aerosol products from the photooxidation of toluene and their implications in ambient PM2.5. J. Atmos. Chem. 2004, 47, 79–100. [Google Scholar] [CrossRef]
- Hu, D.; Bian, Q.; Li, T.W.Y.; Lau, A.K.H.; Yu, J.Z. Contributions of isoprene, monoterpenes,β-caryophyllene, and toluene to secondary organic aerosols in Hong Kong during the summer of 2006. J. Geophys. Res. 2008, 113. [Google Scholar] [CrossRef]
- Li, J.; Wang, G.; Cao, J.; Zhang, R. Observation of biogenic secondary organic aerosols in the atmosphere of a mountain site in central China: Temperature and relative humidity effects. Atmos. Chem. Phys. 2013, 13, 11535–11549. [Google Scholar] [CrossRef] [Green Version]
- Bikkina, S.; Kawamura, K.; Sarin, M. Secondary Organic Aerosol Formation over Coastal Ocean: Inferences from Atmospheric Water-Soluble Low Molecular Weight Organic Compounds. Environ. Ence Technol. 2017, 51, 4347–4357. [Google Scholar] [CrossRef] [PubMed]
- Mcneill, V.F.; Woo, J.L.; Kim, D.D.; Schwier, A.N.; Wannell, N.J.; Sumner, A.J.; Barakat, J.M. Aqueous-Phase Secondary Organic Aerosol and Organosulfate Formation in Atmospheric Aerosols: A Modeling Study. Environ. Sci. Technol. 2012, 46, 8075. [Google Scholar] [CrossRef] [PubMed]
- Riva, M.; Bell, D.M.; Hansen, A.; Drozd, G.T.; Zhang, Z.; Gold, A.; Dan, I.; Surratt, J.D.; Glasius, M.; Zelenyuk, A. Effect of Organic Coatings, Humidity and Aerosol Acidity on Multiphase Chemistry of Isoprene Epoxydiols. Environ. Sci. Technol. 2016, 50, 5580. [Google Scholar] [CrossRef] [PubMed]
- Fu, P.; Zhuang, G.; Sun, Y.; Wang, Q.; Chen, J.; Ren, L.; Yang, F.; Wang, Z.; Pan, X.; Li, X. Molecular markers of biomass burning, fungal spores and biogenic SOA in the Taklimakan desert aerosols. Atmos. Environ. 2016, 130, 64–73. [Google Scholar] [CrossRef]
- Akagi, S.K.; Yokelson, R.J.; Wiedinmyer, C.; Alvarado, M.J.; Reid, J.S.; Karl, T.; Crounse, J.D.; Wennberg, P.O. Emission factors for open and domestic biomass burning for use in atmospheric models. Atmos. Chem. Phys. 2010, 11, 4039–4072. [Google Scholar] [CrossRef] [Green Version]
- Andreae, M.O.; Merlet, P. Emission of trace gases and aerosols from biomass burning. Glob. Biogeochem. Cycles 2001, 15, 955–966. [Google Scholar] [CrossRef] [Green Version]
- Gilardoni, S.; Massoli, P.; Paglione, M.; Giulianelli, L.; Carbone, C.; Rinaldi, M.; Decesari, S.; Sandrini, S.; Costabile, F.; Gobbi, G.P. Direct observation of aqueous secondary organic aerosol from biomass-burning emissions. Proc. Natl. Acad. Sci. USA 2016, 113, 10013. [Google Scholar] [CrossRef] [Green Version]
- Guo, S.; Hu, M.; Guo, Q.; Shang, D. Comparison of Secondary Organic Aerosol Estimation Methods. Acta Chim. Sin. 2014, 72, 658. [Google Scholar] [CrossRef] [Green Version]
- Feng, J.; Li, M.; Zhang, P.; Gong, S.; Zhong, M.; Wu, M.; Zheng, M.; Chen, C.; Wang, H.; Lou, S. Investigation of the sources and seasonal variations of secondary organic aerosols in PM2.5 in Shanghai with organic tracers. Atmos. Environ. 2013, 79, 614–622. [Google Scholar] [CrossRef]
Publisher’s Note: MDPI stays neutral with regard to jurisdictional claims in published maps and institutional affiliations. |
© 2022 by the authors. Licensee MDPI, Basel, Switzerland. This article is an open access article distributed under the terms and conditions of the Creative Commons Attribution (CC BY) license (https://creativecommons.org/licenses/by/4.0/).