
Atmospheric Hg Levels in Tree Barks Due to Artisanal Small-Scale Gold Mining Activity in Bunut Seberang Village in Indonesia

 ,
,  , ,
, ,
Abstract
:1. Introduction
2. Materials and Methods
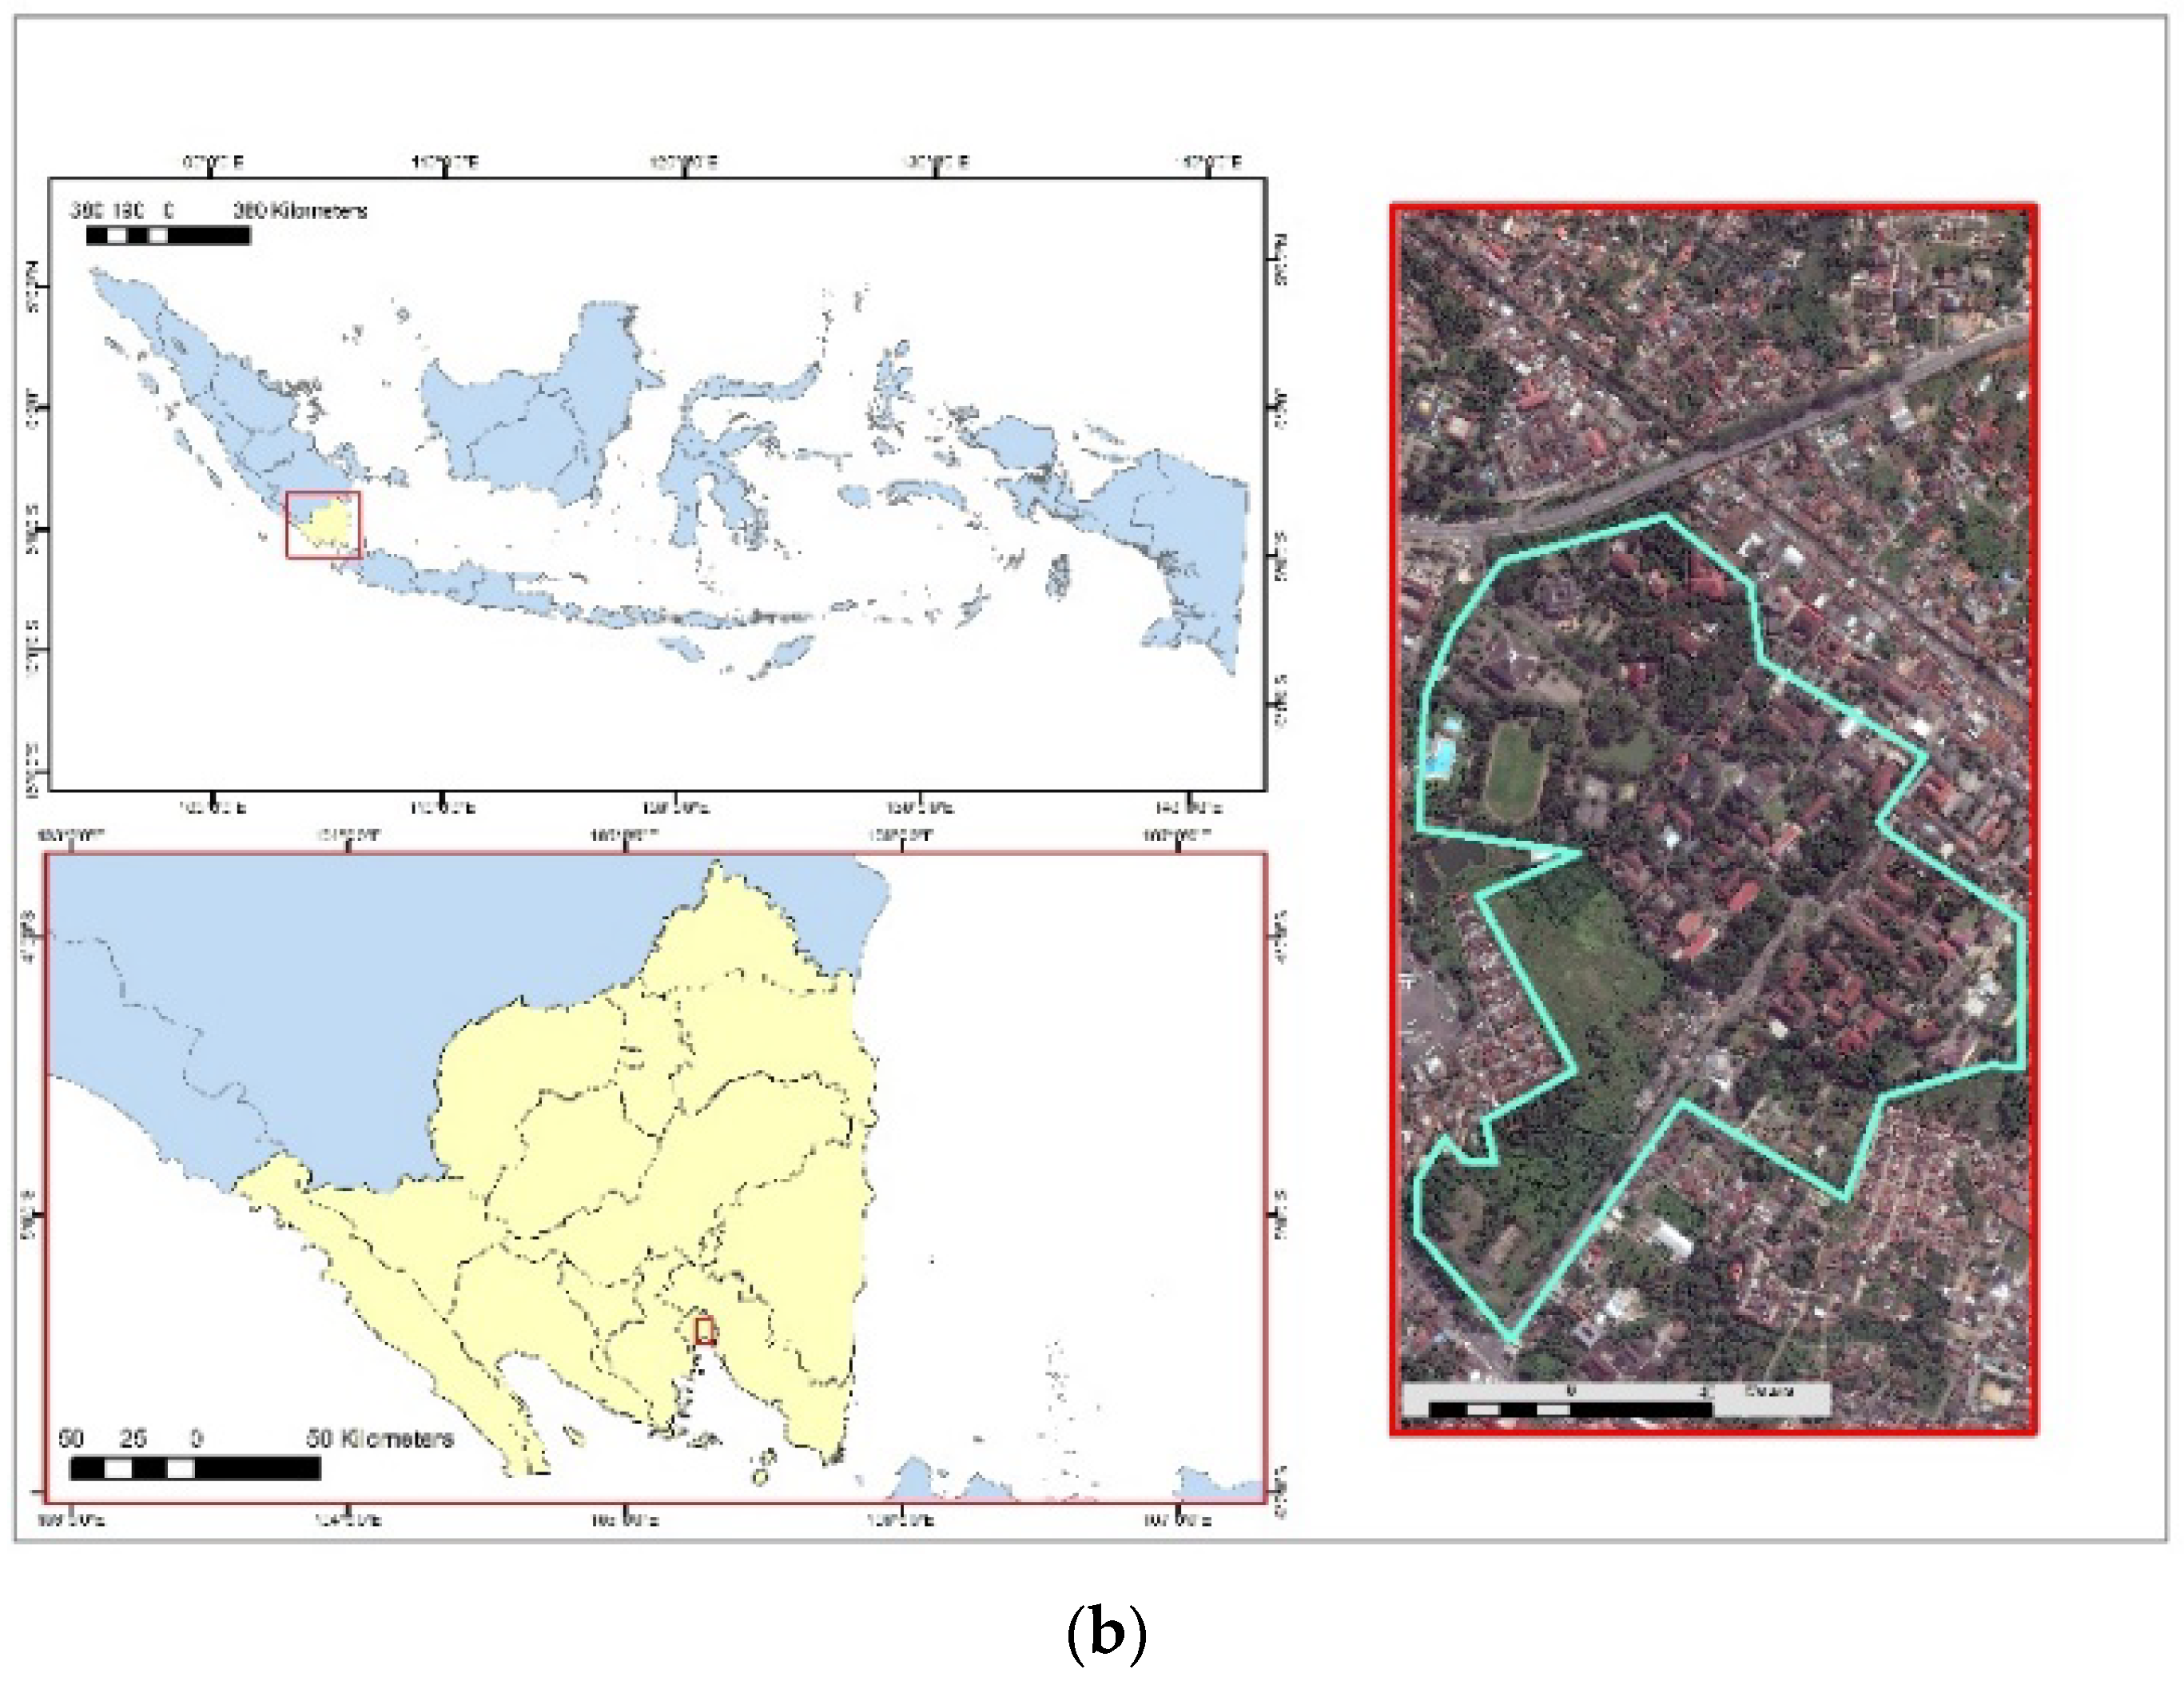
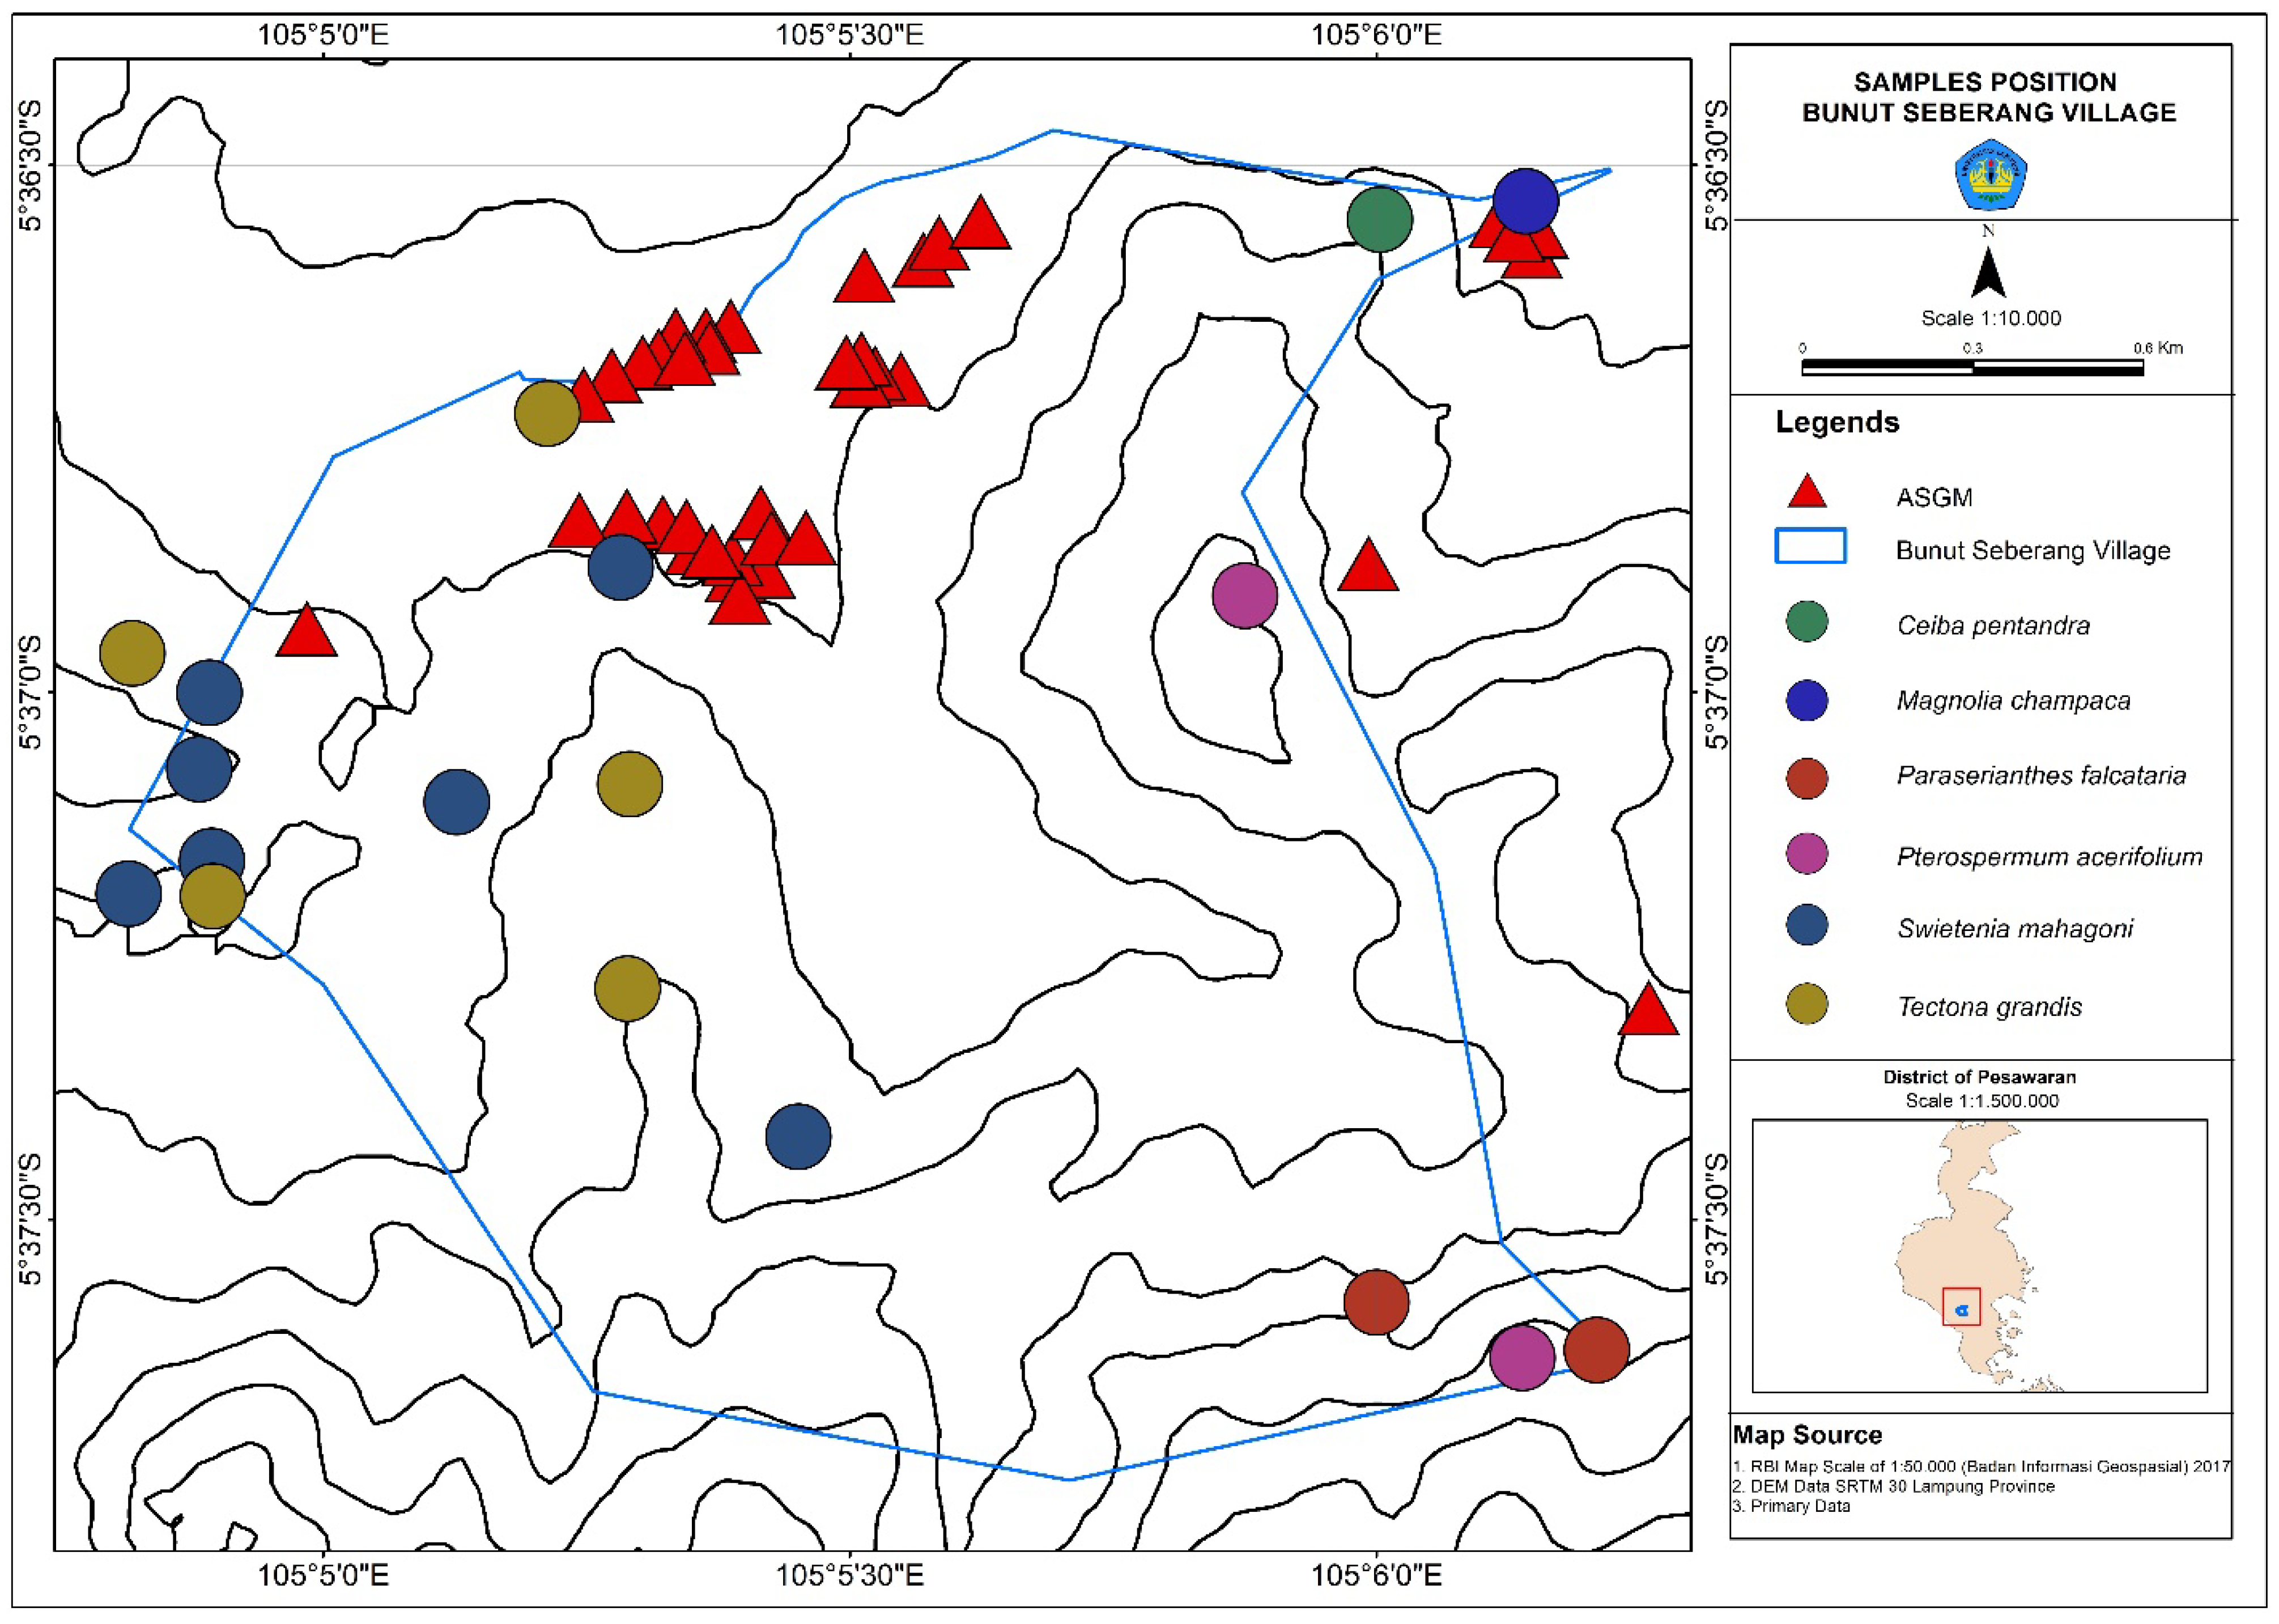
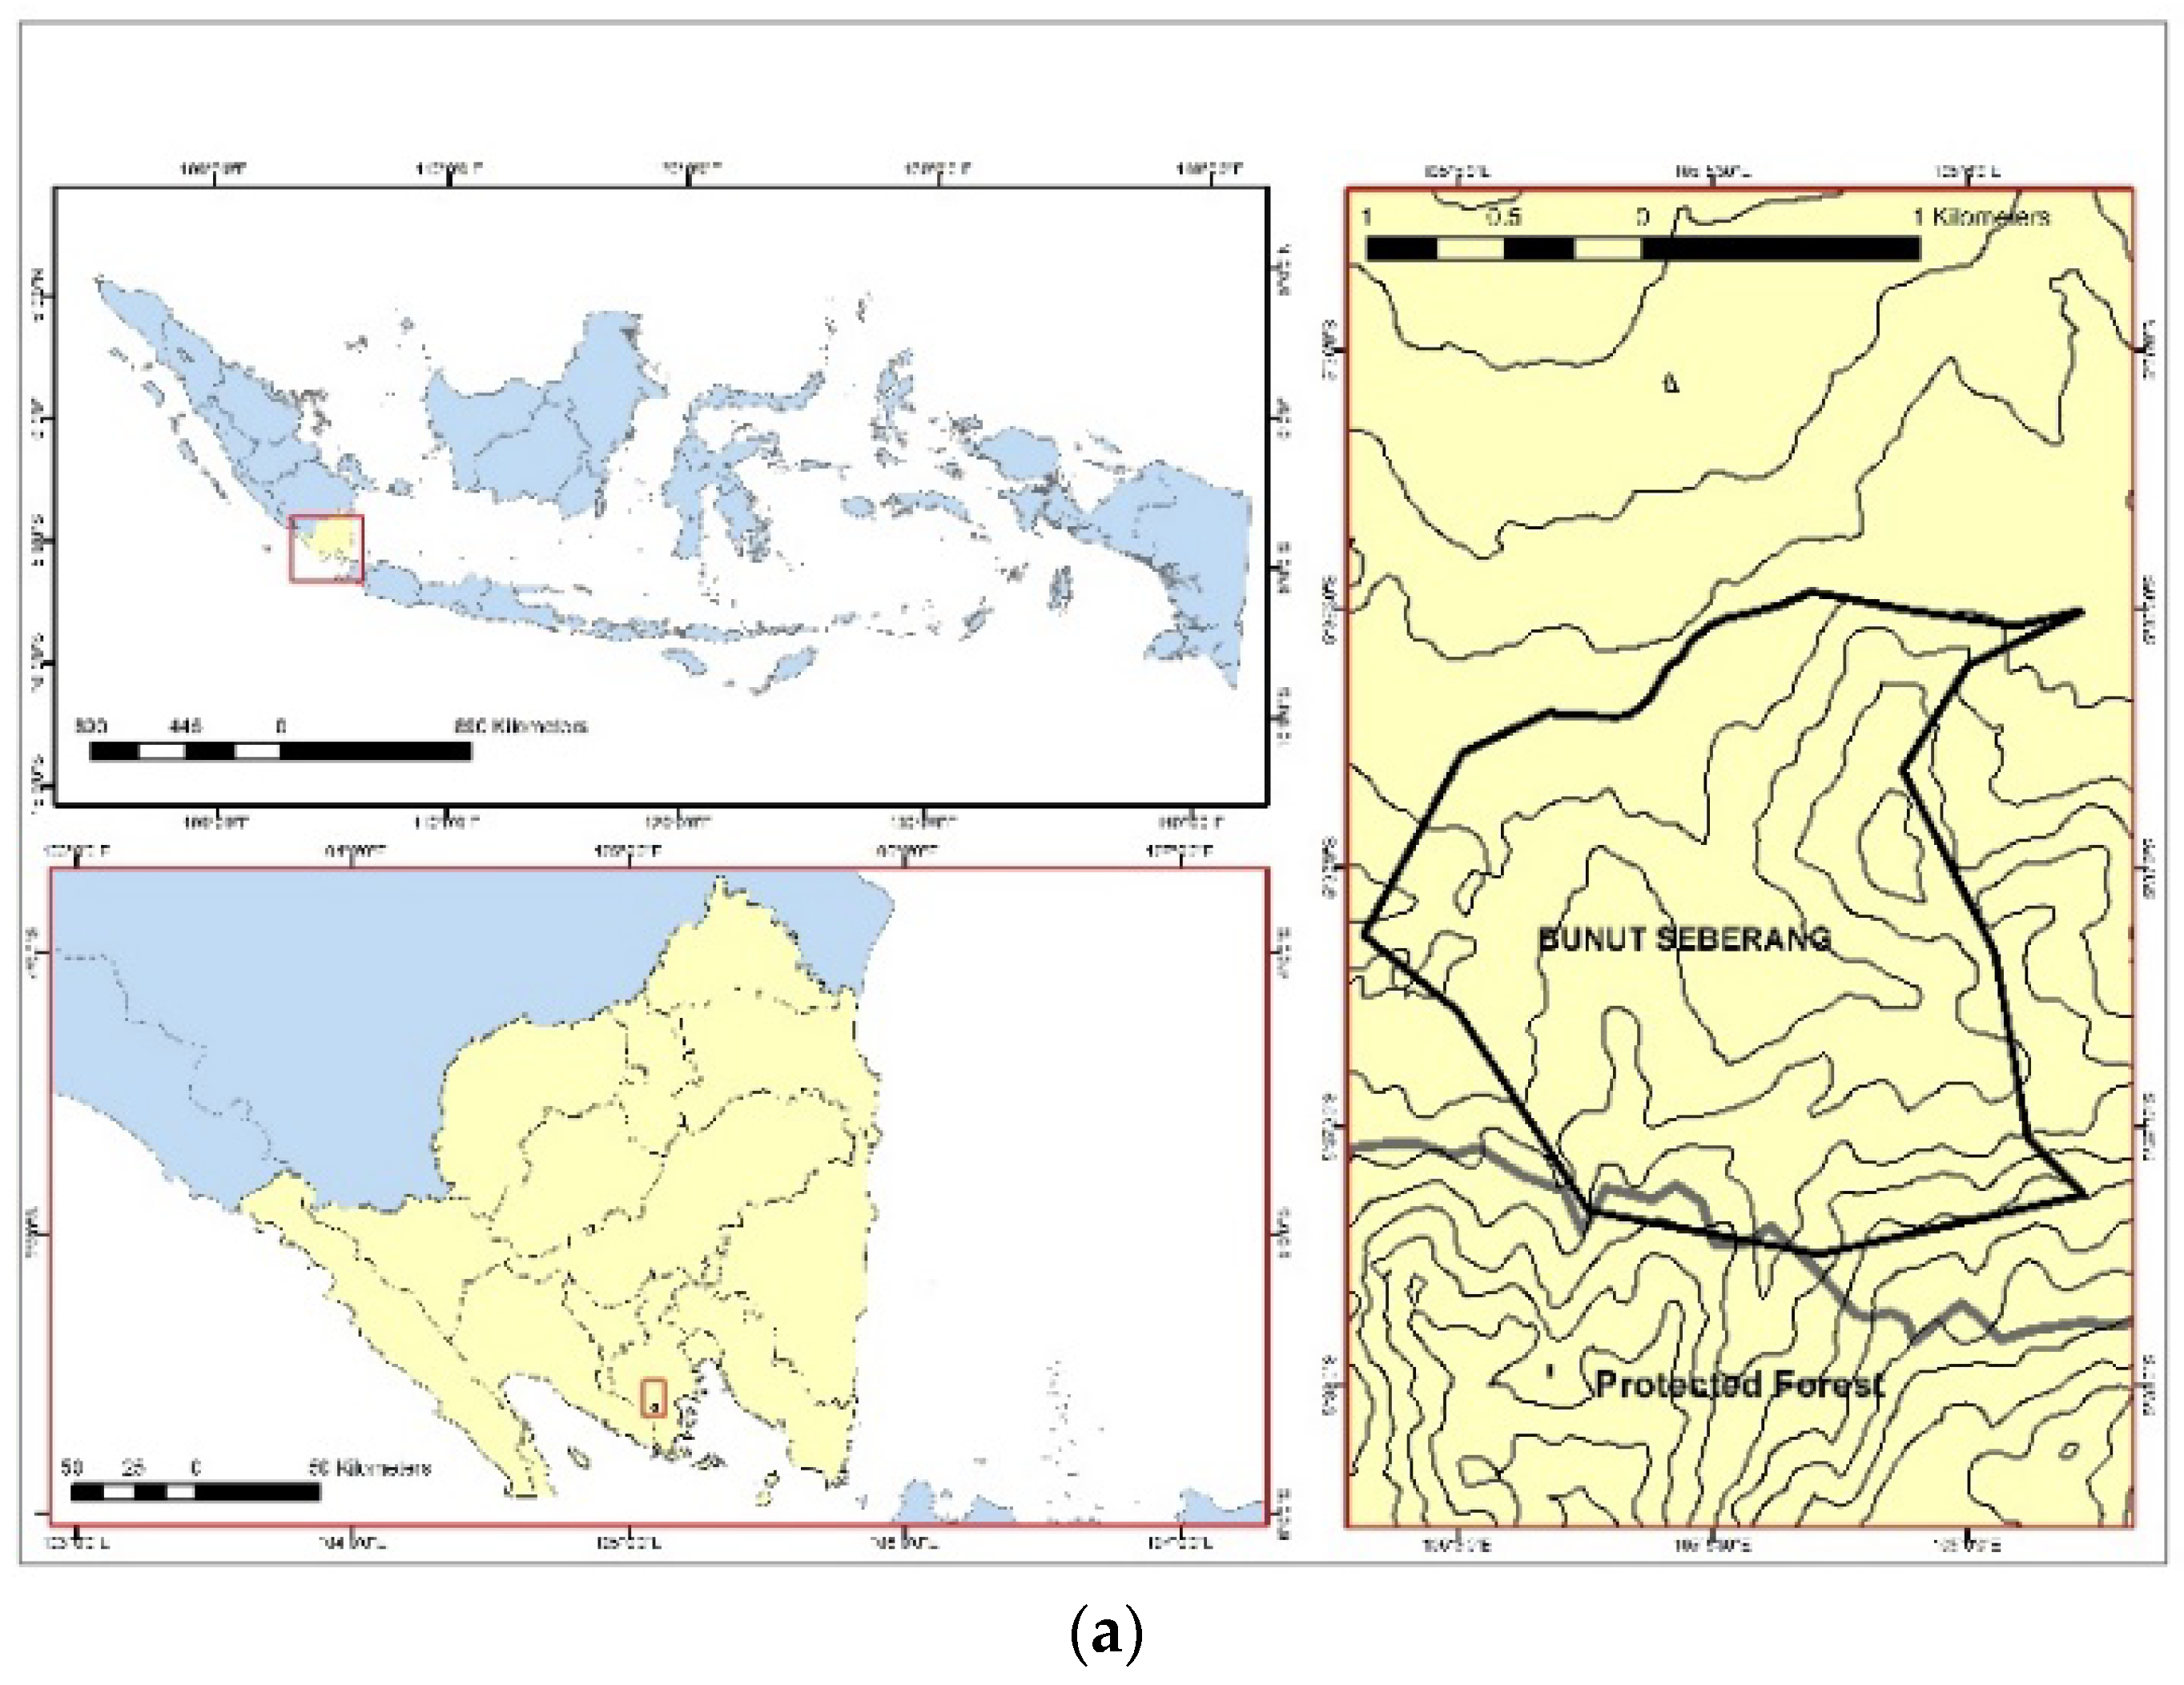
2.1. Study Location
2.2. Sampling Methods
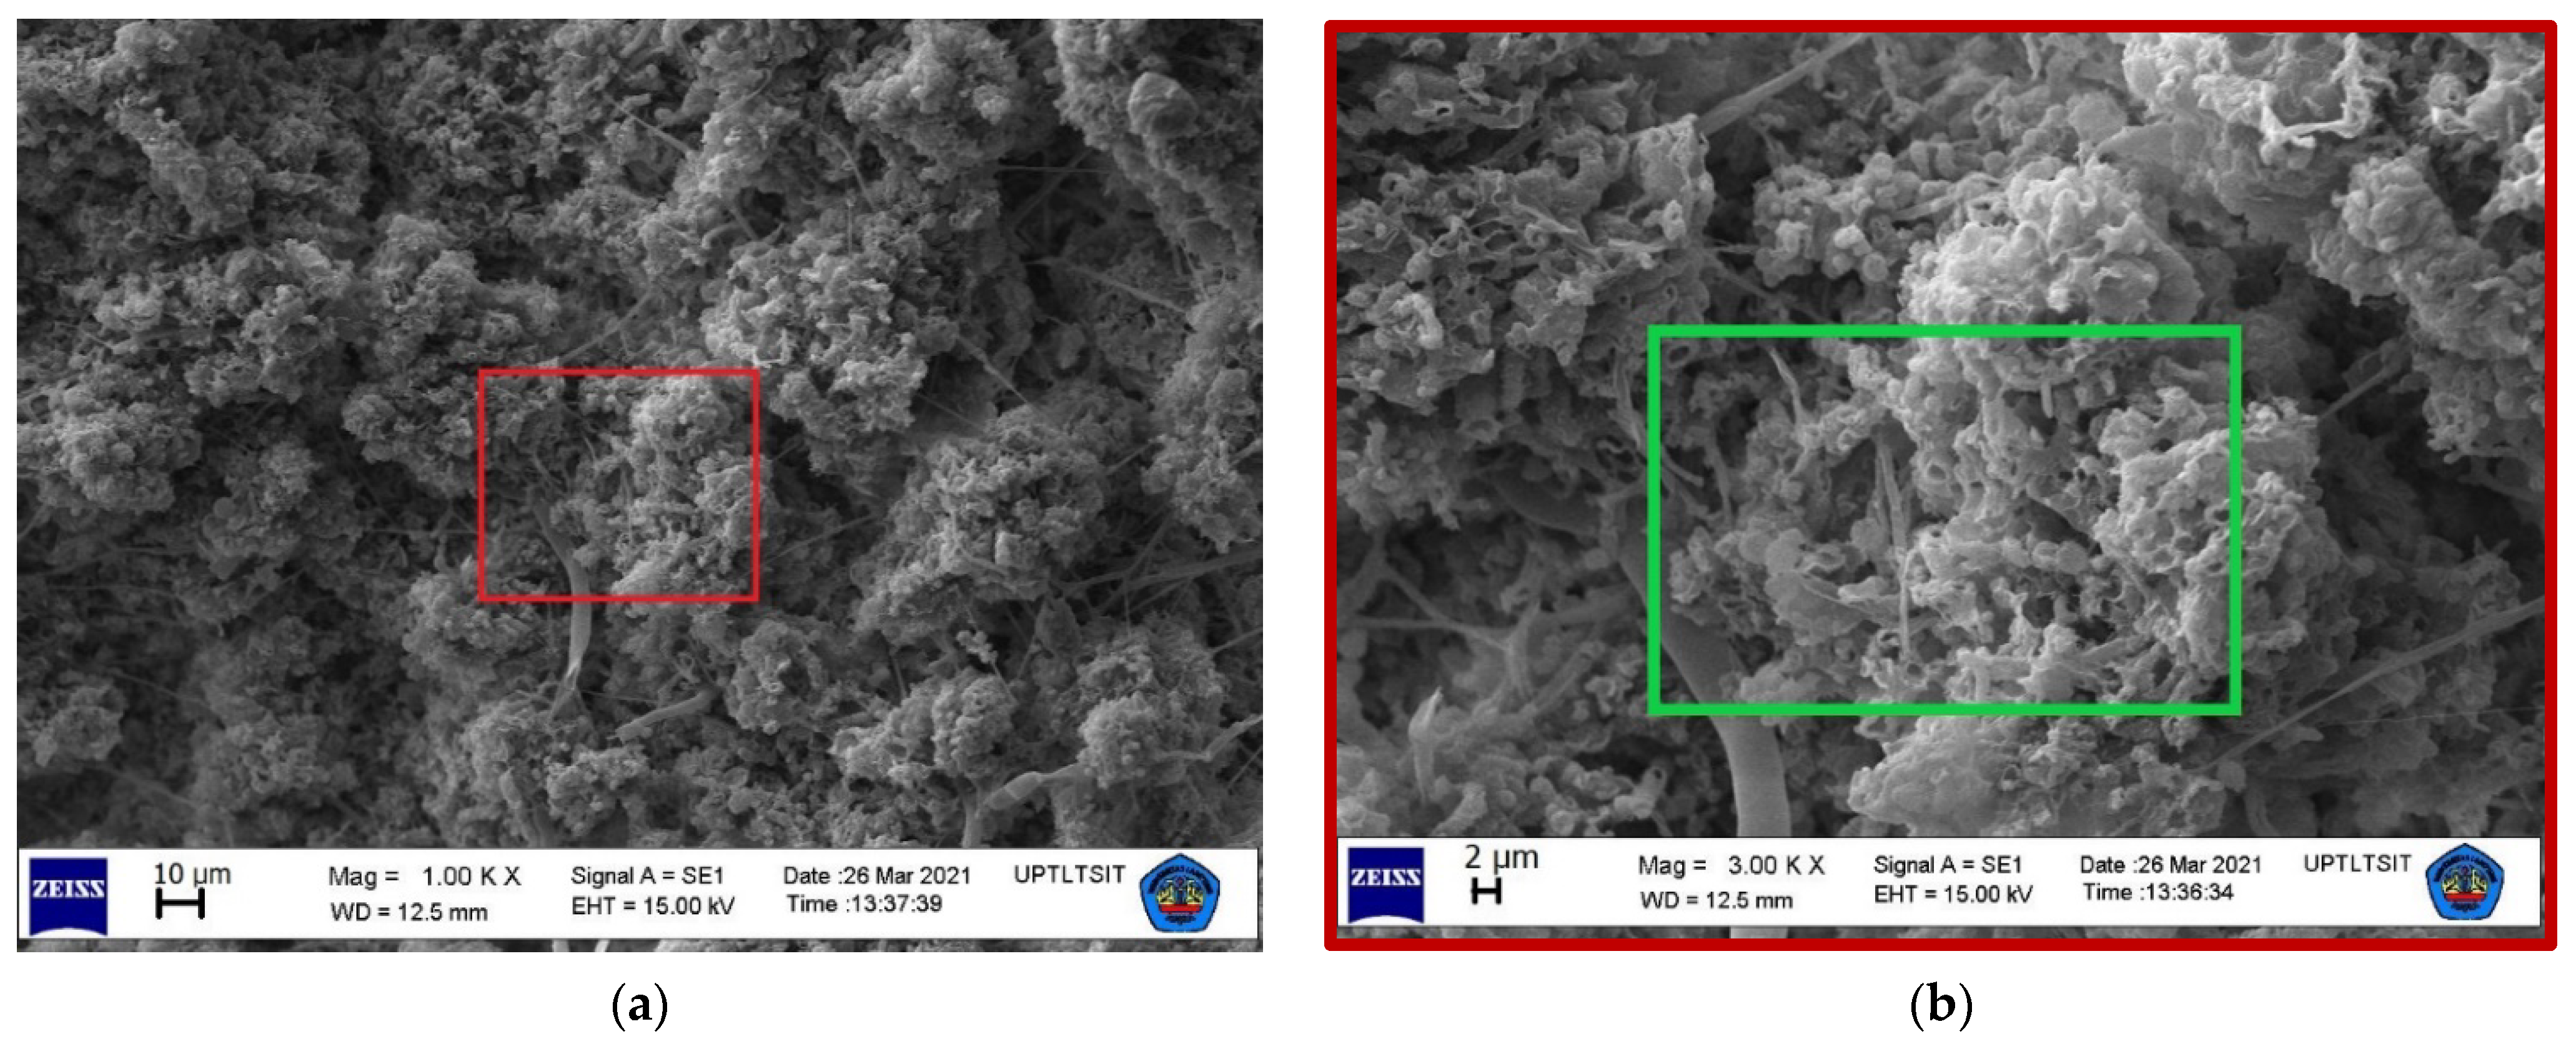
2.3. Atomic Absorption Spectrometry (AAS) and Scanning Electron Microscopy (SEM)
2.4. Statistical Analysis
3. Results
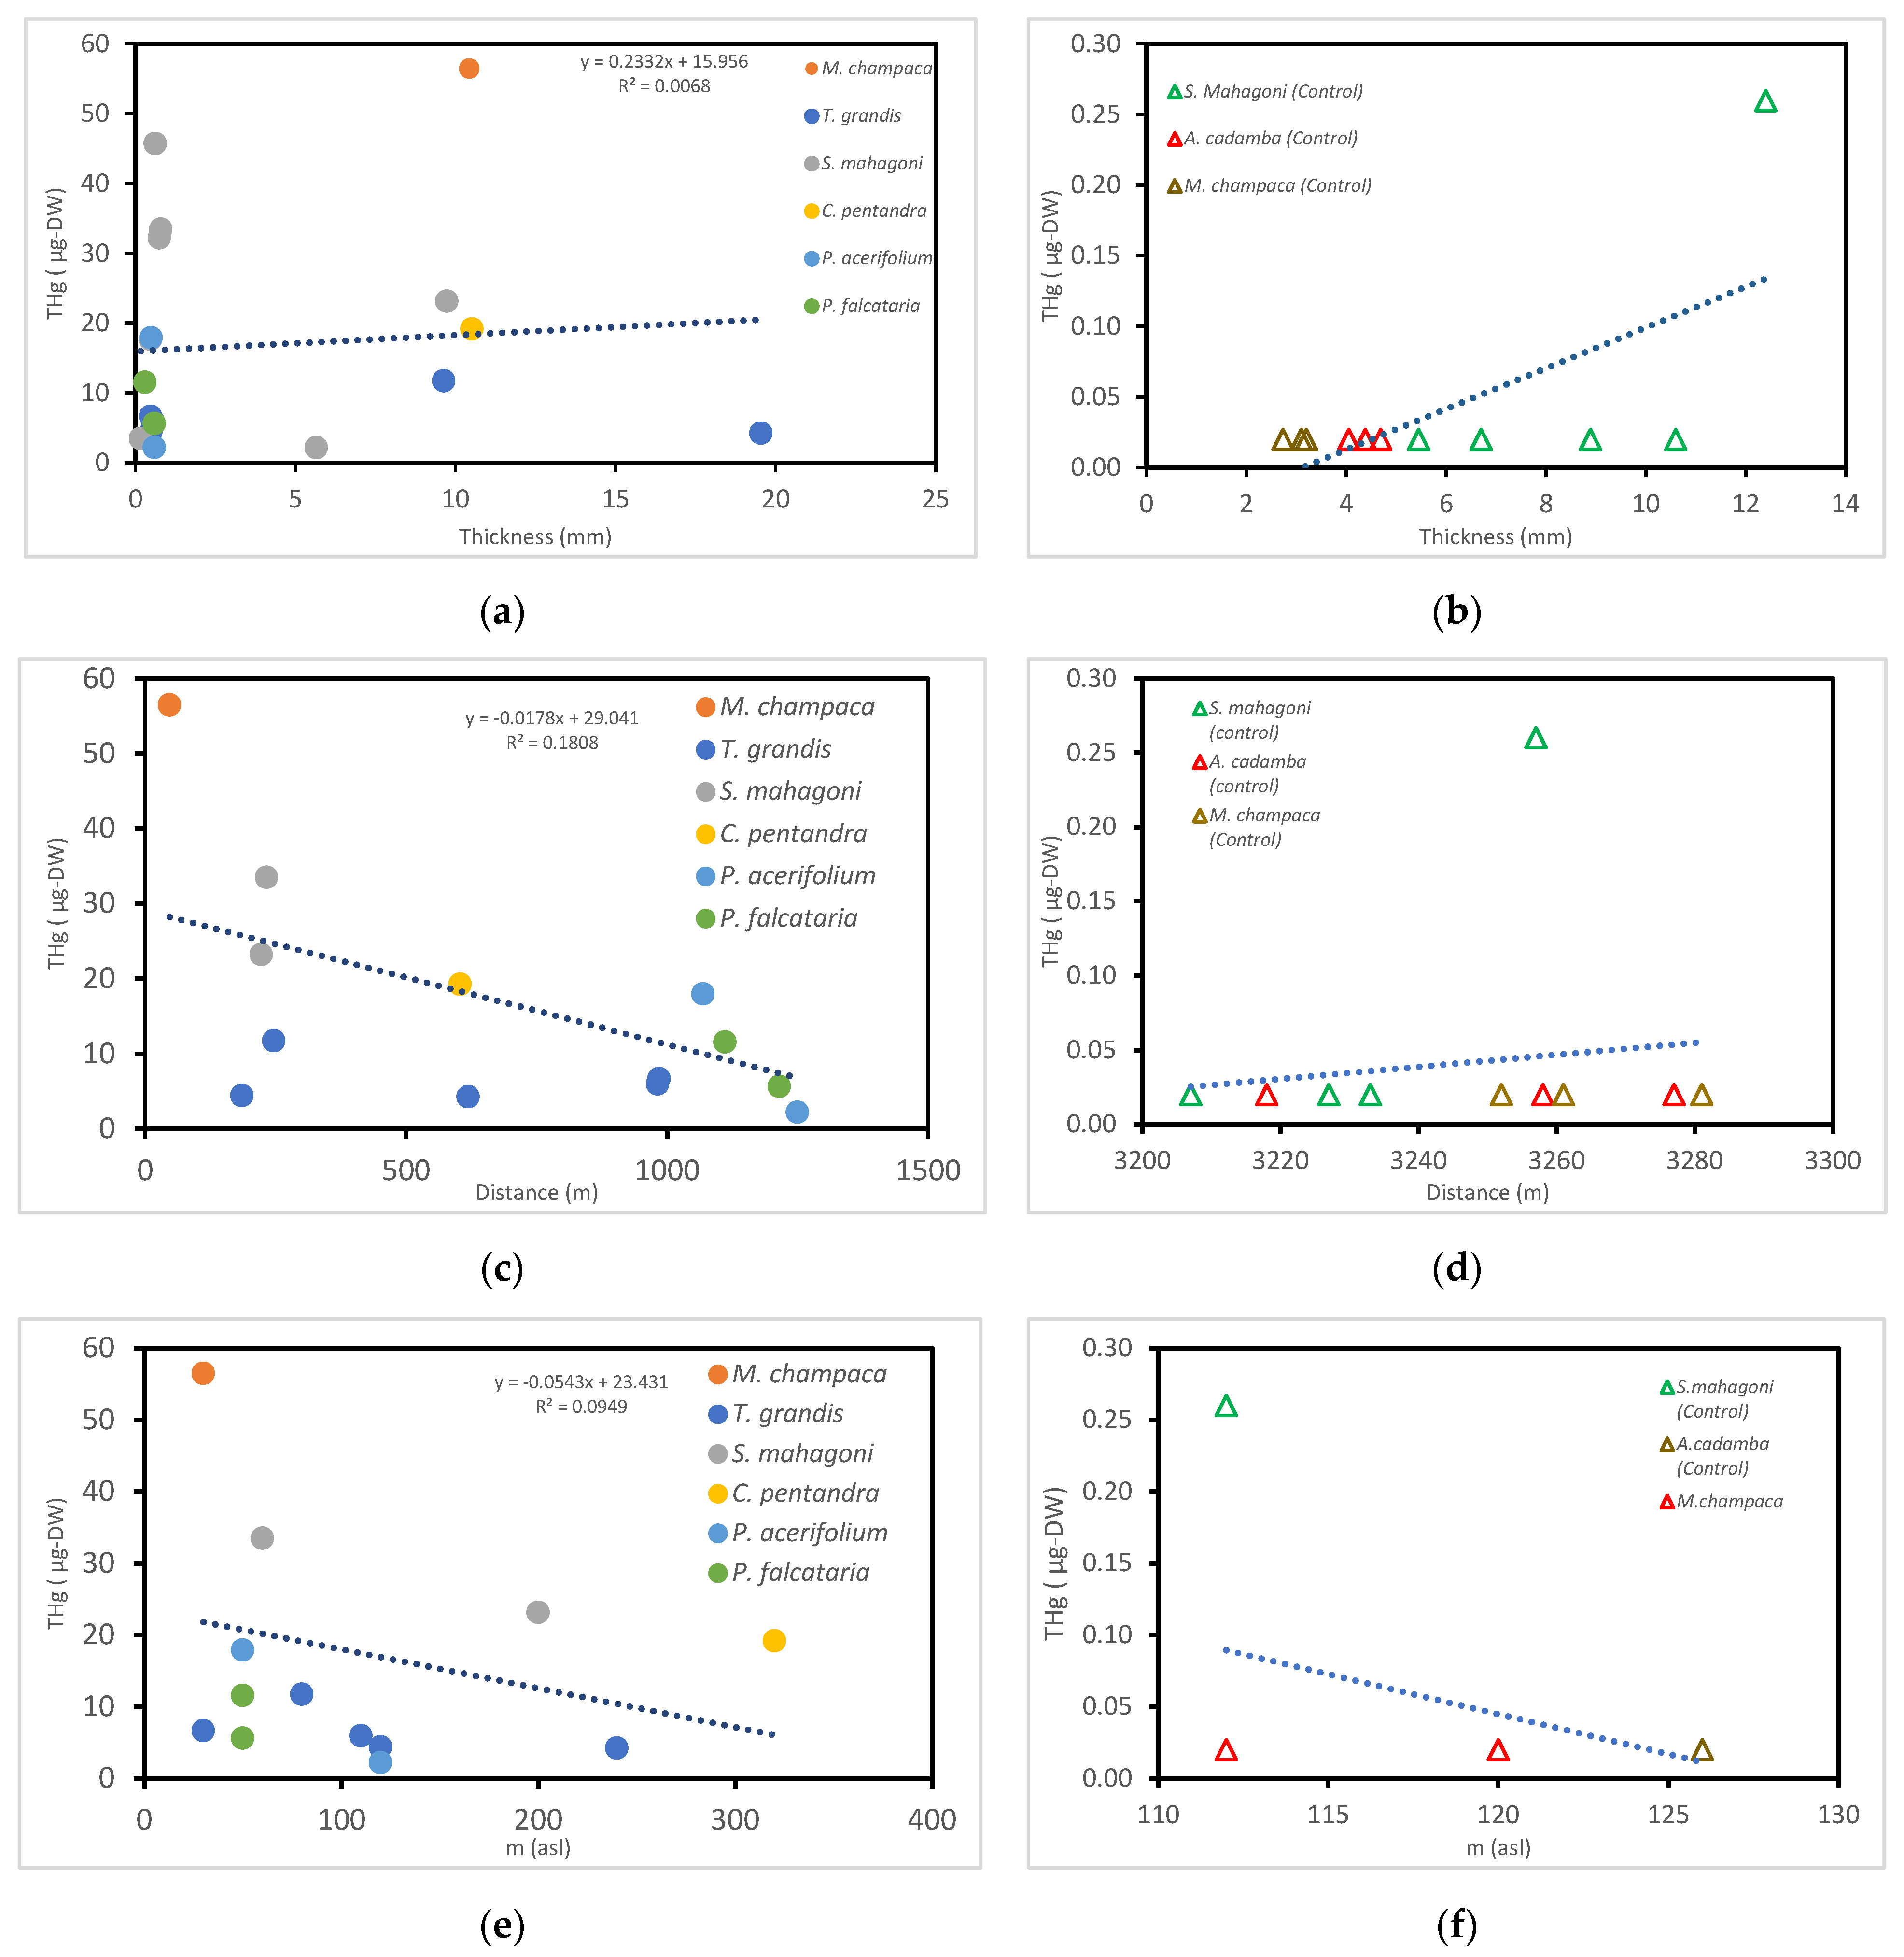
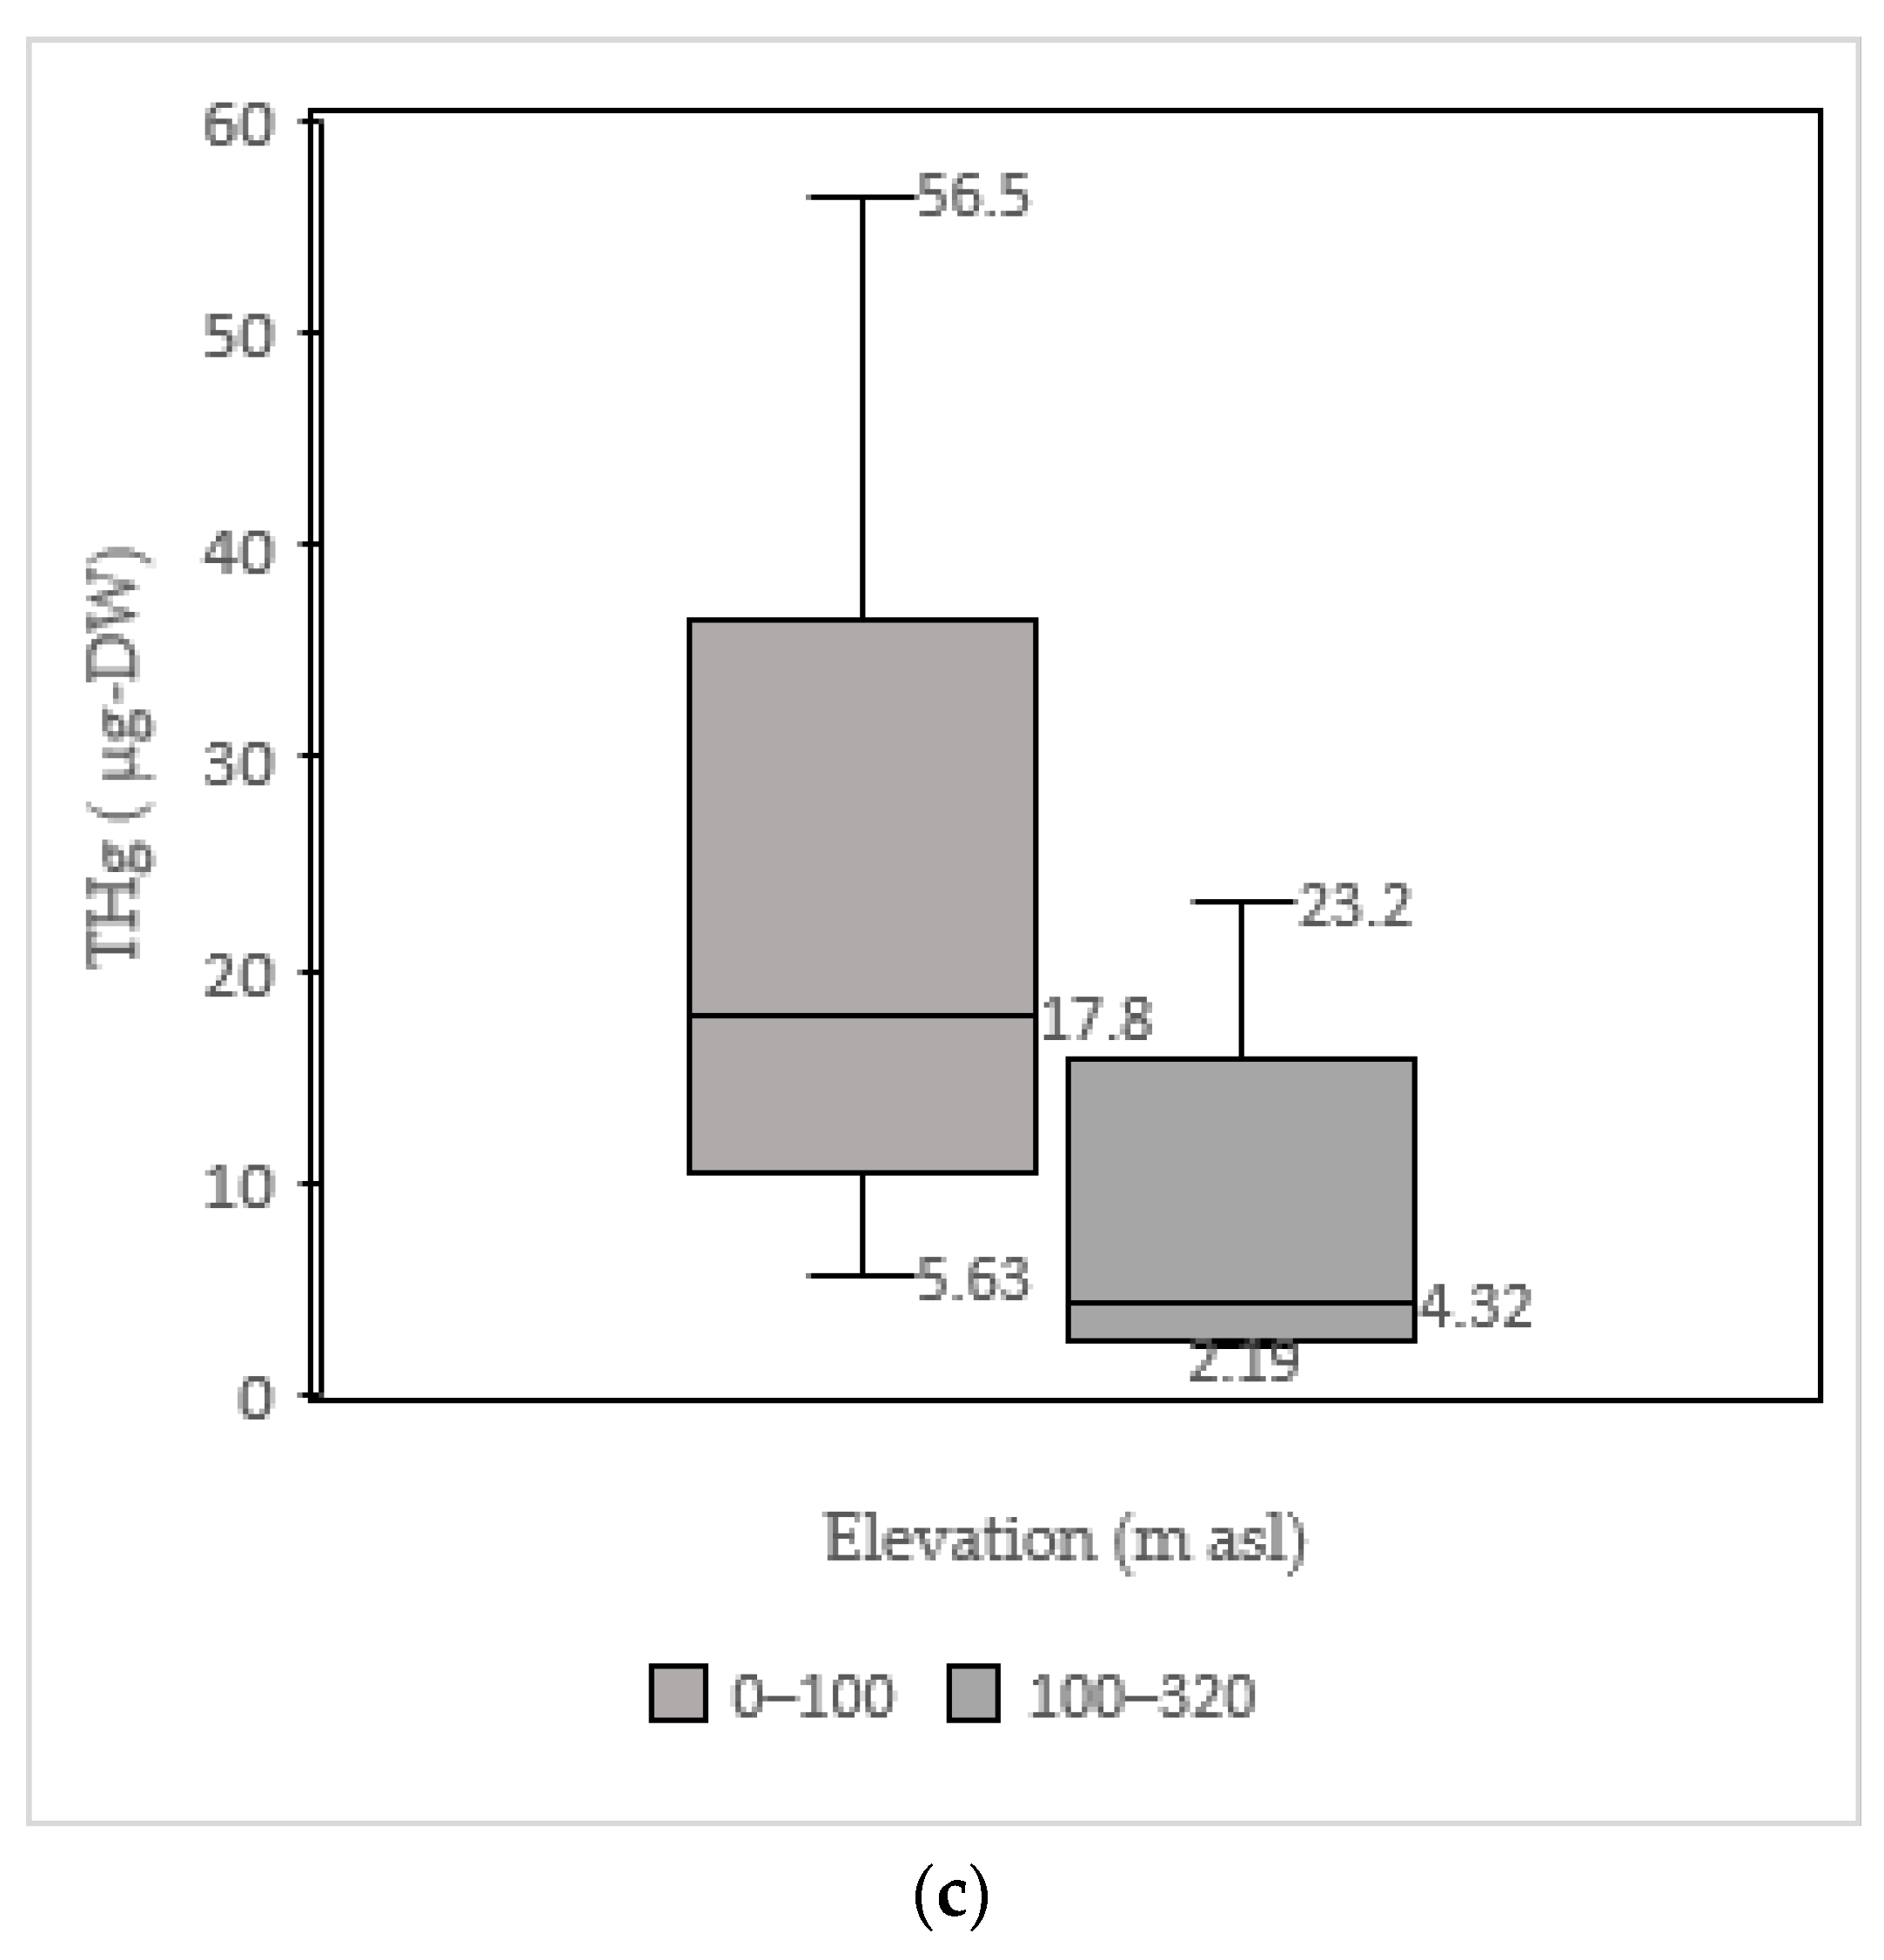
THg Levels in the Tree Bark Samples Based on Distance and Elevation
4. Discussion
4.1. THg in the Tree Bark Samples
4.2. Elevation, Distance, and Bark Thickness
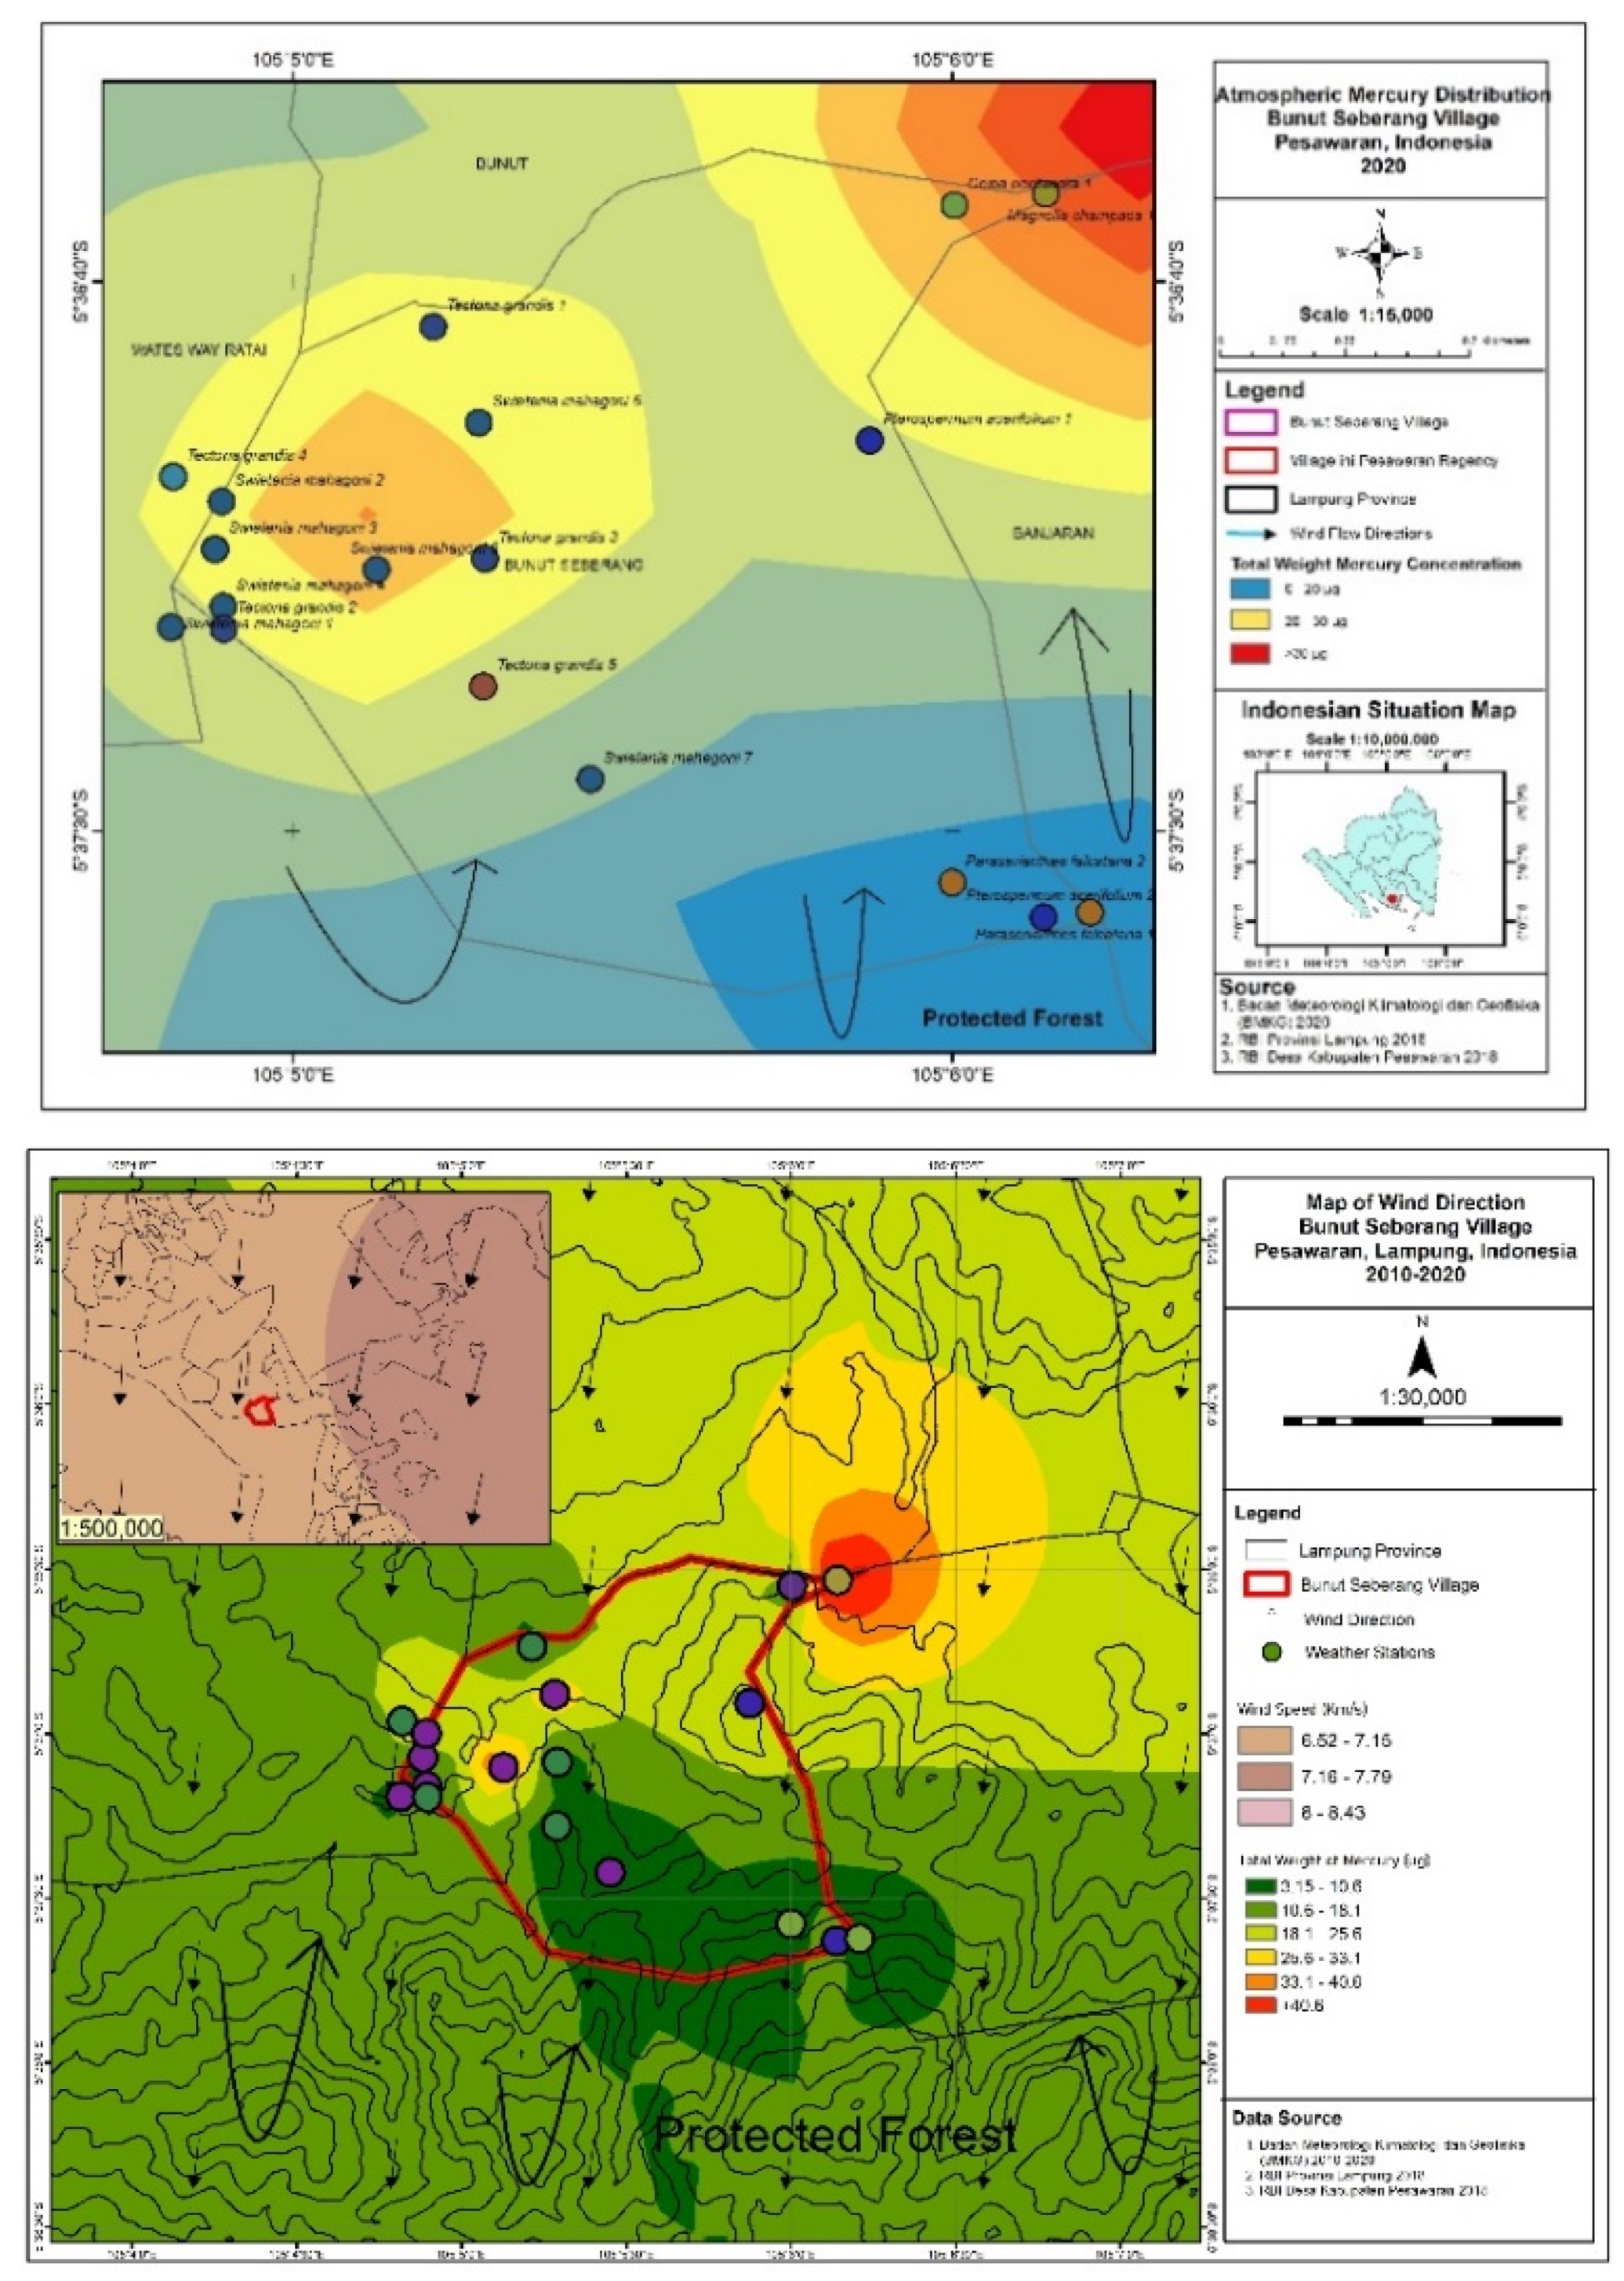
4.3. Wind Direction
5. Conclusions
Author Contributions
Funding
Institutional Review Board Statement
Informed Consent Statement
Data Availability Statement
Acknowledgments
Conflicts of Interest
References
- WHO (World Health Organisation). Exposure to Mercury: A Major Public Health Concern. 2009. Available online: http://www.who.int/phe/news/Mercury-flyer.pdf (accessed on 4 January 2021).
- Holmes, P.; James, K.A.F.; Levy, L.S. Is low level environmental mercury exposure of concern to human health? Sci. Total Environ. 2004, 408, 171–182. [Google Scholar] [CrossRef] [PubMed]
- Telmer, K.H.; Stapper, D. Evaluating and Monitoring Small Scale Gold Mining and Mercury Use: Building a Knowledge-Base with Satellite Imagery and Fieldwork. UNDP/GEF/UNIDO Project EG/GLO/01/G34; Final Report to the United Nations Industrial Development Organization; UNIDO: Vienna, Austria, 2007. [Google Scholar]
- De Lacerda, L.D.; Salomons, W. Mercury from Gold and Silver Mining a Chemical Time Bomb? Springer: Berlin, Germany, 1998; pp. 1–151. [Google Scholar]
- Green, C.S.; Lewis, P.J.; Wozniak, J.L.; Drevnick, P.E.; Thies, M.L. A comparison of factors affecting the small-scale distribution of mercury from artisanal small-scale gold mining in a Zimbabwean stream system. Sci. Total Environ. 2019, 647, 400–410. [Google Scholar] [CrossRef] [PubMed]
- Limbong, D.; Kumpampung, J.; Rimper, J.; Arai, T.; Miyazaki, N. Emissions and environmental implications of mercury from artisanal gold mining in North Sulawei, Indonesia. Sci. Total Environ. 2020, 302, 227–236. [Google Scholar] [CrossRef]
- Xu, J.; Garcia, A.B.; Lagerkvist, A.; Bertilsson, S.; Sjöblom, R.; Kumpiene, J. Sources and remediation techniques for mercury contaminated soil. Environ. Int. 2015, 74, 42–53. [Google Scholar] [CrossRef] [PubMed]
- Veiga, M.M.; Maxson, P.A.; Hylander, L.D. Origin and comsumption of mercury in small-scale gold mining. J. Clean. Prod. 2006, 14, 436–447. [Google Scholar] [CrossRef]
- Siwik, E.L.; Campbell, L.M.; Mierle, G. Fine-scale mercury trends in temperate decidous tree leaves from Ontario, Canada. Sci. Total Environ. 2009, 407, 6275–6279. [Google Scholar] [CrossRef]
- Blackwell, B.D.; Driscoll, C.T.; Maxwell, J.A.; Holsen, T.M. Changing climate alters inputs and pathways of mercury deposition to forested ecosystems. Biogeosciences 2014, 119, 215–228. [Google Scholar] [CrossRef] [Green Version]
- Gueguen, F.; Stille, P.; Geagea, M.L.; Boutin, R. Atmospheric pollution in an urban environment by tree bark biomonitoring-Part I: Trace element analysis. Chemosphere 2012, 86, 1013–1019. [Google Scholar] [CrossRef]
- Prasetia, H.; Sakakibara, M.; Omori, K.; Laird, J.S.; Sera, K.; Idham, A.K. Mangifera indica as Bioindicator of Mercury Atmospheric Contamination in an ASGM Area in North Gorontalo Regency, Indonesia. Geosciences 2018, 8, 31. [Google Scholar] [CrossRef] [Green Version]
- Yang, Y.; Yanai, R.D.; Driscoll, C.T.; Montesdeoca, M.; Smith, K.T. Concentrations and content of mercury in bark, wood, and leaves in hardwoods and conifers in four forested sites in the Northeastern USA. PLoS ONE 2018, 13, e0196293. [Google Scholar] [CrossRef]
- Fleck, J.A.; Grigal, D.F.; Nater, E.A. Mercury uptake by trees: And observational experiment. Water Air Soil Pollut. 1999, 115, 513–523. [Google Scholar] [CrossRef]
- Lahd Geagea, M.L.; Stiller, P.; Millet, M.; Perrone, T. Ree characteristics and Pb, Sr and Nd isotopic compositions of steel plant emissions. Sci. Total Environ. 2007, 373, 404–419. [Google Scholar] [CrossRef] [PubMed]
- Catinon, M.; Ayrault, S.; Clocchiatti, R.; Boudouma, O.; Asta, J.; Tissut, M.; Ravanel, P. The anthropogenic atmospheric elements fraction: A new interpretation of elemental deposits on tree barks. Atmos. Environ. 2009, 43, 1124–1130. [Google Scholar] [CrossRef]
- Ismail, A.Y.; Hendrayana, Y.; Saputra, R.H. Inventarisasi dan identifikasi sebaran hutan rakyat di Kabupaten Majalengka. Wanaraksa 2016, 10, 31–40. [Google Scholar]
- Indriyanto. Dendrologi: Suatu Teori & Praktik Menyidik Pohon; Plantaxia: Bandar Lampung, Indonesia, 2012; pp. 1–124. [Google Scholar]
- Sawidis, T.; Breuste, J.; Mitrovic, M.; Pavlovic, P.; Tsigaridas, K. Trees as bioindicator of heavy metal pollution in three European cities. Environ. Poll. 2011, 12, 3560–3570. [Google Scholar] [CrossRef]
- Ji, Z. Use of compositional and combinatorial nanomaterial libraries for biological studies. Sci. Bull. 2016, 10, 755–771. [Google Scholar] [CrossRef]
- Prasetia, H.; Sakakibara, M.; Sera, K.; Laird, S.T. Evaluation of the total mercury weight exposure distribution using tree bark analysis in an artisanal and small-scale gold mining area, North Gorontalo Regency, Gorontalo Province, Indonesia. Int. J. Environ. Res. Public Health 2022, 19, 33. [Google Scholar] [CrossRef]
- Rendra, T.; Riniarti, M.; Yuwono, S.B.; Prasetia, H.; Widiastuti, E.L.; Bakri, S.; Taufiq, A. Mapping atmospheric mercury in Lampung Province, Indonesia using bark of multipurpose tree species. Atmosphere 2022, 13, 2. [Google Scholar] [CrossRef]
- Kosegeran, A.O.; Rondonuwu, S.; Simbala, H.; Rumondor, M. Kandungan merkuri pada tumbuhan paku (Diplazium accedens Blume) di daerah tambang emas Tatelu-Talawaan, Kabupaten Minahasa Utara. J. Ilm. Sains 2015, 15, 59–65. [Google Scholar] [CrossRef]
- Kabata-Pendias, A.; Pendias, H. Soils and Plants, 3rd ed.; CRC Press: New York, NY, USA, 2001; pp. 1–403. [Google Scholar]
- Odukoya, O.O.; Arowolo, T.T.; Bamgbose, O. Pb, Zn and Cu levels in tree barks as indicator of atmospheric pollution. Environ. Int. 2000, 26, 11–16. [Google Scholar] [CrossRef]
- Javarabad, D.M.; Azadfar, D.; Arzanesh, H.M. The ability to filter heavy metals of lead, copper and zinc in some species of tree and shrub. Int. J. Adv. Biol. Biomed. Res. 2013, 1, 53–60. [Google Scholar]
- Griggs, T.; Liu, L.; Talbot, R.W.; Torres, A.; Lan, X. Comparison of atmospheric mercury speciation at a coastal and an urban site in Southeastern Texas, USA. Atmosphere 2020, 11, 73. [Google Scholar] [CrossRef] [Green Version]
- Świsłowski, P.; Kříž, J.; Rajfur, M. The Use of Bark in Biomonitoring Heavy Metal Pollution of Forest Areas on the Example of Selected Areas in Poland. Ecol. Chem. Eng. S 2020, 27, 195–210. [Google Scholar] [CrossRef]
- Tye, A.M.; Hodgkinson, E.S.; Rawlins, B.G. Microscopic and chemical studies of metal particulates in attic dust: Evidence for historical atmospheric smelter emission, Humberside, UK. J. Environ. Monit. 2006, 8, 904–912. [Google Scholar] [CrossRef] [Green Version]
- Han, Y.J.; Kim, P.R.; Lee, G.S.; Lee, J.I.; Noh, S.; Yu, S.M.; Park, K.S.; Seok, K.S.; Kim, H.; Kim, Y.H. Mercury concentrations in environmental media at a hazardous solid waste landfill site and mercury emissions from the site. Environ. Earth Sci. 2017, 76, 361. [Google Scholar] [CrossRef]
- Krisnawati, H.; Kallio, M.; Kanninen, M. Anthocephalus cadamba Miq. Ekologi, Silvikultur dan Produktivitas; CIFOR: Bogor, Indonesia, 2011; pp. 1–22. [Google Scholar]
- Barnes, D.; Hammadah, M.A.; Ottaway, J.M. The lead, copper and zinc contens of tree rings and barks, a measurement of local pollution. Sci. Total Environ. 1976, 5, 63–67. [Google Scholar] [CrossRef]
- Pásztory, Z.; Mohácsiné, I.; Gorbacheva, G.; Börcsök, Z. The Utilization of Tree Bark. BioResources 2016, 11, 7859–7888. [Google Scholar] [CrossRef]
- Aoyama, M.; Kishino, M.; Jo, T.S. Biosorption of Cr (VI) on Japanese cedar bark. Sep. Sci. Technol. 2004, 39, 1149–1162. [Google Scholar] [CrossRef]
- Patel, K.S.; Yadav, A.; Sahu, Y.K.; Lata, L.; Milosh, H.; Corns, W.T.; Martin-Ramos, P. Tree bark as a bioindicator for arsenic and heavy metal air pollution in Rajnandgaon District, Chhattisgarh, India. Hazard Toxic Radioact. Waste 2020, 24, 1–5. [Google Scholar] [CrossRef]
- Nursal, F.B. Akumulasi timbal (Pb) pada Talus Lichenes di Kota Pekanbaru. Biogenesis 2005, 1, 47–50. [Google Scholar]
- Tovar-Sanchez, E.; Surez-Rodrigues, R.; Ramires-Trujilo, A.; Valencia-Cavas, L.; Hernandez-Plata, I.; Mussali-Galante, P. The Use of Biosensors for Biomonitoring Environmental Metal Pollution. In Biosensors for Environmental Monitoring; Rinken, T., Kivirand, K., Eds.; IntechOpen: London, UK, 2019. [Google Scholar] [CrossRef] [Green Version]
- Chiarantini, L.; Rimondi, V.; Bardelli, F.; Benvenuti, M.; Cosio, C.; Costagliola, P. Mercury speciation in Pinus nigra barks from monte Amiata (Italy): An X-ray absorption spectroscopy study. Environ. Pollut. 2017, 227, 83–88. [Google Scholar] [CrossRef] [PubMed]
- Zhang, L.; Lyman, S.; Mao, H.; Lin, C.; Gay, D.A.; Wang, S.; Gustin, M.S.; Feng, X.; Wania, F. A synthesis of research needs for improving the understanding of atmospheric mercury cycling. Atmos. Chem. Phys. 2017, 17, 9133–9144. [Google Scholar] [CrossRef] [Green Version]
- Bernhoft, A.R. Mercury Toxicity and Treatment: A Review of The Literature. Environ. Public Health 2011, 2012, 460508. [Google Scholar] [CrossRef] [PubMed]
- Briffa, J.; Sinagra, E.; Blundell, R. Heavy metal pollution in the environment and their toxicological effects on humans. Heliyon 2020, 6, e04691. [Google Scholar] [CrossRef]
- Sprovieri, F.; Pirrone, N.; Ebinghaus, R.; Kock, H.; Dommergue, A. A review of worldwide atmospheric mercury measurements. Atmos. Chem. Phys. 2010, 10, 8245–8265. [Google Scholar] [CrossRef] [Green Version]
- Siddiqi, Z.M. Transport and Fate of Mercury (Hg) in the Environment: Need for Continuous Monitoring. In Handbook of Environmental Materials Management; Hussain, C., Ed.; Springer: Cham, Switzerland, 2018; pp. 1–20. [Google Scholar] [CrossRef]
- Schuster, P.F.; Krabbenhoft, D.P.; Naftz, D.L.; Cecil, L.D.; Olson, M.L.; Dewild, J.F. Atmospheric mercury deposition during the last 270 years: A glacial ice core record of natural and anthropogenic sources. Environ. Sci. Tecnol. 2002, 36, 2303–2310. [Google Scholar] [CrossRef]
- Zhang, M.; Bae, W.; Kim, J. The effects of the layouts of vegetation and wind flow in an apartment housing complex to mitigate outdoor microclimate air temperature. Sustainability 2019, 11, 3081. [Google Scholar] [CrossRef] [Green Version]
- Boylan, H.M.; Cain, R.D.; Kingston, H.M. A new method to assess mercury emissions: A study of three coal-fired electric-generating power station configurations. Air Waste Manag. Assoc. 2003, 53, 1318–1325. [Google Scholar] [CrossRef] [Green Version]


 :
:  ,
,  , or
, or  ) in a panel depicts the analyzed area.
: , , or ) in a panel depicts the analyzed area.
) in a panel depicts the analyzed area.
: , , or ) in a panel depicts the analyzed area.

 = 2q box,
  = 3q box.
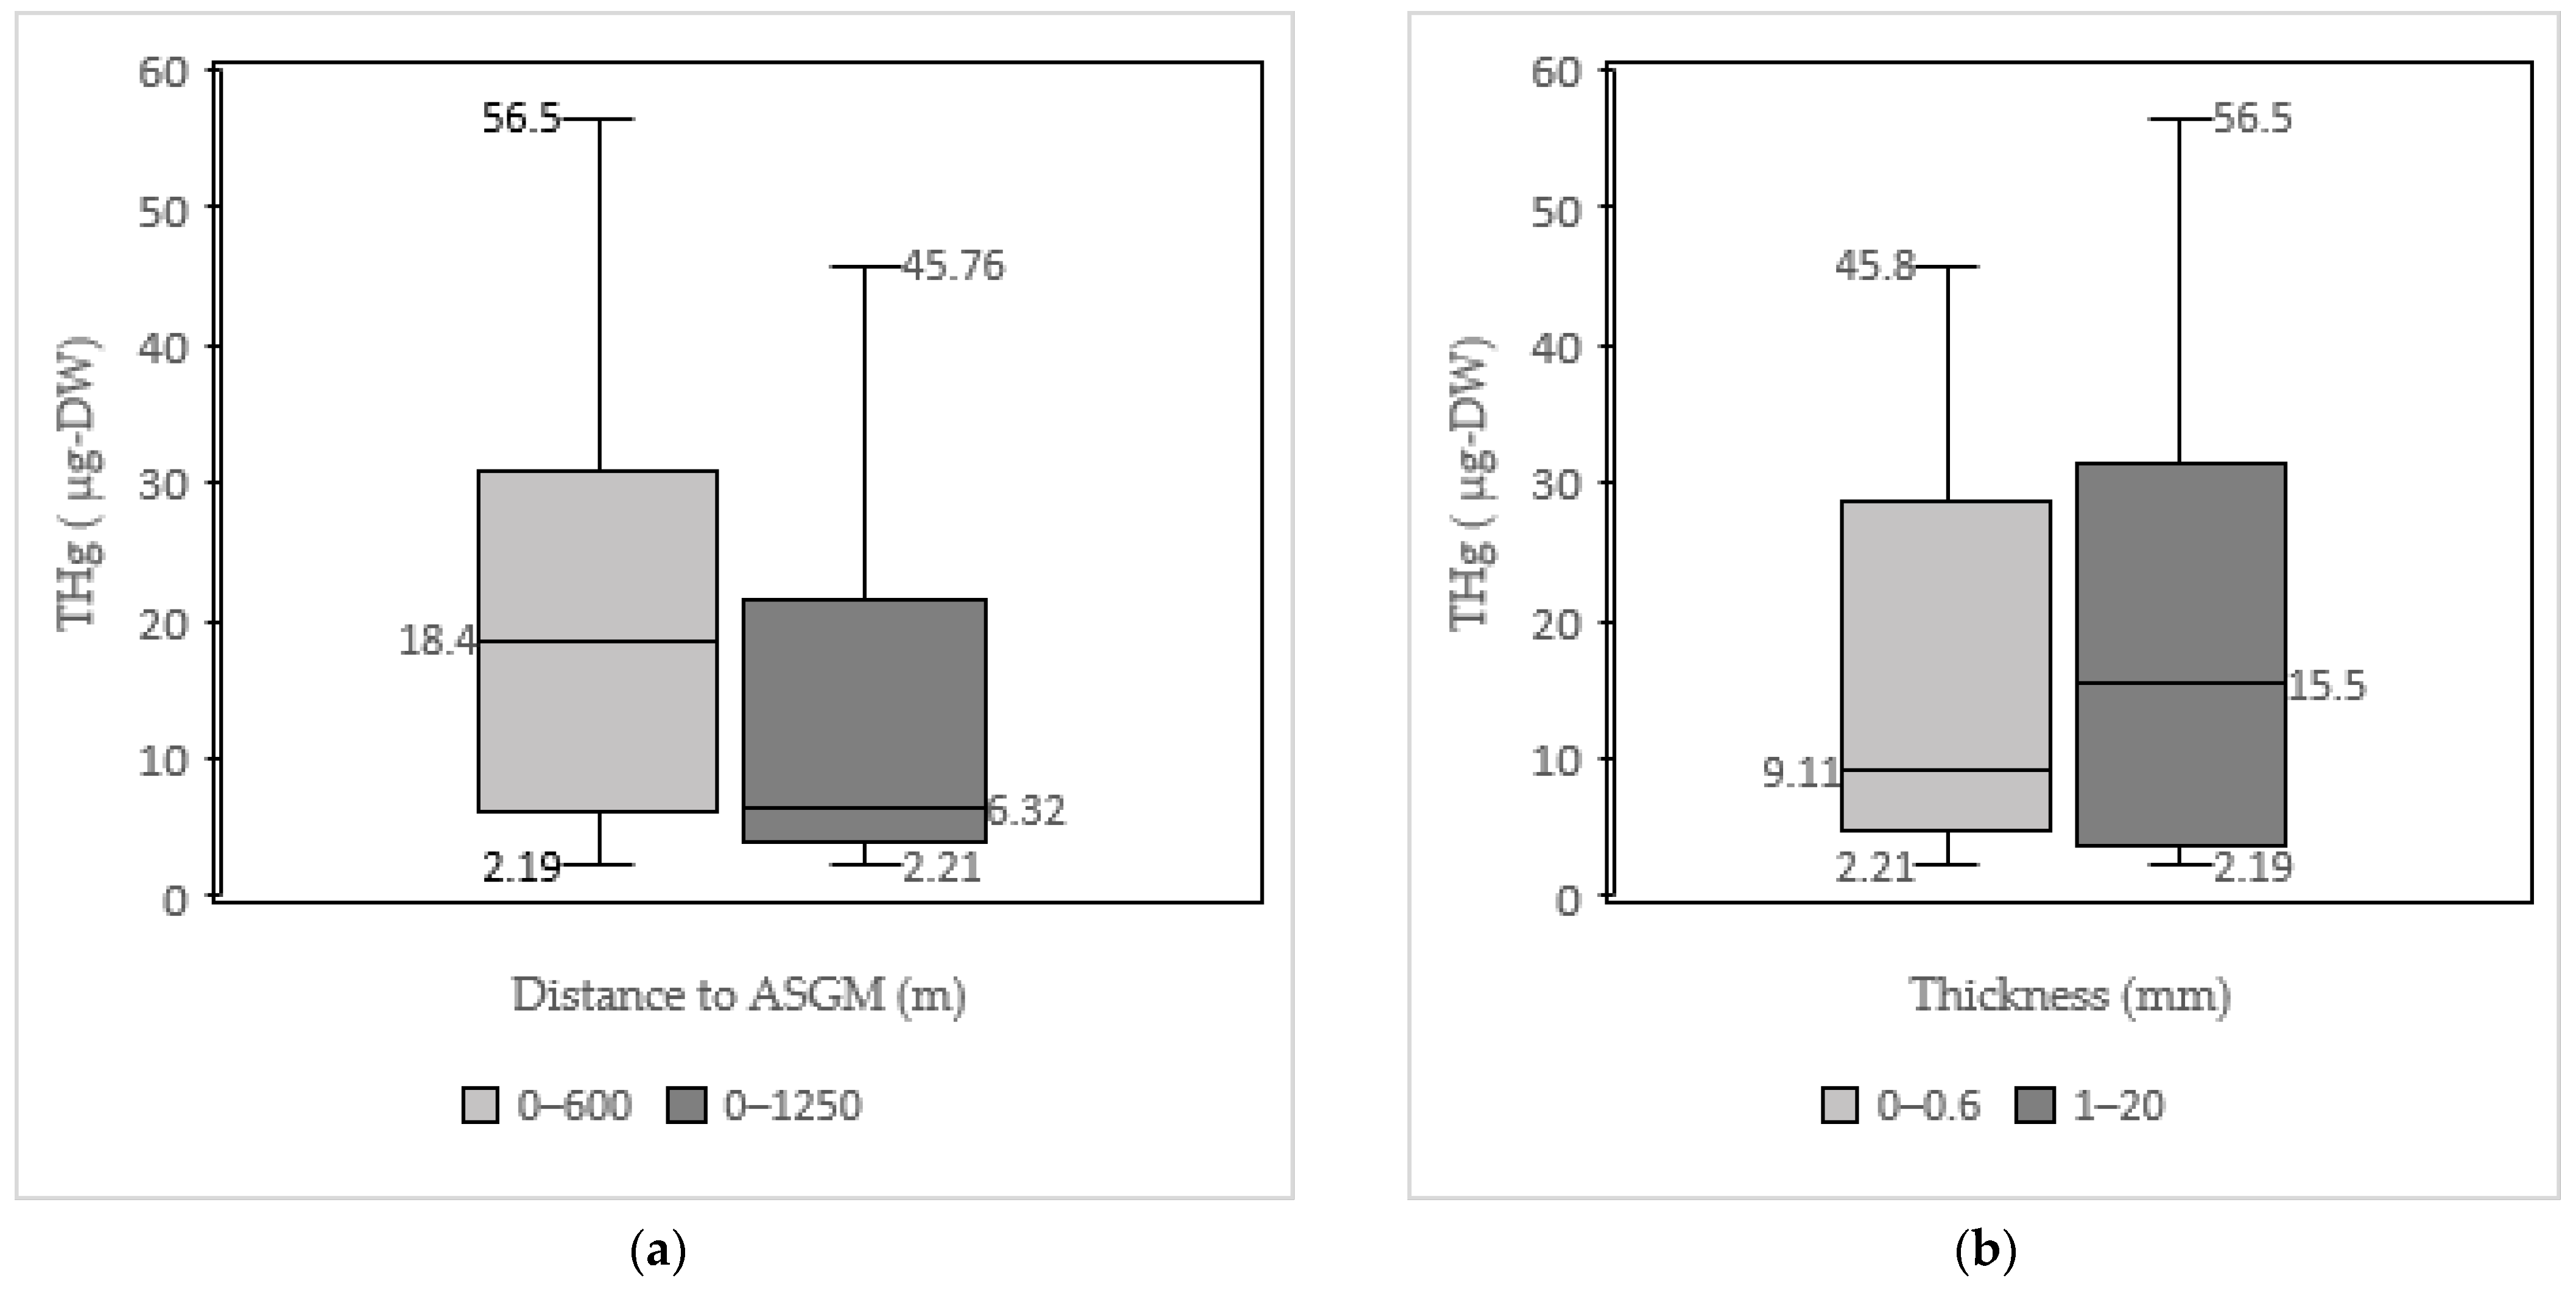

| No. | Name | CHg (µg/g) | THg (μg) | Bark Thickness (mm) | Elevation (m asl *) | Distance to Nearest ASGM (m) |
|---|---|---|---|---|---|---|
| 1 | C. pentandra 1 | 0.33 | 11.7 | 9.64 | 80 | 247 |
| Mean | 0.33 | 11.7 | 9.64 | 80 | 247 | |
| 2 | M. champaca 1 | 1.01 | 56.5 | 10.4 | 30 | 47 |
| Mean | 1.01 | 56.5 | 10.4 | 30 | 47 | |
| 3 | P. falcataria 1 | 0.34 | 2.19 | 5.66 | 310 | 580 |
| 4 | P. falcataria 2 | 0.20 | 4.24 | 19.5 | 240 | 619 |
| Mean | 0.27 | 3.21 | 12.6 | 275 | 600 | |
| 5 | P. acerifolium 1 | 0.37 | 23.2 | 9.74 | 200 | 223 |
| 6 | P. acerifolium 2 | 0.37 | 19.2 | 10.5 | 320 | 604 |
| Mean | 0.37 | 21.2 | 10.1 | 260 | 414 | |
| 7 | S. mahagoni 1 | 0.09 | 5.63 | 0.60 | 50 | 1215 |
| 8 | S. mahagoni 2 | 0.68 | 32.2 | 0.76 | 80 | 894 |
| 9 | S. mahagoni 3 | 0.14 | 5.97 | 0.56 | 110 | 982 |
| 10 | S. mahagoni 4 | 0.35 | 17.9 | 0.50 | 50 | 1069 |
| 11 | S. mahagoni 5 | 0.78 | 45.8 | 0.62 | 90 | 723 |
| 12 | S. mahagoni 6 | 0.53 | 33.5 | 0.80 | 60 | 233 |
| 13 | S. mahagoni 7 | 0.10 | 2.21 | 0.60 | 120 | 1250 |
| Mean | 0.38 | 20.5 | 0.63 | 80 | 909 | |
| 14 | T. grandis 1 | 0.20 | 6.66 | 0.48 | 30 | 985 |
| 15 | T. grandis 2 | 0.30 | 11.6 | 0.30 | 50 | 1111 |
| 16 | T. grandis 3 | 0.17 | 4.41 | 0.49 | 120 | 186 |
| 17 | T. grandis 4 | 0.48 | 17.7 | 0.48 | 80 | 607 |
| 18 | T. grandis 5 | 0.42 | 3.50 | 0.17 | 150 | 713 |
| Mean | 0.31 | 8.77 | 0.38 | 86 | 720 | |
| No. | Name | CHg (µg/g) | THg (μg) | Bark Thickness (mm) |
|---|---|---|---|---|
| 1 | M. champaca 1 | <0.0002 | <0.02 | 3.20 |
| 2 | M. champaca 2 | <0.0002 | <0.02 | 3.10 |
| 3 | M. champaca 3 | <0.0002 | <0.02 | 2.73 |
| 4 | A. cadamba 1 | <0.0002 | <0.02 | 4.38 |
| 5 | A. cadamba 2 | <0.0002 | <0.02 | 4.69 |
| 6 | A. cadamba 3 | <0.0002 | <0.02 | 4.05 |
| 7 | S. mahagoni 1 | <0.0002 | <0.02 | 10.60 |
| 8 | S. mahagoni 2 | <0.0002 | <0.02 | 8.89 |
| 9 | S. mahagoni 3 | <0.0002 | <0.02 | 5.45 |
| 10 | S. mahagoni 4 | 0.0120 | 0.26 | 12.40 |
| 11 | S. mahagoni 5 | <0.0002 | <0.02 | 6.70 |
Publisher’s Note: MDPI stays neutral with regard to jurisdictional claims in published maps and institutional affiliations. |
© 2022 by the authors. Licensee MDPI, Basel, Switzerland. This article is an open access article distributed under the terms and conditions of the Creative Commons Attribution (CC BY) license (https://creativecommons.org/licenses/by/4.0/).
Share and Cite
Taufiq, A.; Riniarti, M.; Widiastuti, E.L.; Prasetia, H.; Yuwono, S.B.; Asmarahman, C.; Rendra, T. Atmospheric Hg Levels in Tree Barks Due to Artisanal Small-Scale Gold Mining Activity in Bunut Seberang Village in Indonesia. Atmosphere 2022, 13, 633. https://doi.org/10.3390/atmos13040633
Taufiq A, Riniarti M, Widiastuti EL, Prasetia H, Yuwono SB, Asmarahman C, Rendra T. Atmospheric Hg Levels in Tree Barks Due to Artisanal Small-Scale Gold Mining Activity in Bunut Seberang Village in Indonesia. Atmosphere. 2022; 13(4):633. https://doi.org/10.3390/atmos13040633
Chicago/Turabian StyleTaufiq, Azhary, Melya Riniarti, Endang Linirin Widiastuti, Hendra Prasetia, Slamet Budi Yuwono, Ceng Asmarahman, and Tedy Rendra. 2022. "Atmospheric Hg Levels in Tree Barks Due to Artisanal Small-Scale Gold Mining Activity in Bunut Seberang Village in Indonesia" Atmosphere 13, no. 4: 633. https://doi.org/10.3390/atmos13040633
APA StyleTaufiq, A., Riniarti, M., Widiastuti, E. L., Prasetia, H., Yuwono, S. B., Asmarahman, C., & Rendra, T. (2022). Atmospheric Hg Levels in Tree Barks Due to Artisanal Small-Scale Gold Mining Activity in Bunut Seberang Village in Indonesia. Atmosphere, 13(4), 633. https://doi.org/10.3390/atmos13040633