Article

The Response Mechanism and Threshold of Spring Wheat to Rapid Drought

Key Laboratory of Arid Climatic Change and Disaster Reduction of Gansu Province/Key Laboratory of Arid Climate Change and Disaster Reduction of China Meteorological Administration (CMA), Lanzhou Institute of Arid Meteorology, CMA, Lanzhou 730020, China
*
Author to whom correspondence should be addressed.
Atmosphere 2022, 13(4), 596; https://doi.org/10.3390/atmos13040596
Submission received: 22 February 2022 / Revised: 1 April 2022 / Accepted: 5 April 2022 / Published: 7 April 2022
(This article belongs to the Topic Climate Change and Environmental Sustainability)

Abstract

:
In order to deeply understand the effect mechanism of rapid drought stress on the physiological and biochemical properties of crop leaves and determine drought thresholds, the potted spring wheat under two water treatments, adequate water supply and continuous drought stress, was researched. In the early stage of drought, the parameters of leaves decreased in the order of stomatal conductance (gs), intercellular CO2 concentration (Ci), maximum electron transfer rate (Jmax), mesophyll conductance (gm), photosynthetic rate (Pn,) leaf water content (LWC), triose phosphate utilization rate (TPU), transpiration rate (Tr), and maximum carboxylation rate (Vcmax). Photosynthesis was dominated by stomatal limitation and also limited by carboxylation and mesophyll limitation. The carboxylation limitation was mainly caused by the reduction of electron transport capacity. In the late stage of drought, stomatal limitation first decreased, and then mesophyll limitation decreased. During extreme drought, carboxylation limitation also decreased. With the decrease of relative soil moisture (RSM), except for Ci, which first decreased and then increased, other physicochemical parameters of leaves all showed an S-shaped, decreasing trend. Mild and severe drought thresholds were determined to be 56.6% and 43.6% of the RSM, respectively, according to the curve’s inflection point, corresponding to 16.6% and about 52.2% of the average initial decrease amplitude among all parameters. This will provide a reference for monitoring as well as an early warning of rapid drought in spring wheat.

1. Introduction

Drought is a recurring, complex, and extreme climatic phenomenon characterized by subnormal precipitation for months to years; it is one of the most serious constraints that prevents plants from attaining their full potential, particularly in arid and semi-arid regions, and it will have a negative impact on agricultural production [1,2,3]. At present, due to climate change, droughts grow concurrently in space and time [4]. Flash droughts which have garnered much attention in recent years, have the characteristics of sudden occurrence and short-term, rapid development. They are likely to cause huge damage to crops because it is difficult for crops to adapt to rapid changes in a short period of time during the sensitive developmental stages [5,6]. They can even lead to the occurrence of some compounded, extreme events with subsequent effects, such as an increased risk of wildfires, the depletion of water resources, decreased air quality, and food security issues [7]. However, due to insufficient relevant knowledge about them, most climate models fail to predict the occurrence of flash droughts early [8]. According to our past experience, a continuous drought formed in a potted, control experiment can make the soil water decrease quickly in about 7 days and reduce the photosynthetic rate to 0 from a normal level, which are characteristics similar to those of a flash drought. Therefore, this paper took the drought process as its research object, and defined it as rapid drought, so as to obtain a further understanding of flash drought.
Generally, for agricultural drought, the final yield loss is used as the fundamental basis to determine the onset of drought [9]. However, before yield is affected, a series of physiological and biochemical aspects of crops will have been affected. Neglecting them will lead to missing the opportunities to avoid the risks of damage to the plants when drought occurs. Therefore, by studying the parameters of leaf photosynthesis and water functional traits that respond to agricultural drought at its beginnings, the internal damage mechanism of agricultural drought can be more deeply understood. This is of great significance to crop production and management in arid habitats [10]. Therefore, some studies have analyzed the response mechanism of plant photosynthetic physiology and biochemistry to drought. It is believed that drought stress will cause a decrease in the net photosynthetic rate of plants, and the main reasons for the change of this physiological process include stomatal limitation and nonstomatal limitation [11] as there are two diffusion paths for CO2 during photosynthesis; that is, CO2 first enter the substomatal cavities inside the leaf from the atmosphere through the stomata, and then it diffuses from there to the carboxylation site inside the chloroplast stroma through the leaf mesophyll. Therefore, CO2 diffusion may be limited by the resistance of stomatal and mesophyll cell resistance when the plant is under environmental stress during photosynthesis [12]. In addition, some studies posit that the photosynthetic capacity of the chloroplast carboxylation site is related to carboxylation factors, such as 1,5-diphosphate ribulose carboxylase/oxygenase (Rubisco) activity and electron transport capacity, and the mechanisms of drought leading to a decrease in photosynthetic capacity are the result of a reduction in these two carboxylation factors [13,14]. Therefore, we can further divide the regulatory mechanism of photosynthesis into stomatal limitation, mesophyll limitation, and carboxylation limitation. Stomatal limitation and mesophyll limitation generally can be reflected by their reciprocals, stomatal conductance (gs) and mesophyll conductance (gm). Flexas et al. posit that gs and gm play an equally important role in limiting photosynthesis [15,16,17], and both of them are equally responsive to the external environment [18]. However, the magnitude of the regulatory effect of carboxylation limitation is currently unclear. In addition, little is known about how these three regulatory mechanisms cooperate to limit photosynthesis under different drought stages and what the response mechanism of leaf water physiology is to drought.
In addition to the need to explore the response mechanism, another problem in current drought research is the lack of indicator thresholds based on the internal damage process of crops. Drought indicators are the basis for drought monitoring and prediction [19,20], and a variety of indicators are currently used to monitor and warn of drought conditions [21]. Compared with other, existing agricultural drought indicators, the indicator of relative soil moisture (RSM) is simple, intuitive, and effective [22], and it is easy to observe for farmers, so it is used as a routine element for forecasting by the agricultural meteorological forecasters in China. Therefore, this paper has selected RSM as the drought indicator for analysis. When using drought indicators to determine drought intensity levels and issue disaster warnings, indicator thresholds play a crucial role. However, the drought onset threshold (i.e., the threshold of mild drought) of RSM in the traditional forecast may be determined by comprehensive experience, such as the morphology of the plants affected by drought and the degree of soil dryness. There is no clear statement of the determination criteria in National Standard of the People’s Republic of China—Grade of Agricultural Drought. Moreover, the thresholds of the drought intensity levels are obtained by equidistant division within the range that is less than a certain mild drought threshold, and they are not related to the degree of injury to the plants. Therefore, drought conditions determined according to this standard may lead to a failure to discover crops with internal physiological damaged in time, and the actual degree of internal injury is greater than expected.
As a kind of general drought, the rapid drought defined in this paper also presents the above-mentioned research problems, such as an unclear disaster mechanism and an unclear critical threshold. At the same time, most of the current, artificially controlled drought experiments, when setting water treatment, focus on maintaining a certain stable drought intensity during the study period, such as maintaining soil moisture at 60% (mild drought) and 30% (severe drought) of the field capacity [23,24]. Research on rapid drought as defined in this paper is rare. Rapid drought is characterized by the continuous decline of soil moisture, which makes it possible to complete the observation of a complete drought process. Therefore, this paper mainly studies the response of crops to the drought process of continuous water decreases in detail. In addition, the current method for determining the threshold value is usually to find the approximate position of the turning point where the relationship between the independent and dependent variable changes in the response scatter plot through visual observation [25]. This approach is obviously very subjective. Therefore, it is necessary to develop a method for objectively determining threshold values.
Based on the above deficiencies in previous studies, this paper takes the control experiment of spring wheat as an example, and focuses on the special drought process of rapid drought in order to achieve the following goals: (1) the qualitative and quantitative relationship between the physiological and biochemical parameters of spring wheat and soil moisture under rapid drought, and the corresponding drought thresholds; (2) the response mechanism of physiological and biochemical processes of spring wheat to rapid drought. This study will help to improve the ability to recognize the onset and severity of rapid drought and provide a reference for research on drought resistance and water saving in spring wheat.

2. Materials and Methods

2.1. Experiment Materials and Site

The experimental materials were the spring wheat varieties “Dingxi Xin 24” (at Dingxi Station) and “Yongliang 4” (at Wuwei Station). Pot experiments were carried out in these two sites (Figure 1), and the pots were placed in the field environment. Leaf physiology experiments in 2015 and leaf photosynthetic biochemical experiments in 2017 and 2021 were conducted at the Dingxi Arid Meteorology and Ecological Environment Field Science Experiment Base of the China Meteorological Administration (35°35′ N, 104°37′ E, altitude 1896.7 m). The base belongs to a semi-arid climate zone on the Loess Plateau. The annual average temperature is 6.7 °C. The annual rainfall is about 386 mm. The annual sunshine hours are 2500 h. The frost-free period is 140 days. The soil texture is loessial. The PH value is 7.8. The organic matter content is 110.7 g/kg. The average soil bulk density of 0–100 cm layers is 1.25 g/cm3, the field water holding capacity is 25.0%, and the withering humidity is 5.2%. Leaf physiology experiments in 2017 were conducted at the Wuwei Desert Ecology and Agricultural Meteorological Experiment Station of Gansu Province (37°53′ N, 102°53′ E, altitude 1534.8 m). The experimental station has an average annual temperature of 8.5 °C, annual precipitation of about 171 mm, annual sunshine hours of 2873 h, a frost-free period of 150 days, a soil texture of sandy loam, a pH value of 8.3, an organic matter content of 7g/kg, an average soil bulk density of 0–100 cm layers of 1.74 g/cm3, a field water holding capacity of 21.1%, and a withering humidity of 5.6%. The potting soil was taken from the 0-30 cm cultivated soil in the field, dried and sieved, mixed with fertilizer, and put into a bucket-shaped planting pot with a diameter of 29 cm and a depth of 45 cm. The weight of the dry soil and the bucket were respectively weighed and recorded.

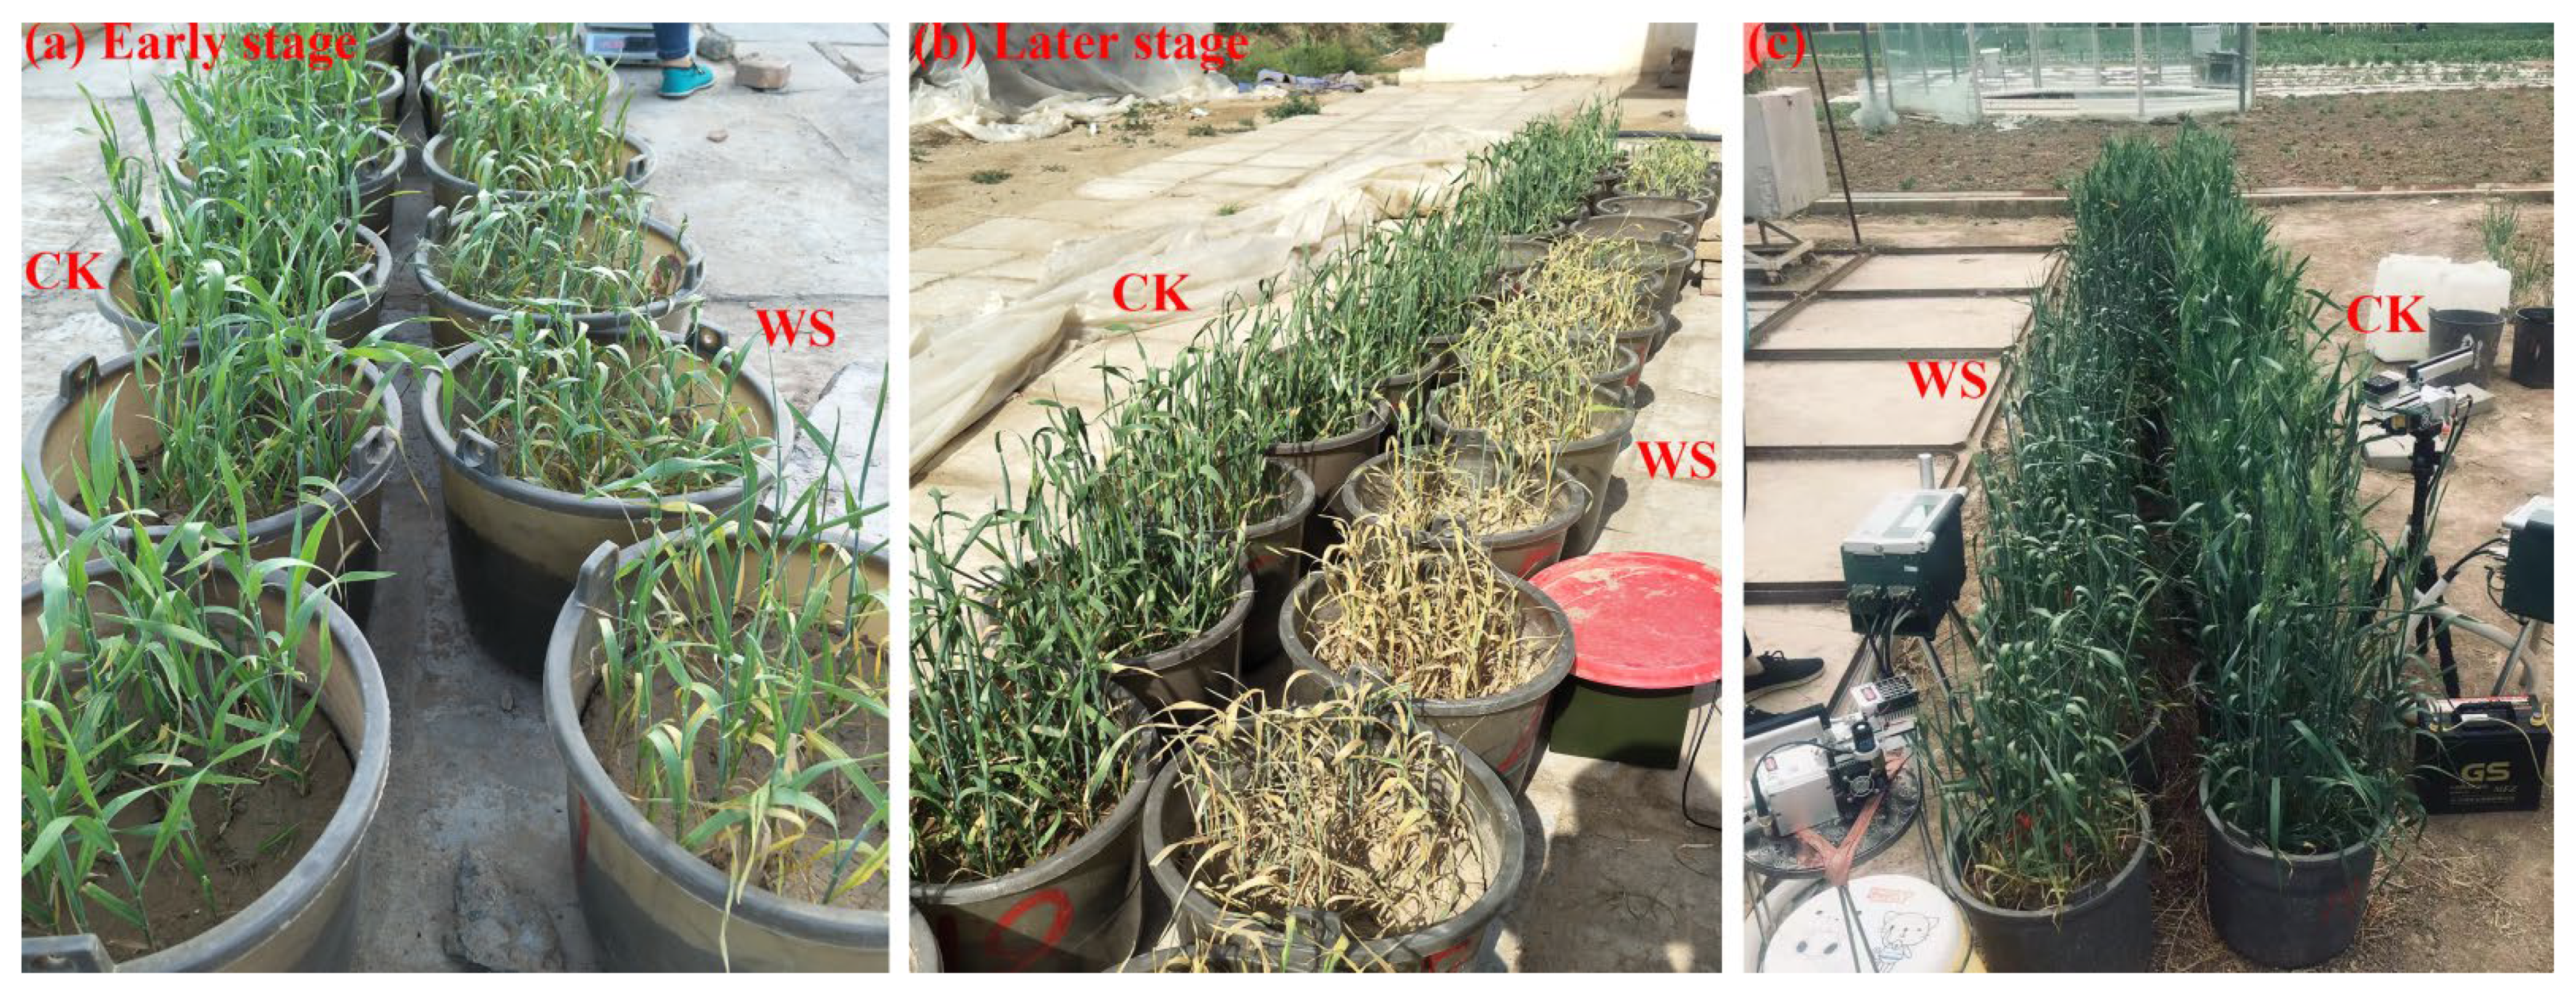
2.2. Experimental Design

Sowing was carried out in mid-March or late March of the experiment year. A quantity of 0.9 g seeds (about 30 grains) were evenly sown in each bucket, with a sowing depth of about 5 cm. During the early stage of growth, uniform and adequate watering was carried out until the critical period of water demand for spring wheat (joint to heading stage) in which the buckets should be weighed daily for water treatment. The specific two treatments were the control group (CK), in which the pots were irrigated every day until the relative soil moisture reached the field water holding capacity, and the continuous drought group (WS), in which the pots were kept un-watered after observation until the plants wilted or died (Figure 2). An electric canopy or plastic sheet was used to cover them from the rain automatically or manually. We set three repetitions for each treatment. Observation ended when the photosynthetic rate of the WS group approached 0. During the drought process, the change of RSM is shown in Figure 3.

2.3. Observation Content and Methods

The measurement of photosynthetic physiological parameters: The LI-6400 portable photosynthesis analyzer (Li-cor, Lincoln, USA) with red and blue LED-light sources was used. The photosynthetic parameters of the upper functional leaves were measured from 8:30 to 12:00 every morning. The leaves were induced for about 30 min before measurement. The photosynthetically active radiation (PAR) was set to 1500 μmol·m2·s1, the temperature was set to 25 °C, and the environmental CO2 concentration was set to 400 μmol·mol1. The obtained parameters included the photosynthetic rate (Pn), the transpiration rate (Tr), the stomatal conductance (gs), the intercellular CO2 concentration (Ci), etc.
The measurement of photosynthetic biochemical parameters: The LI-6400 portable photosynthesis analyzer with red and blue LED-light sources was used. The photosynthetic parameters of the upper functional leaves were measured from 8:30 to 12:00 every morning. The leaves were induced for about 30 min before measurement. The photosynthetically active radiation PAR was set to 1500 μmol·m2·s1, the temperature was set to 25 °C, and the CO2 concentration gradient in the sample chamber was set to 400, 200, 100, 50, 400, 600, 800, 1000, and 1200 μmol·mol1, to obtain the photosynthetic–intercellular CO2 concentration curve (ACi curve).
The calculation of photosynthetic biochemical parameters: The FvCB biochemical photosynthetic model was chosen to fit the ACi curve [26]. This model holds that the rate of carboxylation supported by ribulose-1,5-bisphosphate carboxylase/oxygenase (Rubisco), the rate of regeneration of ribulose-1,5-bisphosphate (RuBP) supported by electron transfer and the triose phosphate utilization rate (TPU), the lowest of the three biochemical process rates determines the leaf photosynthetic rate of C3 in the plant. By fitting the model using Equations (1)–(4), photosynthetic biochemical parameters, such as maximum carboxylation rate (Vcmax), maximum electron transfer rate (Jmax), and TPU can be obtained, as well as the carboxylation site CO2 concentration (Cc) corresponding to the Ci measurement points. The method of Gu et al. [27] was used for parameter estimation. This method supports that an ACi curve may actually have fewer restriction stages than the three submodels of FvCB. And it enumerates all of the possible restriction stage distributions for each curve, including (1) only those restricted by Rubisco, (2) only those restricted by RuBP regeneration, (3) only those restricted by TPU, (4) those restricted by Rubisco and RuBP successively, (5) those restricted by Rubisco and TPU successively, (6) those restricted by RuBP and TPU successively, (7) and those successively restricted by Rubisco, RuBP and TPU limits. Then, an overall fitting on the parameters of each distribution is performed, and an iterative algorithm of the hybrid of the gradient and nongradient approaches is used to minimize the objective function. The user can select the restricted stage distribution and estimated parameters with the optimal fitting effect. Compared with other estimation methods [28,29,30,31], this method is more objective and reasonable. Since the method provides six possible limiting stage distributions for each ACi curve on the website (https://www.leafweb.org/, on 27 September 2021), this study referred to the practice of Vincent et al. [32] and selected the model with the smallest sum of square error (SSE) between the predicted value and the measured value. When two SSEs were close, the one with fewer estimated parameters was selected to avoid as much excessive parameterization of the model as possible. The mesophyll conductance (gm) was obtained by Equation (5) according to Fick’s first law [29].
A = min { A c , A j , A p } R d
A c = V c max [ C c Γ C c + K c ( 1 + O / K o ) ]
A j = J C c Γ 4 C c + 8 Γ
A p = 3 T P U
C c = C i A g m
where A is the net CO2 assimilation rate: Ac, Aj and Ap are the net CO2 assimilation limited by Rubisco, RuBP, and TPU, respectively; Γ* is the CO2 compensation point in the absence of mitochondrial respiration; Kc and Ko are the Michaelis–Menten coefficient of Rubisco activity for CO2 and O2, respectively; Cc and O are the partial pressure of CO2 and O2 at Rubisco; J is the potential rate of electron transport that is dependent upon incident light irradiance; Ci is the partial pressure of CO2 in the intercellular air space; and gm is mesophyll conductance.
The calculation of relative soil moisture (RSM): The wet weight of the bucket was measured daily by a balance with an accuracy of 0.01 g. By using it and the dry soil weight measured at the beginning of the experiment and the soil physical and chemical property parameters measured previously, the daily RSM can be calculated by Equations (6) and (7):
R S M = θ θ f × 100 %
θ = W w W d W d × 100 %
where θ is the weight of the water content of the soil; θf is the field water holding capacity; Ww is the soil wet weight; and Wd is the soil dry weight.
The calculation of leaf water content (LWC): Three plant samples were taken from the pots every day. The leaves were cut off and weighed to obtain the fresh weight first. Then, they were put into an oven at 105 °C for 30 min and then dried at 80 °C to obtain the dry weight. Last, the can be calculated by Equation (8):
L W C = L f L d L f × 100 %
where Lf is leaf fresh weight and Ld is leaf dry weight.

2.4. Data Analysis

SPSS 19.0 software was used for one-way analysis of variance (one-way ANOVA) and multiple comparisons (LSD). Origin 9.0 was used for curve-fitting. MATLAB R2016 was used to obtain the two inflection points of the logistic curve. The first was the extreme point at the minimum curvature, which was obtained by using the diff() function to solve the second derivative. The second was at the maximum curvature, which was obtained by using the diff(), gradient(), and max() functions to obtain the curvature expression of the logistic curve and its maximum value.

3. Results

3.1. Response Characteristics of Spring Wheat Leaves to Rapid-Drought Stress

3.1.1. Response Characteristics of Photosynthetic Physiological Parameters of Spring Wheat Leaves to Drought Stress

The photosynthetic physiological parameters of spring wheat leaves are relatively stable when soil moisture is sufficient and fluctuates roughly around the average value (Figure 4). Under rapid-drought stress, Pn, Tr, and gs were relatively stable when the RSM was greater than 50%. Then, they all showed a “first fast and then slow” decreasing trend as RSM decreased. Their scatter plots in the whole interval from 100% to 0 RSM showed S-distributions. Ci was also relatively stable when RSM was greater than 50%, and then as RSM decreased, it showed a trend of “first decrease and then increase”. Its scatter plot roughly conformed to the cubic polynomial distribution in the interval from 100% to 0 RSM. The analysis of variance between CK and WS showed that the two sets of data for each parameter were significantly or extremely significantly different, indicating that rapid-drought stress has a significant impact on the leaf photosynthetic physiological parameters of spring wheat (Table 1). In addition, the phase difference of change in each parameter during the whole process of rapid drought development indicated that there are phased responses to rapid drought stress for the photosynthetic physiological parameters of spring wheat leaves, and there must be turning points between different response phases. The turning points would be used as the basis for determining the drought threshold of spring wheat.
According to the characteristic of scatter plot for each parameter (S-type or cubic polynomial type), logistic and cubic polynomial models were selected to fit the data of WS. The effects of the fitted curves are shown in the black solid lines in Figure 4, and the statistical results are shown in Table 2. It can be seen from adjusting the R2 and the F test that the fitting effects of Pn, Tr, and gs were good, and Ci was slightly inferior due to its discrete data (Figure 4d). However, the simulation curve trend of the second half of Ci was basically consistent with the response characteristics after entering the drought process. Therefore, the curve was still valid for determining the threshold.

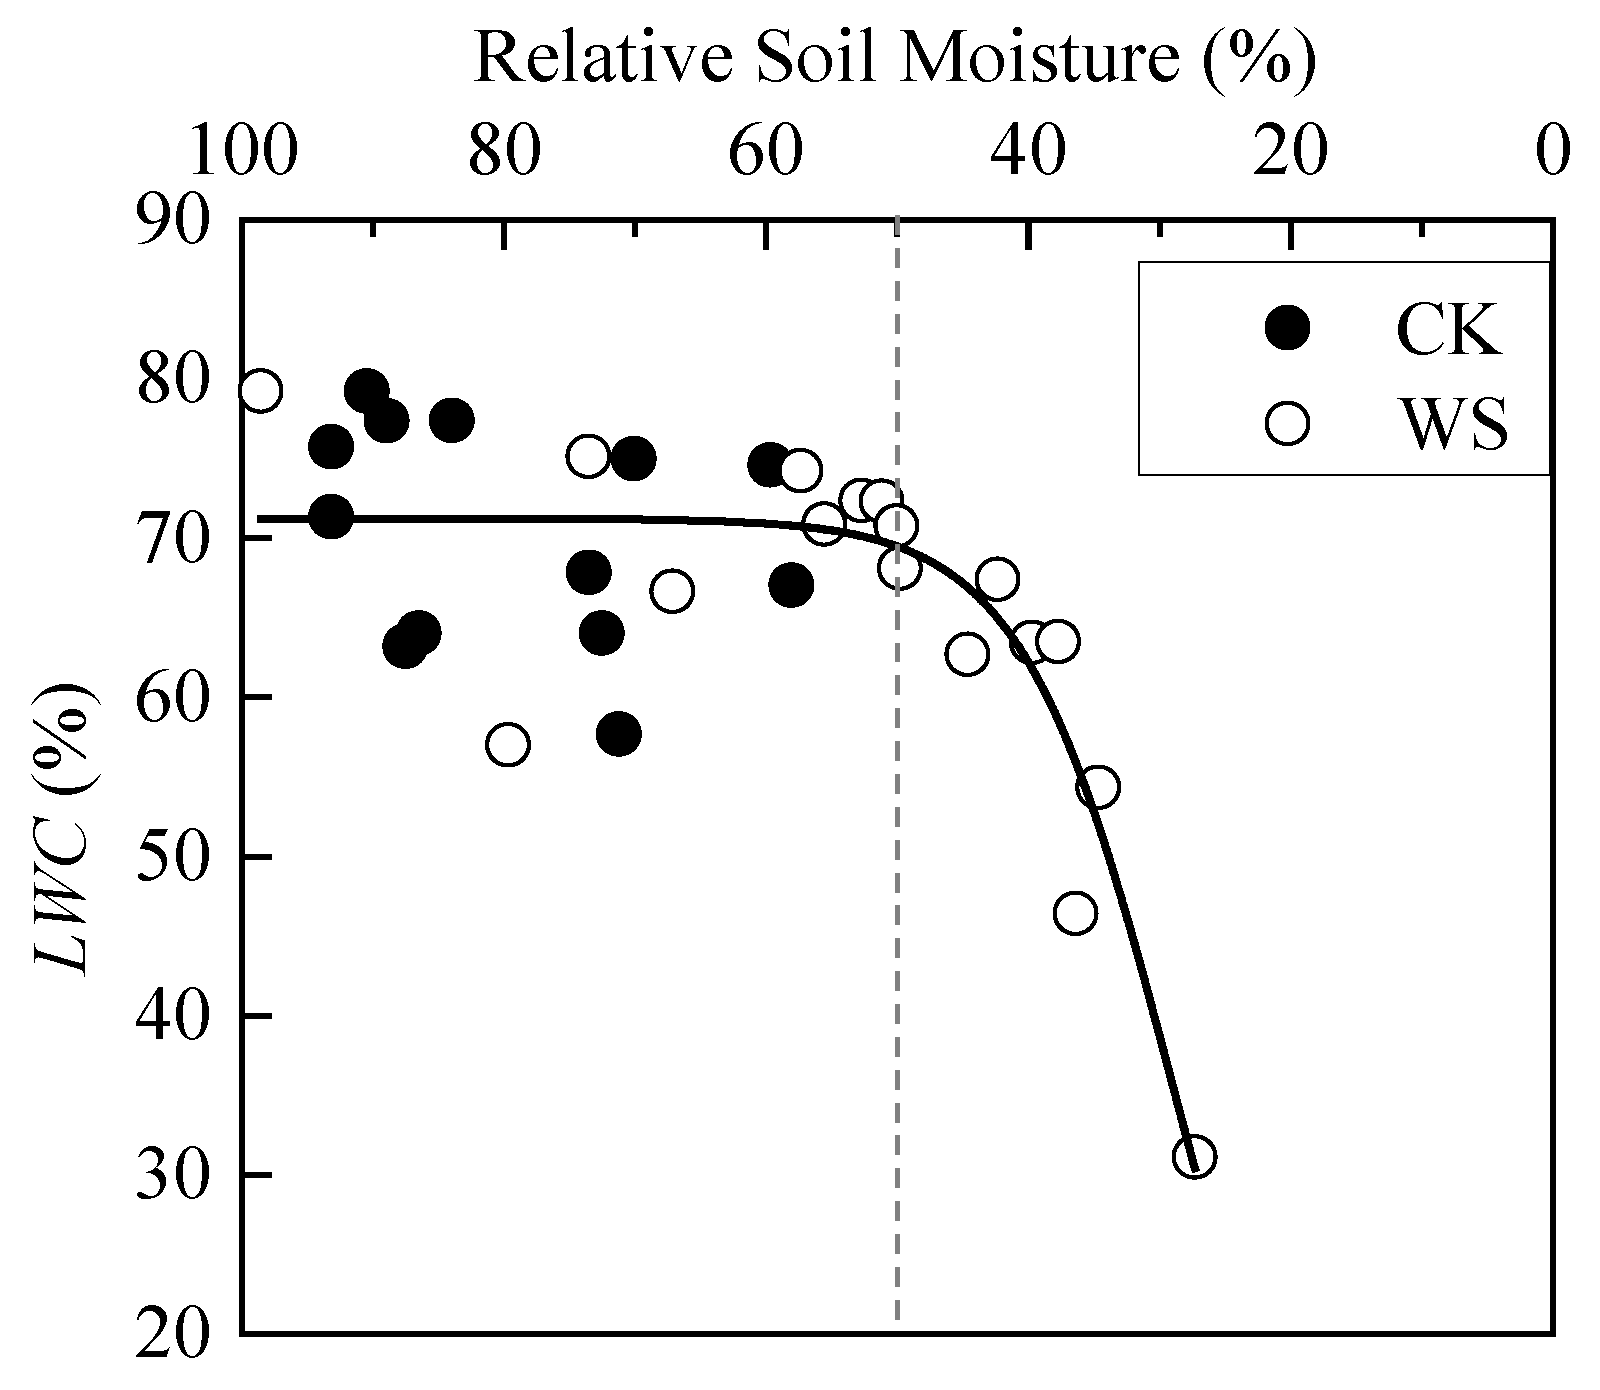
3.1.2. Response Characteristics of Water Physiological Parameters of Spring Wheat Leaves to Drought Stress

When the soil moisture was sufficient, LWC of spring wheat basically fluctuated around the average value. When RSM was less than 50%, rapid-drought stress made LWC show a rapid decrease trend. The scatter plot in the whole interval from 100% to 0 RSM basically matches the first half of the S-curve (Figure 5). The analysis of variance between CK and WS showed that their difference was not significant (Table 3). By analyzing Figure 5, the reason may be that there are relatively less data points when RSM is less than 50% than that is greater than 50% in WS. Therefore, the data of CK and WS were merged, and then divided into two groups according to the rough boundary of the scatter plot, RSM greater than 50% group and RSM less than 50% group. The difference between the new two groups was extremely significant (Table 3), indicating that rapid-drought stress significantly affects LWC of spring wheat. The logistic model was also used to fit LWC, and the fitting effect was good, as shown in Table 4.

3.1.3. Response Characteristics of Photosynthetic Biochemical Parameters of Spring Wheat Leaves to Drought Stress

Under rapid-drought stress, RSM also had a threshold effect on the photosynthetic biochemical parameters of spring wheat leaves. Before the RSM was about 50%, the parameter values fluctuated around the mean values Then, they decreased sharply after 50%. Finally, their decrease rates slowed down after a certain threshold. Their curves appeared overall as S-shapes (Figure 6). The difference of each parameter between CK and WS was extremely significant, indicating that rapid-drought stress also significantly affects the leaf photosynthetic biochemical parameters of spring wheat (Table 5). The logistic model was used to perform curve-fitting on each parameter, and the fitting effects were all good (Table 6).

3.2. Drought Threshold of Spring Wheat under Rapid-Drought Stress

Figure 4, Figure 5 and Figure 6 show that there are two “inflection points” in the changes of every leaf photosynthetic physiology, water physiology and photosynthetic biochemical parameter of spring wheat under rapid-drought stress. With the exception of Ci, the parameters experienced a “slow–fast–slow” reduction process from soil water sufficient to the end of the drought stress. According to the curve characteristics of the logistic model, the maximum curvature is the inflection point where the increase (or decrease) in speed changes from slow to faster, and the minimum curvature is the inflection point where the increase (or decrease) in speed changes from fast to slow. Therefore, these two points can be determined as the critical thresholds for mild and severe drought stress, respectively. By judging the approximate positions of the two inflection points of the curve, the calculation interval of x (i.e., RSM) was set. In addition, using MATLAB programming to obtain the x and y values at the maximum and minimum curvature of the logistic fitting curve, the corresponding drought hazard thresholds and disaster degrees could be obtained. The change of Ci in the range of 100%-0 RSM was a “slow–fast” decrease first and then an increase. Because the third-order polynomial did not adequately describe the change in the figure when soil moisture was sufficient (Figure 4), the minimum point of the third-order polynomial curve was found first and determined as the critical threshold of severe drought stress. Then, the first half of the drought group data with the sample points after the threshold removed were re-fit using the logistic model. In addition, the maximum curvature of the new fitting equation was calculated within the interval. The mild drought hazard threshold and the disaster degree of Ci could be obtained. The final drought thresholds of spring wheat under rapid-drought stress are shown in Table 7.
It can be seen from Table 7 that the maximum drought threshold of mild drought was determined by Ci, indicating that Ci is the most sensitive to drought, which is inconsistent with the opinion of ordinary scholars that gs is first affected by water stress [33]. It is speculated that the observation error is a little too large and may cause the poor fitting effect (adjusted R2 = 0.1). According to the other data in the “Mild Drought Thresholds” column in the table, it could be concluded that, when RSW dropped to 56.58%, the gs first began to decline rapidly, and rapid-drought stress occurred at this time. As the drought continued to develop, when RSM dropped to 53.3%, Jmax began to decline rapidly, and Ci also began to decline rapidly at a certain moment during this period. Then, as the soil moisture continued to decrease, gm, Pn, LWC, TPU, Tr, and Vcmax began to decline rapidly in turn. The drought threshold of mild drought ranged from 42.3% to 56.6% RSM. Accompanying this, the disaster degree of each parameter was the decreasing amplitude from 4.2% to 30.4%, with an average initial decreasing amplitude of 16.6%. The biggest drop occurred on gm, followed by Tr, and with that of LWC being the smallest. From the data column, “Severe Drought Thresholds”, it can be seen that, when RSM dropped to 43.6%, the rate of decrease of gs first began to slow. This indicated that the drought process entered the severe drought stage. The decline of gm also began to slow down when RSM dropped to 38.3%. After that, Ci, Pn, Tr, TPU, LWC, Vcmax, and Jmax started to slow down in turn. The drought threshold of severe drought ranged from 28.2 to 43.6% RSM. Accompanying this, the disaster degree of each parameter was the decreasing amplitude from 19.3% to 56.0%. The biggest drop still occurred on gm, followed by Vcmax, with Ci being the smallest. The average initial decreasing amplitude was 52.2% except for Ci.

4. Discussion

4.1. Response Characteristics and the Corresponding Thresholds of Spring Wheat under Rapid-Drought Stress

This paper found that the response characteristics of photosynthesis and water physiological and biochemical parameters of spring wheat leaves to rapid drought were basically the same. Except for Ci, which first decreased and then increased with the decrease of RSM, the other parameters showed an S-shaped, decreasing trend (Figure 4, Figure 5 and Figure 6). According to these response characteristics, a certain method can usually be used to determine the inflection points of the response characteristic fitting curve, and the values at these inflection points are the corresponding drought thresholds. The idea used in this paper to determine the inflection point was to take the extreme point, or the point at which the curvature changes, as the inflection point. The advantage of the threshold determined by this method is that it conforms to the actual response characteristic law and is more objective.
Under rapid-drought stress, the corresponding drought thresholds for each leaf physiological and biochemical parameter of spring wheat were different. The drought threshold referred to in this paper includes two parts. One is the drought threshold, which refers to the critical value of soil moisture under drought stress and is also called the soil drought threshold [9,34]. Before this threshold, crops can adapt to drought through self-regulation. The physiological processes will not be significantly affected, and the yield will not be reduced after rehydration. Once this threshold is exceeded, crops will be permanently damaged. The physiological indicators are difficult to recover even after normal rehydration, and the yield is significantly reduced. This is the basis of the adjusted deficit irrigation. This research considered that, when RSM was greater than 56.6%, the soil moisture content was suitable. When it dropped to 56.6%, the first physiological and biochemical parameter—gs —began to decrease rapidly. This is the onset signal of drought. Therefore, 56.6% was defined as the mild drought threshold of the whole drought process (Table 7). In addition, other leaf physicochemical parameters also began to decline rapidly one after another afterwards. The crop would show the signs of drought. With the development of drought, when RSM dropped to 43.6%, the decline rate of the first physiological and biochemical parameter—gs—slowed down first and it was then followed by other leaf physicochemical parameters in turn. At that time, it indicated that the internal physiology of the crop had entered the stage of severe drought, so the soil moisture threshold at this time was defined as the severe drought threshold of the whole drought process. Another part of the drought threshold is the disaster degree threshold, which refers to the degree of impact on crops when soil moisture is insufficient. A temperate soil moisture deficit did not necessarily reduce yield, but it could cause a decrease in leaf physicochemical indicators. Mild drought could cause an average initial decreasing amplitude of 16.6% among all parameters covered in this paper. Under severe drought, the water deficit caused an initial decreasing amplitude of about 52.2% on average among all parameters.
The drought indicators proposed in this paper can provide a certain basis for drought monitoring. However, there are uncertainties in using changes in physicochemical indicators to determine drought conditions. There are significant differences between different genotypes and the external environment, such as soil types [34,35,36], which make it difficult to determine a single “best” drought threshold. In addition, the impact of drought should occur within a threshold range [21]. Therefore, the drought thresholds given in this paper were based on different soil types in two regions and may have a certain degree of variability. Therefore, follow-up experiments can be used as supplements for verification. In addition, this study posited that LWC would not decrease when the drought occurred and would decrease rapidly only when RSM was lower than 45.3%, with the decrease rate at only 4.2%, which indicates that LWC is not a sensitive water physiological index for spring wheat to respond to drought. There is a study showing that plant leaf water potential responded better to water stress [37], and there is always a good correlation between leaf water potential and stomatal conductance, even under drought stress [38]. However, there is another study that points out that when soil evapotranspiration water is reduced to 40–50%, the leaf water potential of cotton just begins to change [34]. Due to the lack of leaf water potential data in this study, it could not be discussed here, and a relative study should be performed subsequently.

4.2. Physiological and Biochemical Response Mechanism of Spring Wheat to Rapid Drought

The mechanism in physiology refers to the process and mechanism of various physiological activities, which means that it includes two aspects: (1) the changes in the state of physiological functions; (2) the reasons for these changes. When rapid-drought stress occurs, the physiological and biochemical traits of spring wheat leaves have different response mechanisms in the two stages of mild drought and severe drought. In mild drought, gs was the most sensitive to rapid drought (Table 7). As soon as the water deficit occurred, stomatal resistance increased rapidly [39], which could have resulted in a decrease in Ci [33]. In addition, other leaf physicochemical traits also decreased successively. The leaf photosynthetic capacity parameter Jmax first decreased rapidly, and then gm decreased. Under drought stress, the gm of the plants decreased [40], possibly due to altered carbonic anhydrase (CA) activity, decreased chloroplast area facing the intercellular space (Sc) due to chloroplast shrinkage, decreased aquaporin activity, or thickening cell walls [41,42,43,44,45], which cause intracellular CO2 diffusion resistance to increase and CO2 reaching the carboxylation site of the chloroplast to decrease. Under the combined effect of the above reasons, Pn began to decrease rapidly. Studies have pointed out that drought generally reduces the biochemical capacity of carbon assimilation and utilization, and changes in cellular carbon metabolism may occur early in the process of drought dehydration [38], which is consistent with the results of this study. The above conclusions indicate that mesophyll limitation and carboxylation limitation have different response times to the drought process. Thus, strictly speaking, they should not be classified as nonstomatal limitations for analysis according to the traditional method [46]. Ultimately, it can be concluded that photosynthesis is jointly regulated by three limiting effects during the mild drought stage of rapid drought. Initially, the stomatal limitation was dominant, and then the carboxylation limitation and mesophyll limitation appeared in turn. Under their combined action, Pn decreased. The carboxylation limitation of Pn was caused by the decrease in electron transport capacity, which may be related to the change in the content of electron transport components [28]. After that, LWC also began to decrease, and the water loss rate of the leaves accelerated, which was mainly caused by the decrease in the root water uptake. Then, the second photosynthetic capacity parameter TPU decreased, and the mild drought stage ended.
When rapid drought developed to the stage of severe drought, gs was still the first to respond. The limitation of stomata began to decrease, and photosynthesis was mainly limited by carboxylation and mesophyll. After that, Tr and Vcmax entered the rapid decline stage; that is, severe drought will cause excessive transpirational water loss and a decrease in Vcmax. Studies have shown that when available water is limited, the ability to avoid dehydration is a drought-resistance mechanism [47], stomata close to prevent water loss via transpiration [48], and at the same time, carboxylation capacity is decreased due to reduced Rubisco enzyme activity [49]. These may be all associated with the self-protection mechanism of crops under drought stress. The above also corroborates the statement in related studies that “mild drought leads to restricted RuBP regeneration, whereas impaired Rubisco activity is the result of severe long-term drought” [50]. Afterwards, the mesophyll limitation decreased resulting in the CO2 diffusion capacity increasing, and the photosynthesis was dominated by carboxylation limitation. Due to the reduced activity of Rubisco enzyme and the limited carboxylation ability, Ci began to slowly enrich and increase. Then, the decrease rate of Pn decelerated due to the reduction of stomatal limitation and mesophyll limitation, and the deceleration of Tr also slowed down due to the deceleration of gs and the reduction of water available in the plant. The decreased rate of TPU then slowed down, meaning that the carboxylation limit also began to decrease. After this, because the water content in the plant was already quite small, the rate of LWC decline began to slow down. Finally, the photosynthetic organs were severely damaged and lost control of carbon assimilation, leading to the decrease rate of Vcmax and Jmax also slowing down and the carboxylation limitation of photosynthesis further reducing. In general, under mild to moderate water stress, the decrease of photosynthesis is due to stomatal closure and decreased Ci (i.e., stomatal limitation) or reduced gm (i.e., mesophyll limitation) reducing CO2 concentration in chloroplasts, but under more severe stress, metabolic (ATP generation, Rubisco enzyme activity, etc.) impairment (i.e., carboxylation limitation) predominates [51].

4.3. Uncertainties in Research

An A-Ci curve and a photosynthesis model are important for developing prediction models of plant CO2 assimilation, which can assess the impact of stresses and climate change on photosynthesis. Photosynthetic biochemical parameters are used in ecosystem and surface models and are critical to simulating the responses of terrestrial carbon and water cycles to environmental changes at different spatial and temporal scales [12,52,53]. The FvCB photosynthetic model of C3 plants proposed by Farquhar et al. [26] can simulate the A-Ci curve under different environmental conditions and obtain photosynthetic biochemical parameters that reflect the photosynthetic capacity of leaves. Therefore, it can predict the internal changes of the photosynthetic system of plant leaves [54,55], and is an extremely important tool in the study of photosynthetic physiology and ecology. This model does not simply describe the quantitative relationship between photosynthetic rate and environmental factors, but it also quantifies the internal photosynthetic physiological and biochemical characteristics of plant leaves. Therefore, we can more clearly understand the changing mechanism of plant net photosynthetic characteristics under drought stress by it [52]. However, for a given A-Ci curve, the FvCB model is structurally over-parameterized [27], which means that no matter how dense and precise the data points of an A-Ci curve are, there is no way to effectively estimate all parameters through model fitting. Therefore, some of the unknown parameters need to be preset empirically [55,56]. This leads to multiple solutions in using the curve-fitting method to estimate photosynthetic biochemical parameters, and it brings certain uncertainty to the research results.
gm is considered to be a key link in crop improvement [57] and an important parameter for evaluating crop water use traits [58]. However, it still cannot be directly measured at present, and it can only be indirectly determined relying on photosynthesis models by three methods. The first is the curve-fitting method used in this paper. On the one hand, it has the disadvantage of multiple solutions. On the other hand, the gm scatter plot obtained in this study (Figure 6) showed that the degree of dispersion was a little big when the soil moisture was sufficient, indicating that the estimation results obtained by the method may be not reliable enough. Therefore, the parameter estimation method still needs to be improved. The second method is the instantaneous carbon isotope (13CO2) discrimination method [59]. The accuracy of the results of this method has been improved. However, it has 3 disadvantages, high requirements on experimental equipment, complex determination process, and poor sensitivity to experimental errors. The third method is the combination method of gas exchange and chlorophyll fluorescence [60]. This method is more feasible and reliable and is more conducive to the observation and analysis of large samples with multiple processing and repetitions. However, it also has some limitations. One of them is the way to choose a reasonable gas flowrate between improving the accuracy of chlorophyll fluorescence parameters and reducing the risk of gas leakage. Because of the uncertainty of the gm estimation method, the optimization and improvement of the measurement method will be the focus of future research.

5. Conclusions

Under rapid-drought stress, with the decrease of RSM, the Ci response characteristics of spring wheat leaves was to decrease first and then to increase, and the other leaf physicochemical parameters showed S-shaped, decreasing trends. There was no drought when RSM > 56.6%, mild drought when 56.6% > RSM > 43.6%, and severe drought when RSM < 43.6%. Mild drought caused an average initial decrease amplitude of 16.6% among all parameters, and severe drought caused about 52.2%. The response mechanism of spring wheat to rapid drought can be summarized as follows: In the early stage of drought, the physiological and biochemical parameters of leaves decreased in the order of gs, Ci, Jmax, gm, Pn, LWC, TPU, Tr, and Vcmax. Stomatal limitation, mesophyll limitation, and carboxylation limitation coordinately regulate the photosynthetic process. Photosynthesis was dominated by the stomatal limitation at the early stage of drought and also limited by carboxylation limitation and mesophyll limitation later. The carboxylation limitation was mainly caused by the reduction of electron transport capacity. At the later stage of drought, the stomatal limitation of photosynthesis decreased first, then the mesophyll limitation decreased, and Ci increased slowly. At this time, Pn was mainly limited by carboxylation only, so its decrease rate slowed down. With the reduction of available water in the plant, the decrease rate of Tr and LWC also slowed down. In addition, the decrease rates of TPU, Vcmax, and Jmax also slowed down in the end, which means that the carboxylation limitation of photosynthesis was eventually reduced by the severely damaged photosynthetic organ.

Author Contributions

Writing—original draft preparation, writing—review and editing, investigation, conceptualization, and methodology: F.C.; funding acquisition: R.W. and H.W.; methodology, writing—review and editing: F.Z.; investigation: Y.Q., G.T. and Y.Y.; supervision: K.Z. and H.Z. All authors have read and agreed to the published version of the manuscript.

Funding

This research was funded by the Natural Science Foundation of Gansu Province (grant number 21JR7RA700) and the National Natural Science Foundation of China (grant numbers 42175192, 41775107, 41775105, 41975151, and 41975111).

Institutional Review Board Statement

Not applicable.

Informed Consent Statement

Not applicable.

Data Availability Statement

Information and data used in the study will be provided upon reasonable request.

Acknowledgments

We would like to thank the technicians of Dingxi Station and Wuwei Station, Wei Wanlin, Cheng Qian, Yang Hua, Jiang Jufang, and Ding Wenkui, for their assistance with the experiment.

Conflicts of Interest

The authors declare no conflict of interest.

References

  1. Orimoloye, I.R.; Belle, J.A.; Orimoloye, Y.M.; Olusola, A.O.; Ololade, O.O. Drought: A common environmental disaster. Atmosphere 2022, 13, 111. [Google Scholar] [CrossRef]
  2. Chatterjee, S.; Desai, A.R.; Zhu, J.; Townsend, P.A.; Huang, J. Soil moisture as an essential component for delineating and forecasting agricultural rather than meteorological drought. Remote Sens. Environ. 2022, 269, 112833. [Google Scholar] [CrossRef]
  3. Zhao, D.; Zhao, X.; Khongnawang, T.; Arshad, M.; Triantafilis, J.A. Vis-NIR Spectral Library to Predict Clay in Australian Cotton Growing Soil. Soil Sci. Soc. Am. J. 2018, 82, 1347–1357. [Google Scholar] [CrossRef]
  4. Zhao, B.; Yang, D.; Yang, S.; Santisirisomboon, J. Spatiotemporal characteristics of droughts and their propagation during the past 67 years in Northern Thailand. Atmosphere 2022, 13, 277. [Google Scholar] [CrossRef]
  5. Otkin, J.A.; Anderson, M.C.; Hain, C.; Mladenova, I.E.; Basara, J.B.; Svoboda, M. Examining rapid onset drought development using the thermal infrared-based evaporative stress index. J. Hydrometeorol. 2013, 14, 1057–1074. [Google Scholar] [CrossRef]
  6. Jin, C.; Luo, X.; Xiao, X.; Dong, J.; Li, X.; Feng, Z.; Yang, J.; Zhao, D. The 2012 flash drought threatened US Midwest agroecosystems. Chin. Geogr. Sci. 2019, 29, 768–783. [Google Scholar] [CrossRef] [Green Version]
  7. Christian, J.I.; Basara, J.B.; Hunt, E.D.; Otkin, J.A.; Furtado, J.C.; Mishra, V.; Xiao, X.; Randall, R.M. Global distribution, trends, and drivers of flash drought occurrence. Nat. Commun. 2021, 12, 6330. [Google Scholar] [CrossRef]
  8. Hoerling, M.; Eischeid, J.; Kumar, A.; Leung, R.; Mariotti, A.; Mo, K.; Schubert, S.; Seager, R. Causes and predictability of the 2012 Great Plains drought. Bull. Am. Meteorol. Soc. 2014, 95, 269–282. [Google Scholar] [CrossRef] [Green Version]
  9. Soltania, A.; Khooie, F.R.; Ghassemi-Golezani, K.; Moghaddam, M. Thresholds for chickpea leaf expansion and transpiration response to soil water deficit. Field Crops Res. 2000, 68, 205–210. [Google Scholar] [CrossRef]
  10. Yonemura, S.; Kodama, N.; Taniguchi, Y.; Ikawa, H.; Adachi, S.; Hanba, Y.T. A high-performance system of multiple gas-exchange chambers with a laser spectrometer to estimate leaf photosynthesis, stomatal conductance, and mesophyll conductance. J. Plant Res. 2019, 132, 705–718. [Google Scholar] [CrossRef]
  11. Ashraf, M.; Harris, P.J.C. Photosynthesis under stressful environments: An overview. Photosynthetica 2013, 51, 163–190. [Google Scholar] [CrossRef]
  12. Flexas, J.; Ribas-Carbó, M.; Diaz-Espejo, A.; Galmés, J.; Medrano, H. Mesophyll conductance to CO2: Current knowledge and future prospects. Plant Cell Environ. 2008, 31, 602–621. [Google Scholar] [CrossRef]
  13. Epron, D.; Dreyer, E. Effects of severe dehydration on leaf photosynthesis in Quercus petraea (Matt.) Liebl.: Photosystem II efficiency, photochemical and nonphotochemical fluorescence quenching and electrolyte leakage. Tree Physiol. 1992, 10, 273–284. [Google Scholar] [CrossRef] [PubMed]
  14. Parry, M.A.J.; Andralojc, P.J.; Khan, S.; Lea, P.J.; Keys, A.J. Rubisco activity: Effect of drought stress. Ann. Bot. 2002, 89, 833–839. [Google Scholar] [CrossRef] [Green Version]
  15. Miyazawa, S.I.; Yoshimura, S.; Shinzaki, Y.; Maeshima, M.; Miyake, C. Relationship between mesophyll CO2 gas diffusion conductance and leaf plasma-membrane-type aquaporin contents in tobacco plants grown under drought conditions. Photosynthesis 2008, 91, 805–808. [Google Scholar]
  16. Han, J.; Meng, H.; Wang, S.; Jiang, C.; Liu, F.; Zhang, W.; Zhang, Y. Variability of mesophyll conductance and its relationship with water use efficiency in cotton leaves under drought pretreatment. J. Plant Physiol. 2016, 194, 61–71. [Google Scholar] [CrossRef] [PubMed]
  17. Flexas, J.; Barbour, M.M.; Brendel, O.; Cabrera, H.M.; Carriquí, M.; Díaz-Espejo, A.; Douthe, C.; Dreyer, E.; Ferrio, J.P.; Gago, J.; et al. Mesophyll diffusion conductance to CO2: An unappreciated central player in photosynthesis. Plant Sci. 2012, 193–194, 70–84. [Google Scholar] [CrossRef] [PubMed]
  18. Centritto, M.; Loreto, F.; Chartzoulakis, K. The use of low [CO2] to estimate diffusional and non-diffusional limitations of photosynthetic capacity of salt-stressed olive saplings. Plant Cell Environ. 2003, 26, 585–594. [Google Scholar] [CrossRef]
  19. Dai, A. Increasing drought under global warming in observations and models. Nat. Clim. Chang. 2013, 3, 52–58. [Google Scholar] [CrossRef]
  20. Sheffield, J.; Wood, E.F.; Chaney, N.; Guan, K.; Sadri, S.; Yuan, X.; Olang, L.; Amani, A.; Ali, A.; Demuth, S.; et al. A drought monitoring and forecasting system for sub-sahara African water resources and food security. Bull. Am. Meteorol. Soc. 2014, 95, 861–882. [Google Scholar] [CrossRef]
  21. Bachmair, S.; Kohn, I.; Stahl, K. Exploring the link between drought indicators and impacts. Nat. Hazards Earth Syst. Sci. 2015, 15, 1381–1397. [Google Scholar] [CrossRef] [Green Version]
  22. Christa, D.P.; David, M.M.; Lu, S.; Dennis, P.L.; Pierre, G.; Michael, B. Advances in land surface models and indicators for drought monitoring and prediction. Bull. Am. Meteorol. Soc. 2021, 102, 1099–1122. [Google Scholar]
  23. Imakumbili, M.L.E.; Semu, E.; Semoka, J.M.R.; Abass, A.; Mkamilo, G. Managing cassava growth on nutrient poor soils under different water stress conditions. Heliyon 2021, 7, e07331. [Google Scholar] [CrossRef]
  24. AL-Quraan, N.A.; AL-Ajlouni, Z.I.; Qawasma, N.F. Physiological and biochemical characterization of the GABA shunt pathway in pea (Pisum sativum L.) seedlings under drought stress. Horticulturae 2021, 7, 125. [Google Scholar] [CrossRef]
  25. Maggio, A.; Raimondi, G.; Martino, A.; Pascale, S.D. Salt stress response in tomato beyond the salinity tolerance threshold. Environ. Exp. Bot. 2007, 59, 276–282. [Google Scholar] [CrossRef]
  26. Farquhar, G.D.; von Caemmerer, S.; Berry, J.A. A biochemical model of photosynthetic CO2 assimilation in leaves of C3 species. Planta 1980, 149, 78–90. [Google Scholar] [CrossRef] [PubMed] [Green Version]
  27. Gu, L.; Pallardy, S.G.; Tu, K.; Law, B.E.; Wullschleger, S.D. Reliable estimation of biochemical parameters from C3 leaf photosynthesis-intercellular carbon dioxide response curves. Plant Cell Environ. 2010, 33, 1852–1874. [Google Scholar] [CrossRef]
  28. Harley, P.C.; Thomas, R.B.; Reynolds, J.F.; Strain, B.R. Modelling photosynthesis of cotton grown in elevated CO2. Plant Cell Environ. 1992, 15, 271–282. [Google Scholar] [CrossRef]
  29. Sharkey, T.D.; Bernacchi, C.J.; Farquhar, G.D.; Singsaas, E.L. Fitting photosynthetic carbon dioxide response curves for C3 leaves. Plant Cell Environ. 2007, 30, 1035–1040. [Google Scholar] [CrossRef]
  30. Su, Y.; Zhu, G.; Miao, Z.; Feng, Q.; Chang, Z. Estimation of parameters of a biochemically based model of photosynthesis using a genetic algorithm. Plant Cell Environ. 2009, 32, 1710–1723. [Google Scholar] [CrossRef]
  31. Feng, X.; Dietze, M. Scale dependence in the effects of leaf ecophysiological traits on photosynthesis: Bayesian parameterization of photosynthesis models. New Phytol. 2013, 200, 1132–1144. [Google Scholar] [CrossRef] [PubMed]
  32. Vincent, C.; Schaffer, B.; Rowland, D. Water-deficit priming of papaya reduces high-light stress through oxidation avoidance rather than anti-oxidant activity. Environ. Exp. Bot. 2018, 156, 106–119. [Google Scholar] [CrossRef]
  33. Tcherkez, G.; Bligny, R.; Gout, E.; Mahe, A.; Hodges, M.; Cornic, G. Respiratory metabolism of illuminated leaves depends on CO2 and O2 conditions. Proc. Natl. Acad. Sci. USA 2008, 105, 797–802. [Google Scholar] [CrossRef] [PubMed] [Green Version]
  34. Lacape, M.J.; Wery, J.; Annerose, D.J.M. Relationships between plant and soil water status in five field-grown cotton (Gossypium hirsutum L.) cultivars. Field Crops Res. 1998, 57, 29–43. [Google Scholar] [CrossRef]
  35. Flexasa, J.; Bota, J.; Escalona, J.M.; Sampol, B.; Medrano, H. Effects of drought on photosynthesis in grapevines under field conditions: An evaluation of stomatal and mesophyll limitations. Funct. Plant Biol. 2002, 29, 461–471. [Google Scholar] [CrossRef] [Green Version]
  36. Zhao, D.; Li, N.; Zare, E.; Wang, J.; Triantafilis, J. Mapping cation exchange capacity using a quasi-3d joint inversion of EM38 and EM31 data. Soil Tillage Res. 2020, 200, 104618. [Google Scholar] [CrossRef]
  37. Siddique, M.R.B.; Hamid, A.; Islam, M.S. Drought stress effects on water relations of wheat. Bot. Bull. Acad. Sin. 2000, 41, 35–39. [Google Scholar]
  38. Reddy, A.R.; Chaitanya, K.V.; Vivekanandan, M. Drought-induced responses of photosynthesis and antioxidant metabolism in higher plants. J. Plant Physiol. 2004, 161, 1189–1202. [Google Scholar] [CrossRef]
  39. Perez-Martin, A.; Michelazzo, C.; Torres-Ruiz, J.M.; Flexas, J.; Fernández, J.E.; Sebastiani, L.; Diaz-Espejo, A. Regulation of photosynthesis and stomatal and mesophyll conductance under water stress and recovery in olive trees: Correlation with gene expression of carbonic anhydrase and aquaporins. J. Exp. Bot. 2014, 65, 3143–3156. [Google Scholar] [CrossRef] [Green Version]
  40. Cano, F.J.; Sánchez-Gómez, D.; Rodríguez-Calcerrada, J.; Warren, C.R.; Gil, L.; Aranda, I. Effects of drought on mesophyll conductance and photosynthetic limitations at different tree canopy layers. Plant Cell Environ. 2013, 36, 1961–1980. [Google Scholar] [CrossRef]
  41. Cutler, J.M.; Rains, D.W.; Loomis, R.S. The importance of cell size in the water relations of plants. Physiol. Plant. 1977, 40, 255–260. [Google Scholar] [CrossRef]
  42. Sharkey, T.D.; Vassey, T.L.; Vanderveer, P.J.; Vierstra, R.D. Carbon metabolism enzymes and photosynthesis in transgenic tobacco (Nicotiana tabacum L.) having excess phytochrome. Planta 1991, 185, 287–296. [Google Scholar] [CrossRef] [PubMed]
  43. Pakatas, A.; Stavrakas, D.; Fisarakis, I. Relationship between CO2 assimilation and leaf anatomical characteristics of two grapevine cultivars. Agronomie 2003, 23, 293–296. [Google Scholar] [CrossRef] [Green Version]
  44. Terashima, I.; Hanba, Y.T.; Tholen, D.; Niinemets, Ü. Leaf functional anatomy in relation to photosynthesis. Plant Physiol. 2011, 155, 108–116. [Google Scholar] [CrossRef] [Green Version]
  45. Li, Y.; Ren, B.; Yang, X.; Xu, G.; Shen, Q.; Guo, S. Chloroplast downsizing under nitrate nutrition restrained mesophyll conductance and photosynthesis in rice (Oryza sativa L.) under drought conditions. Plant Cell Physiol. 2012, 53, 892–900. [Google Scholar] [CrossRef] [PubMed] [Green Version]
  46. Grassi, G.; Magnani, F. Stomatal, mesophyll conductance and biochemical limitations to photosynthesis as affected by drought and leaf ontogeny in ash and oak trees. Plant Cell Environ. 2005, 28, 834–849. [Google Scholar] [CrossRef]
  47. Anderegg, J.; Aasen, H.; Perich, G.; Roth, L.; Walter, A.; Hund, A. Temporal trends in canopy temperature and greenness are potential indicators of late-season drought avoidance and functional stay-green in wheat. Field Crops Res. 2021, 274, 108311. [Google Scholar] [CrossRef]
  48. Crawford, A.J.; McLachlan, D.H.; Hetherington, A.M.; Franklin, K.A. High temperature exposure increases plant cooling capacity. Curr. Biol. 2012, 22, R396–R397. [Google Scholar] [CrossRef] [Green Version]
  49. Medrano, H.; Parry, M.A.J.; Socias, X.; Lawlor, D.W. Long term water stress inactivates Rubisco in subterranean clover. Ann. Appl. Biol. 1997, 131, 491–501. [Google Scholar] [CrossRef]
  50. Escalona, J.M.; Flexas, J.; Medrano, H. Stomatal and non-stomatal limitations of photosynthesis under water stress in field-grown grapevines. Aust. J. Plant Physiol. 1999, 26, 421–433. [Google Scholar] [CrossRef]
  51. Pilon, C.; Snider, J.L.; Sobolev, V.; Chastain, D.R.; Sorensen, R.B.; Meeks, C.D.; Massa, A.N.; Walk, T.; Singh, B.; Earl, H.J. Assessing stomatal and non-stomatal limitations to carbon assimilation under progressive drought in peanut (Arachis hypogaea L.). J. Plant Physiol. 2018, 231, 124–134. [Google Scholar] [CrossRef] [PubMed]
  52. Xu, L.; Baldocchi, D.D. Seasonal trends in photosynthetic parameters and stomatal conductance of blue oak (Quercus douglasii) under prolonged summer drought and high temperature. Tree Physiol. 2003, 23, 865–877. [Google Scholar] [CrossRef] [PubMed] [Green Version]
  53. Sun, Y.; Gu, L.; Dickinson, R.E.; Pallardy, S.G.; Baker, J.; Cao, Y.; Da Matta, F.M.; Dong, X.; Ellsworth, D.; Goethem, D.V.; et al. Asymmetrical effects of mesophyll conductance on fundamental photosynthetic parameters and their relationships estimated from leaf gas exchange measurements. Plant Cell Environ. 2014, 37, 978–994. [Google Scholar] [CrossRef] [PubMed]
  54. Long, S.P.; Bernacchi, C.J. Gas exchange measurements, what can they tell us about the underlying limitations to photosynthesis? procedures and sources of error. J. Exp. Bot. 2003, 54, 2393–2401. [Google Scholar] [CrossRef] [PubMed] [Green Version]
  55. von Caemmerer, S. Steady-state models of photosynthesis. Plant Cell Environ. 2013, 36, 1617–1630. [Google Scholar] [CrossRef]
  56. Bernacchi, C.J.; Singsaas, E.L.; Pimentel, C.; Portis, J.A.R.; Long, S.P. Improved temperature response functions for models of Rubisco-limited photosynthesis. Plant Cell Environ. 2001, 24, 253–259. [Google Scholar] [CrossRef]
  57. Flexas, J.; Niinemets, U.; Gallé, A.; Barbour, M.M.; Centritto, M.; Diaz-Espejo, A.; Douthe, C.; Galmés, J.; Ribas-Carbo, M.; Rodriguez, P.L.; et al. Diffusional conductances to CO2 as a target for increasing photosynthesis and photosynthetic water-use efficiency. Photosynth. Res. 2013, 117, 45–59. [Google Scholar] [CrossRef]
  58. Yang, Z.; Liu, J.; Tischer, S.V.; Christmann, A.; Windisch, W.; Schnyder, H.; Grill, E. Leveraging abscisic acid receptors for efficient water use in Arabidopsis. Proc. Natl. Acad. Sci. USA 2016, 113, 6791–6796. [Google Scholar] [CrossRef] [Green Version]
  59. Evans, J.R.; Sharkey, T.D.; Berry, J.A.; Farquhar, G.D. Carbon isotope discrimination measured concurrently with gas exchange to investigate CO2 diffusion in leaves of higher plants. Aust. J. Plant Physiol. 1986, 13, 281–292. [Google Scholar] [CrossRef] [Green Version]
  60. Marco, G.D.; Manes, F.; Tricoli, D.; Vitale, E. Fluorescence parameters measured concurrently with net photosynthesis to investigate chloroplastic CO2 concentration in leaves of Quercus ilex L. J. Plant Physiol. 1990, 136, 538–543. [Google Scholar] [CrossRef]
Figure 1. Location of the study area.
Atmosphere 13 00596 g001
Figure 2. Experimental treatments (a,b) and measurement of photosynthetic parameters (c). CK refers to the control group. WS refers to the continuous drought group.
Atmosphere 13 00596 g002
Figure 3. Changes in relative soil moisture (RSM) during the observation period. CK refers to the control group. WS refers to the continuous drought group. Circles represent means, and error bars show standard deviations (n = 4). The dashed line represents the 95% confidence intervals for the mean of CK.
Atmosphere 13 00596 g003
Figure 4. Dynamics in photosynthetic physiological parameters of spring wheat leaves under different relative soil moisture: (a) Pn parameter, (b) Tr parameter, (c) gs parameter, and (d) Ci parameter. CK refers to the control group. WS refers to the continuous drought group. The grey dashed line is the reference line of 50% relative soil moisture.
Atmosphere 13 00596 g004
Figure 5. Dynamics of leaf water content of spring wheat under different relative soil moistures. CK refers to the control group. WS refers to the continuous drought group. The grey dashed line is the reference line of 50% relative soil moisture.
Atmosphere 13 00596 g005
Figure 6. Dynamics in photosynthetic biochemical parameters of spring wheat leaves under different relative soil moisture: (a) Vcmax parameter, (b) Jmax parameter, (c) TPU parameter, and (d) gm parameter. CK refers to the control group. WS refers to the continuous drought group. The grey dashed line is the reference line of 50% relative soil moisture.
Atmosphere 13 00596 g006
Table 1. One-way ANOVA of photosynthetic physiological parameters of spring wheat leaves under different soil water treatments.
ParameterTreatmentsNMeanStandard DeviationFSig.
Pn (μmol·m−2·s−1)CK1522.63.214.50.000 **
WS3514.67.8
Tr (mmol·m−2·s−1)CK155.51.010.10.002 **
WS353.72.1
gs (mol·m−2·s−1)CK150.40.117.10.000 **
WS350.20.2
Ci (μmol·mol−1)CK15270.912.96.80.012 *
WS35236.749.8
Note: CK refers to the control group. WS refers to the continuous drought group. Symbols * and ** indicate levels of significance at p < 0.05 and p < 0.01, respectively.
Table 2. Curve fitting of photosynthetic physiological parameters of spring wheat leaves under rapid-drought stress.
ParameterFitted EquationAdj. R2FSig.
Pn y = 21.827 1 + e 0.121 ( x 35.706 ) 0.7144.30.000 **
Tr y = 5.180 1 + e 0.157 ( x 34.149 ) 0.588.80.000 **
gs y = 0.384 1 + e 0.101 ( x 43.565 ) 0.669.00.000 **
Ci y = 0.00167 x 3 + 0.28746 x 2 14.3809 x + 441.7484   0.1217.80.000 **
Note: Symbol ** indicates level of significance at p < 0.01.
Table 3. One-way ANOVA of leaf water content of spring wheat under different soil water treatments.
ParameterTreatmentsNMeanStandard DeviationFSig.
LWC (%)CK1370.46.82.60.122
WS1764.511.9
M50%2270.66.514.80.001 **
L50%857.112.8
Note: CK refers to the control group. WS refers to the continuous drought group. M50% refers to the RSM greater than 50% group. L50% refers to the RSM less than 50% group. Symbol ** indicates level of significance at p < 0.01.
Table 4. Curve-fitting of leaf water content of spring wheat under rapid-drought stress.
ParameterFitted EquationAdj. R2FSig.
LWC y = 71.235 1 + e 0.175 ( x 29.008 ) 0.8709.20.000 **
Note: Symbols ** indicates level of significance at p < 0.01.
Table 5. One-way ANOVA of photosynthetic biochemical parameters of spring wheat leaves under different soil water treatments. CK: the control group; WS: the continuous drought group.
ParameterTreatmentsNMeanStandard DeviationFSig.
Vcmax (μmol·m−2·s−1)CK1575.014.14.20.048 *
WS2160.923.9
Jmax (μmol·m−2·s−1)CK18191.818.19.80.003 **
WS30146.459.7
TPU (μmol·m−2·s−1)CK1913.92.311.00.002 **
WS449.26.0
gm (μmol·m-2·s−1·Pa−1)CK102.10.99.80.004 **
WS271.00.9
Note: CK refers to the control group. WS refers to the continuous drought group. Symbols * and ** indicate levels of significance at p < 0.05 and p < 0.01, respectively.
Table 6. Curve-fitting of photosynthetic biochemical parameters of spring wheat leaves under rapid-drought stress.
ParameterFitted EquationAdj. R2FSig.
Vcmax y = 68.434 1 + e 0.250 ( x 28.614 ) 0.479.10.000 **
Jmax y = 176.224 1 + e 0.141 ( x 28.173 ) 0.4117.10.000 **
TPU y = 13.611 1 + e 0.159 ( x 34.147 ) 0.7142.70.000 **
gm y = 1.822 1 + e 0.104 ( x 38.265 ) 0.529.80.000 **
Note: Symbol ** indicates level of significance at p < 0.01.
Table 7. Drought thresholds of spring wheat under rapid-drought stress.
ParameterMild DroughtSevere Drought
Drought ThresholdsDisaster DegreeDrought ThresholdsDisaster Degree
(%) RR (%)(%) RR (%)
Pn (μmol·m−2·s−1)48.918.219.635.710.951.6
Tr (mmol·m−2·s−1)42.74.125.434.22.653.0
gs (mol·m−2·s−1)56.60.318.743.60.248.0
Ci (μmol·mol−1)58.2249.28.036.8218.619.3
LWC (%)45.367.44.229.035.649.4
Vcmax (μmol·m−2·s−1)42.365.712.428.634.254.4
Jmax (μmol·m−2·s−1)53.3171.310.728.288.154.1
TPU (μmol·m−2·s−1)43.711.219.734.26.851.0
gm (μmol·m−2·s−1·Pa−1)50.91.430.438.30.956.0
Note: RR refers to the reduction ratio.
Publisher’s Note: MDPI stays neutral with regard to jurisdictional claims in published maps and institutional affiliations.

