Article

Coughing Intensity and Wind Direction Effects on the Transmission of Respiratory Droplets: A Computation with Euler–Lagrange Method

1
Department of Civil and Environmental Engineering, Shantou University, Shantou 515063, China
2
College of Chemistry and Chemical Engineering, Shanghai University of Engineering Science, Shanghai 201620, China
*
Author to whom correspondence should be addressed.
Atmosphere 2022, 13(4), 594; https://doi.org/10.3390/atmos13040594
Submission received: 25 February 2022 / Revised: 26 March 2022 / Accepted: 30 March 2022 / Published: 7 April 2022
(This article belongs to the Topic Air Pollution and Occupational Exposure)

Abstract

:
Studies on droplet transmission are needed to understand the infection mechanism of SARS-CoV-2. This research investigated the effects of coughing intensity and wind direction on respiratory droplets transportation using the Euler–Lagrange method. The results revealed that both coughing intensity and wind conditions considerably influence the transmission of small and medium droplets but had little effect on large droplets. A stronger coughing intensity resulted in small and medium droplets traveling farther in a calm wind and spreading widely and rapidly in a windy environment. The droplets do not travel far in the absence of ambient wind, even with stronger coughing. Medium droplets spread in clusters, and small droplets drifted out of the domain in the band area in different wind conditions except for 60° and 90° wind directions, in which cases, the droplets were blown directly downstream. In 0° wind direction, many droplets were deposited on the human body. The fast and upward movement of particles in 60° and 90° directions could cause infection risk with short exposure. In 180° wind direction, droplets spread widely and traveled slowly because of the reverse flow downstream, prolonged exposure can result in a high risk of infection.

1. Introduction

Coronavirus disease 2019 (COVID-19) has been a major threat to human health and the economy since its emergence at the end of the year 2019. As a result, the transmission of virus-carrying respiratory droplets has drawn considerable research attention. The dispersion of mouth exhaled droplets has long been studied theoretically, with one of the earliest studies by Wells [1], analyzing the transmission pattern of airborne droplets. Some researchers have recently proposed new theoretical formulations to predict droplet trajectories [2,3]. With the development of micro-technique and new imaging technologies, observing and measuring the diameter distributions of expelled droplets [4,5,6,7] and exhaled airflow velocity [8,9] have become feasible. These methods offer great advantages in terms of visualization. However, such experiments are costly and can only track droplets in a limited radius.
An experimentally validated computational fluid-particle dynamics (CFPD) model based on the Euler–Lagrange method has been widely used to simulate the transmission of airborne particles [10,11,12,13]. The CFPD model increases the convenience and flexibility of predicting the transmission of respiratory droplets both indoors and outdoors. Combining experiments and numerical simulations, several studies have investigated the transport of the particles generated by patients in a hospital under diverse conditions [14,15,16,17]. These studies have demonstrated the reliability of the CFPD method. Other studies have examined the transmission of exhaled droplets numerically in typical indoor environments, such as an aircraft cabin [18,19], a high-speed rail cabin [20], and other ventilated rooms [21,22]. As mentioned above, most studies have focused on particle transmission in an indoor environment to reduce the risk of infection [23], with comparatively few studies considering outdoor transmission [24,25,26]. Feng et al. [27] examined the effects of wind and relative humidity on the transmission and deposition of droplets between two virtual humans in an outdoor environment, they also found that wearing masks should be recommended for both infected and healthy humans, to reduce the airborne cough droplet numbers. However, some studies put forward that wearing a surgical mask induces a reduction in circulating O2 concentrations while an increase in heart frequency and a sensation of shortness of breath [28]. The climate conditions have been certified to influence the transmission of respiratory droplets [29]. However, further study of outdoor transmission is critical for managing a highly infectious virus such as severe acute respiratory syndrome coronavirus 2 (SARS-CoV-2).
Humans engage in four respiratory activities: breathing, talking, coughing, and sneezing. Coughing has attracted most research attention because it is a violent expiratory event and the main symptom of respiratory infectious disease [8,30,31]. The present work aimed to investigate the influences of cough intensities and meteorological conditions on the transport characteristics of coughed droplets with different diameters. This study can help people to decide on risky regions around an infected person so as to raise attention to avoid being infected in an outdoor environment.

2. Methodology

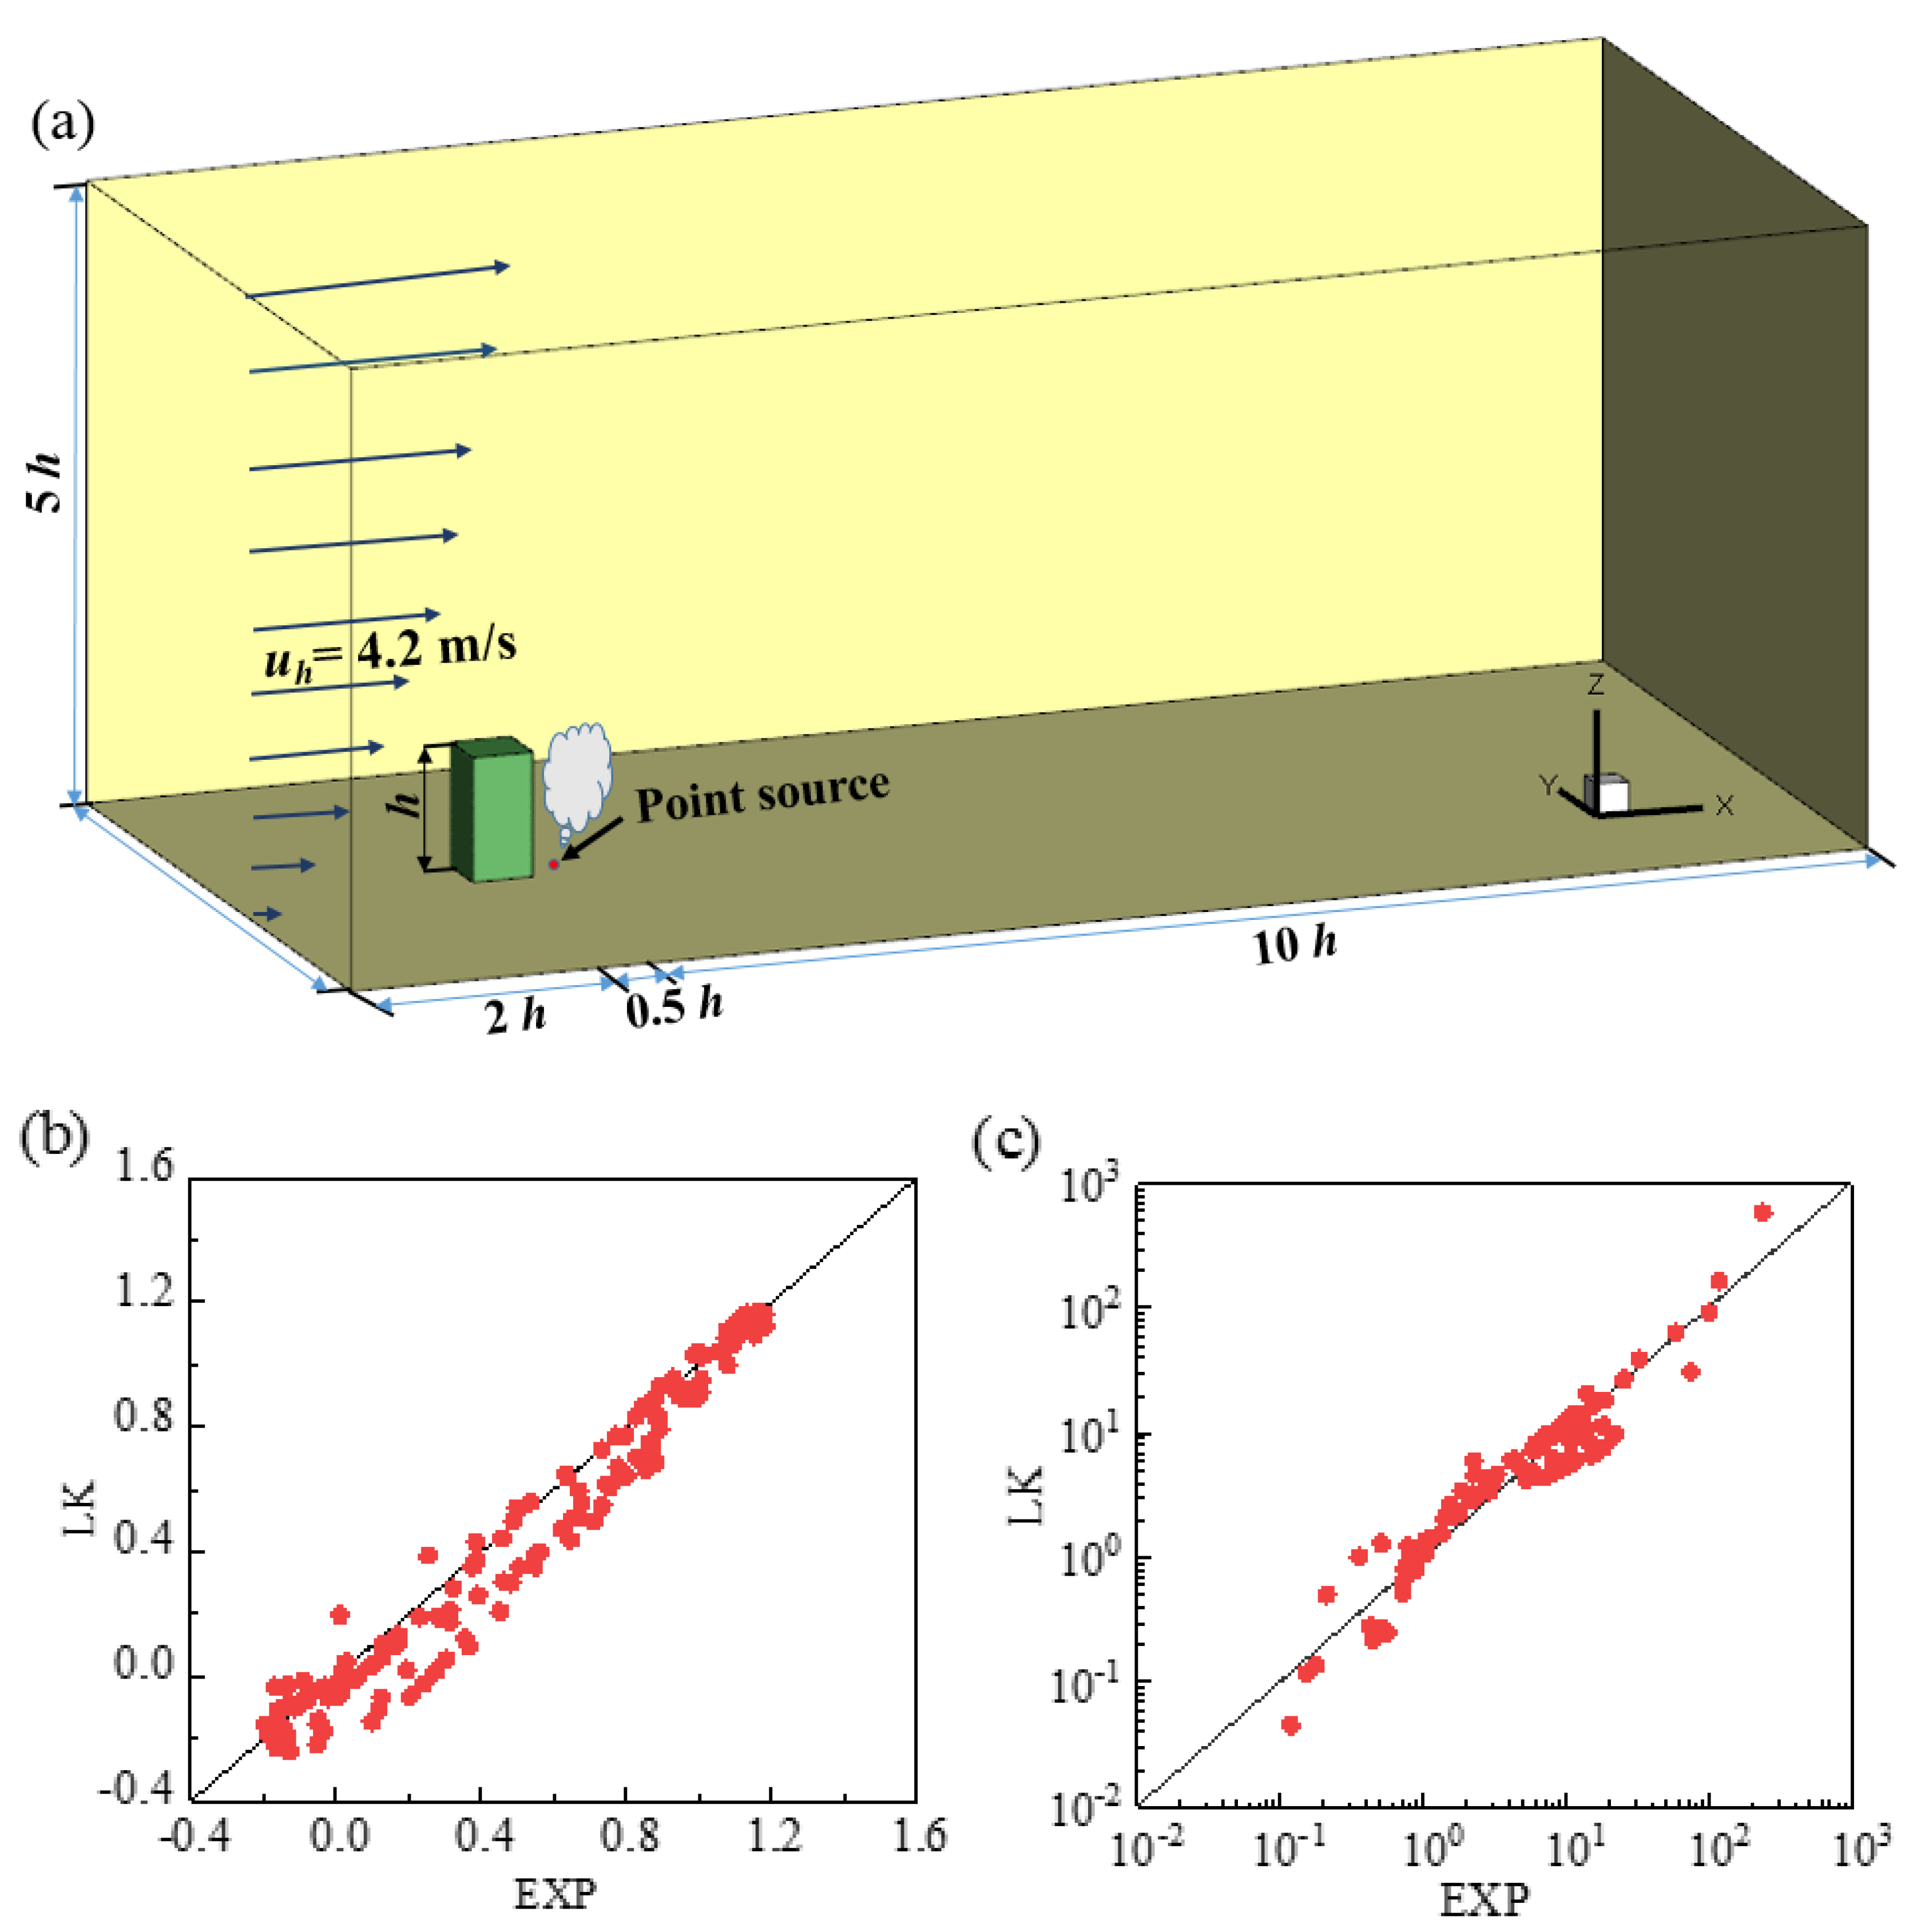
2.1. Model Validation

As the standard k–ε model often yields an overestimation of turbulent kinetic energy k in the impingement region when applied to solve flow around bluff bodies [32,33], a revised k–zε model proposed by Kato and Launder [34] (hereafter denoted as LK model) was adopted. The LK model was derived to revise the overestimation of k by modifying the production term of the k equation, as displayed in Equation (1).
P k = V t S
where ν t = Cμk2/ε is turbulent viscosity, ε is the dissipation rate, S is the strain rate magnitude, and Ω is the vorticity rate.
The airflow around an isolated building is similar to that around a human body. This study used previously obtained wind tunnel measurements of the flow and gas diffusion around a high-rise building in a neutral condition to verify the turbulence model [35,36]. The measurements were conducted in the wind tunnel of Tokyo Polytechnic University. The model building (0.1 m × 0.1 m × 0.2 m) was located in a fully developed turbulent boundary layer, a point gas source was set on the floor at 50 mm from the leeward side of the building, and tracer gas was released from a 2 mm diameter hole at a flow rate of 0.35 L/min (Figure 1a). The wind velocity and gas concentration were measured simultaneously using a split film probe and a fast response flame ionization detector.
Figure 1b,c depict the correlations of normalized streamwise velocity and pollutant concentration between the experimental and computational fluid dynamics results. The LK model demonstrated favorable performance, compared with the experimental results. As a result, this study selected the LK model to simulate turbulent flow and particle dispersion.

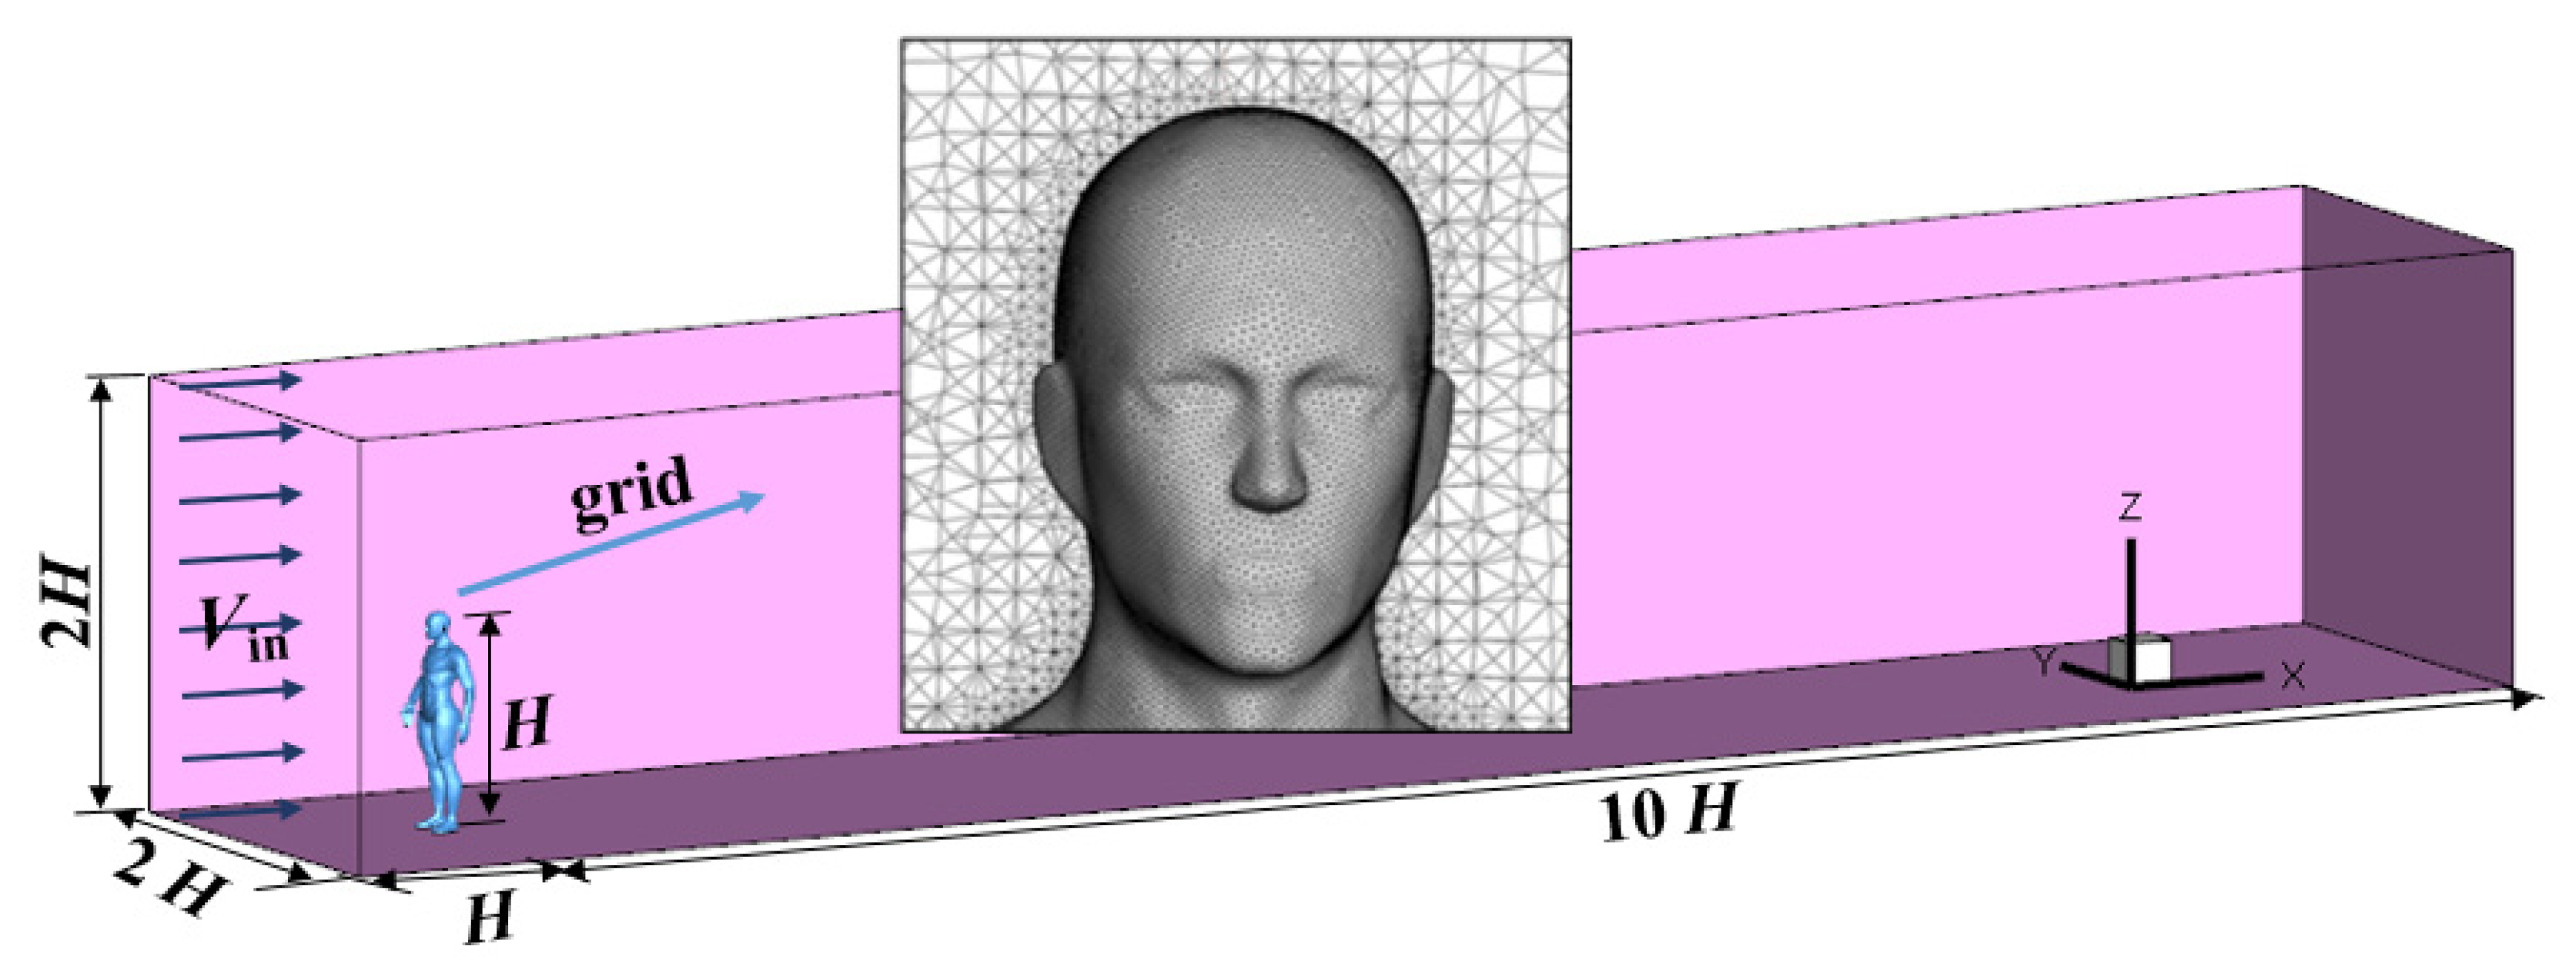
2.2. Outline of Simulations

The simulation domain covered a range of 11 H × 2 H × 2 H in the streamwise, spanwise, and vertical directions, where H is the height of the manikin (1.74 m). The virtual manikin model was constructed by referencing the parameters of the Ito institution [37], which represents a normal Asian person. The size of the open mouth was approximately 6 cm2. A schematic of the computational setup and the meshes on the manikin’s surface and around the body is depicted in Figure 2. Unstructured tetrahedral meshes were generated and the grids on the manikin surface were refined to locate the non-dimensional wall distance y+ between 10 and 30. Scalable wall functions were used to avoid the deterioration of standard wall functions under grid refinement, in which a limiter in the y+ calculation was introduced to force the usage of the log law in conjunction with the standard wall functions approach,
y ˜ + = M a x   ( y + , y l i m i t + )
where y l i m i t + = 11.225.
A uniform weak wind velocity of Vin = 1.8 m/s (light breeze) was applied to the inlet boundary to investigate the cough-jet intensity influence. A velocity of 3.6 m/s (gentle breeze) was applied to assess the effect of wind direction on particle dispersion. Symmetric conditions were employed for the lateral and the top boundaries. The pressure-outlet condition was used for the outlet boundary. A second-order Upwind scheme was applied to all convection terms.
Before calculation, three simulations with different mesh systems (3.5 million, 4.9 million, and 6.9 million) were conducted to verify the grid independence. In Figure 3, the velocity magnitude in a vertical line at 0.5 m downstream of the manikin body is assessed. No distinct differences were observed among the three mesh systems. Therefore, the mesh system with 4.9 million grids was selected in this study to reduce the computing resources while accurately capturing the wind flow around the body.
The cough droplet size distribution used in this study, as shown in Figure 4a, was obtained from a previous experiment [38] and has been widely accepted and applied [19,27,39]. The airflow velocity placed as the mouth boundary condition was generated using the volumetric flow rate of the transient cough-jet airflow depicted in Figure 4b. The experimental data on cough-jet flow rate were adopted from the study of Gupta et al. [40]. In their study, 25 volunteers (12 women and 13 men) were selected to measure and record the airflow rate at the mouth opening during one coughing, the recorded data of 25 volunteers were averaged to obtain universal data on the human cough jet. These universal data were widely accepted in the field and were widely used in other studies to study the transmission of respiratory droplets caused by cough activity [19,27,39].

2.3. Simulation Cases

In this study, 12 simulation cases were performed. To investigate cough-jet effects, four simulations were performed of standard cough-jet velocity (depicted in Figure 4b) and 2× standard cough-jet velocity in a calm wind environment (Vin = 0 m/s) and in a windy environment (Vin = 1.8 m/s). For the windy environment, the incoming wind was perpendicular to the back of the manikin. One case was used to determine the effect of the initial velocity of the droplets by comparing jet velocities of 2.9 m/s (the average velocity of a standard cough stream) and 6 m/s (slightly below the peak of a standard cough stream) in a calm wind environment.
To examine the effects of wind angle, seven simulation cases with 0°, 30°, 60°, 90°, 120°, 150°, and 180° wind directions were employed. For these cases, the inflow wind velocity was 3.6 m/s, the standard cough jet was used to spray droplets, and the initial velocity of droplets was set to 2.9 m/s. The definition of wind directions is presented in Figure 5. In a 0° direction, the wind blew directly to the face of the manikin.

2.4. Motion Equations of Discrete Phase

As the volumetric fraction of the droplets is low, compared with the continuous phase (air), the Euler–Lagrange method was used to track the trajectories of numerous droplets. The particle motion equation was derived from Newton’s second law and is as follows:
d u p d t = u u p τ r + g ( ρ p ρ ) ρ p + F ¯
where u p is the discrete droplets velocity, u is the continuous phase velocity, g is the gravitational acceleration, ρ p is the particulate density, and ρ is the air density. F represents additional forces with unit mass, including the pressure gradient force, thermophoretic force, Brownian force, and Saffman’s lift force. These additional forces are only relevant for particles with submicron diameters and were neglected in this study. τ r is the droplet relaxation time, which was defined as follows:
τ r = 4 3 ρ p d p ρ C d | u p u |
where dp is the particle diameter and Cd is the drag coefficient.
Firstly, a steady calculation was conducted to obtain a steady wind condition. Subsequently, the calculation was converted to a transient simulation and the discrete phase model was used to track the motion trajectories of the droplets. Both the droplet tracking time step and the flow time step were set to 0.001 s. The droplets were treated as inert particles, and deformation, evaporation, condensation, crushing, and fusion were disregarded.

3. Results and Discussions

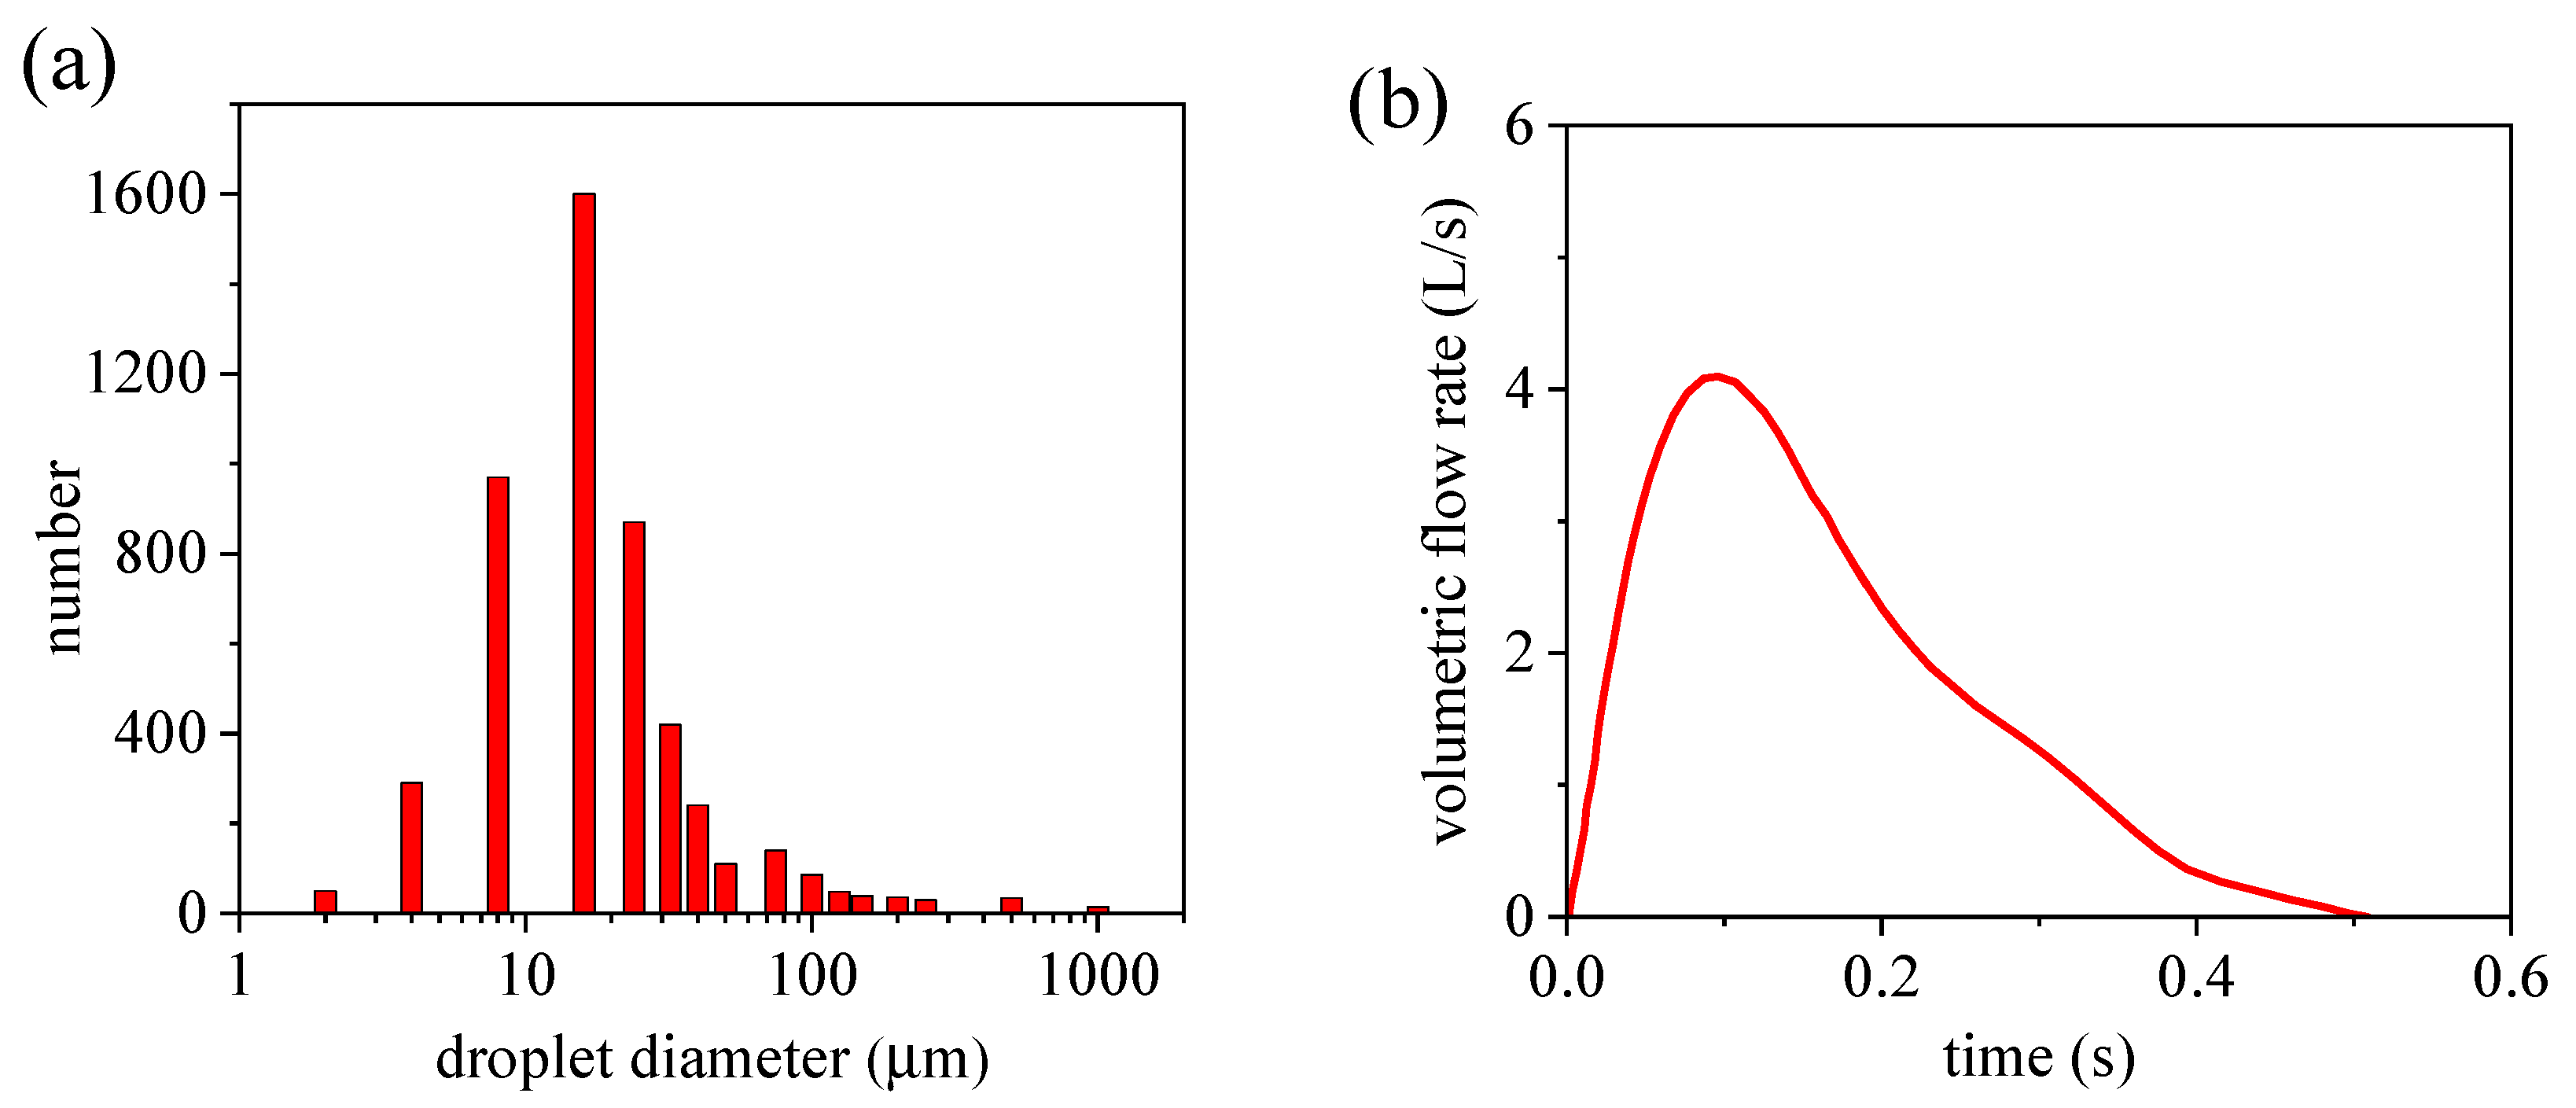
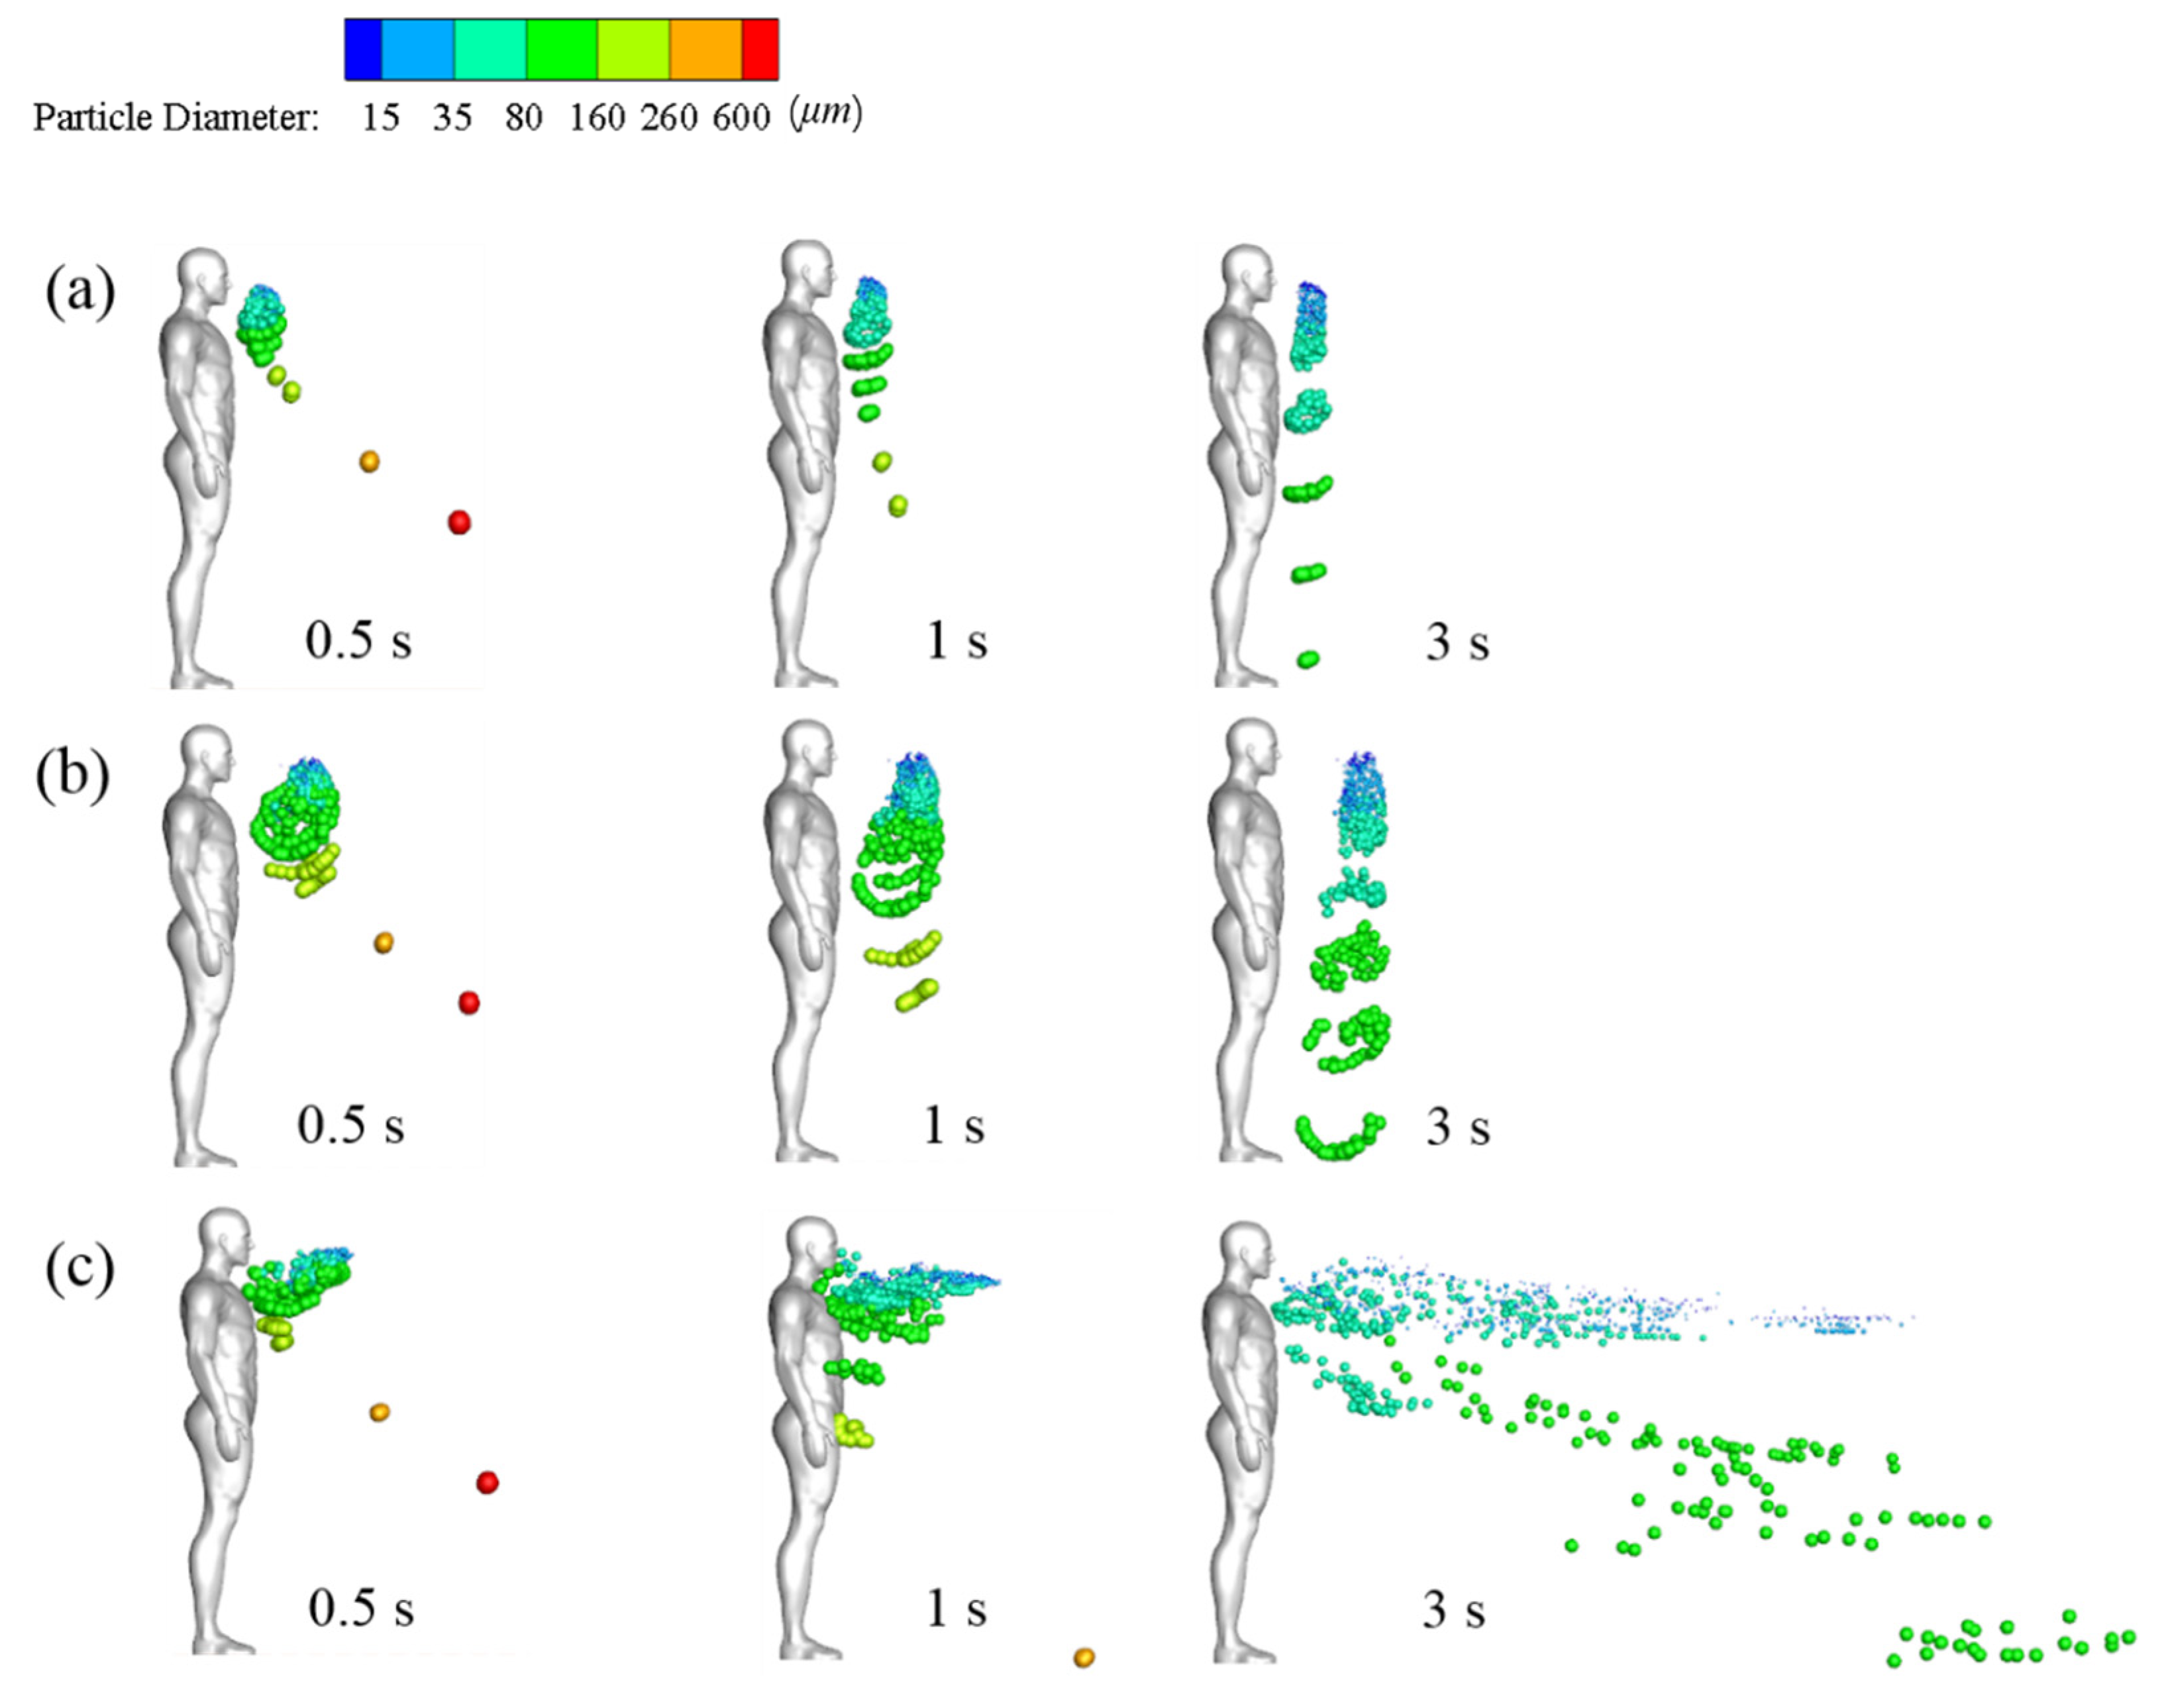
3.1. Effects of Cough-Jet Intensity and Droplet Ejection Speed

Figure 6 displays the streamwise wind velocity of the standard and double-strength cough-jet cases in the middle plane of the domain in a calm wind environment. The cough stream spreads in 0.5 s for both cases. Coughing airflow was sprayed from the mouth at time t = 0 s, and the cough-jet velocity peaked at t = 0.1 s. The standard cough jet’s maximum speed is approximately 7 m/s when using the experimental data in Figure 4b. Therefore, the maximum velocity of the double-strength cough jet was approximately 14 m/s. The maximum speed was sustained for only a short time and decreased due to air friction over the next 0.4 s. The ambient air was disturbed during the cough, and the affected area by the cough-jet was much larger for the double-strength cough-jet case. The results indicated that the size of the affected zone was proportional to the cough airflow intensity. The affected zone remained unaltered for a while even after the cough jet finished, and the contour line with a value of 0.01 m/s extended 0.4 m and 0.8 m in the streamwise direction for the normal strength and double-strength cough jet, respectively.
The streamwise wind velocities of cough jets of different intensities in the symmetry plane under an inflow condition of Vin = 1.8 m/s are displayed in Figure 7. Compared with the calm condition (Figure 6), a large reverse-flow region (dark blue area) was present downstream of the human body in a windy environment, and the flow separation from the body dominated the wind field. For both cases, the influence of the cough jet on airflow was quite small except in a small area near the mouth. Compared with the standard cough-jet case, the double-strength cough jet disturbed the flow field much more in a local area when the cough-jet velocity peaked (t = 0.1 s). This could affect the dispersion of the particles when they are ejected from the mouth into the environment.
A more visual view of particle diffusion in the flow field, the droplet positions, and sizes are presented in Figure 8. Cases 1 and 2 simulate the dispersion of droplets sprayed by the standard cough jet and the double-strength cough jet, respectively, in a calm wind environment. Cases 3 and 4 simulate droplet dispersion in a Vin = 1.8 m/s flow field. In Cases 1–4, the particulate ejection velocity from the mouth was 2.9 m/s. In Case 5, the droplets were ejected by a standard cough jet with an initial velocity of 6 m/s in a calm wind environment.
As illustrated in Figure 8a,b, small droplets with a diameter of ≤75 μm were suspended ahead of the manikin after the coughing activity ended. In previous studies, these droplets were usually defined as aerosol particles that are small enough to remain airborne for sufficient time, they were mainly influenced by streamlines of carried airflow, and were less prone to deposition [2,41]. Airflow and gravity affected medium droplets (75–200 μm). They were suspended in the air with the small droplets and then gradually fell to the ground. This transmission pattern of small and medium droplets was similar to the findings of another study [24]. The position of the suspended small and medium droplets was close to the edge of the region in which the air velocity was larger than 0.04 m/s and moved forward very little after the coughing ended. This indicates that air velocity is a key factor in determining whether small and medium droplets continue to diffuse [41]. The small and medium particles were transmitted farther in the 2× strength case than in the standard case. The small particles cluster center was approximately 0.36 m and 0.52 m ahead of the manikin in Cases 1 and 2, respectively. Inertia and gravity dominated the motions of large droplets with diameters of ≥200 μm, and in Cases 1–5, they rapidly fell to the ground. Thus, cough droplets cannot travel long distances even with a stronger cough jet in the absence of ambient wind.
As illustrated in Figure 8, the inflow wind substantially affected particle dispersion. Small and medium droplets diffused rapidly in ambient wind. At time t = 3 s, they were distributed throughout the wake region downstream of the manikin. Many particles were trapped near the head and chest, and some were even carried back to the manikin’s surface within the initial stage due to the reverse flow depicted in Figure 7. Most of the small droplets traveled downstream with the airflow mainly at a height between the chest and head. The medium droplets diffused in the flow fields and gradually fell to the ground. The wind hardly affected the trajectories of the extremely large droplets. Figure 8c,d demonstrate that cough-jet intensity substantially influenced particle transmission in a windy environment. Small and medium droplets spread more rapidly and widely and traveled longer in a windy environment with stronger coughing. In the case of strong coughing, the likely reason is that most droplets can be blown away from the reverse-flow region near the mouth and avoid being trapped near the body.
The results of Case 1 (Figure 8a) and Case 5 (Figure 8e) can be compared to examine the effect of particle ejection velocity. Extremely large droplets (red and orange colors) traveled a longer distance in the x-direction at t = 0.5 s in Case 5, in which the particles were ejected from the mouth at a high initial velocity (6 m/s). Most small and medium particles were suspended at a similar position in both cases. As large particles have a large mass and inertia, high ejection velocity provided them with sufficient energy to overcome air resistance. Airflow dominated the motions of small and medium particles, and their mass was so small that their initial momentum had little influence on their trajectories. As a result, initial ejection velocity only influenced the trajectories of the large droplets. Therefore, the effect of initial ejection velocity on the trajectories of small droplets can be disregarded.
The coordinate values of suspended and ground-deposited droplets were recorded, and the average values of the x coordinates of particles with the same diameter were obtained at time t = 1 s. The travel distance was calculated by subtracting mouth coordinate from averaged particle coordinates, as illustrated in Figure 9. The time of 1 s was selected because, in a calm wind environment, the droplets stopped traveling at this time. A comparison of Case 1 with Case 2, and Case 3 with Case 4, showed that small and medium droplets traveled longer in stronger coughing activity under the same inflow conditions. The travel distance difference between Cases 1 and 2 was 0.2 m (no wind), and it increased to 0.37 m between Cases 3 and 4 (Vin = 1.8 m/s). By contrast, the influence of coughing intensity on the travel distance of large particles was small. No major differences were noted between Cases 1 and 2 and between Cases 3 and 4. Small particles were transported longer when ambient wind was present for the same cough-jet intensity, whereas the wind effect on the travel distance of medium particles was small. For Case 3, the travel distances of certain medium-sized particles were very short because the reverse flow slowed them down under windy conditions. In Cases 1 and 5, the travel distances of small and medium particles with different initial ejection velocities almost overlapped, which indicates that their motion was not affected by their ejection velocity. Overall, the travel distance of droplets in windy conditions was longer than in calm wind fields. The travel distance of large droplets was longer than others, but they fell to the ground rapidly due to gravity; thus, their direct contributions to virus transmission were small. Small and medium droplets mainly accomplished the airborne transmission of the respiratory virus. Their motion was little affected by the ejection velocity. Therefore, a single initial ejection velocity of VP = 2.9 m/s was used to study the effect of wind direction in subsequent simulations.

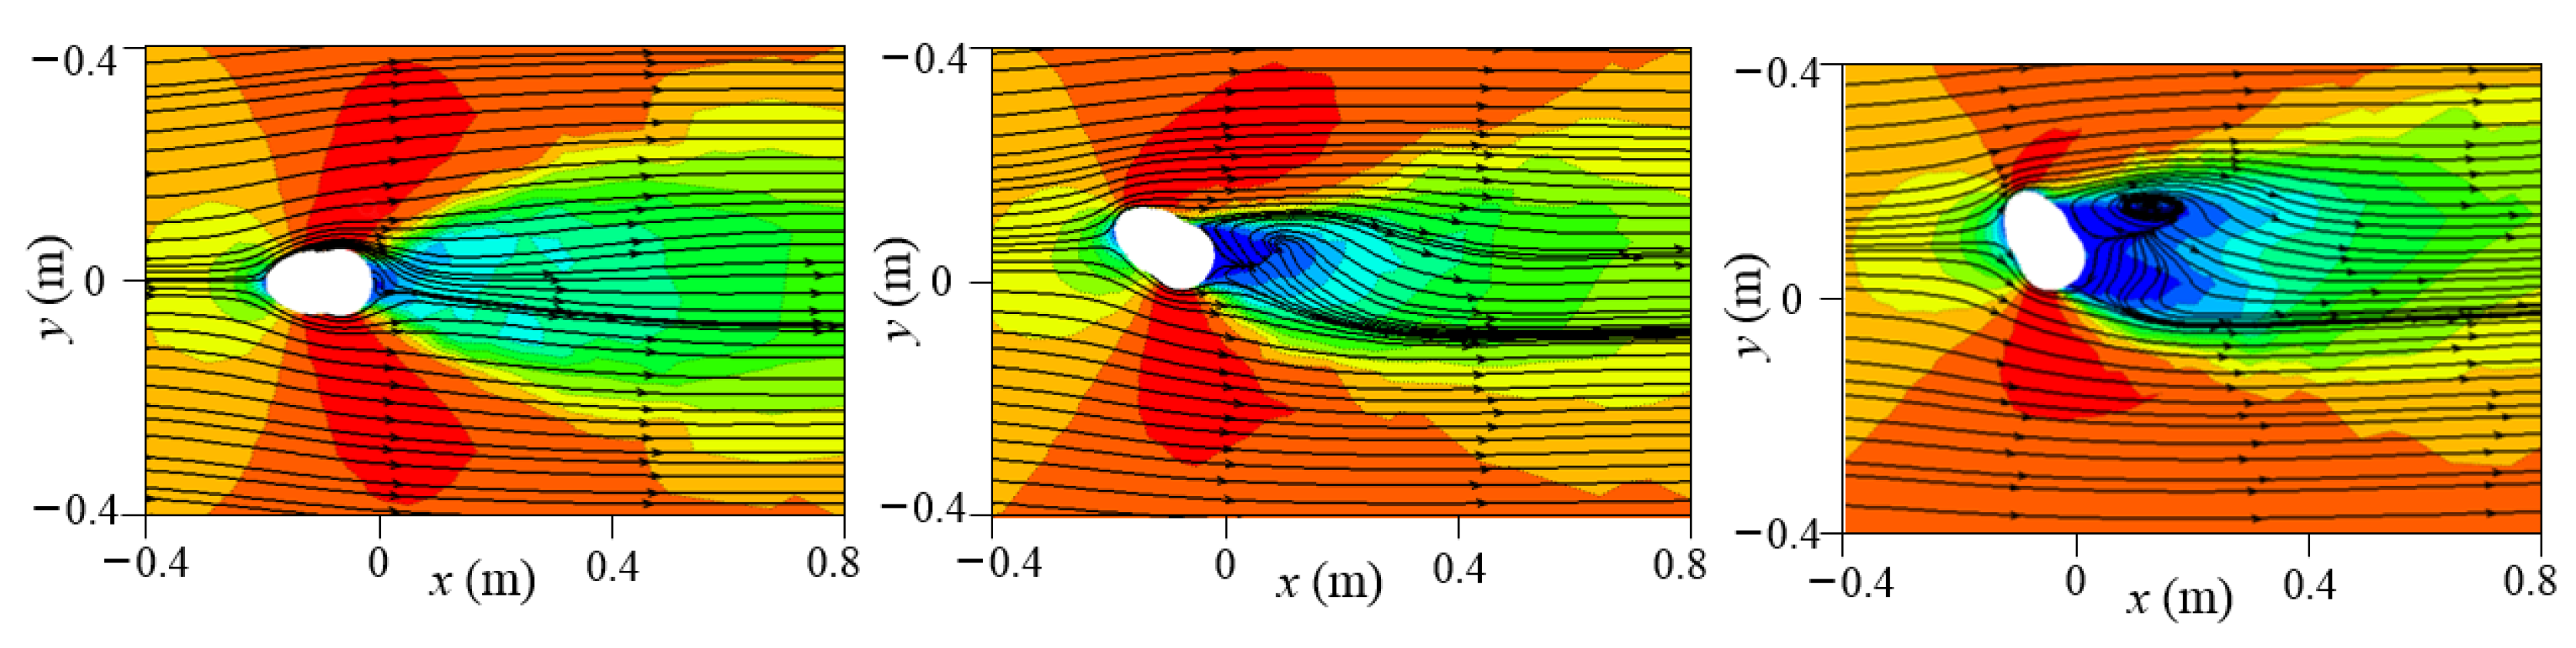
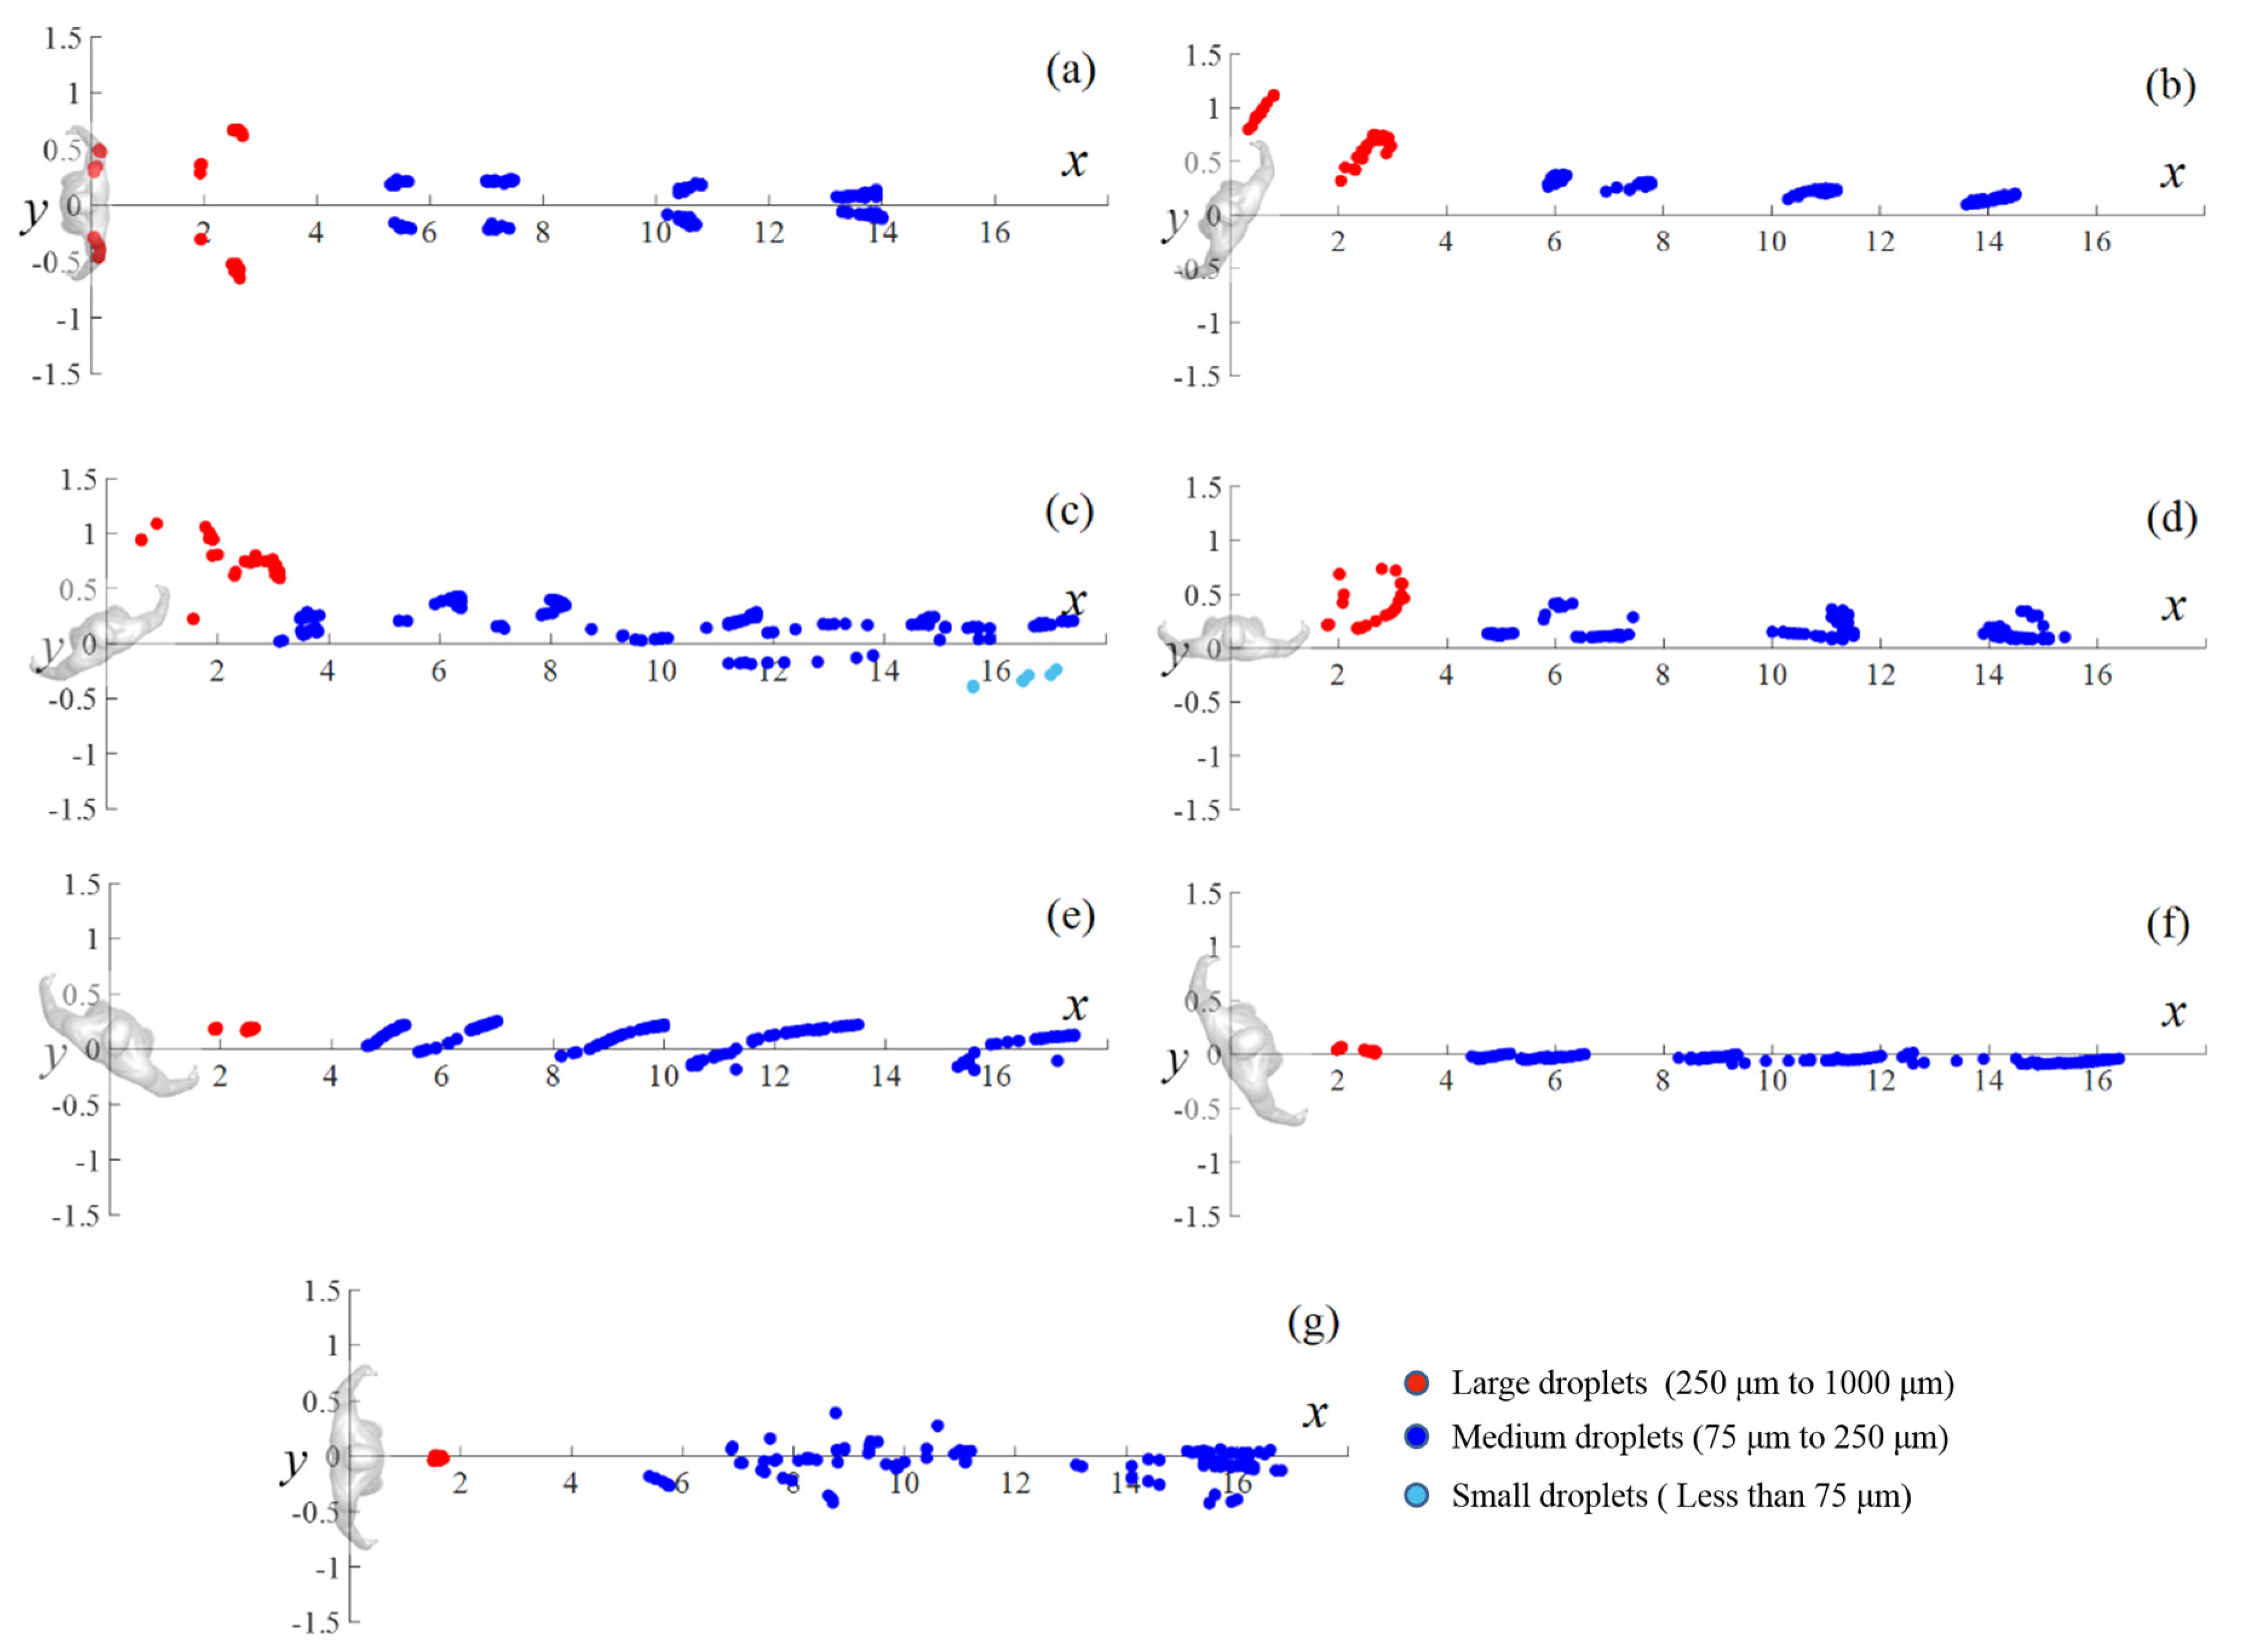
3.2. Effects of Wind Direction on Droplet Dispersion

The flow field near the mouth had a considerable effect on droplet transmission in the initial stage. Therefore, to elucidate the flow field near the manikin, the x velocity contour and two-dimensional streamlines on the horizontal plane at mouth height of z = 1.554 m were examined, as displayed in Figure 10.
The cross-section shape of the head resembles an ellipse that is slightly steeper on the face side, thus affecting the wind stream around it. At a 0° wind angle, the sharp part of the head faced the oncoming wind. As flow separation was small and the airflow was smooth and distributed symmetrically around the head, no reverse-flow region was observed. Backflow formed on the leeward side of the head under the 30°, 60°, 90°, 120°, and 180° wind directions, but the shape and size of the reverse-flow region differed. The backflow area was widest under the 60° wind direction and longest under the 180° wind direction. Under a 150° wind angle, no backflow area was present because the wind flowed along the boundary of the head. Moreover, the upward flow behind the body also affected the streamlines on the leeward side of the head. In addition, high-speed areas were present near the two sides of the head in the crosswind direction due to flow separation. The mouth location in the flow field was key because the airflow captured small and medium droplets immediately after leaving the mouth. For a 0° wind direction, the mouth was located in the symmetry plane of the domain. As a result, the air flowed symmetrically along both sides of the face after it crossed the mouth. In the 60° and 90° wind directions, the airflow near the mouth was strong and transported the droplets quickly. In the 180° wind direction, the mouth was entirely located in the reverse-flow area, leading to small and medium particles being trapped.
The visual position of droplets in a windy environment is illustrated from different perspectives in Figure 11. Large droplets rapidly fell to the ground because of gravity. By t = 0.5 s, most large droplets descended to a height between the manikin’s knee and hip. In the case of a 0° wind direction, large droplets were positioned near the front of the manikin due to the mixed effects of inertia, wind speed, air drag, and gravity. Compared with small droplets, medium droplets generally maintained their motion trend because they were less likely to be dispersed by air disturbance due to their relatively larger inertia. As a result, they traveled together in the flow field according to their diameters and fell to the ground in groups, except in the 0° and 180° wind directions. In the 0° wind direction, the mouth was facing the oncoming flow, and flow impinging and separation affected the medium droplets after entering the flow field. The droplets bypassed the head and were distributed symmetrically downstream along the two sides of the wake region. In the 180° wind environments, the strong reverse flow and turbulence on the leeward side of the manikin’s chest and head dispersed medium droplets widely. Apart from in the 60° and 90° wind environments, small droplets formed a distribution band downstream of the body, and the band floated to the outlet of the simulation domain over time. In the 60° and 90° wind environments, the small particles were blown downstream directly in conjunction with the medium particles and were distributed in groups throughout the space. Overall, the transmission speed was quick for windy environments with 0°, 30°, 60°, 90°, 120°, and 150° wind directions, and droplet speeds were substantially higher for the 60° and 90° directions. This could lead to rapid infections in susceptible people downstream. For the 180° wind environment, most particles were trapped in the wake near the body in the initial stage due to the strong reverse flow, and they moved downstream slowly and dispersed widely, increasing the risk to people downstream over a long exposure time. Notably, in the 60° and 90° wind environments, some droplets spread above the head because of the updrafts caused by the disturbance of the air by the body.
The deposition positions of large and medium droplets on the ground in different wind directions are depicted in Figure 12. The wind direction substantially influenced the deposited position of the droplets. Large droplets with diameters of 500–1000 μm were rapidly deposited on the ground due to the effect of gravity, and their travel distances were shorter than 3 m. Over time, medium droplets are deposited on the ground downstream up to the outlet of the computational domain. Symmetrical depositions were observed for particles in the 0° wind direction. Certain small droplets with a diameter of 75 μm were deposited on the ground only in the 60° wind direction. In the 150° wind direction, the deposition positions of particles nearly coincided with the x-axis, indicating a lower dispersion area in the spanwise direction.
Air suspended droplets may cause airborne viral transmission through small particles inhalation by susceptible people. Droplets deposited on the ground and body may lead to contact transmission [42,43]. For airborne propagation, this study examined the spatial diffusion of droplets using the spatial diffusion range (SDR), defined as follows:
S D R = i = 1 N ( x i x ¯ ) 2 + ( y i y ¯ ) 2 + ( z i z ¯ ) 2 N
where xi, yi, and zi are the three coordinates of the i’s air-suspended particle, N is the total number of suspended particles, and x ¯ , y ¯ , and z ¯ are the averaged positions of all suspended particles.
The risk of infection may increase when the SDR becomes large. Figure 13a depicts the SDR of different cases at t = 4 s, when the droplets were dispersed widely and some particles began to escape from the computational domain. The droplets’ depositions on the ground and human body result in possible contact transmission, and high deposition may increase the infection risk for susceptible people. Figure 13b displays the particle deposition fraction, which is defined as the number of deposited particles at the end of the simulation divided by the total number of ejections. The particle deposition fraction includes the ground particle deposition fraction (GPDF) and the body particle deposition fraction (BPDF).
The SDRs in the 30° and 180° wind directions were extremely large, conducive to viral spread (as shown in Figure 11b,g). For the 30° wind environment, many small droplets were located in the distribution band and remained in the domain for an extended period. In the 180° wind environment, droplets spread widely and floated slowly in the air due to reverse flow downstream of the manikin. In this situation, people have a greater likelihood of inhaling virus-carrying droplets. In the 0° and 120° wind directions, fewer droplets floated in the distribution band, and most droplets traveled in groups through space; thus, the SDR value was extremely small.
Droplets’ depositions on the manikin and ground were greatest for the 0° wind environment because some droplets sprayed from the mouth were carried back to the manikin by the oncoming wind and the remaining particles had more potential travel distance before escaping from the domain. In the 90° and 120° wind environments, no droplets were deposited on the manikin body, because the droplets were blown directly downstream after being ejected by the mouth. Deposition on the ground was also small because droplets moved rapidly and escaped from the domain before they could deposit on the ground. Overall, the risk of airborne viral transmission was greatest in the 30° and 180° wind environments. However, the risk of viral contact transmission was greatest in the 0° wind direction due to the high number of droplets on the manikin body. As the airborne transmission of SARS-CoV-2 is the primary route of long-distance transmission, the 30° and 180° cases should be given the most attention. In the 90° and 120° wind environments, the infection risk was relatively small for both transmission modes.
Figure 14a depicts the deposition time on the ground for particles with different diameters in various wind directions. Droplets larger than 100 µm in diameter were deposited on the ground in all wind environments. Droplets whose diameters were equal to 100 μm were not deposited on the ground at all in the 0° wind environment because most of them were blown back to the manikin body by the oncoming wind. Large droplets with diameters between 500 and 1000 μm had a similar deposition time in all cases. Furthermore, the times until first and final deposition increased as particle diameter decreased. In the 60° wind environment, droplets deposited rapidly and some small droplets with a diameter of 75 μm were also deposited due to the downward flow caused by the body’s flow disturbance. In the 180° wind environment, the starting deposition time was late and the deposition duration was long for medium particles (100–150 μm) due to the reverse flow downstream of the manikin.
We also recorded the escape time from the simulation domain outlet. Figure 14b shows the time for the first and last particle to escape from the domain in different wind directions and the average escape time. The gaps between tmin and tmean were small for all cases, indicating that most particles floated in groups and escaped from the simulation domain within a short time. The different moving speeds of droplets in the distribution band resulted in a sizeable difference between tmin and tmax. The time that the last droplet escaped from the domain was late in the 30°, 150°, and 180° wind fields. Both tmin and tmax were the smallest for the 90° wind environment, indicating rapid particle transmission downstream from the manikin. This could cause infection risk during short exposure.

4. Conclusions

This study examined the influence of coughing intensity, droplet ejection velocity, and wind direction on the transmission of respiratory droplets generated by coughing. The Euler–Lagrange method was adopted to calculate airflow as the continuous phase and track the trajectories of droplets as the discrete phase. The transportation mechanism of particles with different diameters was discussed under diverse wind conditions, and the infection risk of COVID-19 was evaluated.
Wind speed and coughing intensity substantially influenced the transmission of small and medium droplets, with little effect on large droplets. Stronger coughing causes virus-carrying droplets to travel farther in calm wind fields and spread widely and rapidly in a windy environment. Even with stronger coughing, the droplets were not transported far without ambient wind. The particle ejection velocity only affected large droplets, and they can be disregarded because small and medium droplets dominate airborne viral transmission.
The wind directions greatly influenced droplets dispersion in windy environments. Large droplets fell to the ground rapidly, and their landing position and travel time were similar in all cases. Medium droplets were transmitted downstream from the manikin in groups and fell to the ground over time. The times to first deposition and the deposition duration increased with decreased particle diameters. Except for the wind environment at 60° and 90°, a long distribution band of small droplets was formed and slowly drifted out of the simulation domain.
Lastly, the transmission risk in different wind directions was evaluated. In the 0° wind environment the viral transmission risk through contact is high. The spatial diffusion range was very large in the 30° and 180° wind environments, as many droplets remained in the simulation domain for an extended period; this creates a high infection risk through airborne transmission. In both 60° and 90° wind environments, the virus-containing droplets moved rapidly, and some droplets were transported above the head. This may cause infection risk during the brief exposure. In the 180° wind field, the droplets spread widely and traveled slowly because of the reverse flow downstream of the manikin. This could cause a high infection risk for susceptible people during extended exposure. This study indicated that the virus-containing droplets were mainly suspended in a narrow zone in the wake of an infected patient. A person can avoid being infected if he/she stands at the two sides of the wake.
This study can help epidemic management departments understand how wind influences droplet transmission, thus potentially reducing viral infection risk for people exposed to hazardous environments. However, this study has several limitations. The droplets were treated as inert, and the influences of temperature, humidity, and the collisions between particles were neglected. This study only investigated the transmission of droplets generated from coughing. Viral transmission from talking and breathing also warrants attention because respiratory diseases such as COVID-19 have extremely high infectivity. Large-eddy simulations are necessary to be conducted to capture more turbulent statistics of both the wind flow and particle dispersion. Further studies are also needed to assess droplet transmission between two people.

Author Contributions

Conceptualization, G.J. and T.H.; funding acquisition, G.J.; investigation, F.L. and G.J.; supervision, G.J.; writing—original draft preparation, F.L.; writing—review and editing, G.J. and T.H. All authors have read and agreed to the published version of the manuscript.

Funding

This study was funded by the National Natural Science Foundation of China (Grant No. 42175102) and the Natural Science Foundation of Guangdong Province, China (Grant No. 2021A1515010753).

Institutional Review Board Statement

Not applicable.

Informed Consent Statement

Not applicable.

Data Availability Statement

Raw data are not publicly available; data requests can be made to the corresponding author.

Acknowledgments

We thank Zhu Fang for his technical support in studying particle transmission.

Conflicts of Interest

The authors declare no conflict of interest.

References

  1. Wells, W.F. On Air-borne Infection. Study II. Droplets and Droplet Nuclei. Am. J. Epidemiol. 1934, 20, 611–618. [Google Scholar] [CrossRef]
  2. Chen, W.; Zhang, N.; Wei, J.; Yen, H.-L.; Li, Y. Short-range airborne route dominates exposure of respiratory infection during close contact. Build. Environ. 2020, 176, 106859. [Google Scholar] [CrossRef]
  3. Cheng, C.H.; Chow, C.L.; Chow, W.K. Trajectories of large respiratory droplets in indoor environment: A simplified approach. Build. Environ. 2020, 183, 107196. [Google Scholar] [CrossRef] [PubMed]
  4. Loudon, R.G.; Roberts, R.M. Relation between the Airborne Diameters of Respiratory Droplets and the Diameter of the Stains left after Recovery. Nature 1967, 213, 95–96. [Google Scholar] [CrossRef]
  5. Morawska, L.J.G.R.; Johnson, G.R.; Ristovski, Z.D.; Hargreaves, M.; Mengersen, K.; Corbett, S.; Chao, C.Y.H.; Li, Y.; Katoshevski, D. Size distribution and sites of origin of droplets expelled from the human respiratory tract during expiratory activities. J. Aerosol Sci. 2009, 40, 256–269. [Google Scholar] [CrossRef] [Green Version]
  6. Papineni, R.S.; Rosenthal, F.S. The Size Distribution of Droplets in the Exhaled Breath of Healthy Human Subjects. J. Aerosol Med. 1997, 10, 105–116. [Google Scholar] [CrossRef] [PubMed]
  7. Xie, X.; Li, Y.; Sun, H.; Liu, L. Exhaled droplets due to talking and coughing. J. R. Soc. Interface 2009, 6, S703–S714. [Google Scholar] [CrossRef] [PubMed] [Green Version]
  8. Bourouiba, L.; Dehandschoewercker, E.; Bush, J.W.M. Violent expiratory events: On coughing and sneezing. J. Fluid Mech. 2014, 745, 537–563. [Google Scholar] [CrossRef]
  9. Chao, C.Y.H.; Wan, M.P.; Morawska, L.; Johnson, G.R.; Ristovski, Z.D.; Hargreaves, M.; Mengersen, K.; Corbett, S.; Li, Y.; Xie, X.; et al. Characterization of expiration air jets and droplet size distributions immediately at the mouth opening. J. Aerosol Sci. 2009, 40, 122–133. [Google Scholar] [CrossRef] [PubMed] [Green Version]
  10. Chen, X.; Feng, Y.; Zhong, W.; Kleinstreuer, C. Numerical investigation of the interaction, transport and deposition of multicomponent droplets in a simple mouth-throat model. J. Aerosol Sci. 2017, 105, 108–127. [Google Scholar] [CrossRef]
  11. Feng, Y.; Kleinstreuer, C.; Castro, N.; Rostami, A. Computational transport, phase change and deposition analysis of inhaled multicomponent droplet–vapor mixtures in an idealized human upper lung model. J. Aerosol Sci. 2016, 96, 96–123. [Google Scholar] [CrossRef] [Green Version]
  12. Haghnegahdar, A.; Zhao, J.; Feng, Y. Lung aerosol dynamics of airborne influenza A virus-laden droplets and the resultant immune system responses: An in silico study. J. Aerosol Sci. 2019, 134, 34–55. [Google Scholar] [CrossRef] [PubMed]
  13. Zhu, H.; Su, J.; Wei, X.; Han, Z.; Zhou, D.; Wang, X.; Bao, Y. Numerical Simulation of Haze-Fog Particle Dispersion in the Typical Urban Community by Using Discrete Phase Model. Atmosphere 2020, 11, 381. [Google Scholar] [CrossRef] [Green Version]
  14. Liu, Z.; Liu, H.; Rong, R.; Cao, G. Effect of a circulating nurse walking on airflow and bacteria-carrying particles in the operating room: An experimental and numerical study. Build. Environ. 2020, 186, 107315. [Google Scholar] [CrossRef]
  15. Liu, Z.; Wang, L.; Rong, R.; Fu, S.; Cao, G.; Hao, C. Full-scale experimental and numerical study of bioaerosol characteristics against cross-infection in a two-bed hospital ward. Build. Environ. 2020, 186, 107373. [Google Scholar] [CrossRef]
  16. Liu, Z.; Zhuang, W.; Hu, L.; Rong, R.; Li, J.; Ding, W.; Li, N. Experimental and numerical study of potential infection risks from exposure to bioaerosols in one BSL-3 laboratory. Build. Environ. 2020, 179, 106991. [Google Scholar] [CrossRef]
  17. Zhou, Y.; Ji, S. Experimental and numerical study on the transport of droplet aerosols generated by occupants in a fever clinic. Build. Environ. 2020, 187, 107402. [Google Scholar] [CrossRef] [PubMed]
  18. Gupta, J.K.; Lin, C.-H.; Chen, Q. Transport of expiratory droplets in an aircraft cabin. Indoor Air 2011, 21, 3–11. [Google Scholar] [CrossRef]
  19. Yan, Y.; Li, X.; Yang, L.; Yan, P.; Tu, J. Evaluation of cough-jet effects on the transport characteristics of respiratory-induced contaminants in airline passengers’ local environments. Build. Environ. 2020, 183, 107206. [Google Scholar] [CrossRef]
  20. Zhang, L.; Li, Y. Dispersion of coughed droplets in a fully-occupied high-speed rail cabin. Build. Environ. 2012, 47, 58–66. [Google Scholar] [CrossRef]
  21. He, Q.; Niu, J.; Gao, N.; Zhu, T.; Wu, J. CFD study of exhaled droplet transmission between occupants under different ventilation strategies in a typical office room. Build. Environ. 2011, 46, 397–408. [Google Scholar] [CrossRef] [PubMed]
  22. Li, H.; Zhong, K.; Zhai, Z. Investigating the influences of ventilation on the fate of particles generated by patient and medical staff in operating room. Build. Environ. 2020, 180, 107038. [Google Scholar] [CrossRef]
  23. Fiorillo, L.; Meto, A.; Cicciù, F.; De Stefano, R. An Eventual Sars-CoV-2 Infection Prevention Protocol in the Medical Setting and Dental Office. Int. J. Environ. Res. Public Health 2021, 18, 2593. [Google Scholar] [CrossRef]
  24. Dbouk, T.; Drikakis, D. On coughing and airborne droplet transmission to humans. Phys. Fluids 2020, 32, 053310. [Google Scholar] [CrossRef] [PubMed]
  25. Li, H.; Leong, F.Y.; Xu, G.; Ge, Z.; Kang, C.W.; Lim, K.H. Dispersion of evaporating cough droplets in tropical outdoor environment. Phys. Fluids 2020, 32, 113301. [Google Scholar] [CrossRef] [PubMed]
  26. Yang, X.; Yang, H.; Ou, C.; Luo, Z.; Hang, J. Airborne transmission of pathogen-laden expiratory droplets in open outdoor space. Sci. Total Environ. 2021, 773, 145537. [Google Scholar] [CrossRef] [PubMed]
  27. Feng, Y.; Marchal, T.; Sperry, T.; Yi, H. Influence of wind and relative humidity on the social distancing effectiveness to prevent COVID-19 airborne transmission: A numerical study. J. Aerosol Sci. 2020, 147, 105585. [Google Scholar] [CrossRef] [PubMed]
  28. Scarano, A.; Inchingolo, F.; Rapone, B.; Festa, F.; Tari, S.R.; Lorusso, F. Protective Face Masks: Effect on the Oxygenation and Heart Rate Status of Oral Surgeons during Surgery. Int. J. Environ. Res. Public Health 2021, 18, 2363. [Google Scholar] [CrossRef] [PubMed]
  29. Diouf, I.; Sy, S.; Senghor, H.; Fall, P.; Diouf, D.; Diakhaté, M.; Thiaw, W.M.; Gaye, A.T. Potential Contribution of Climate Conditions on COVID-19 Pandemic Transmission over West and North African Countries. Atmosphere 2021, 13, 34. [Google Scholar] [CrossRef]
  30. Yang, S.; Lee, G.W.; Chen, C.-M.; Wu, C.-C.; Yu, K.-P. The Size and Concentration of Droplets Generated by Coughing in Human Subjects. J. Aerosol Med. 2007, 20, 484–494. [Google Scholar] [CrossRef] [PubMed]
  31. Zhu, S.; Kato, S.; Yang, J.-H. Study on Transport Characteristics of Saliva Droplets Produced by Coughing in a Calm Indoor Environment. Build. Environ. 2006, 41, 1691–1702. [Google Scholar] [CrossRef]
  32. Murakami, S. Comparison of various turbulence models applied to a bluff body. J. Wind. Eng. Ind. Aerodyn. 1993, 46–47, 21–36. [Google Scholar] [CrossRef]
  33. Tominaga, Y.; Mochida, A.; Murakami, S.; Sawaki, S. Comparison of various revised k–ε models and LES applied to flow around a high-rise building model with 1:1:2 shape placed within the surface boundary layer. J. Wind Eng. Ind. Aerodyn. 2008, 96, 389–411. [Google Scholar] [CrossRef]
  34. Kato, M.; Launder, B.E. The modelling of turbulent flow around stationary and vibrating square cylinders. In Proceedings of the 9th Symposium on Turbulent Shear Flow, Kyoto, Japan, 16–18 August 1993; Volume 10, pp. 1–6. [Google Scholar]
  35. Shirasawa, T.; Endo, Y.; Yoshie, R.; Mochida, A.; Tanaka, H. Comparison of les and durbin type k-ε model for gas diffusion in weak wind region behind a building. J. Environ. Eng. 2008, 73, 615–622. [Google Scholar] [CrossRef] [Green Version]
  36. Tanaka, H.; Yoshie, R.; Hu, C.H. Uncertainty in measurements of velocity and concentration around a building. In Proceedings of the 4th International Symposium on Computational Wind Engineering, Yokohama, Japan, 16–19 July 2006. [Google Scholar]
  37. Li, C.; Ito, K. Numerical and experimental estimation of convective heat transfer coefficient of human body under strong forced convective flow. J. Wind Eng. 2014, 126, 107–117. [Google Scholar] [CrossRef]
  38. Duguid, J.P. The size and the duration of air-carriage of respiratory droplets and droplet-nuclei. Epidemiol. Infect. 1946, 44, 471–479. [Google Scholar] [CrossRef] [PubMed] [Green Version]
  39. Yang, L.; Li, X.; Yan, Y.; Tu, J. Effects of cough-jet on airflow and contaminant transport in an airliner cabin section. J. Comput. Multiph. Flows 2017, 10, 72–82. [Google Scholar] [CrossRef]
  40. Gupta, J.K.; Lin, C.-H.; Chen, Q. Flow dynamics and characterization of a cough. Indoor Air 2009, 19, 517–525. [Google Scholar] [CrossRef]
  41. Lu Phuong, N.; Ito, K.; Onishi, S.; Aramaki, S. Numerical Prediction of Aerosol Transport in Vertical Duct with Lagrangian Particle Tracking Method. Trans. Soc. Heat. Air-Cond. Sanit. Eng. Jpn. 2012, 37, 27–35. [Google Scholar]
  42. Drossinos, Y.; Stilianakis, N.I. What aerosol physics tells us about airborne pathogen transmission. Aerosol. Sci. Technol. 2020, 54, 639–643. [Google Scholar] [CrossRef]
  43. Weber, T.P.; Stilianakis, N.I. Inactivation of influenza A viruses in the environment and modes of transmission: A critical review. J. Infect. 2008, 57, 361–373. [Google Scholar] [CrossRef] [PubMed]
Figure 1. The simulation domain and correlations between the wind tunnel experiment and the LK model: (a) diagram of the simulation domain; (b) normalized streamwise velocity; (c) normalized pollutant concentration.
Atmosphere 13 00594 g001
Figure 2. The computational domain with a standing virtual manikin and the meshes on the manikin’s surface and around the body.
Atmosphere 13 00594 g002
Figure 3. Vertical distributions of the velocity magnitude at 0.5 m downstream of the manikin body.
Atmosphere 13 00594 g003
Figure 4. Droplet size and jet distribution of a cough: (a) cough droplet size distribution; (b) transient airflow rate of cough jet.
Atmosphere 13 00594 g004
Figure 5. Definition of wind directions.
Atmosphere 13 00594 g005
Figure 6. Flow fields of the cough jet in a calm wind environment: (a) standard cough jet at different times; (b) double-strength cough jet at different times.
Atmosphere 13 00594 g006
Figure 7. Wind fields of different cough conditions under Vin = 1.8 m/s: (a) standard cough jet at different times; (b) double-strength cough jet at different times.
Atmosphere 13 00594 g007
Figure 8. Droplet dispersions at different times in different wind environments: (a) Case 1 (no wind, standard cough jet, VP = 2.9 m/s); (b) Case 2 (no wind, double-strength cough jet, VP = 2.9 m/s); (c) Case 3 (Vin = 1.8 m/s, standard cough jet, VP = 2.9 m/s); (d) Case 4 (Vin = 1.8 m/s, double-strength cough jet, VP = 2.9 m/s); (e) Case 5 (no wind, standard cough jet, VP = 6 m/s).
Atmosphere 13 00594 g008aAtmosphere 13 00594 g008b
Figure 9. Travel distance of droplets with different diameters in the x-direction at time t = 1 s.
Atmosphere 13 00594 g009
Figure 10. The x velocity contour and two-dimensional streamlines at plane z = 1.554 m under different wind directions (0°, 30°, 60°, 90°, 120°, 150°, and 180°).
Atmosphere 13 00594 g010aAtmosphere 13 00594 g010b
Figure 11. Side and top views of particulate distributions at various times in different wind directions: (a) 0°, (b) 30°, (c) 60°, (d) 90°, (e) 120°, (f) 150°, and (g) 180°.
Atmosphere 13 00594 g011
Figure 12. Deposition positions of droplets on the ground in different wind directions: (a) 0°, (b) 30°, (c) 60°, (d) 90°, (e) 120°, (f) 150°, and (g) 180°.
Atmosphere 13 00594 g012
Figure 13. Spatial diffusion range of the droplets and the deposition fraction under different conditions: (a) the droplets’ spatial diffusion range at t = 4 s; (b) the droplets’ deposition rates on the ground and manikin body at the end of the simulation.
Atmosphere 13 00594 g013
Figure 14. Ground deposition times and domain escape times: (a) ground deposition time of droplets of various sizes in different wind directions; (b) the maximum, minimum, and average escape times in different wind fields.
Atmosphere 13 00594 g014
Publisher’s Note: MDPI stays neutral with regard to jurisdictional claims in published maps and institutional affiliations.

