Article

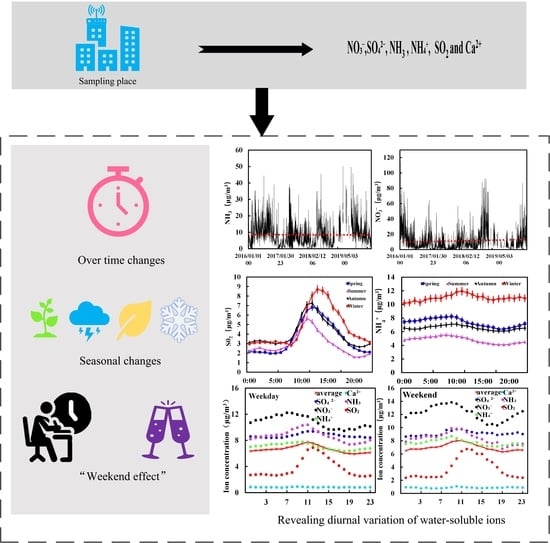
Analysis of the Diurnal Changes in the Water-Soluble Ion Concentration in Wuhan between 2016 and 2019

1
Hubei Key Laboratory of Regional Development and Environmental Response, Hubei University, Wuhan 430062, China
2
Hubei Key Laboratory of Petroleum Geochemistry and Environment, Yangtze University, Wuhan 430100, China
3
College of Resources and Environment, Yangtze University, Wuhan 430100, China
4
Hubei Ecological Environment Monitoring Center Station, Wuhan 430070, China
*
Authors to whom correspondence should be addressed.
Atmosphere 2022, 13(4), 582; https://doi.org/10.3390/atmos13040582
Submission received: 23 February 2022 / Revised: 25 March 2022 / Accepted: 2 April 2022 / Published: 4 April 2022

Abstract

:
This study uses online monitoring data from the Hubei Environmental Monitoring Center’s Atmospheric Compound Pollution Automatic Monitoring Station from 2016 to 2019 to analyze the diurnal changes in the concentration of water-soluble ions in particulate matter in Wuhan. During the study period, the concentrations of SO2, NO3, and SO42− changed significantly, while those of NH4+, NH3, and Ca2+ exhibited minimal differences. SO2 and NO3 showed an annually increasing trend, while NH4+ and SO42− exhibited an annually decreasing trend. The ion concentration was generally higher in the winter and spring and lower in the summer and autumn. The concentration of water-soluble ions was generally higher during the day than at night. However, the “weekend effect” on the change in ion concentrations was substantial and higher during the day than at night. This effect was the strongest for NO3 and the weakest for NH3. These changes in the weekend effect of water-soluble ions in particulate matter clearly revealed the impact of periodic human activities on atmospheric pollution. Taken together, the results of this novel study reveal the diurnal pollution characteristics and “weekend effect” of water-soluble ions with high concentrations in atmospheric aerosols in Wuhan over a four-year period, thus providing relevant insights for Wuhan’s atmospheric mitigation plan.

Graphical Abstract

1. Introduction

In recent years, with the accelerating economic growth and urbanization in China, environmental issues, including air pollution, have become increasingly severe while the people’s demand for an improved quality of life and environment has greatly increased [1]. According to the “Bulletin of the State of China’s Ecological Environment” [2], from 2016 to 2019, 338 cities across the country were at, or above, the prefecture level (note that Laiwu City was merged into Jinan City in 2019; therefore, the total number of cities was 337). From 2016 to 2019, the proportions of cities that exceeded the ambient air quality standard were 75.1%, 70.7%, 64.2%, and 53.4%, respectively, and severe pollution occurred in all cities for 2464, 2311, 1899, and 452 days, respectively. Particles with a diameter of 2.5 µm and 10 µm (PM2.5 and PM10, respectively) have become the primary pollutants causing air pollution in China. Atmospheric particulate matter can shorten the life span and increase morbidity [3]. Furthermore, a causal relationship was found between atmospheric PM2.5 exposure and cardiovascular morbidity and mortality [4]. PM2.5 also has acute adverse effects on the lung function of young healthy adults [5]. Moreover, the water-soluble ions in PM can directly affect the acidity of atmospheric precipitation and have an impact on atmospheric visibility, air quality, and human health [6,7].
Water-soluble inorganic ions (WSIIs) are major components of PM2.5 in which sulfate, nitrate, and ammonium, known as secondary inorganic aerosols, predominate [8]. To date, the contribution of WSIIs to air pollution has been intensively studied in many cities in order to reduce PM levels. Meng [9] reported a WSII concentration of 63.1 ± 35.3 μg/m3, accounting for approximately 45.3% of the total PM2.5 mass in Handan city, Hebei province, China. Hu [10] found that the average concentration of WSIIs was 44 μg/m3, accounting for 38% of the total PM2.5 mass in Beijing, China. Moreover, Zhang [11] reported that the concentration of secondary inorganic aerosols increased significantly during the haze period, implying a greater contribution of secondary inorganic aerosols to the severe PM2.5 pollution. The relative abundance of ions determines the hygroscopicity of aerosols and may aggravate the impairment of visibility [12]. Furthermore, these ions can increase the toxicity potential of organic compounds, such as polycyclic aromatic hydrocarbons (PAHs) and n-alkanes, by increasing their solubility and acting as surfactants [13]. In fact, Qiu [14] studied the seasonal characteristics of water-soluble ions in PM2.5 in Jiangbei New Area, Nanjing and found that the concentration of water-soluble ions followed the same fluctuating trend throughout the four seasons; however, higher concentrations were detected in the winter while lower concentrations occurred in the summer. Zhang [15] further revealed the characteristics and sources of the chemical components of PM2.5 during the winter in Jiashan and found that the PM2.5 levels were 2.6 times those in the cleaning period and the sulfur and nitrogen conversion rates during the pollution period were higher than those during the cleaning period. Thus, PM, which is a complex mixture of particles and liquid droplets in the air, is a key traffic-related air pollutant in urban environments [16].
Although air pollution control has never ceased, the poor air quality in Wuhan remains a relatively serious issue, with a particular increase in the number of mixed air pollution days [17]. Indeed, PM has become the primary air pollutant in Wuhan. Fine particles remain in the air for a long time and can produce toxic substances that pose a significant threat to the air quality and human health. Water-soluble ions represent the main components of PM, with their proportion generally exceeding 50% [18]. In recent years, with the joint efforts of citizens, the atmospheric environmental issues in Wuhan have improved; however, the development prospects remain unclear. Moreover, research on water-soluble ions has primarily focused on changes in spatiotemporal characteristics and source analysis. Therefore, the current study applied hourly time data to reveal the diurnal characteristics of water-soluble ions in Wuhan city from a novel “weekend effect” research perspective.

2. Materials and Methods

2.1. Overview of the Research Area

Wuhan is located at 29°58’–31°22’ N and 113°41’–115°05’ E in the eastern region of Hubei province and extends to the Yangtze River. Wuhan has a northern subtropical monsoon climate, with abundant rainfall and sufficient heat, with rain and heat occurring in the same season. According to the “Bulletin of the State of the Ecological Environment in Wuhan” [19], there were 237, 255, 249, and 245 days with good ambient air quality and 129, 110, 106, and 120 polluted days in Wuhan in 2016, 2017, 2018, and 2019, respectively. The primary pollutant was PM2.5 for 87 (67.4%), 68 (61.8%), 53 (50.0%), and 38 (31.7%) days in 2016, 2017, 2018, and 2019, respectively, while PM10 served as the primary pollutant for 4 (3.1%), 3 (2.7%), 10 (9.4%), and 2 (1.7%) days in 2016, 2017, 2018, and 2019, respectively.

2.2. Sampling Site and Data Selection

As shown in Figure 1, the sampling site for this study was established in the Hongshan District of Wuhan City, on the roof of the Hubei Environmental Monitoring Center Station (30.54° N, 114.37° E), approximately 20 m above the ground. The surrounding terrain is flat and densely populated, with high traffic flow; thus, it represents a typical urban residential area. The data used in this research were obtained from the monitoring site. Among the eight PM water-soluble ions and five gases that are monitored by the superstation, four water-soluble ions and two gases were selected from 2016 to 2019. The “2 + 2 + 2” combination method was employed, including two anions (NO3 and SO42−), two cations (Ca2+ and NH4+), and two gases (SO2 and NH3).

2.3. Research Methods

In this study, the online gas composition and aerosol monitoring system of the Hubei Environmental Monitoring Center (MARGAL Metrohm) was used to monitor water-soluble ions in the PM in Wuhan. MARGAL is composed of three main parts: a sampling system, a control system, and an analysis system [20]. The principle of the instrument is as follows: Air is pumped into the sampling tube where the cyclone cutter can screen the particle sizes. Once the screened sample enters the sampling box, the soluble gas is quantitatively absorbed by, and passed through, the wet rotating diffusion tube (WRD), at which point it is captured by the steam jet aerosol collector (SJAC). The vapor injection creates a supersaturated environment that condenses and turns the growing particles into a liquid sample. The samples from the WRD and SJAC are quantitatively collected into a syringe pump in the analytical chamber within 1 h and analyzed by quantitative loop injection ion chromatography.
The time-by-time data monitored by MARGAL were aggregated in Microsoft Excel to analyze the four-year trend of the selected samples. The ion data from each season, defined meteorologically as spring (March to May), summer (June to August), autumn (September to November), and winter (December to January), were summarized for all four years at the same time points to reflect the diurnal variation in ion concentrations in different seasons.
In addition to the monthly data, the weekday (Monday to Friday) and weekend (Saturday and Sunday) data were assessed separately to facilitate analysis of the “weekend effect” on water-soluble ions. After the data processing was completed, Microsoft Excel was used to create line graphs of the temporal and seasonal changes in water-soluble ions, and scatter plots were produced to illustrate the trends of the “weekend effect”. Cleveland [21] delimited the size of the weekend effect as:
w = C weekend C weekday    
Weekend   effect   index = C weekend   C weekday / C weekday × 100 %
where w is the magnitude of the weekend effect and Cweekend and Cweekday are the four-year average concentrations of ions on weekends and weekdays, respectively.
To further explain the cause of changes in ion concentrations, the correlation between ions was calculated via Spearman’s correlation analysis. Importantly, the correlation between water-soluble ions characterizes their existing forms and sources in the atmosphere.

3. Results and Discussion

3.1. Concentration of Water-Soluble Ions over Time

A total of 26,840 h of ion data were collected throughout the study period. The effective collection rates of SO2, NH3, NO3, SO42−, NH4+, and Ca2+ were 85.88%, 86.01%, 83.72%, 86.12%, 86.32%, and 85.73%, respectively. The average concentration of the four water-soluble ions and two gases during the sampling period was 6.855 μg/m3, with SO42−, NO3, and NH4+ (collectively referred to as SNA) being the most abundant. These results are consistent with those of Shi et al. [22]. During the sampling period, the ratio of the mass concentration of SNA to the total water-soluble ion content in Wuhan (excluding HCl, HNO2, HNO3, SO2, and NH3) was 88.37%. Compared with other cities, the level in Wuhan was higher than that in Ho Chi Minh City, Vietnam and lower than that in Osaka, Japan [23]. Fine particulate matter mostly consisting of secondary inorganic aerosols is formed from gaseous precursors either through gas phase chemistry and growth by coagulation or through an aqueous-phase chemical transformation with particles left suspended after evaporation of the liquid [24]. For example, ammonium bisulfate (NH4HSO4) and ammonium sulfate (NH4)2SO4 are produced by the reaction of ammonia (NH3) and sulfur dioxide (SO2) in the gas phase. Most of these aerosols are of the scattering type and primarily derived from human activities [25].
To reflect the changes in water-soluble ion concentrations in Wuhan more intuitively, the monitoring data for each time point were summarized and analyzed. As shown in Figure 2, the most apparent changes in the ion concentrations from 2016 to 2019 were observed for SO42− and NO3. The concentration of SO42− decreased significantly, while that of NO3 increased. Indeed, atmospheric sulfur emissions to the atmosphere in the form of sulfur dioxide (SO2) and sulfate (SO42−) are of growing concern. In many urban areas, SO42− from anthropogenic sources makes up a significant fraction of PM2.5 [26]. Moreover, SO2 reportedly originates primarily from coal combustion emissions, while NOx largely originates from motor vehicle exhaust emissions [27]. As a core city in the Yangtze River Economic Belt, a strategic fulcrum for the development of central China, and an important industrial base in the country, Wuhan has a complete industrial system of iron and steel, automobiles, optoelectronics, chemicals, metallurgy, textiles, shipbuilding, manufacturing, and medicine. This industrial development is primarily by coal, thus accounting for the significantly increased SO2 concentration in Wuhan during the study period. Furthermore, SO2 is a precursor for the secondary conversion of SO42−; however, the concentration trends of these two ions were inconsistent, indicating that the secondary conversion of water-soluble ions in particles is an extremely complicated process. In contrast, the concentrations of NO3, NH3, and Ca2+ did not significantly change over the four years, while that of NH4+ exhibited an overall downward trend.
The time-by-time variation in the concentration of water-soluble ions, excluding NH3, exhibited an initial decreasing trend followed by an increase. Figure 2 shows that the lowest value of the hourly changes in SO2, NO3, and NH4+ and the highest values for NH3 occurred in July or August of each year. From the perspective of interannual changes, the concentration of the various water-soluble ions in 2017 was relatively low.

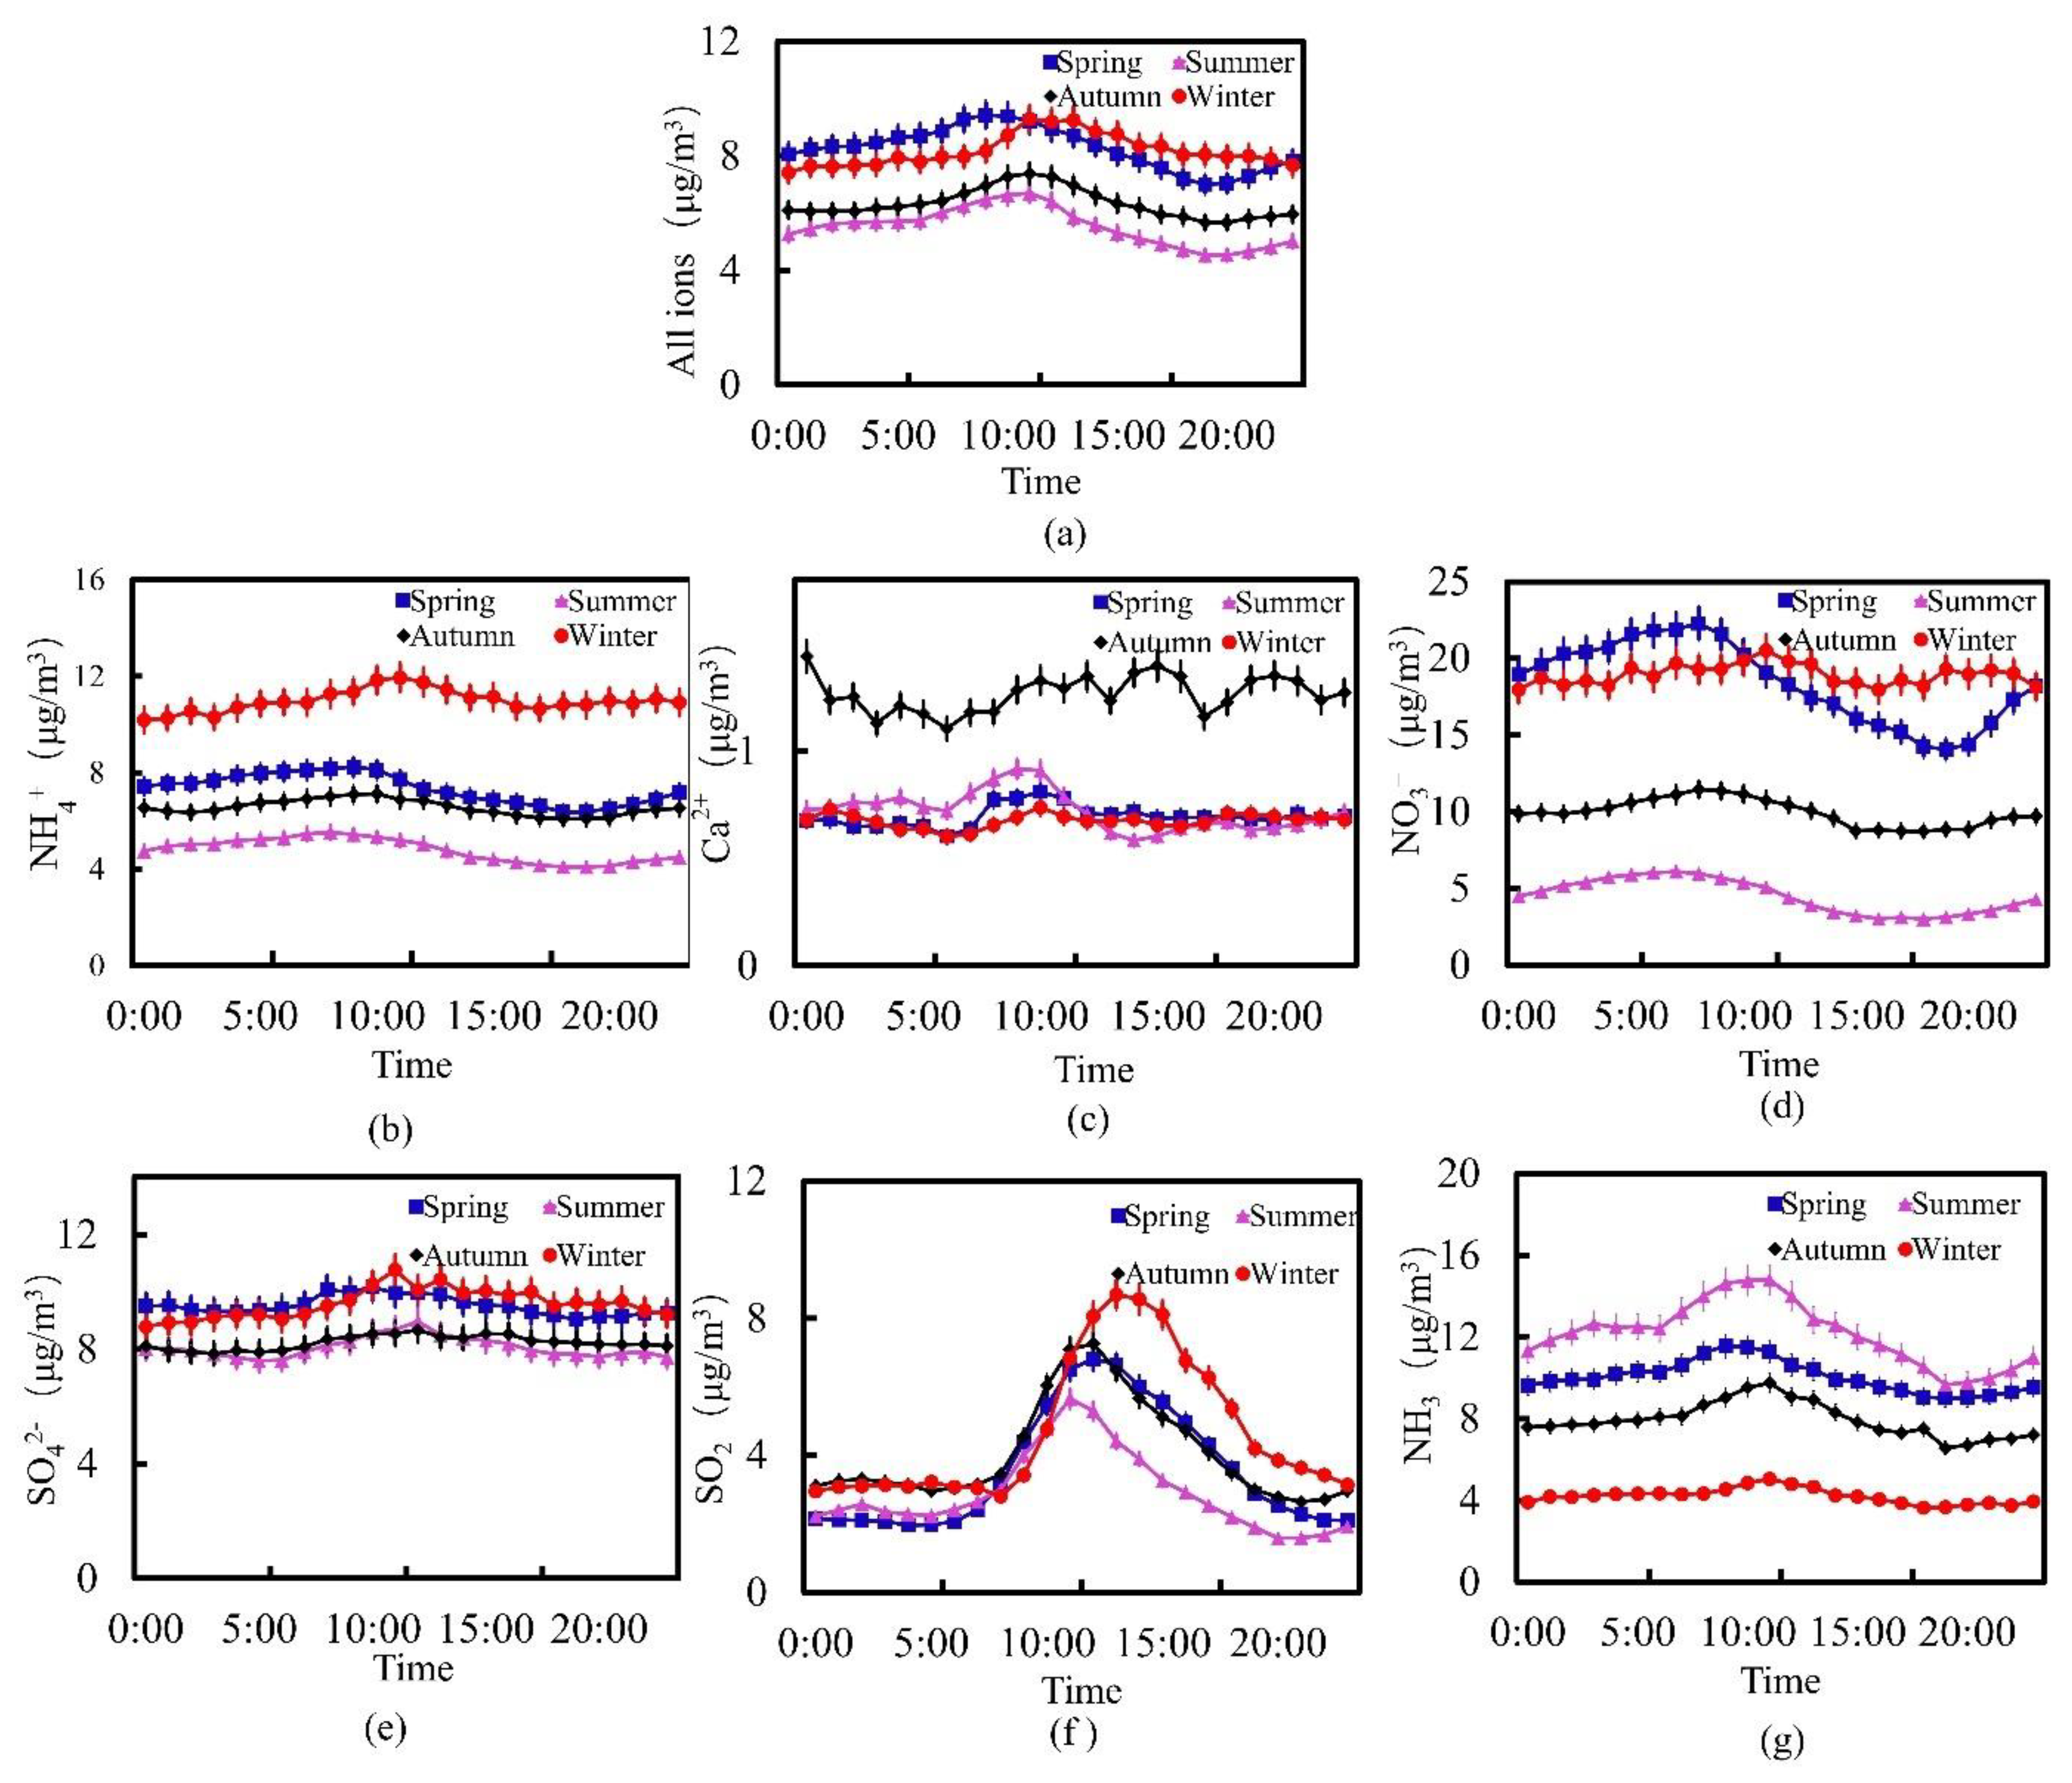
3.2. Seasonal Changes in the Concentration of Water-Soluble Ions

The changes in the PM water-soluble ion concentration were season-dependent (Figure 3a). That is, the ion concentrations were generally higher during the winter and spring seasons and lower during the summer and autumn seasons. Ren [28] analyzed the pollution characteristics and sources of water-soluble ions in Taiyuan City and found that the water-soluble ion contents in atmospheric PM2.5 decreased in the order of winter > autumn > spring > summer. Li [29] studied the characteristics of WSIIs in atmospheric PM2.5 during the later period of Chengdu’s “Air Pollution Prevention Action Plan” and found that the water-soluble ion contents decreased in the order of autumn > winter > spring > summer with the magnitude of the difference between day and night also varying seasonally, indicating that the seasonal variations in the water-soluble ion concentrations also vary geographically.
Among the two cations, the concentration of ammonium ions was higher in autumn and winter, while that of calcium ions was the highest in autumn. Moreover, the concentration of anions was higher in winter and spring. Moreover, both gases exhibited significant seasonal concentration variations. The cold winter increases the anthropogenic emissions, while the meteorological conditions restrict the diffusion of pollutants, causing pollutants to become enriched and the concentrations of water-soluble ions to increase in the PM [18]. For example, Zhang’s research shows that the increase in air humidity and the deterioration of air dispersion conditions in winter are the most important causes of air pollution in Beijing [30]. SNA is the main component of water-soluble ions; the total concentration of the three associated ions in the four seasons, in descending order, is as follows: winter, spring, autumn, and summer. Dunea’s study showed a negative correlation between precipitation events and particulate matter concentrations [31], indicating that, during the rainy summer in Wuhan, the relatively concentrated precipitation promoted the removal of WSIIs from PM2.5.
Changes in the daytime ion concentrations are shown in Table 1. The annual NH4+ concentration exhibited a downward trend, except for winter, during which time it increased with time. Specifically, the NH4+ concentration was the highest in spring before 10:00 and in winter after 10:00. It is worth noting that the annual changes observed in the NO3 concentration were consistent with those for NH4+. The SO2 concentration exhibited the most significant changes during the day and followed a unimodal trend across different seasons. Among them, the earliest peak was observed at 11:00 (5.66 μg/m3) in summer, the latest was at 13:00 (8.70 μg/m3) in winter, and in spring and autumn it peaked at 12:00. At night, the changes in ion concentrations between different seasons were relatively mild (Table 2). Specifically, NH4+, NO3, and NH3 exhibited an upward trend in different seasons. Among them, the concentration of NH4+ and NO3 followed the same trend, with both peaking in winter before 23:00 and in spring after 23:00. Additionally, the overt diurnal variation observed in the sulfur dioxide concentration may be related to human activities and factory emissions during the day.

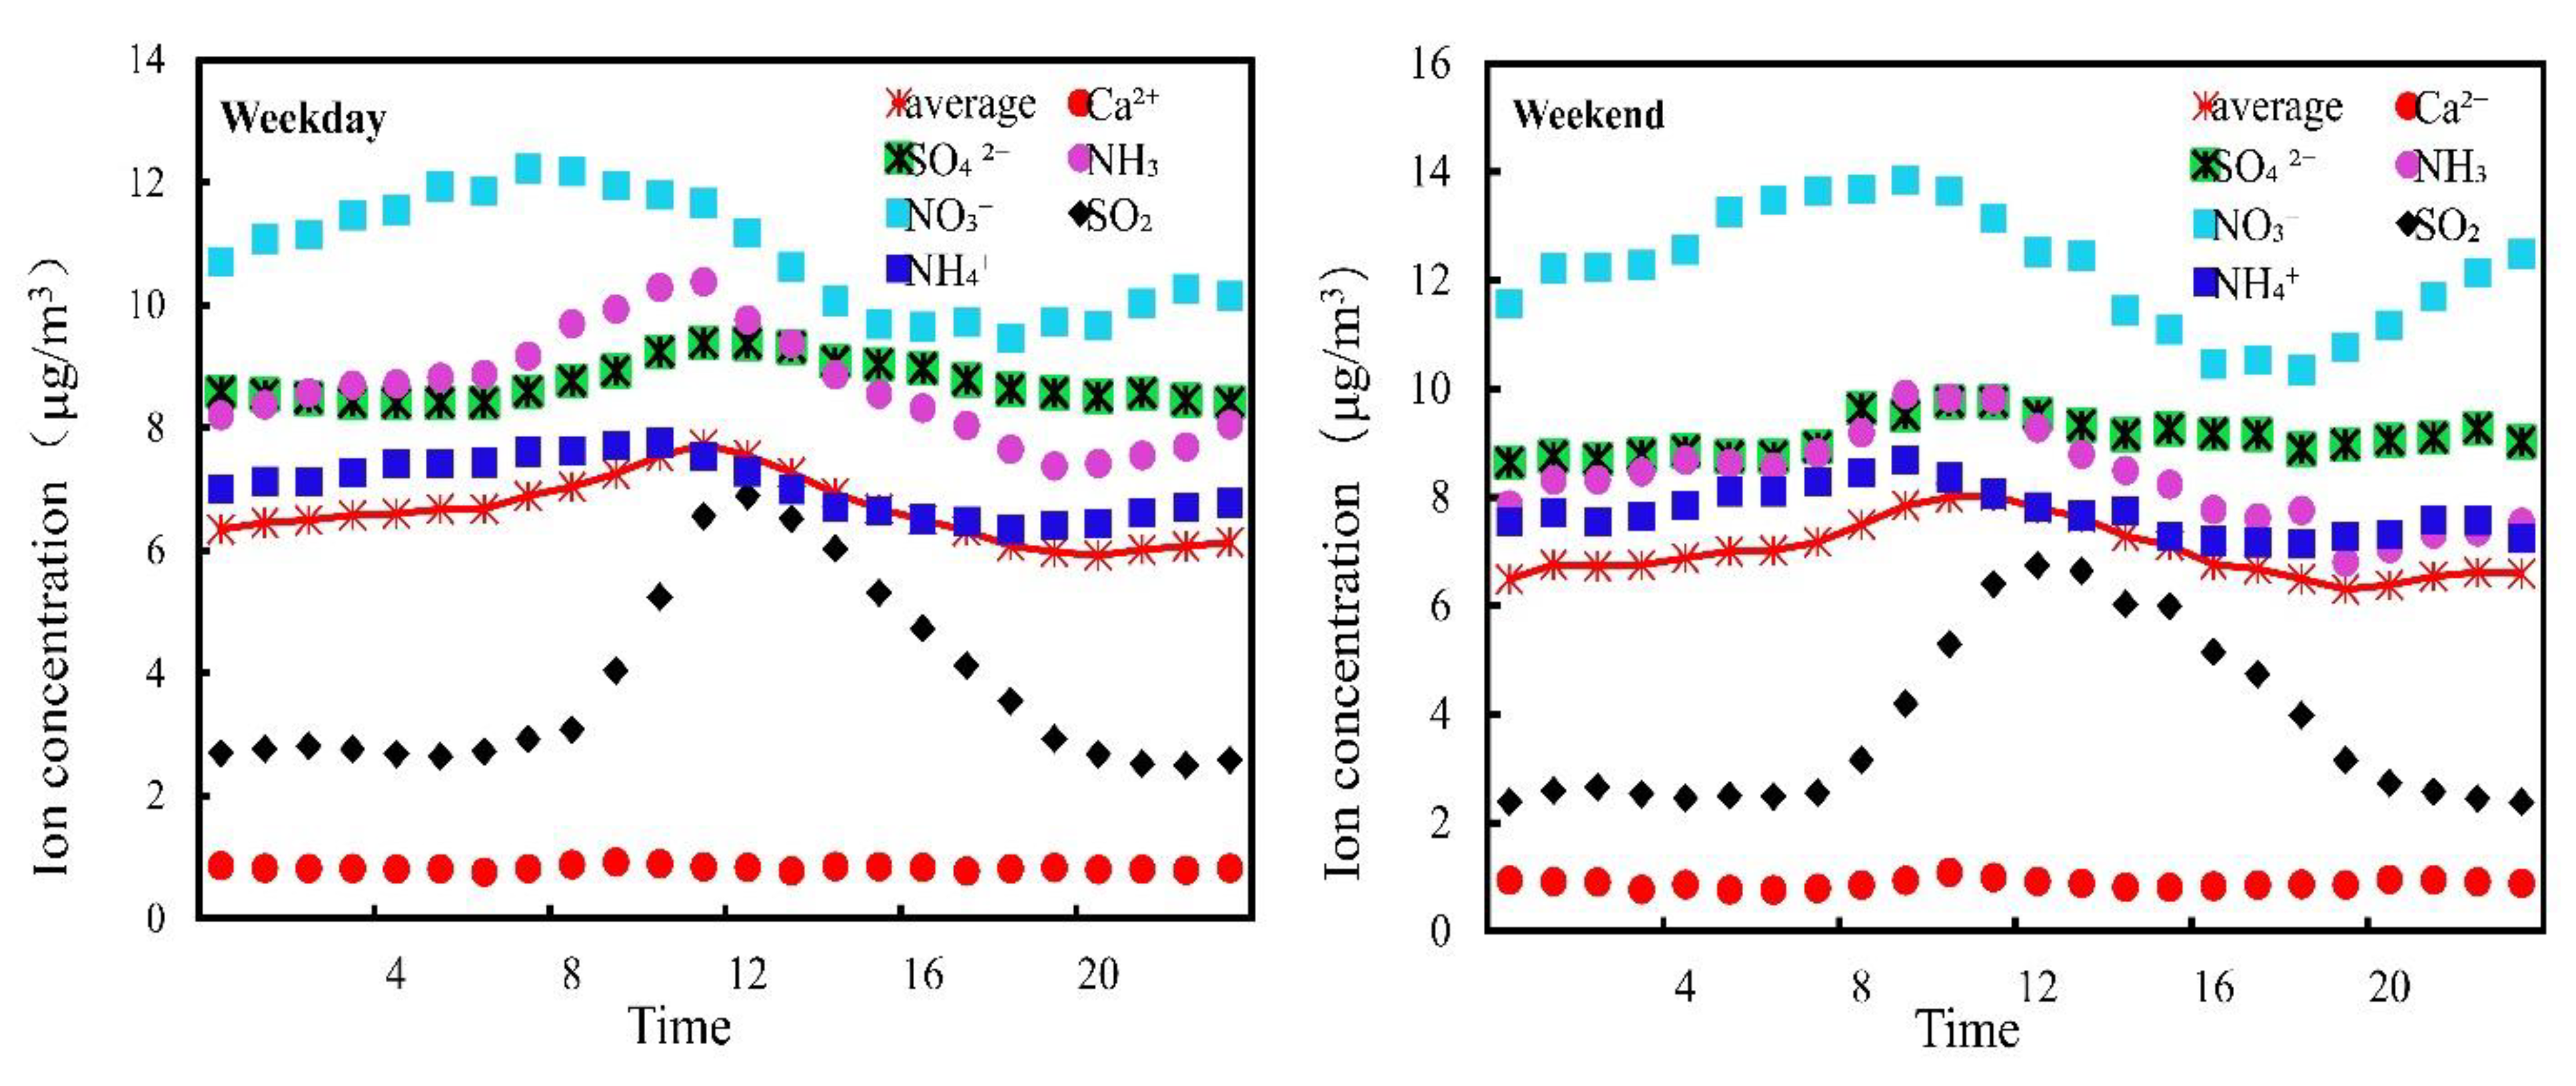
3.3. “Weekend Effect” on the Changes in Water-Soluble Ion Concentration

The “weekend effect” refers to the weekly cyclic effect of the water-soluble ion concentration in the particles, in which the water-soluble ion concentration of the particles is lower during the working day than on the weekend [32].
The weekend effect index of the four water-soluble ions and two gases in Wuhan was calculated. A positive weekend effect occurs when the weekend concentration is greater than the working day concentration, while a negative effect occurs when the weekend concentration is lower than that of the working day [33]. All ions, excluding NH3, exhibited a positive weekend effect, with NO3 having the highest weekend effect index (Table 3). Furthermore, the NO3 concentration rate of the four water-soluble ions in PM also exhibited the largest change (11.25%) between working and non-weekdays, followed by NH4+ (8.87%) and Ca2+ (6.07%). Meanwhile, SO2 exhibited the smallest change (0.48%). Therefore, without considering the impact of meteorological conditions, it could be concluded that the source of SO2 pollution on weekdays and weekends was relatively stable, while that of NO3 varied greatly.
The average concentration of the four water-soluble ions and two gases exhibited a significant weekend effect (Figure 4). That is, the concentration on weekends during each period was higher than that on weekdays, and the daily variation pattern showed a simple unimodal trend. The peaks appeared at 11:00 on both weekdays and weekends, with concentrations of 8.031 and 7.726 μg/m3, respectively. The weekend and weekday concentrations troughed at 19:00 and 20:00, with values of 6.304 and 5.919 μg/m3, respectively. The concentration distribution of Ca2+ differed between weekdays and weekends. During the weekend, the concentration was higher during the day. At night, the concentration began to decrease after 20:00 on the weekend; however, it began to increase on weekdays. Moreover, the concentration of Ca2+ during the first half of the night differed to that on weekdays with the concentration on weekdays being significantly higher than that on weekends. The concentration change curve on the weekend shows a multi-peak change trend, with peaks at 08:00 (0.99 μg/m3), 11:00 (1.04 μg/m3), and 18:00 (0.88 μg/m3), and the minimum concentration of 0.623 μg/m3 appeared at 07:00. The concentration changes on weekdays were relatively small, and only a small peak concentration of 0.874 μg/m3 appeared at 9:00.
The weekend effect index of NO3 was the highest (12.67%); however, the concentration change trends on weekdays and weekends were similar. The temporal distribution of the NO3 concentration on weekdays and weekends had strong regularity, increasing during the morning and evening traffic peaks; however, the peak on weekdays appeared at 07:00, two hours earlier than that on the weekend, with a concentration of 12.22 μg/m3. The peak concentration on weekends was higher than that on weekdays and appeared at 09:00 with a value of 13.84 μg/m3, while the troughs of both appeared at 18:00 with concentrations of 9.46 and 10.34 μg/m3, respectively. As an important secondary aerosol particle, NO3 originates from the NOx emissions of motor vehicle exhausts through a complex chemical oxidation process in the liquid or gas phase [34]. An increase in the NO3 concentration on weekends indicates that the impact of motor vehicle exhausts on NOx gas was greater than that on weekdays.
SO42− was impacted by the weekend effect, which was characterized by a substantial increase in the average concentration over the weekend compared with that on the weekdays. The diurnal variation in SO42− during weekdays followed a regular single-peak curve, with a peak at 11:00 and a trough at 06:00, and concentrations of 9.384 and 8.412 μg/m3, respectively. Meanwhile, the diurnal variation in SO42− during the weekend was an irregular multi-peak curve, with a clear peak at 11:00 and a concentration of 9.760 μg/m3. Additionally, small peaks of 9.636 and 9.268 μg/m3 occurred at 08:00 and 22:00, respectively. The troughs of SO42− on weekends appeared at 00:00, with a value of 8.64 μg/m3. As shown in Figure 4, the periods with the largest concentration difference between weekends and weekdays appeared in the morning and later in the night. As an important secondary aerosol particle, SO42− originates from the oxidation of SO2 gas through the liquid or gas phase. From sunrise, with the increased temperature, human activities, and pollution source emission intensity, the concentration of SO42− gradually increases, and the peak at 11:00 may be related to changes in atmospheric diffusion. Generally, the atmospheric turbulence was strong between 10:00 and 16:00, hence the atmosphere was unstable, and the vertical diffusion ability was strong; therefore, high-altitude SO2 was transported to the surface, near the ground, leading to an increase in the concentration of SO42− [35]. The SO2 weekend effect index was 4.86%. The concentration distributions on weekdays and weekends were similar, and the concentration changes were large during the day and small at night. The maximum average concentration on weekdays and weekends appeared at 12:00, with concentrations of 6.518 and 6.742 μg/m3, respectively. After 12:00, the SO2 concentration began to decrease; however, the rate of decrease on working days was significantly higher than that on weekends. After 20:00, the rate of decrease on weekends increased. The concentration of SO2 on weekdays during the first half of the night was significantly higher than that on weekends, and the nodes where the concentration began to increase also differed. That is, the concentration on weekends began to increase at 07:00; however, the concentration on weekdays increased 1 h later.
NH4+ exhibited a clear negative weekend effect. Nevertheless, the diurnal changes in the NH3 and NH4+ concentrations during weekdays and weekends were similar, with elevated levels during the day and low levels at night. Previous domestic and international studies demonstrated that agricultural production activities, such as nitrogen fertilizer application [36] and livestock breeding [37], are the main source of NH3 emissions; however, more recent research further demonstrates that, due to the increasing scale of human activities, “urbanization”, including motor vehicle exhaust emissions, human settlements, and sewage treatment releases, has gradually become the main source of NH3 [38]. Due to the recent dramatic increase in motor vehicles in Wuhan, large amounts of nitrogen compounds have been emitted into the atmosphere through motor vehicle exhausts, which chemically react with NH3 to form ammonium nitrate [39]. Moreover, in the current study, the distribution of NH3 and NH4+ concentrations was relatively regular, increasing during the morning and evening traffic peaks, which further confirms that mobile sources in Wuhan contribute to the increase in NH3 and NH4+ concentrations. Meanwhile, the opposing weekend effects of NH3 and NH4+ indicate that the formation of NH4+ is not solely determined by NH3 emissions. Indeed, the ammonia–ammonium gas/particle conversion will be affected by the complexity of physical transmission and will also be affected by the chemical conversion process [40].

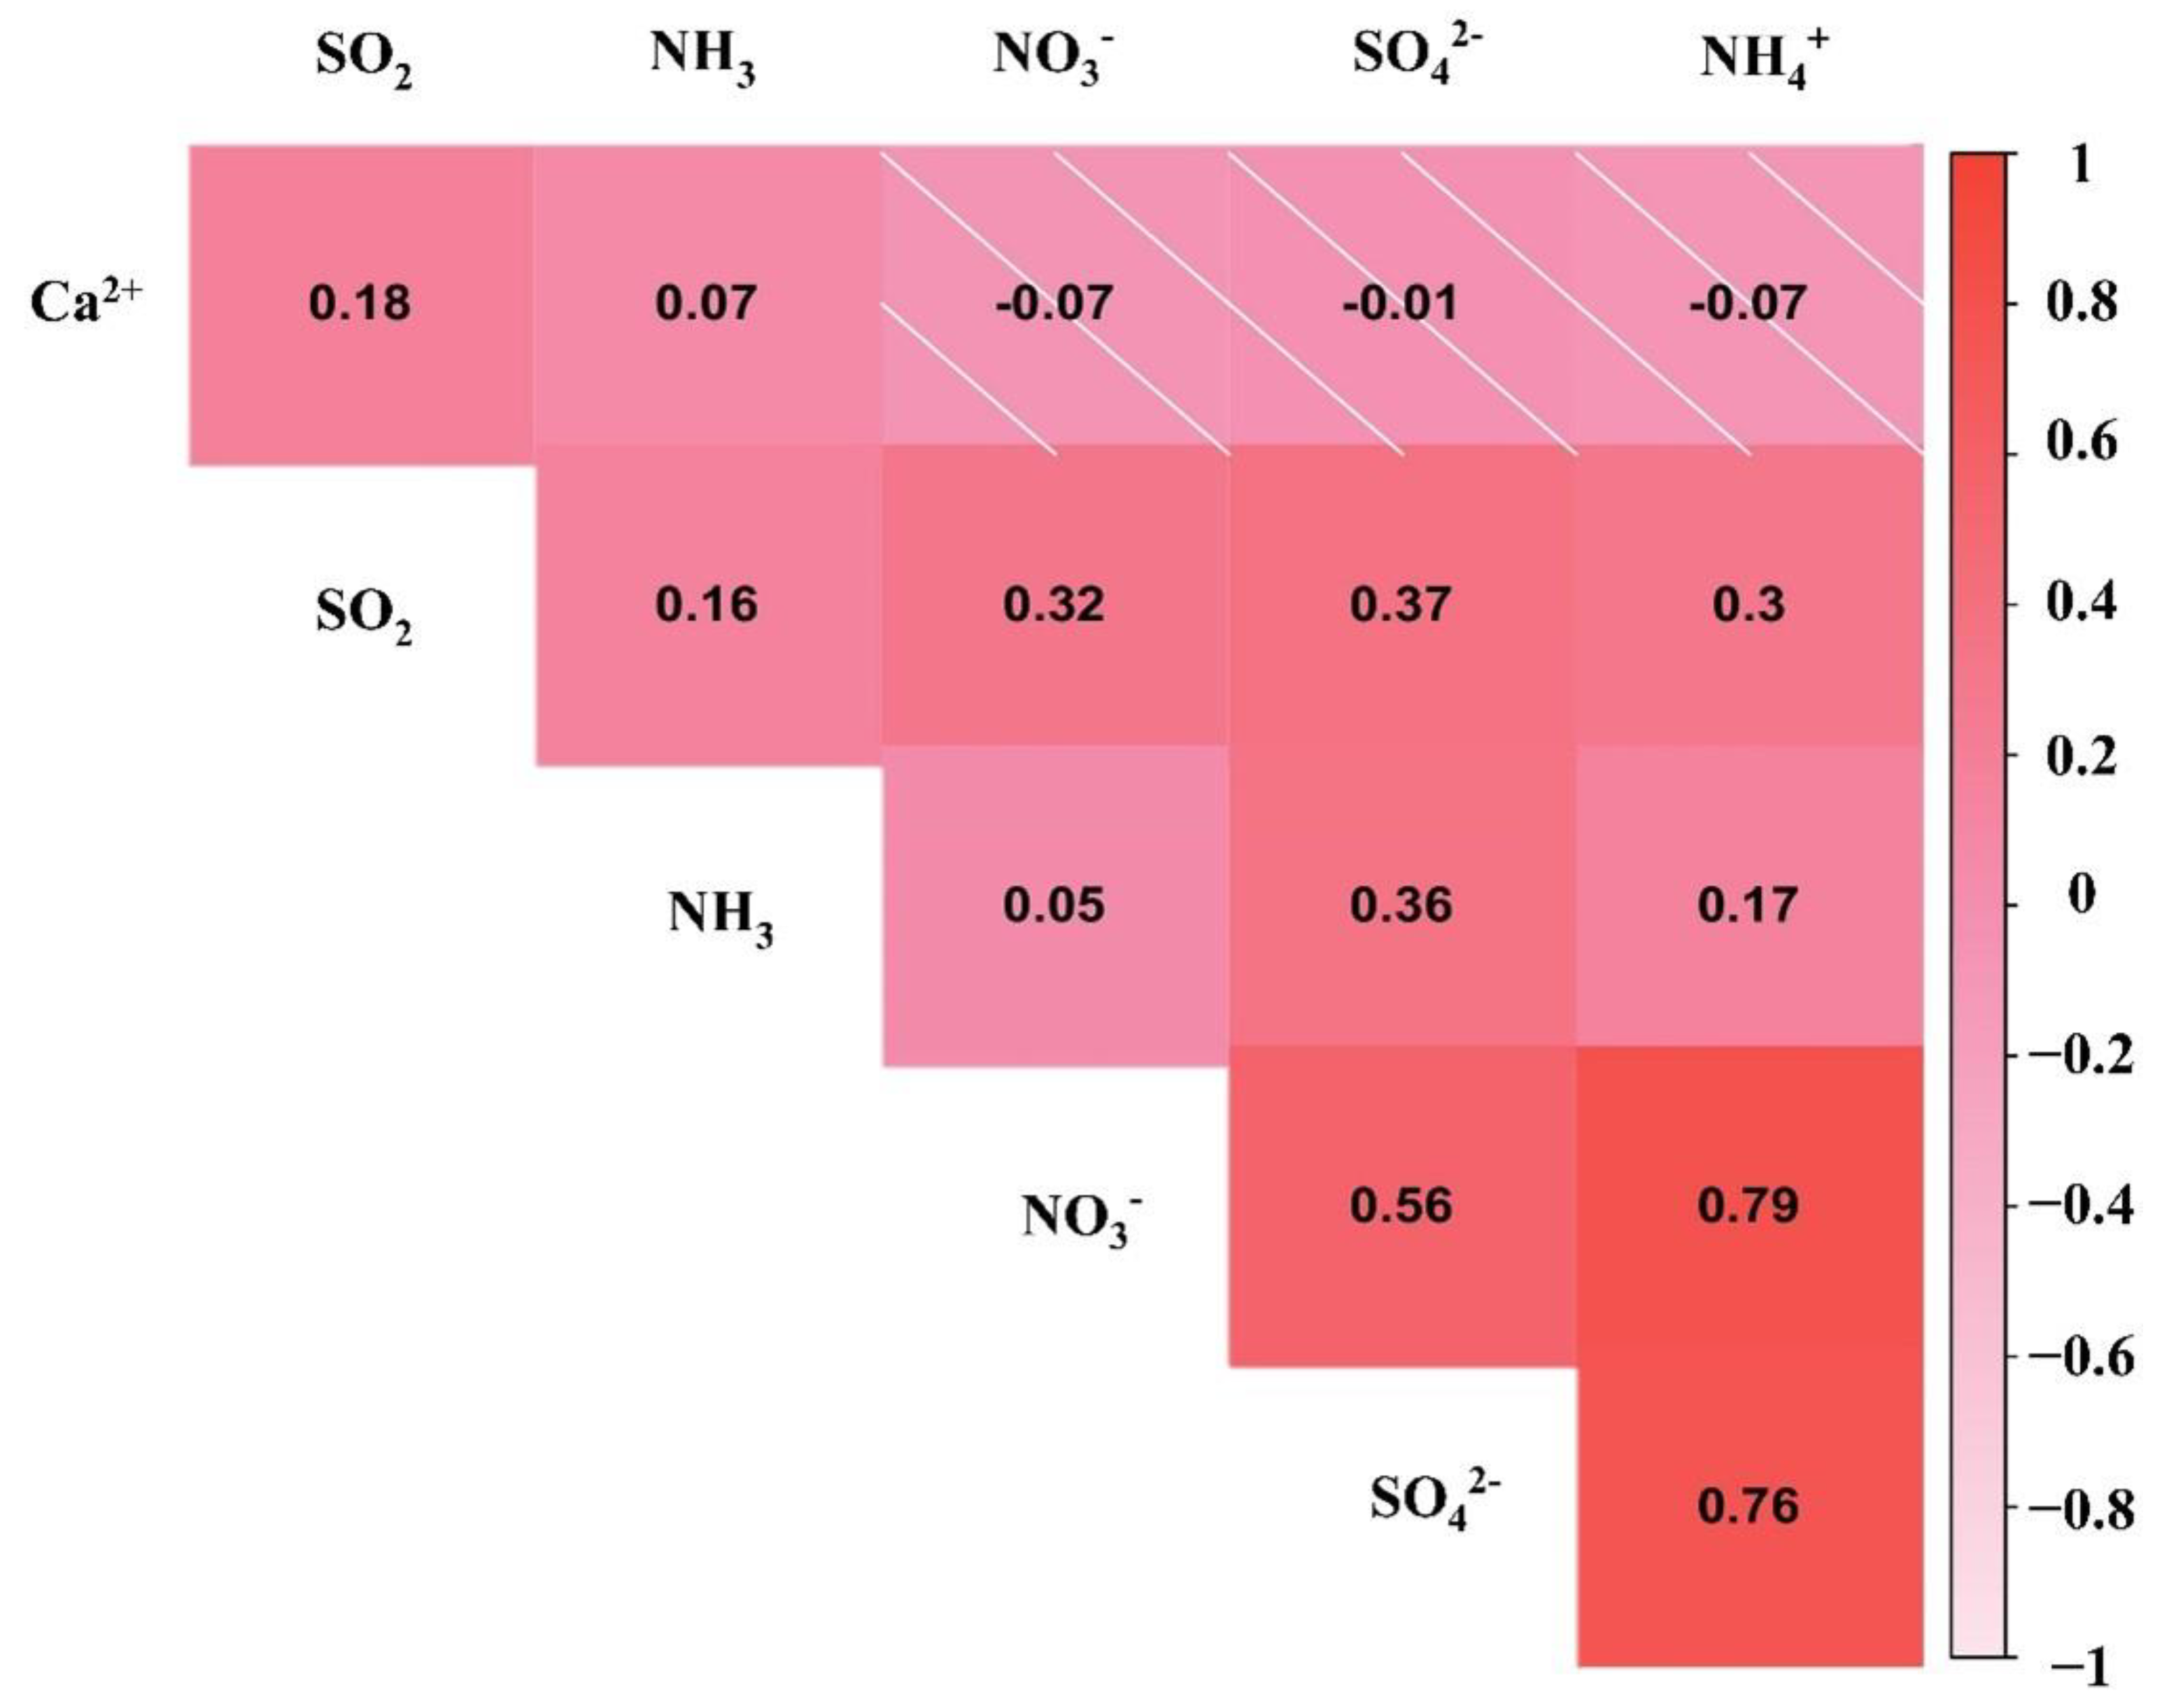
3.4. Correlation Analysis between Water-Soluble Ions

The correlation between water-soluble ions can explain their possible sources, their existing form, and the way they combine with each other. The correlation analysis of the main WSIIs was carried out by SPSS25.0. The results are shown in Figure 5.
NH4+ primarily exists in the form of sulfate, nitrate, and hydrochloride in the atmosphere, with significant correlations observed among the three ions NH4+, SO42−, and NO3. The correlation coefficients of NH4+ with SO42− and NO3 were 0.76 and 0.79, respectively, and statistically significant (p < 0.001; two-sided). Additionally, the correlation coefficient with NO3 was higher, indicating that NH4+ was mainly in the atmosphere in Wuhan and existed in the form of NH4NO3, followed by (NH4)2SO4 and NH4HSO4. Moreover, SO42− and NO3 exhibited a significant correlation, indicating that the gas–particle transformation process of SO42− and NO3 is affected by the same environmental factors. The primary source of these ions may be the combustion of fossil fuels [41].

4. Conclusions

Analysis of the diurnal changes in the concentration of water-soluble ions in PM in Wuhan over a four-year period from 2016 to 2019 showed that SNA comprised the majority of water-soluble ions in the PM, accounting for 88.37% of the molar concentration. At the same time, the correlation analysis results show strong correlations between NH4+, SO42−, and NO3. Moreover, NO3 accounted for the highest proportion of water-soluble ions, indicating that vehicle emissions from the burning of fossil fuels represent the main source of PM2.5 in Wuhan. The SO2 emission levels also exhibited an annually increasing trend. This is inseparable from the historical origin of Wuhan as a major industrial base in central China. However, in the current situation of atmospheric pollution, this cannot be underestimated, and while pursuing economic growth, it is necessary to strictly limit the polluting gas emissions of enterprises and quantify the total emissions of companies.
Seasonal variations in the ion concentration were evident. Among them, SNA had the highest concentration in winter, while the two gases had the highest concentration in summer. Additionally, the highest weekend effect index was observed for NO3 (12.67%), and the lowest was observed for NH3 (−3.82%). Regardless of the weekday or weekend, all ion concentrations were higher during the day than at night. Taken together, these results indicate that the government should encourage green travel and residents should gradually increase their environmental awareness and choose public transportation. Finally, while this study provides a detailed description of the diurnal characteristics of the monitored ion concentration data, it does not provide an analysis of the deep-seated causes of the circadian variation characteristics, which will require further investigation.

Author Contributions

Methodology, J.Z.; provision of data, Z.Z., N.C.; writing—original draft preparation, Y.S.; writing—review and editing, Y.S., C.H., and J.Z.; supervision: H.L., J.H., and X.W. All authors have read and agreed to the published version of the manuscript.

Funding

This study was supported by the National Natural Science Foundation of China (No. 41401559), the Natural Science Foundation of Hubei Province (No. 2020CFB478), the General Project of the Wuhan Association of Social Sciences (No. WHSKL2021135), the national large-scale innovation project (No. 201910512028), and the school-level large-scale innovation project (No. X202010512077).

Institutional Review Board Statement

Not applicable.

Informed Consent Statement

Not applicable.

Data Availability Statement

Not applicable.

Conflicts of Interest

The authors declare no conflict of interest.

Abbreviation

PM, particulate matter.

References

  1. Sui, J.Y.; Gao, M.; Yan, H.L.; Yang, J.C.; Wang, Y.N. Analysis of the Relationship between Air Quality Characteristics and Meteorological Conditions in Yanqing Urban Area. Clim. Change Res. Lett. 2020, 9, 167–176. [Google Scholar] [CrossRef]
  2. Ministry of Ecology and Environment of the People’s Republic of China. Communiqué on the State of Ecological Environment in China. 2017–2020. pp. 7–9. Available online: https://www.mee.gov.cn/hjzl/sthjzk/zghjzkgb/ (accessed on 4 July 2021).
  3. Suo, D.F.; Zeng, S.W. Research on the harm of airborne fine particulate matter PM2.5 to various human systems. Med. Inf. 2019, 32, 32–34. [Google Scholar]
  4. Dominici, F.; Greenstone, M.; Sunstein, C.R. Particulate matter matters. Science 2014, 344, 257–259. [Google Scholar] [CrossRef] [PubMed] [Green Version]
  5. Zhang, Y.Q.; He, M.Q.; Wu, S.M.; Zhu, Y.H.; Wang, S.Q. Short-term effects of fine particulate matter and temperature on lung function among healthy college students in Wuhan, China. Int. J. Environ. Res. Public Health 2015, 12, 7777–7793. [Google Scholar] [CrossRef] [Green Version]
  6. Ben, B.B.; Dunstone, N.J.; Halloran, P.R.; Andrews, T.; Bellouin, N. Aerosols implicated as a prime driver of twentieth-century North Atlantic climate variability. Nature 2012, 484, 228–232. [Google Scholar]
  7. Zhang, Y.X.; Cao, F.; Zheng, H.; Zhang, D.D.; Zhai, X.Y.; Fan, M.Y.; Zhang, Y.L. Pollution source and health risk assessment of polycyclic aromatic hydrocarbons in PM2.5 in Changchun City in autumn of 2017. Environ. Sci. 2020, 41, 564–573. [Google Scholar]
  8. Shon, Z.-H.; Kim, K.-H.; Song, S.-K.; Kim, N.-J.; Lee, J.-B. Relationship between water-soluble ions in PM2.5 and their precursor gases in Seoul megacity. Atmos. Environ. 2012, 59, 540–550. [Google Scholar] [CrossRef]
  9. Meng, C.C.; Wang, L.T.; Zhang, F.F.; Wei, F.; Ma, S.M.; Ma, X.; Yang, J. Characteristics of concentrations and water-soluble inorganic ions in PM2.5 in Handan City, Hebei province, China. Atmos. Res. 2016, 171, 133–146. [Google Scholar] [CrossRef]
  10. Hu, G.Y.; Zhang, Y.M.; Sun, J.Y.; Zhang, L.M.; Shen, X.J.; Lin, W.L.; Yang, Y. Variability formation and acidity of water-soluble ions in PM2.5 in Beijing based on the semi-continuous observations. Atmos. Res. 2014, 145–146, 1–11. [Google Scholar] [CrossRef]
  11. Zhang, R.; Sun, X.S.; Shi, A.J.; Huang, Y.H.; Yan, J.; Nie, T.; Yan, X.; Li, X. Secondary inorganic aerosols formation during haze episodes at an urban site in Beijing, China. Atmos. Environ. 2018, 177, 275–282. [Google Scholar] [CrossRef]
  12. Yuan, Z.; Lau, A.K.H.; Zhang, H.Y.; Jian, Z.Y.; Peter, K.K.L.; Jimmy, C.H.F. Identification and spatiotemporal variations of dominant PM10 sources over Hong Kong. Atmos. Environ. 2006, 40, 1803–1815. [Google Scholar] [CrossRef]
  13. Goudarzi, G.; Geravandi, S.; Alavi, N.; Idani, E.; Salmanzadeh, S.; Jamshidi, F.; Mohammad, J.M.; Ranjbarzadeh, A.; Alamdari, F.A.; Darabi, F.; et al. Association between cancer risk and polycyclic aromatic hydrocarbons’ exposure in the ambient air of Ahvaz, southwest of Iran. Int. J. Biometeorol. 2018, 62, 1461–1470. [Google Scholar] [CrossRef] [PubMed]
  14. Qiu, C.C.; Yu, X.G.; Ding, C.; Shi, Z.; Zhang, R.F.; Hou, S.Y.; Hou, X.H. Diurnal changes and source analysis of chemical components in PM2.5 in winter in Jiangbei New Area, Nanjing. J. Environ. Sci. 2020, 41, 529–536. [Google Scholar]
  15. Zhang, Y.L.; Li, L.; Song, L.M.; Wang, F.; Zhao, H.H.; Wu, W.C.; Tang, Q.; Pan, C.; Chen, H. Characteristics and source analysis of the chemical components of PM2.5 in Jiashan in winter. Environ. Chem. 2021, 40, 754–764. [Google Scholar]
  16. Duong, H.H.; Nguyen, D.T.C.; Nguyen, X.T.N.; To Thin, H. Commuter exposures to in-transit PM in an urban city dominated by motorcycle: A case study in Vietnam. Atmos. Pollut. Res. 2022, 13, 101351. [Google Scholar]
  17. Dao, D.; Zhu, H.X.; Tan, L.; Chen, Y.; Wang, S.J.; Teng, E.J.; Lv, Y.B.; Li, G.G. Changes of water-soluble ions in PM2.5 in Beijing and surrounding key cities during APEC in 2014. Environ. Chem. 2015, 34, 1389–1395. [Google Scholar]
  18. Yu, J.; Hu, S.X.; Huang, Z.; Tian, J.J. Characteristics of water-soluble ions in atmospheric PM2.5 Wuhan in spring. China Environ. Monit. 2017, 33, 35–41. [Google Scholar]
  19. Wuhan Municipal Ecological Environment Bureau. Wuhan City Ecological Environment Status Bulletin. 2017–2020. pp. 1–13. Available online: http://hbj.wuhan.gov.cn/fbjd_19/xxgkml/zwgk/hjjc/hjzkgb/ (accessed on 21 July 2021).
  20. Chen, Y.; Yun, L.; Luo, Y.; Niu, Y.B.; Peng, X.; He, L.Y.; Huang, X.F. Characteristics of gas-particle partitioning of gaseous nitric acid and particle nitrate in Shenzhen in winter. China Environ. Sci. 2021, 41, 4036–4042. [Google Scholar]
  21. Cleveland, W.S.; Graedel, T.E.; Kleiner, B.; Warner, J.L. Sunday and Workday Variations in Photochemical Air Pollutants in New Jersey and New York. Science 1974, 186, 1037–1038. [Google Scholar] [CrossRef]
  22. Shi, J.W.; Feng, Y.C.; Ren, L.; Lu, X.Q.; Zhong, Y.Q.; Han, X.Y.; Ning, P. Mass Concentration, Chemical Composition, and Source Characteristics of PM2.5 in a Plateau Slope City in Southwest China. Atmosphere 2021, 12, 611. [Google Scholar] [CrossRef]
  23. Duong, H.H.; Le, T.T.; Norimichi, T.; To Thin, H. Comparative study on water-soluble inorganic ions in PM2.5 from two distinct climate regions and air quality. J. Environ. Sci. 2020, 88, 349–360. [Google Scholar]
  24. Prodip, A.; Kaushar, A.; Dinesh, K.T.; Safai, P.D.; Sachin, G.U.; Thara, P.; Rajeevan, M. Characterization of atmospheric trace gases and water soluble inorganic chemical ions of PM1 and PM2.5 at Indira Gandhi International Airport, New Delhi during 2017–2018 winter. Sci. Total Environ. 2020, 729, 138800. [Google Scholar]
  25. Ten Brink, H.M.; Kruisz, C.; Kos, G.P.A.; Berner, A. Composition/size of the light-scattering aerosol in the Netherlands. Atmos. Environ. 1997, 31, 3955–3962. [Google Scholar] [CrossRef]
  26. Drewnick, F.; Schwab, J.J.; Hogrefe, O.; Peters, S.; Husain, L.; Diamond, D.; Weber, R.; Demerjian, K.L. Intercomparison and evaluation of four semi-continuous PM2.5 sulfate instruments. Atmos. Environ. 2003, 37, 3335–3350. [Google Scholar] [CrossRef]
  27. Xiao, H.; Xiao, H.Y.; Wu, P.; Xiao, H.W.; Zhang, Z.Y.; Zheng, N.J. Composition characteristics and source analysis of PM2.5 water-soluble ions in Guiyang in autumn. Environ. Chem. 2019, 38, 548–555. [Google Scholar]
  28. Ren, J.; Yin, S.J.; Guo, S.F. Seasonal pollution characteristics and source analysis of water-soluble ions in atmospheric PM2.5 in Taiyuan City. J. Environ. Sci. 2020, 40, 3120–3130. [Google Scholar]
  29. Li, J.Q.; Zhang, J.K.; Dong, G.M.; Deng, J.L.; Liu, Z.R.; Wang, Y.S. Characterization of Water-soluble Inorganic Ions in Atmospheric PM2.5 in Chengdu during the Later Stage of the Air Pollution Prevention and Control Action Plan. Environ. Sci. 2021, 42, 5616–5623. [Google Scholar]
  30. Zhang, Y.L. Seasonal Disparity in the Effect of Meteorological Conditions on Air Quality in China Based on Artificial Intelligence. Atmosphere 2021, 12, 1670. [Google Scholar] [CrossRef]
  31. Dunea, D.; Iordache, V.; Frasin, L.N.; Neago, A. Monitoring Rainwater Properties and Outdoor Particulate Matter in a Former Steel Manufacturing City in Romania. Atmosphere 2021, 12, 1594. [Google Scholar] [CrossRef]
  32. Pan, C.M.; Zhu, X.; Wang, J.; Xiang, F.; Shen, Q.F.; Xia, W.Y.; Wan, P.J.; Qiu, F. Research on the characteristics and influencing factors of ozone pollution in Yunnan Province in 2019. Environ. Sci. Technol. 2020, 43, 156–164. [Google Scholar]
  33. Zhao, X.L.; Zhou, W.Q.; Han, L.J. Human activities and urban air pollution in Chinese mega city: An insight of ozone weekend effect in Beijing. Phys. Chem. Earth 2019, 110, 109–116. [Google Scholar] [CrossRef]
  34. Zhao, M.X.; Wu, L.; Fang, X.Z.; Yang, Z.W.; Li, F.H.; Mao, H.J. Analysis of water-soluble inorganic ions of atmospheric particulate matter in the road environment of Tianjin. Environ. Sci. 2016, 37, 4133–4141. [Google Scholar]
  35. Wang, Z.S.; Li, Y.T.; Dong, X.; Sun, R.W.; Sun, N.D.; Pan, L.B. Analysis of "weekend effect" of air pollutants in Beijing urban area. J. Univ. Chin. Acad. Sci. 2015, 32, 843–850. [Google Scholar]
  36. Li, X.; Ju, X.T.; Zhang, L.J.; Wan, Y.J.; Liu, S.Q. Effects of different fertilization methods on soil ammonia volatilization and nitrous oxide emissions. Chin. J. Appl. Ecol. 2008, 19, 99–104. [Google Scholar]
  37. Qian, X.Y.; Guo, X.P.; Lin, L.; Shen, G.X. Research on the influence of NH3 emissions from agricultural sources at home and abroad on the formation of PM2.5. J. Agric. Environ. Sci. 2013, 32, 1908–1914. [Google Scholar]
  38. Gu, Y.G.; Wang, B.G.; Yang, J.; Zhong, S.F. Research on the source and emission factors of ammonia in urban sewage plants. Environ. Chem. 2012, 31, 708–713. [Google Scholar]
  39. Huang, T.; Chen, J.; Zhao, W.T.; Cheng, J.X.; Cheng, S.G. Seasonal Variations and Correlation Analysis of Water-Soluble Inorganic Ions in PM2.5 in Wuhan, 2013. Atmosphere 2016, 7, 49. [Google Scholar] [CrossRef] [Green Version]
  40. Wu, J.W.; Wang, Z.W.; Chen, N.; Cheng, H.R.; Yuan, C. Monitoring of atmospheric ammonia-ammonium gas/particle conversion before and after the Military Games in Wuhan. Environ. Sci. Technol. 2020, 43, 132–138. [Google Scholar]
  41. Mao, Q.J.; Cheng, F.Y.; Chen, M. Experimental Study on the Chemical Characterization of Atmospheric Aerosols in Wuhan, China. Atmosphere 2021, 12, 1393. [Google Scholar] [CrossRef]
Figure 1. Sampling point locations ((a) represents Wuhan city; (b) represents Hongshan District; (c) represents the sampling site).
Atmosphere 13 00582 g001
Figure 2. Concentrations of water-soluble ions in particulate matter in Wuhan, China during the period 2016–2019. The red dotted line represents the four-year trend line for each ion. R2 represents the degree of fit of the trend line. P represents statistical significance.
Atmosphere 13 00582 g002
Figure 3. Seasonal changes in the water-soluble ion concentrations. (ag) Changes in the water-soluble ion concentrations of NH4+, Ca2+, NO3, SO42−, SO2, and NH3, respectively.
Atmosphere 13 00582 g003
Figure 4. Changes in the concentrations of water-soluble ions on weekdays and weekends.
Atmosphere 13 00582 g004
Figure 5. Water-soluble ion correlation heatmap in Wuhan City.
Atmosphere 13 00582 g005
Table 1. Seasonal variation in diurnal concentrations of different ions (μg/m3).
IonSeason8:009:0010:0011:0012:0013:0014:0015:0016:0017:0018:0019:00
NH4+Spring9.299.429.399.228.958.728.398.097.867.597.207.01
Summer6.266.496.636.706.415.855.585.315.114.934.734.54
Autumn6.696.967.297.397.286.976.636.346.195.955.885.68
Winter7.988.188.729.309.199.258.848.768.348.348.048.05
Ca2+Spring0.770.780.810.780.710.700.720.690.690.690.700.68
Summer0.870.920.910.790.710.620.580.600.640.660.670.63
Autumn1.181.291.331.291.351.231.361.401.351.161.231.33
Winter0.660.690.740.690.670.670.680.660.650.660.710.71
NO3Spring22.2921.5620.2819.1018.2817.4617.0916.0415.6515.2214.2514.09
Summer5.985.685.395.074.423.913.493.243.033.123.033.13
Autumn11.4711.3911.1610.7610.4510.099.598.768.808.748.738.86
Winter19.2819.3219.8720.5119.7919.6318.5018.4117.9618.6118.2119.29
SO42−Spring10.0810.0010.179.969.969.909.669.539.529.299.189.04
Summer8.158.268.618.688.978.508.398.318.197.967.847.82
Autumn8.358.428.538.558.678.438.398.548.538.298.278.22
Winter9.529.7210.2410.7610.0710.439.9610.039.8710.009.509.64
SO2Spring3.174.405.466.506.826.666.015.564.984.303.632.88
Summer3.014.004.775.665.304.423.913.262.922.552.201.90
Autumn3.454.546.057.097.266.485.685.124.764.093.493.00
Winter2.813.434.786.848.068.708.568.116.766.275.374.20
NH3Spring11.2311.5711.5111.2910.6210.429.909.859.579.419.079.01
Summer14.0014.6414.7814.8114.0112.8712.6112.0211.6111.1410.539.66
Autumn8.689.049.529.759.088.948.317.837.477.317.516.57
Winter4.334.544.855.054.814.654.244.184.043.863.643.67
Table 2. Seasonal variation in night-time concentrations of different ions (μg/m3).
IonSeason20:0021:0022:0023:000:001:002:003:004:005:006:007:00
NH4+Spring7.057.297.597.838.068.228.328.348.468.648.718.87
Summer4.544.664.835.025.265.465.635.675.705.715.756.03
Autumn5.675.825.895.976.116.076.076.076.176.226.326.43
Winter7.987.997.887.677.417.657.627.677.697.947.807.96
Ca2+Spring0.680.710.680.700.680.680.650.650.660.650.600.64
Summer0.640.660.680.710.730.730.760.760.780.740.720.80
Autumn1.351.331.241.271.441.241.251.131.211.171.101.18
Winter0.700.680.690.680.680.730.700.670.630.640.600.61
NO3Spring14.4015.7717.3018.1818.9419.6020.2920.4220.7521.5521.8121.90
Summer3.353.573.924.294.504.825.215.415.755.916.026.11
Autumn8.869.469.689.729.889.949.8910.0510.2610.6210.8911.12
Winter18.9719.2319.0218.1417.9618.7218.2718.5318.2319.3718.8019.68
SO42−Spring9.169.139.269.289.509.549.389.319.329.359.429.55
Summer7.747.877.907.728.038.027.957.847.717.607.627.90
Autumn8.188.178.178.118.117.957.907.847.957.907.968.08
Winter9.559.679.369.228.798.938.959.129.199.219.059.23
SO2Spring2.542.282.122.102.152.132.102.081.961.982.072.42
Summer1.591.591.681.922.232.412.582.352.292.252.432.65
Autumn2.792.652.722.973.113.263.303.233.132.963.073.15
Winter3.863.643.433.152.963.083.113.143.093.233.083.06
NH3Spring9.029.159.309.539.649.829.949.9310.1810.3310.3010.62
Summer9.809.9810.3811.0211.3311.8512.2212.6412.4912.5212.4213.26
Autumn6.716.987.027.207.597.647.717.747.887.928.098.13
Winter3.783.873.753.953.914.184.164.264.324.324.344.30
Table 3. Changes in the concentration of water-soluble ions on weekdays and weekends from 2016 to 2019.
Ca2
(μg/m3)
SO42−
(μg/m3)
NH₃
(μg/m3)
NO3
(μg/m3)
SO₂
(μg/m3)
NH4+
(μg/m3)
Average
(μg/m3)
Standard Deviation
Weekday0.8278.7438.68410.8233.8047.0406.6543.369
Weekend0.8809.1158.35212.1953.8237.7257.0153.682
Rate−6.07%−4.08%3.97%−11.25%−0.48%−8.87%−5.15%/
Weekend Effect Index6.46%4.24%−3.82%12.67%4.86%9.73%5.43%/
Publisher’s Note: MDPI stays neutral with regard to jurisdictional claims in published maps and institutional affiliations.

