
Suitability and Sensitivity of the Potential Distribution of Cyclobalanopsis glauca Forests under Climate Change Conditions in Guizhou Province, Southwestern China


Abstract
:1. Introduction
2. Methods
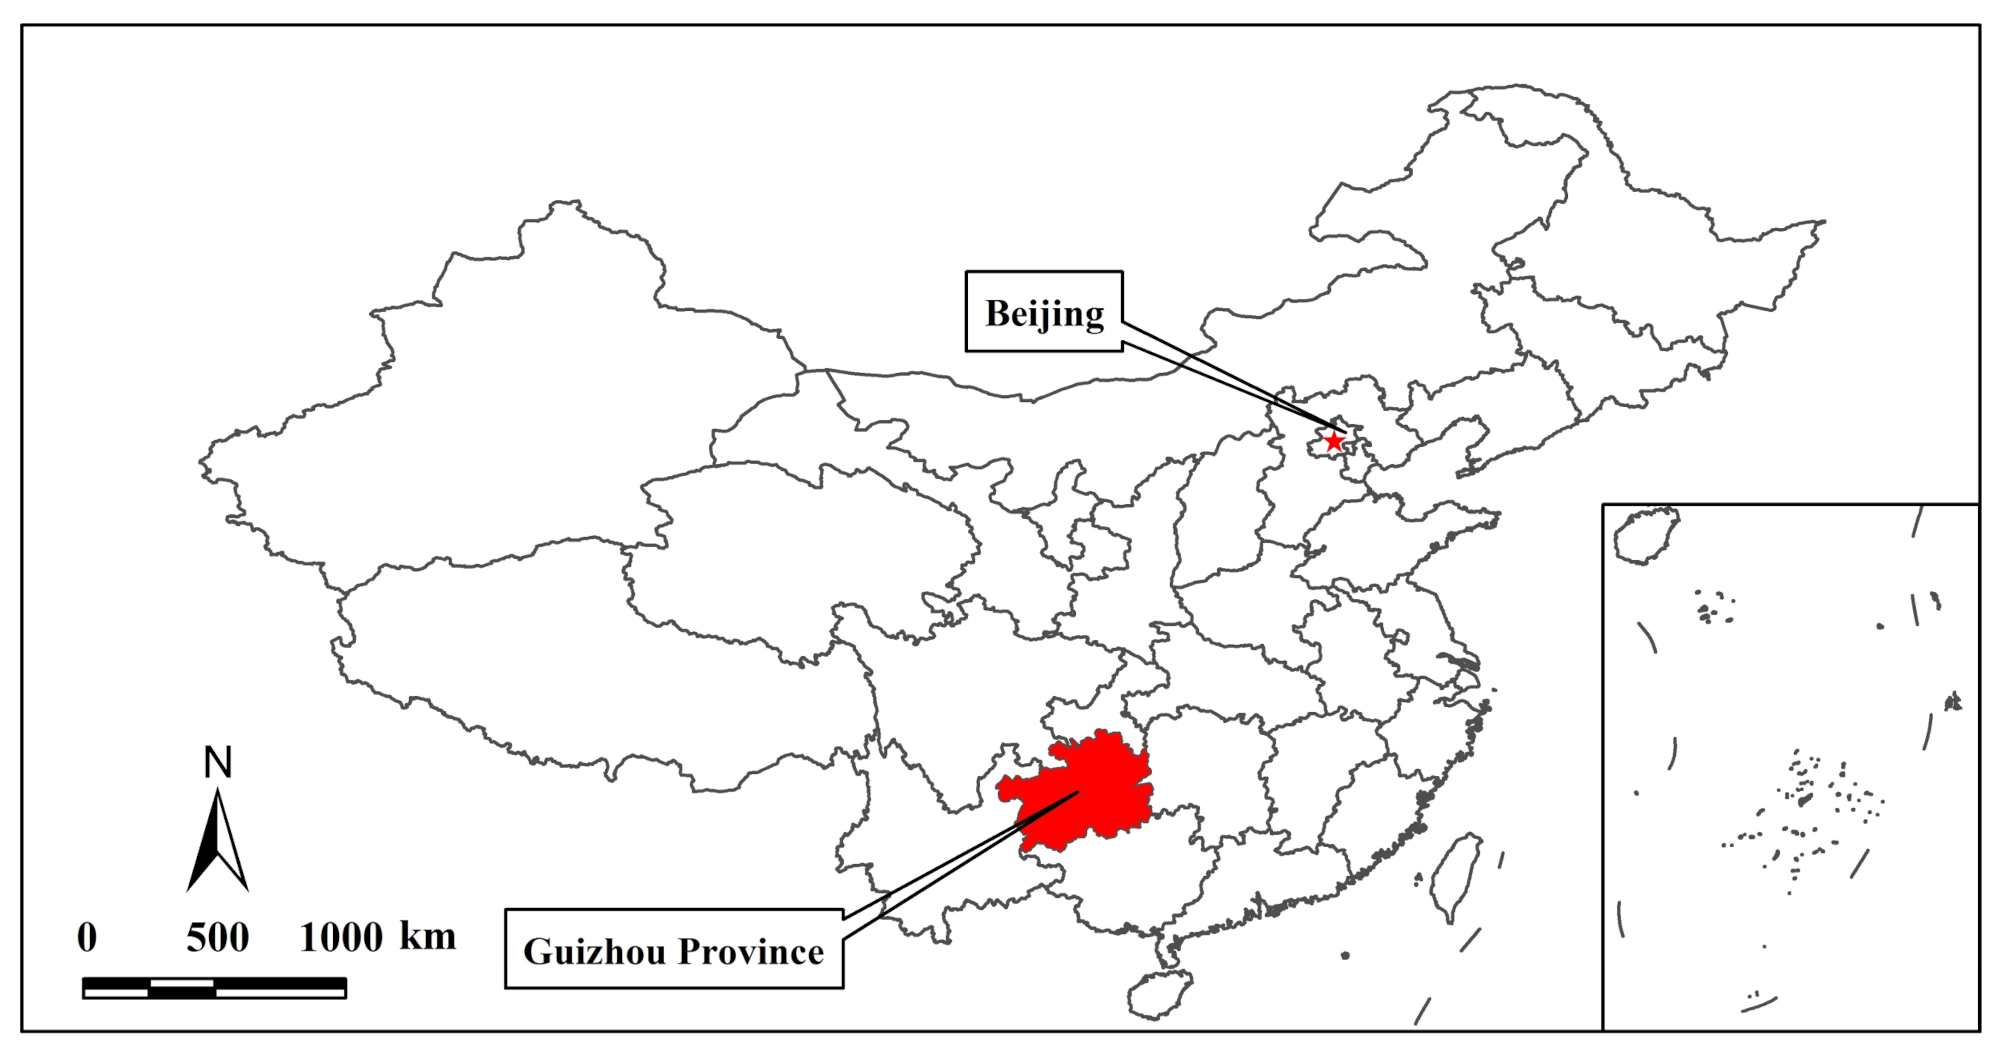
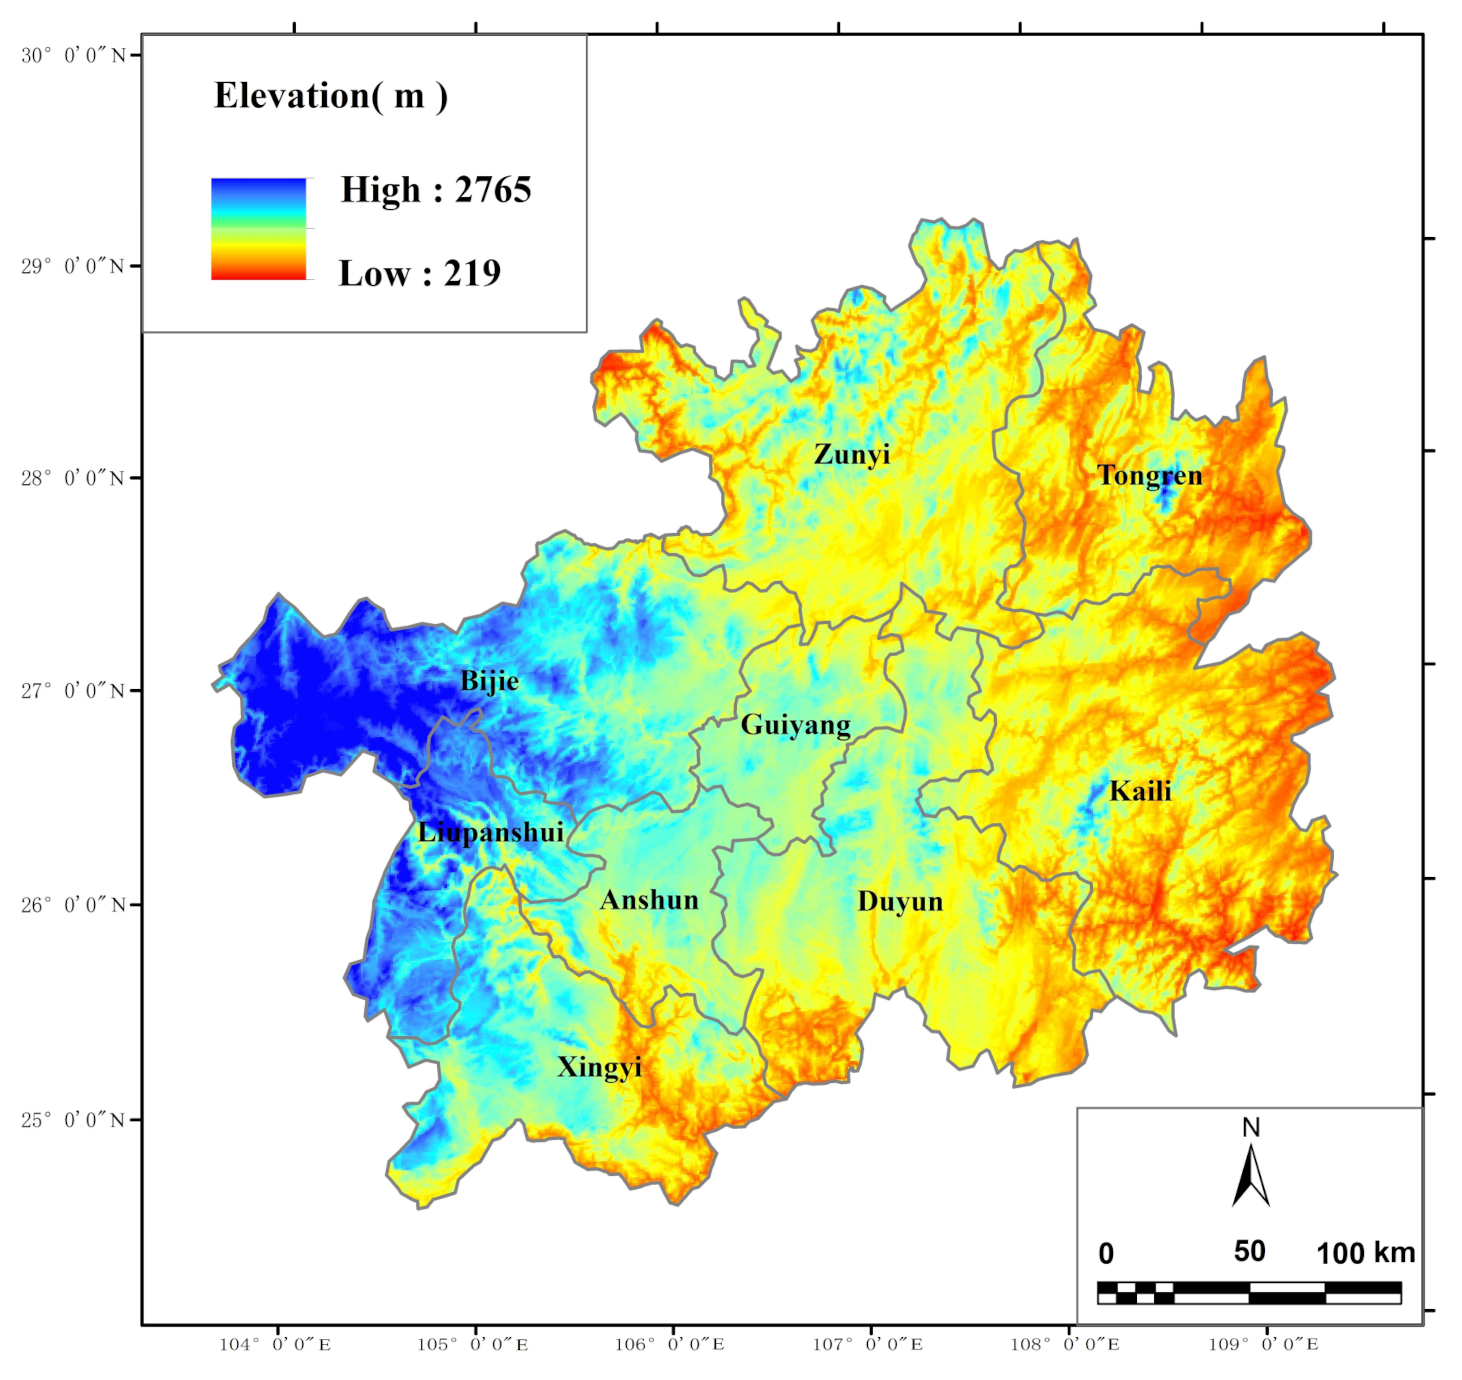
2.1. Study Area
2.2. Distribution Points
2.3. Climate Data
2.4. Modelling and Validation
2.5. Suitability and Sensitivity Assessment
3. Results
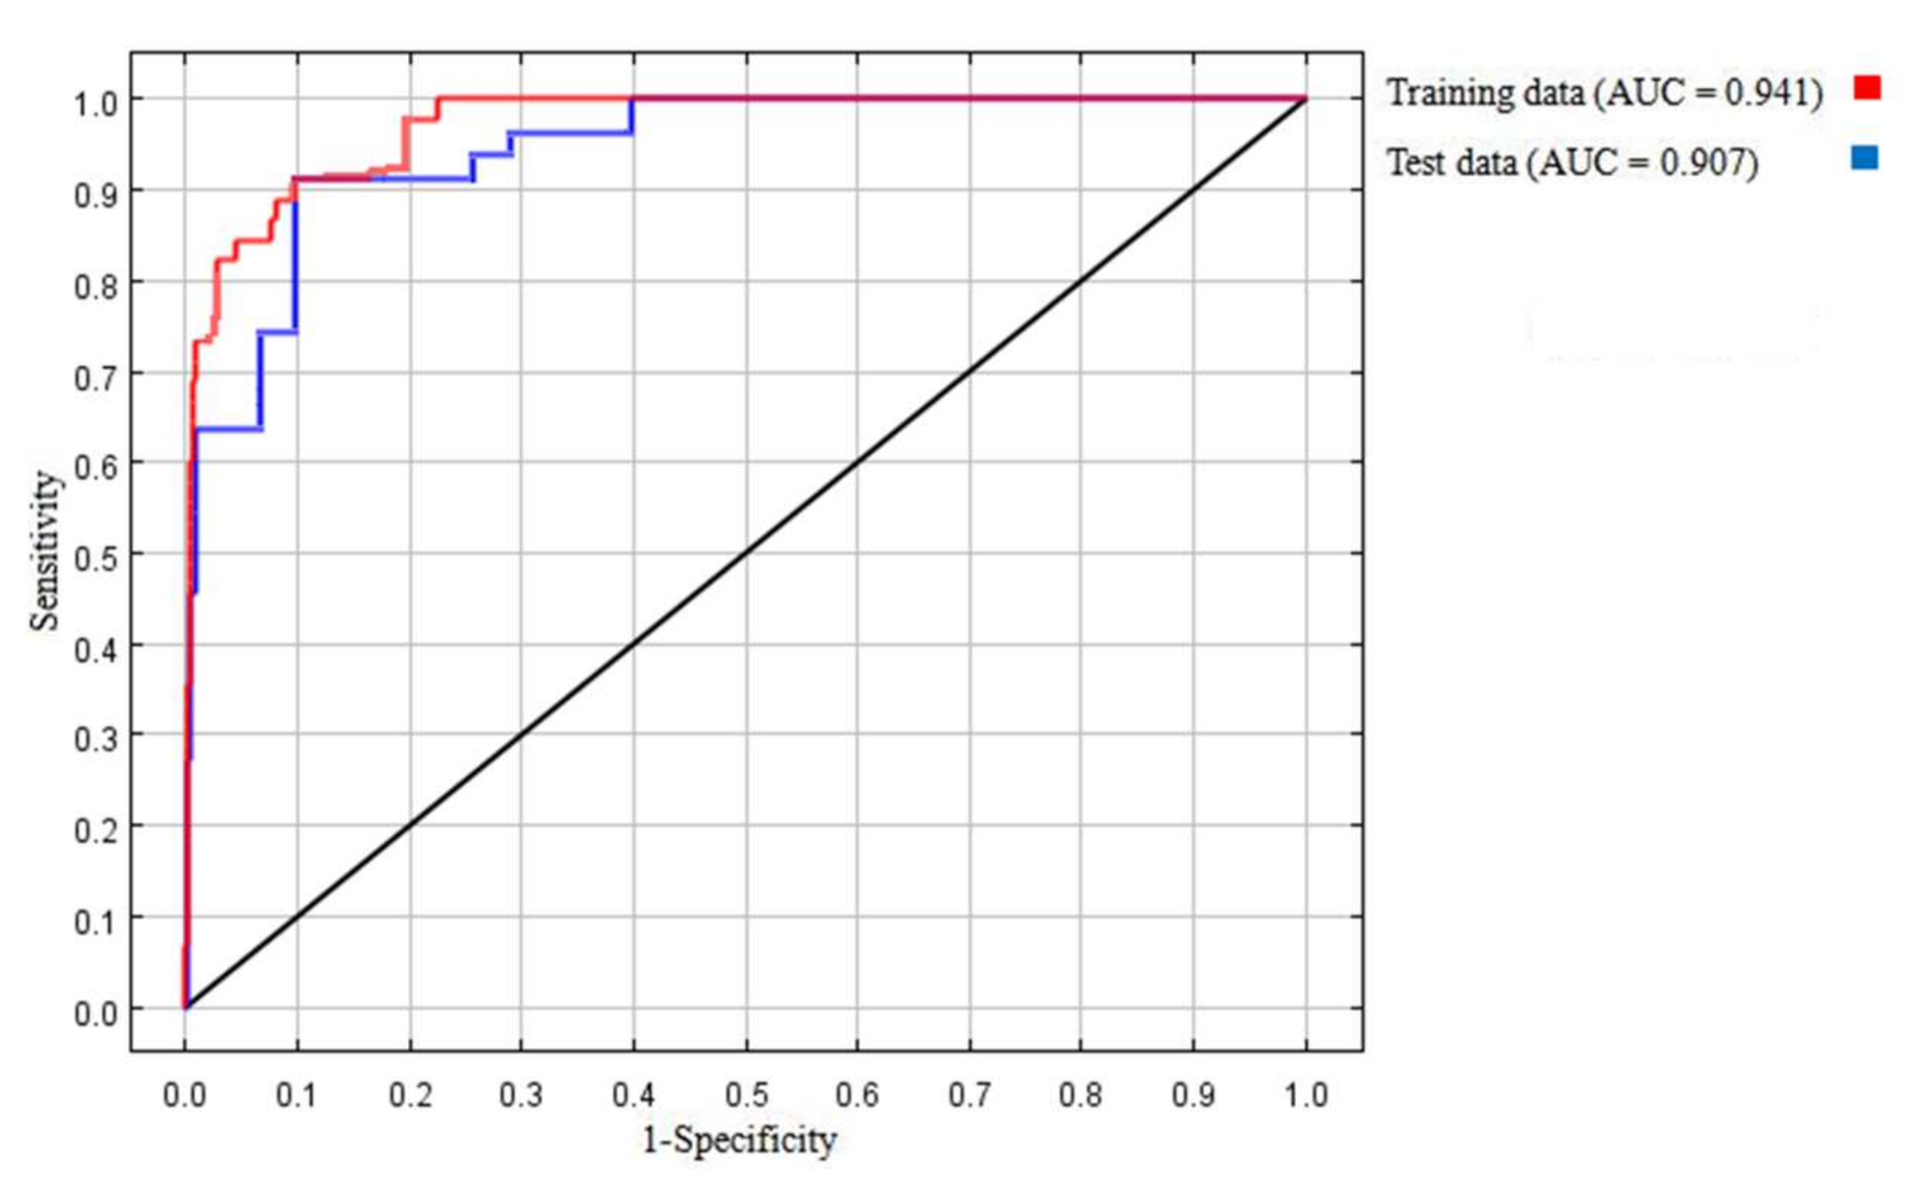
3.1. Prediction Accuracy
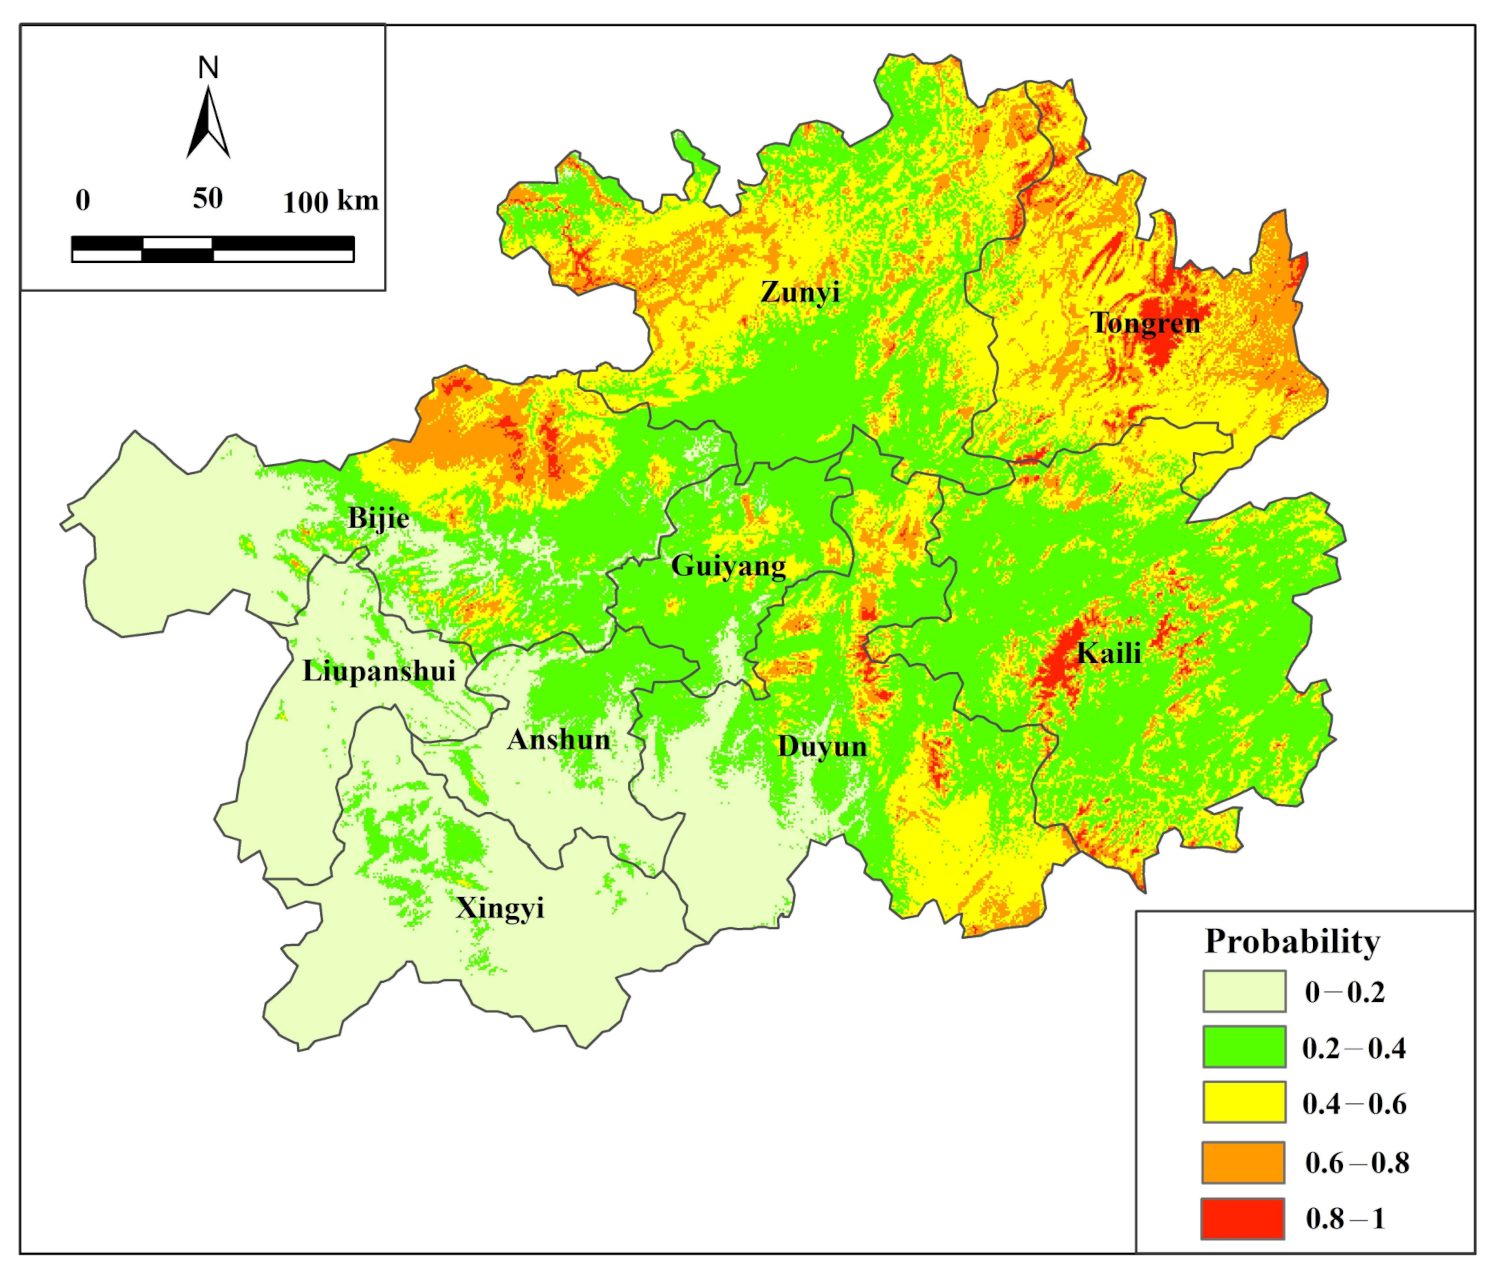
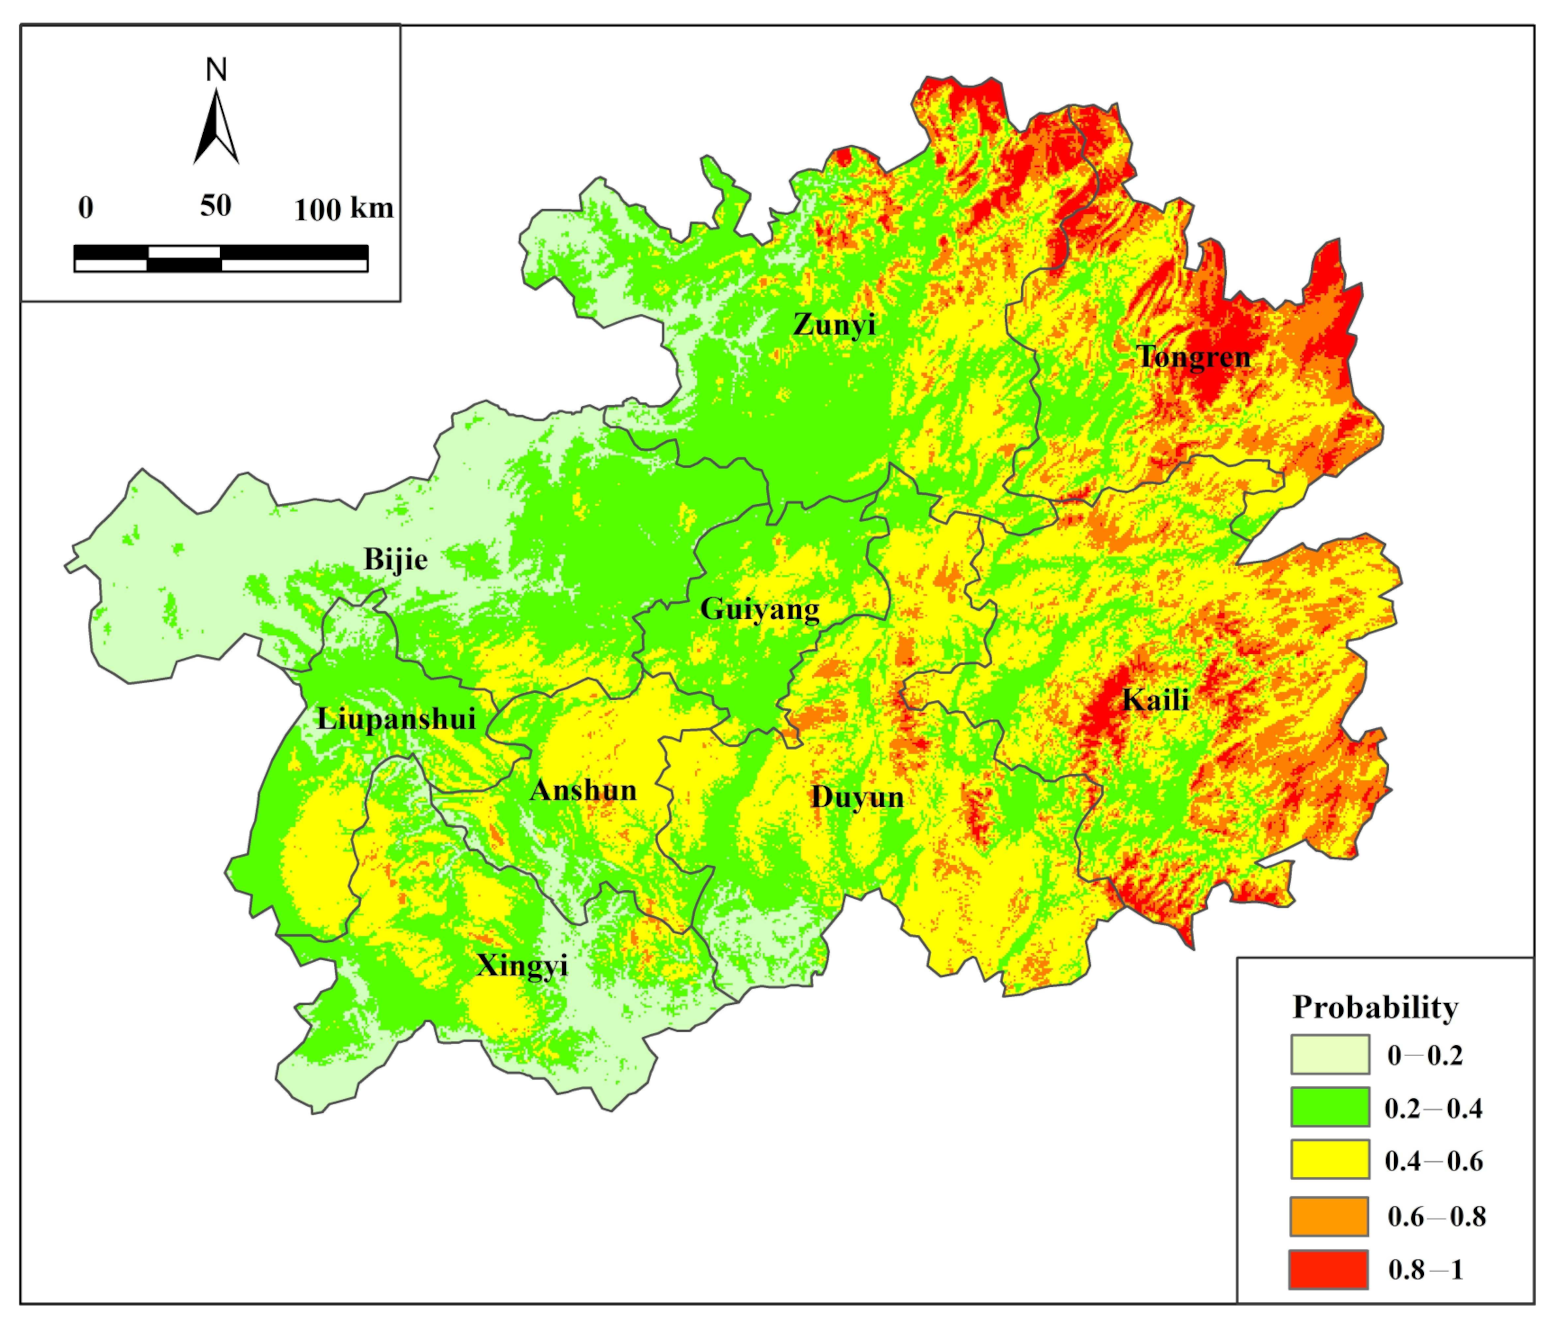
3.2. Potential Probability under Current Climate and RCP8.5 Scenarios
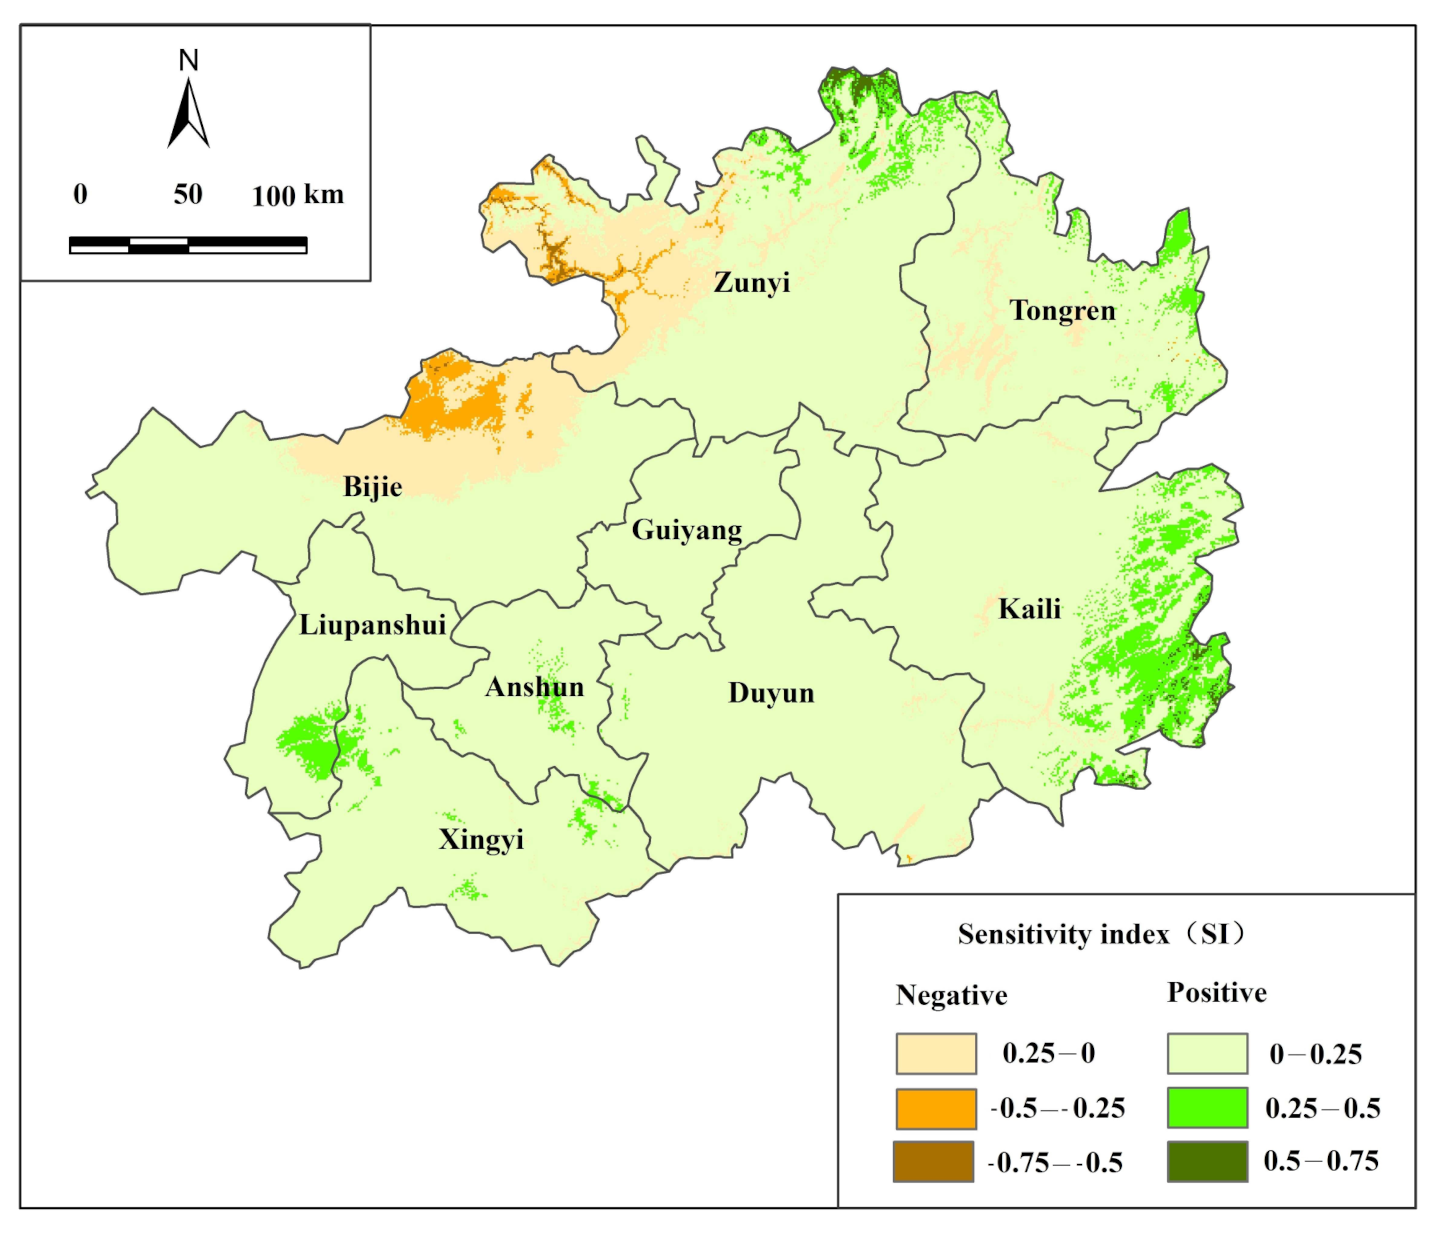
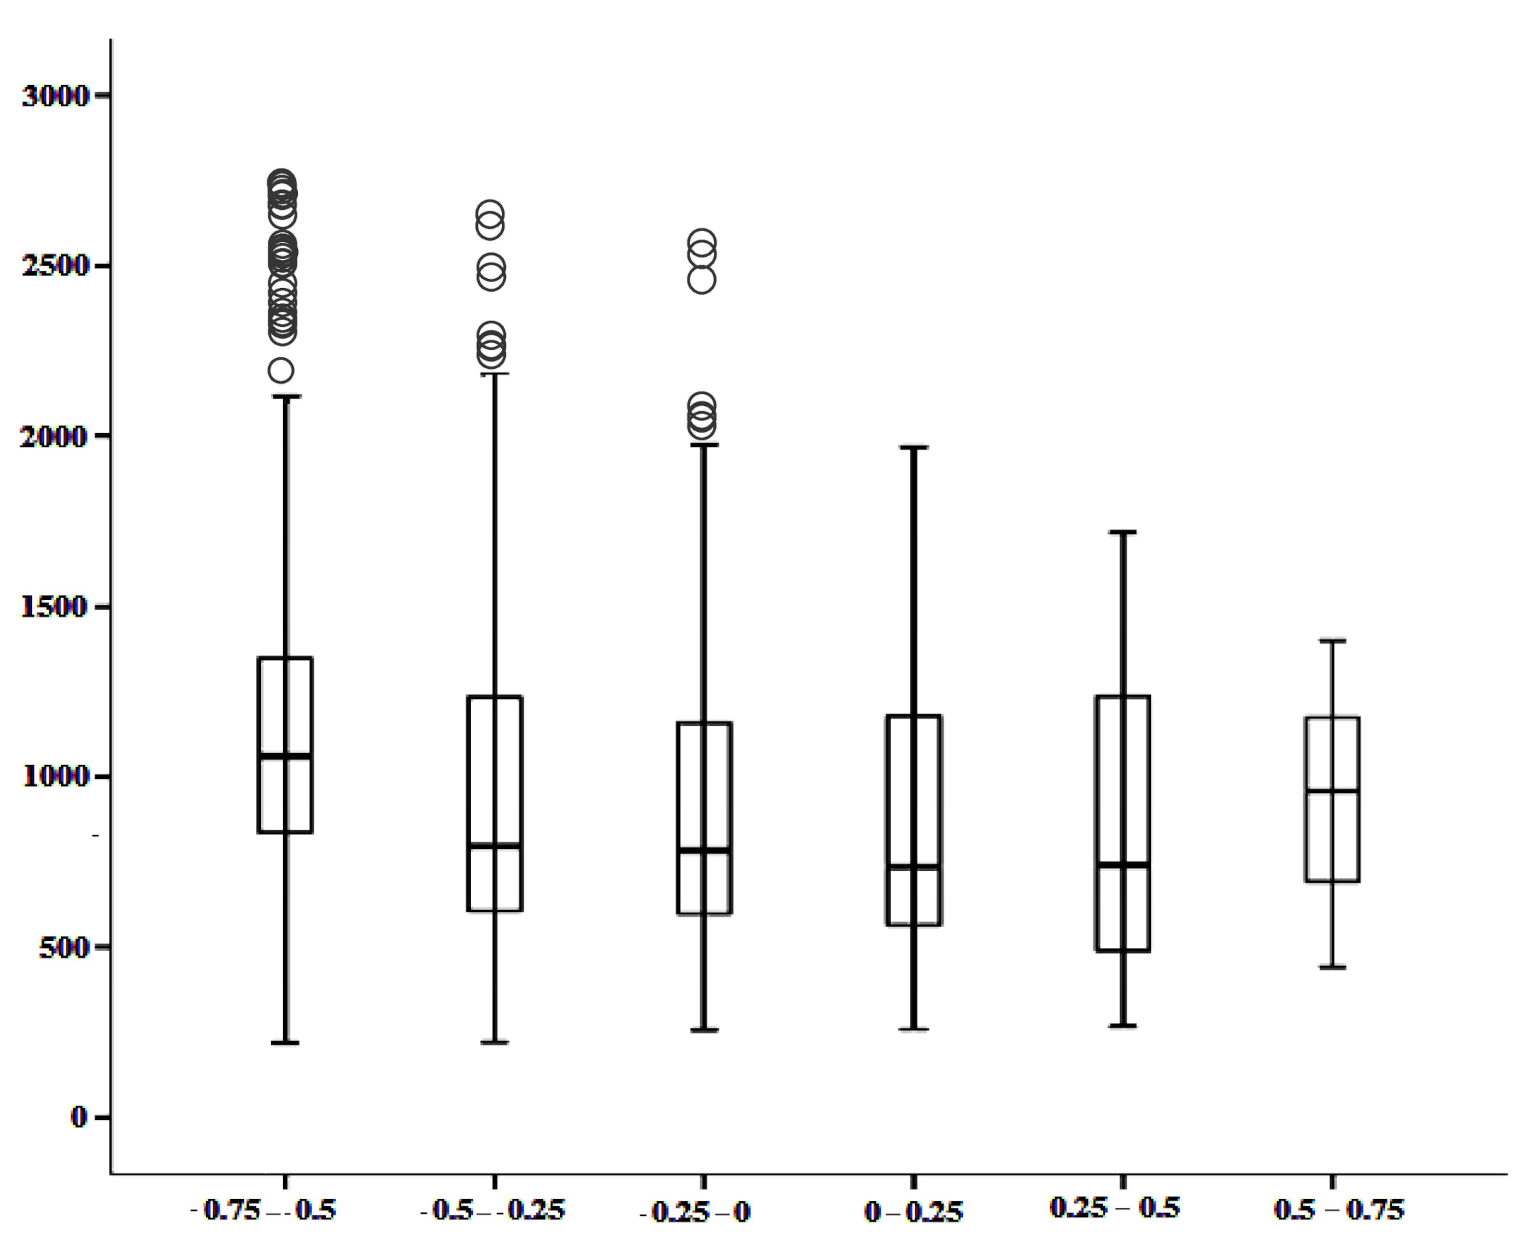
3.3. Sensitivity Assessment
4. Discussion and Conclusions
4.1. Affecting Factors
4.2. Changes of Potential Probability
4.3. Sensitivity Characteristics
4.4. Further Research
Author Contributions
Funding
Institutional Review Board Statement
Informed Consent Statement
Data Availability Statement
Conflicts of Interest
References
- Nakao, K.; Higa, M.; Tsuyama, I.; Matsui, T.; Horikawa, M.; Tanaka, N. Spatial conservation planning under climate change: Using species distribution modeling to assess priority for adaptive management of Fagus crenata in Japan. J. Nat. Conserv. 2013, 21, 406–413. [Google Scholar] [CrossRef]
- Tang, C.Q.; Dong, Y.-F.; Herrando-Moraira, S.; Matsui, T.; Ohashi, H.; He, L.-Y.; Nakao, K.; Tanaka, N.; Tomita, M.; Li, X.-S.; et al. Potential effects of climate change on geographic distribution of the Tertiary relict tree species Davidia involucrata in China. Sci. Rep. 2017, 7, 43822. [Google Scholar] [CrossRef] [PubMed] [Green Version]
- Zhang, K.; Yao, L.; Meng, J.; Tao, J. Maxent modeling for predicting the potential geographical distribution of two peony species under climate change. Sci. Total Environ. 2018, 634, 1326–1334. [Google Scholar] [CrossRef] [PubMed]
- Sony, R.K.; Sen, S.; Kumar, S.; Monalisa, S.; Jayahari, K.M. Niche models inform the effects of climate change on the endangered Nilgiri Tahr (Nilgiritragus hylocrius) populations in the southern Western Ghats, India. Ecol. Eng. 2018, 120, 355–363. [Google Scholar] [CrossRef]
- Zhuang, H.F.; Qin, H.; Wang, W.; Zhang, Y. Prediction of the potential suitable distribution of Taxus yunnanensis based on Maxent Model. J. Shanxi. Univ. 2018, 41, 233–240. [Google Scholar] [CrossRef]
- Hu, Z.J.; Zhang, Y.L.; Yu, H.B. Simulation of Stipa purpurea distribution pattern on Tibetan Plateau based on Maxent model and GIS. J. Appl. Ecol. 2015, 26, 505–511. [Google Scholar] [CrossRef]
- Wang, G.; Lin, H.L.; He, L.; Cao, A.C. Study on the response of potential distribution of Ageratina adenophora to climate change. Acta. Pratacult. Sin. 2014, 23, 20–30. [Google Scholar]
- Huang, W.L. Vgetation of Guizhou; Guizhou People’s Press: Guiyang, China, 1988; pp. 168–169. [Google Scholar]
- Sun, J.Y. Seedling and afforestation techniques of Cyclobalanopsis glauca. Anhui For. Sci. Technol. 2005, 30, 27. [Google Scholar]
- Xu, J.; Deng, M.; Jiang, X.L.; Westwood, M.; Song, Y.G.; Turkington, R. Phylogeography of Cyclobalanopsis glauca (Fagaceae), a dominant tree of East Asian subtropical evergreen forests, based on three chloroplast DNA interspace sequences. Tree. Genet. Genomes 2015, 11, 805. [Google Scholar] [CrossRef]
- Huang, Q.L.; Zheng, Q.R.; Yuan, X.R. Stand structure and productive forces of Cyclobalanopsis glauca germinating forest in Fujian. J. For. Environ. 1995, 15, 107–111. [Google Scholar] [CrossRef]
- Zhao, L.J.; Xiang, W.H.; Li, J.X.; Deng, X.; Cong, L. Floristic composition, structure and phytogeographic characteristics in a Lithocarpus glaber Cyclobalanopsis glauca forest community in the subtropical region. Sci. Silvae Sin. 2013, 49, 10–17. [Google Scholar] [CrossRef]
- Itô, H.; Sumida, A. Allometric and growth data of an evergreen oak, Quercus glauca, in a secondary broadleaved forest. Ecol. Res. 2017, 32, 105. [Google Scholar] [CrossRef] [Green Version]
- Long, S.S.; Zeng, S.Q.; Xiao, H.S.; Liu, F.; Hu, M. Analysis on the status of Cyclobalanopsis glauca secondary forest based on the improved Hegyi model. For. Res. Manag. 2018, 39, 50–56. [Google Scholar] [CrossRef]
- Peng, S.Y.; Li, T.H.; Wen, S.Z.; He, G.X.; Huang, S.J. Effect of different sand storage methods on the germination of Cyclobalanopsis glauca seed. J. Cent. S Univ. For. Technol. 2016, 36, 44–48. [Google Scholar] [CrossRef]
- Sun, L.; Ataka, M.; Kominami, Y.; Yoshimura, K. Relationship between fine-root exudation and respiration of two Quercus species in a Japanese temperate forest. Tree Physiol. 2017, 37, 1011–1020. [Google Scholar] [CrossRef]
- Ni, J.; Song, Y.C. Relationships between geographic distribution of Cyclobalanopsis glauca and climate in China. Acta. Bot. Sin. 1997, 39, 451–460. [Google Scholar]
- Cao, M.C.; Zhou, G.S.; Weng, E.S. Application and comparison of generalized models and classification and regression tree in simulating tree species distribution. Acta Ecol. Sin. 2005, 25, 2031–2040. [Google Scholar] [CrossRef]
- Yang, R.H. Current situation and utilization of wild woody vine resources in Guizhou. Seed 2008, 27, 55–57. [Google Scholar] [CrossRef]
- Scrivanti, L.R.; Anton, A.M. Impact of climate change on the Andean distribution of Poa scaberula (Poaceae). Flora 2021, 278, 151805. [Google Scholar] [CrossRef]
- Merow, C.; Smith, M.J.; Silander, J.A., Jr. A practical guide to MaxEnt for modeling species’ distributions: What it does, and why inputs and settings matter. Ecography 2013, 36, 1058–1069. [Google Scholar] [CrossRef]
- Phillips, S.J.; Anderson, R.P.; Schapire, R.E. Maximum entropy modeling of species geographic distributions. Ecol. Model. 2006, 190, 231–259. [Google Scholar] [CrossRef] [Green Version]
- Swets, J.A. Measuring the accuracy of diagnostic systems. Science 1988, 240, 1285–1293. [Google Scholar] [CrossRef] [PubMed] [Green Version]
- Ray, D.; Behera, M.; Jacob, J. Predicting the distribution of rubber trees (Hevea brasiliensis) through ecological niche modelling with climate, soil, topography and socioeconomic factors. Ecol. Res. 2016, 31, 75–91. [Google Scholar] [CrossRef]
- Spittlehouse, D. Climate Change. Impacts, Adaptation, and Vulnerability. J. Environ. Qual. 2001, 56, 81–111. [Google Scholar] [CrossRef]
- Matsui, T.; Yagihashi, T.; Nakaya, T.; Taoda, H.; Yoshinaga, S.; Daimaru, H.; Tanaka, N. Probability distributions, vulnerability and sensitivity in Fagus crenata forests following predicted climate changes in Japan. J. Veg. Sci. 2004, 15, 605–614. [Google Scholar] [CrossRef]
- Pearson, R.G.; Dawson, T.; Liu, C. Modelling species distributions in Britain: A hierarchical integration of climate and land-cover data. Ecography 2004, 27, 285–298. [Google Scholar] [CrossRef]
- Yagihashi, T.; Matsui, T.; Nakaya, T.; Tanaka, N.; Taoda, H. Climatic determinants of the northern range limit of Fagus crenata forests in Japan. Plant Species Biol. 2007, 22, 217–225. [Google Scholar] [CrossRef]
- Nakao, K.; Matsui, T.; Horikawa, M.; Tsuyama, I.; Tanaka, N. Assessing the impact of land use and climate change on the evergreen broad-leaved species of Quercus acuta in Japan. Plant Ecol. 2011, 212, 229–243. [Google Scholar] [CrossRef]


| Code | Description |
|---|---|
| BIO1 | Annual Mean Temperature |
| BIO2 | Mean Diurnal Range (Mean of monthly (max temp–min temp) |
| BIO3 | Isothermality (BIO2/BIO7) (* 100) |
| BIO4 | Temperature Seasonality (standard deviation * 100) |
| BIO5 | Max Temperature of Warmest Month |
| BIO6 | Min Temperature of Coldest Month |
| BIO7 | Temperature Annual Range (BIO5-BIO6) |
| BIO8 | Mean Temperature of Wettest Quarter |
| BIO9 | Mean Temperature of Driest Quarter |
| BIO10 | Mean Temperature of Warmest Quarter |
| BIO11 | Mean Temperature of Coldest Quarter |
| BIO12 | Annual Precipitation |
| BIO13 | Precipitation of Wettest Month |
| BIO14 | Precipitation of Driest Month |
| BIO15 | Precipitation Seasonality (Coefficient of Variation) |
| BIO16 | Precipitation of Wettest Quarter |
| BIO17 | Precipitation of Driest Quarter |
| BIO18 | Precipitation of Warmest Quarter |
| BIO19 | Precipitation of Coldest Quarter |
| Probability | Current Climate (km2) | (%) | RCP8.5 Scenario (km2) | (%) |
|---|---|---|---|---|
| 0.0–0.2 | 32,643.75 | 18.53 | 22,302.74 | 12.66 |
| 0.2–0.4 | 55,105.04 | 31.28 | 46,666.64 | 26.49 |
| 0.4–0.6 | 51,352.68 | 29.15 | 56,778.62 | 32.23 |
| 0.6–0.8 | 27,393.97 | 15.55 | 34,687.28 | 19.69 |
| 0.8–1.0 | 9671.57 | 5.49 | 15,731.71 | 8.93 |
| Negative | Positive | ||||
|---|---|---|---|---|---|
| SI | Area (km2) | (%) | SI | Area (km2) | (%) |
| −0.75 to −0.5 | 1814.52 | 1.03 | 0–0.25 | 115,830.32 | 65.75 |
| −0.5 to −0.25 | 5883.98 | 3.34 | 0.25–0.5 | 14,956.58 | 8.49 |
| −0.25 to 0 | 36,043.25 | 20.46 | 0.5–0.75 | 1638.35 | 0.93 |
| Total | 43,741.75 | 24.83 | Total | 132,425.25 | 75.17 |
| Negative | Positive | ||||||
|---|---|---|---|---|---|---|---|
| SI | Mean (m) | Max (m) | Mini (m) | SI | Mean (m) | Max (m) | Min (m) |
| −0.75 to −0.50 | 1136 | 2765 | 219 | 0.00–0.25 | 869 | 1967 | 258 |
| −0.50 to −0.25 | 921 | 2650 | 222 | 0.25–0.50 | 880 | 1717 | 267 |
| −0.25 to 0.00 | 899 | 2596 | 257 | 0.50–0.75 | 933 | 1401 | 442 |
Publisher’s Note: MDPI stays neutral with regard to jurisdictional claims in published maps and institutional affiliations. |
© 2022 by the authors. Licensee MDPI, Basel, Switzerland. This article is an open access article distributed under the terms and conditions of the Creative Commons Attribution (CC BY) license (https://creativecommons.org/licenses/by/4.0/).
Share and Cite
Li, W.; Hu, J.; Feng, T.; Liu, Q. Suitability and Sensitivity of the Potential Distribution of Cyclobalanopsis glauca Forests under Climate Change Conditions in Guizhou Province, Southwestern China. Atmosphere 2022, 13, 456. https://doi.org/10.3390/atmos13030456
Li W, Hu J, Feng T, Liu Q. Suitability and Sensitivity of the Potential Distribution of Cyclobalanopsis glauca Forests under Climate Change Conditions in Guizhou Province, Southwestern China. Atmosphere. 2022; 13(3):456. https://doi.org/10.3390/atmos13030456
Chicago/Turabian StyleLi, Wangjun, Jun Hu, Tu Feng, and Qing Liu. 2022. "Suitability and Sensitivity of the Potential Distribution of Cyclobalanopsis glauca Forests under Climate Change Conditions in Guizhou Province, Southwestern China" Atmosphere 13, no. 3: 456. https://doi.org/10.3390/atmos13030456
APA StyleLi, W., Hu, J., Feng, T., & Liu, Q. (2022). Suitability and Sensitivity of the Potential Distribution of Cyclobalanopsis glauca Forests under Climate Change Conditions in Guizhou Province, Southwestern China. Atmosphere, 13(3), 456. https://doi.org/10.3390/atmos13030456