Article

Possible Relationships between the Interdecadal Anomalies of Heavy Rainfall under Northeastern China Cold Vortexes and the Sea Surface Temperature (SST)

1
Collaborative Innovation Centre on Forecast and Evaluation of Meteorological Disasters, Key Laboratory of Meteorological Disasters of Ministry of Education/Joint International Research Laboratory of Climate and Environment Change, Nanjing University of Information Science and Technology, Nanjing 210044, China
2
Changchun Meteorological Bureau, Changchun 130051, China
3
Tianjin Meteorological Observatory, Tianjin 300074, China
*
Author to whom correspondence should be addressed.
Atmosphere 2022, 13(2), 354; https://doi.org/10.3390/atmos13020354
Submission received: 17 January 2022 / Revised: 14 February 2022 / Accepted: 14 February 2022 / Published: 19 February 2022

Abstract

:
As an important component of the East Asian monsoon system, the northeast cold vortex (NECV) exerts a significant impact on weather and climate, especially in Northeast China. This study investigated the interdecadal spatiotemporal variability of heavy rainfall under the cold vortex of Northeast China (NECVHR) and its relationship with sea surface temperature (SST) during 1961–2019 over Northeast China. To investigate the dominant factors affecting variability in the heavy rainfall between May and September, an empirical orthogonal function (EOF) analysis was performed. To detect the trends and changes, a Mann-Kendall (MK) test was used. The sliding t-test was used to identify the change points and the significance. Pearson correlation analysis was used to analyze the relationship between SST and NECVHR, and the t-test was used to verify the significance. The results showed that the total amount of cold vortex heavy rainfall during May–September ranged from 153 to 12,509 mm for 1961–2019. An abrupt interdecadal change was seen after 2014 in Northeast China. The EOF analyses revealed that the first, second, and third EOFs explain 76%, 12.1%, and 5.5% of the total variance, respectively. The EOF followed the heavy rainfall pattern, with increases in the south (southeast) and decreases in the north (northwest) over Northeast China. Heavy rainfall over Northeast China positively correlated with the Atlantic multidecadal oscillation (AMO) index. The heavier rainfall under cold vortex (MCVHR) years revealed that the equipotential height was obviously located over the Sea of Japan, west of Northeast China and the Qinghai Tibet plateau. The cyclonic circulation over the East China Sea and north (northeasterly) wind prevails over Northeast China during less heavy rainfall under cold vortex (LCVHR) years. A high anticyclonic circulation over the Qinghai Tibet plateau resulted in stronger cold advection over Northeast China. The anticyclonic circulations over the East China Sea and the Sea of Japan (east), and the western (southwesterly) winds prevail over Northeast China, with a relatively shallow cold trough over the Qinghai Tibet plateau. The findings in this paper provided a better understanding of the interdecadal variability of NECVHR over Northeast China. The findings can be helpful for several stakeholders regarding agricultural production, water resource management, and natural habitat conversation in Northeast China.

1. Introduction

The Intergovernmental Panel on Climate Change (IPCC) Sixth Assessment Report stated that climate change due to global warming is exacerbating water cycles around the world, including causing extreme precipitation [1]. Global warming has also contributed to more extreme weather events, such as heavy rains or severe floods [2]. Northeast China is located in the middle and high latitudes of eastern Asia and is located on the eastern side of the Greater Hinggan Mountains, which occupies 13% of the country. The special topography and land–sea thermal contrast make Northeast China one of the regions where cut-off lows are frequent [3]. The cut-off low in Northeast China is called the Northeast China cold vortex (NECV). The NECV is the cut-off low of the blocking system in this region that, therefore, generally experiences the pressure of a cut-off low. The location and intensity of the cut-off low determine the intensity and distribution of precipitation [4]. The statistics of 274 low cut-off cases in the Mediterranean region showed that 54% of them produce intense precipitation [5]. In spring and autumn of southwest Australia, the amount of contribution to precipitation from cut-off lows accounted for more than 40% yet decreased in August. Moreover, the contribution of precipitation accounts for half of the entire crop-growing season [6,7]. The precipitation from cut-off lows in the eastern province of South Africa contributed the most in winter and the least in summer [8]. The results of research on the pressure of cut-off lows contribute to a better understanding of NECVs.
Northeast China is a region with an important agricultural production basis and is known as one of the golden corn belts in world. Some researchers in the late 1970s noticed that the Northeast China cold vortex is an active and frequently occurring weather system over Northeast Asia, which is caused under specific topographical conditions and land–sea thermal contrast on the local and regional scales that cause heavy rainfall and flooding [9]. Previous research showed that precipitation increased in spring and summer due to persistent NECVs in Northeast China [10]. In the 21st century, monsoon precipitation was more frequent and stronger than that from previous decades [11], and 66% of the NECV can cause heavy rainfall in summer [12]. Precipitation under NECV activity corresponded well with the accumulated precipitation in Northeast China during the same period in terms of both spatial distribution and temporal evolution of precipitation, and about ¼ of the annual precipitation is associated with NECVs [13]. Due to heavy rainfall, floods in Northeast China, which have significant impacts on crop growth and agricultural production from May to September, pose a major risk to grain security.
For heavy rainfall under NECVs (NECVHR), meteorologists have reported a large and meaningful number of findings [14,15,16]; the results show the structural characteristics of NECVs that produce heavy rainfall [17]. In addition to mesoscale research, many relevant studies on the climate characteristics of heavy rainfall under NECVs have been advanced this area of research in Northeast China. Zhao and Sun [18] argued that the summer monsoon is a crucial factor for heavy precipitation under the NECV. In the summer, when the NECV is active, the troposphere in East Asia maintains a deep dipole-type potential height anomaly, the high-altitude rapids are shifted southward and strengthened, and the low-level northwest Pacific anticyclonic anomaly and the eastern anomaly in the mid-latitude region contribute to the convergence of local water vapor flux, which, in turn, favors precipitation. The well-defined cold vortex intensity index (NECVI) is a well-known indicator of this relationship with extreme precipitation. Water vapor converges in the negative abnormal years of NECVI, corresponding to enhancements in heavy precipitation in Northeast China [19]. A strong (weak) Okhotsk High is conducive (detrimental) to the convergence of cold air transported by northeast cold vortex and water vapor from east of Northeast China, eventually leading to an increase (decrease) in precipitation [20]. Lagrangian studies can provide more robust conclusions on the moisture transport and sources of cut-off lows [21]. A wind field of 850 hPa, used as a characteristic index of regional precipitation, can even predict the start date of heavy precipitation. In early and late summer, the water vapor anomaly mainly converges in the southwest during strong NECVI years [19]. Low tropospheric relative humidity (RH) is a prominent environmental factor during the monsoon season [22] and is influenced by the effect of the terrain on the NECVHR [23,24].
In addition, many new findings have been presented on factors in the prediction of exogenous forces such as SST on the low and high frequency characteristics of the NECV, providing a better perspective for in-depth studies. A diagnostic analysis of the causes of abnormal precipitation in early summer revealed that the North Atlantic Sea temperature triples and that the black tide area caused by air–sea interactions causes upstream and downstream blockage in the high-pressure circulation system and affect the amount of precipitation under NECV [25]. During the previous spring, the above-normal precipitation under NECVs were caused by (a) warm sea surface temperature (SST) anomalies in the tropical northern Indian Ocean, (b) a positive thermal contrast tendency in the tropical West–East Pacific SST, and (c) a positive tendency toward North Atlantic tripolar SST. This scholar then investigated the effects of the cold vortex intensity index and SST [26]. The impact of SST on the intensity of the NECV that the south–north inverse SSTs of the Northwest Pacific during March and the SSTs of the tropical Southeast Pacific during May, which forcefully formed the double-blocking low-vortex types and East Asia Pacific teleconnection types during the early summer months, which caused the anomalies in the NECV intensities. Lastly, Fang et al. [27] described the distribution of the SST anomalies as having a close relationship with the formation of the NECV. These precursors enhance the anomalous low-level anticyclone over the western North Pacific and southerly anomalies over Northeast China in late summer, which are beneficial to enhancing the amount of precipitation under NECV [18].
This study investigated the interdecadal spatiotemporal variability of heavy rainfall under the cold vortex of Northeast China (NECVHR) and discussed the connection with SST during 1961–2019 over Northeast China. Previous work mostly focused on the variability in season or interannual precipitation over Northeast China, with few studies on NECVHR extended to the interdecadal time scale. The findings in this paper provided a better understanding of the interdecadal variability in NECVHR over Northeast China, and our assessment could enhance the predictability of extreme precipitation events such as droughts and floods. Moreover, such findings can also be helpful in planning crop cultivation, in increasing economic growth, in managing water resources, and in preserving natural habitats in Northeast China.
The rest of the article is organized as follows: Section 2 describes the study area and data; Section 3 describes the datasets and the methods of analysis used in this study. In Section 4, we illustrate the results of interdecadal variability in NECVHR during May to September over Northeast China. In addition, in this section, we present NECVHR anomalies associated with large-scale atmospheric circulation patterns and SST, and a conclusion and further discussions are provided in Section 3.

2. Materials and Methods

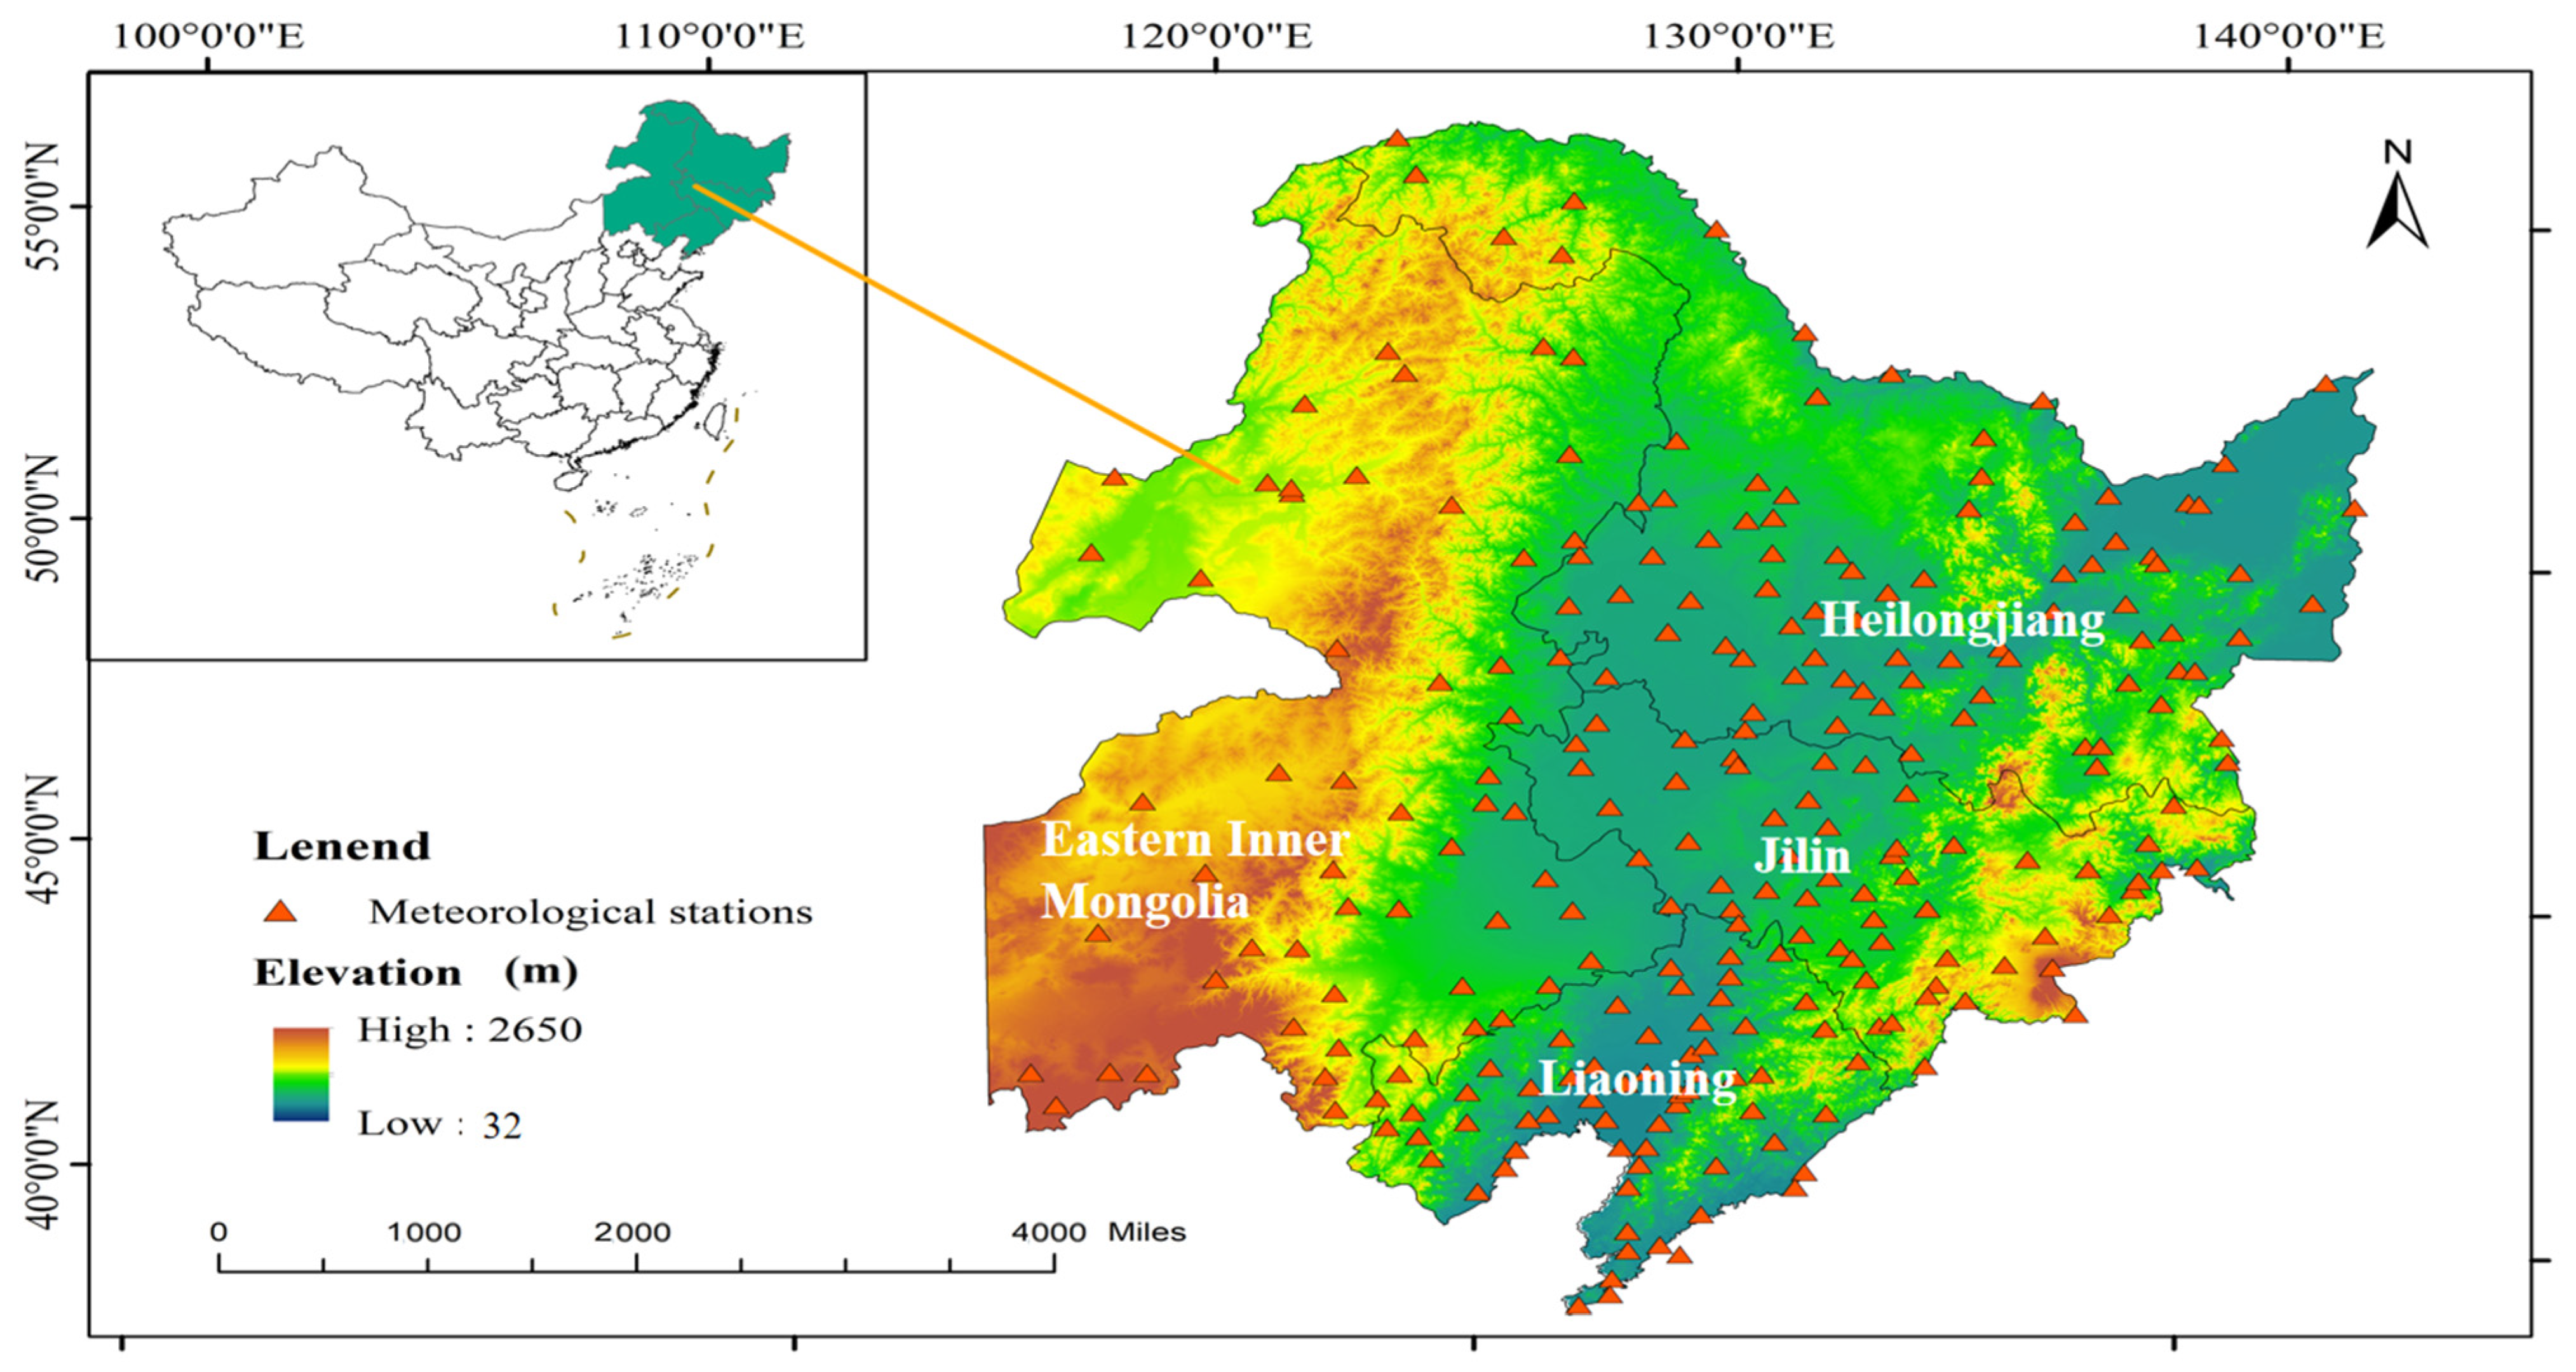
2.1. Study Area and Data Observation

The study area was located at 115°52′ E–135°09′ E, 38°72′ N–53°55′ N and included the provinces of Liaoning, Jilin, and Heilongjiang and eastern Inner Mongolia [28]. The precipitation data (May–September) across Northeast China during 1961–2019 were collected and provided by the National Meteorological Information Center of China Meteorological Administration (CMA). Consistency and complete data from 256 meteorological sites and the same period (1961–2019, 59 years) were selected, as shown in Figure 1. In this study, we defined NECVHR as 24-h cumulative precipitation (starting from 8 pm Beijing time) greater than 50 mm under Northeast China cold vortex.

2.2. Reanalysis Data and SST

The European Centre for Medium-Range Weather Forecasts (ECMWF) recently developed a global reanalysis product, namely ERA-5, used in the current study. ERA-5 is the fifth global atmospheric reanalysis product developed by ECMWF following FGGE, ERA-15, ERA-40, and ERA-Interim, with key strengths and improvements over ERA-Interim. Large-scale treatment of precipitation and clouds, the inclusion of analytical variables for precipitation, model boundary layer conditions, and radioactive data are among the key features of the ERA-5 dataset [29]. With these improvements, the output appeared to represent the large-scale tropospheric circulations after 1979, maintained a higher resolution in time and space, and included many new satellite products into the assimilation system [30]. This study used meridional and zonal wind components, the geopotential, the relative humidity, and the vertical velocity at different pressure levels; global monthly SST data were obtained from the National Oceanic and Atmospheric Administration (NOAA) Extended Reconstructed Sea Surface Temperature (SST) V5 dataset [31] from 1854 to the present derived.

2.3. Methodology

2.3.1. Empirical Orthogonal Function (EOF)

An EOF analysis was applied to investigate the dominant modes of variability of NECVHR (May–September) in the target region. The EOF analysis is a statistical method broadly used to minimize the multidimensionality of complex climate data and to classify the most complex physical modes, while confirming that minimum material is lost [32] and has been widely used, e.g., in [33,34,35,36]. The method can decompose a complex data set varying in time and space into a set of EOFs, and an associated principal component time series (PCs) can provide insight into the most dominant modes of spatial variability. The EOFs and PCs of a data set describe a new basis, where, instead of a series of spatial observations varying in time, the data set is represented as a set of fixed spatial patterns or modes, which represent a given amount of total variance in the data set, and a set of time series describing how each pattern changes with time [37]. The input data we used was the 10-year average NECVHR during 1961–2019. The output of the EOF modes that account for the largest percentage of the original variability are considered significant [38]. These modes can be signified by orthogonal spatial patterns (Eigenvectors) and corresponding time series (principal components (PC)). The orthogonal function of EOF is defined in Equation (1);
Z ( x , y , t ) =   k = 1 N P C ( t )   ×   E O F ( x , y )
where Z ( x , y , t ) denotes the function for space ( x , y ) and time ( t ) ; thus, EOF ( x , y ) represents the spatial structures ( x , y ) of the temporal variation of Z. P C ( t ) is the principal component that shows the amplitude of each EOF varying with time. In is the target region that has been successfully applied to investigate the interdecadal variability of summer monsoon rainfall [39].

2.3.2. Mann-Kendall Test (MK)

The non-parametric Mann-Kendall (MK) test is the most regularly used approach in hydro-meteorological time series to detect trends/changes. The test does not need a normal distribution and is active against outliers, missing values, and abrupt changes in time series [40,41,42]. The Mann-Kendall non-parameter test (MK method), which analyzes trends, is utilized to detect the trend of NECVHR.
In addition, to identify change points and significance, the sliding t-test was simultaneously used [43]. Moreover, the Pearson correlation analysis [44] was also employed to analyze the relationship between SST and NECVHR, and the t-test was used to verify the significance.

3. Results and Discussion

3.1. Climatology of Heavy Rainfall under Northeast Cold Vortex (NECVHR)

Figure 2 shows the spatial distribution of the total cold vortex heavy rainfall from May to September over Northeast China from 1961 to 2019. The heavy rainfall pattern exhibited a dipole: being high in the south (southeast) and being low in the north (west) (Figure 2). Therefore, heavy maxima rainfall was seen over Liaoning and the east tip of the Jilin regions, while the lowest heavy rainfall was observed in the north, where Heilongjiang, Hulun Buir (north and west), and Chifeng are located (Figure 2). The total amount of cold vortex heavy rainfall during May–September was ranged from 153 (lowest) to 12,509 (highest) mm during 1961–2019. The minimum amount of NECVHR we found for an arctic village in Heilongjiang Province, only three times during this period (1961–2019). The maximum amount of NECVHR was about 12,000 mm, which occurred for Dandong city in Liaoning Province, where the amount of water vapor was abundant due to its location near the sea.

3.2. Temporal Scale of Interdecadal Variability in NECVHR

The time series of the interdecadal variability in cold vortex heavy rainfall over Northeast China (NECVHR) is shown in Figure 3. The results decreased during the 1980s before increasing in the early 1991s, reaching its peak decrease (increase) around 1998 (2019). The second climax was observed in 2014; the heavy rainfall increased in the recent decade over Northeast China. We classified more NECVHR (MCVHR) and less NECVHR (LCVHR) based on the standardized rainfall anomaly as being ≥1 and ≤−1 for more and fewer years, respectively. The MCVHR periods were 2016–2019; typical LCVHR years were observed during 1979–1985. The MCVHR and LCVHR years were further used to study atmospheric circulation in the region.
Figure 4 shows the interdecadal variability in heavy rainfall and rainstorm frequency over Northeast China during 1961–2019. The results explain the frequency of heavy rainfall over Northeast China, with the lowest peak in 1979 and the highest peak in 2019 (Figure 4). Moreover, the frequency of rainstorms shows the lowest peak in 1984 and the highest peak in 2018. Therefore, in summary, the results show that the recent decade has seen frequent extreme events such as heavy rainfall and rainstorms over Northeast China.
The sequential Mann-Kendall test statistic results were calculated for interdecadal NECVHR variability over the region to detect the statistically significant turning points in the decadal trend of heavy rainfall in Northeast China (Figure 5). An abrupt interdecadal change was noted during 2014; however, there was a significant reduction (at the 95% confidence level) in rainfall during the 1980s (Figure 5).
The sequential Mann-Kendall test results were calculated for interdecadal heavy rainfall over Northeast China to detect the statistically significant turning points in the decadal trend for heavy rainfall in the region (Figure 5). An abrupt interdecadal change was noted in 2014, which is interesting; the result showed that the recent decade experienced extreme climatic conditions over Northeast China.

3.3. Interdecadal Variations in Heavy Rainfall and Associated Circulation

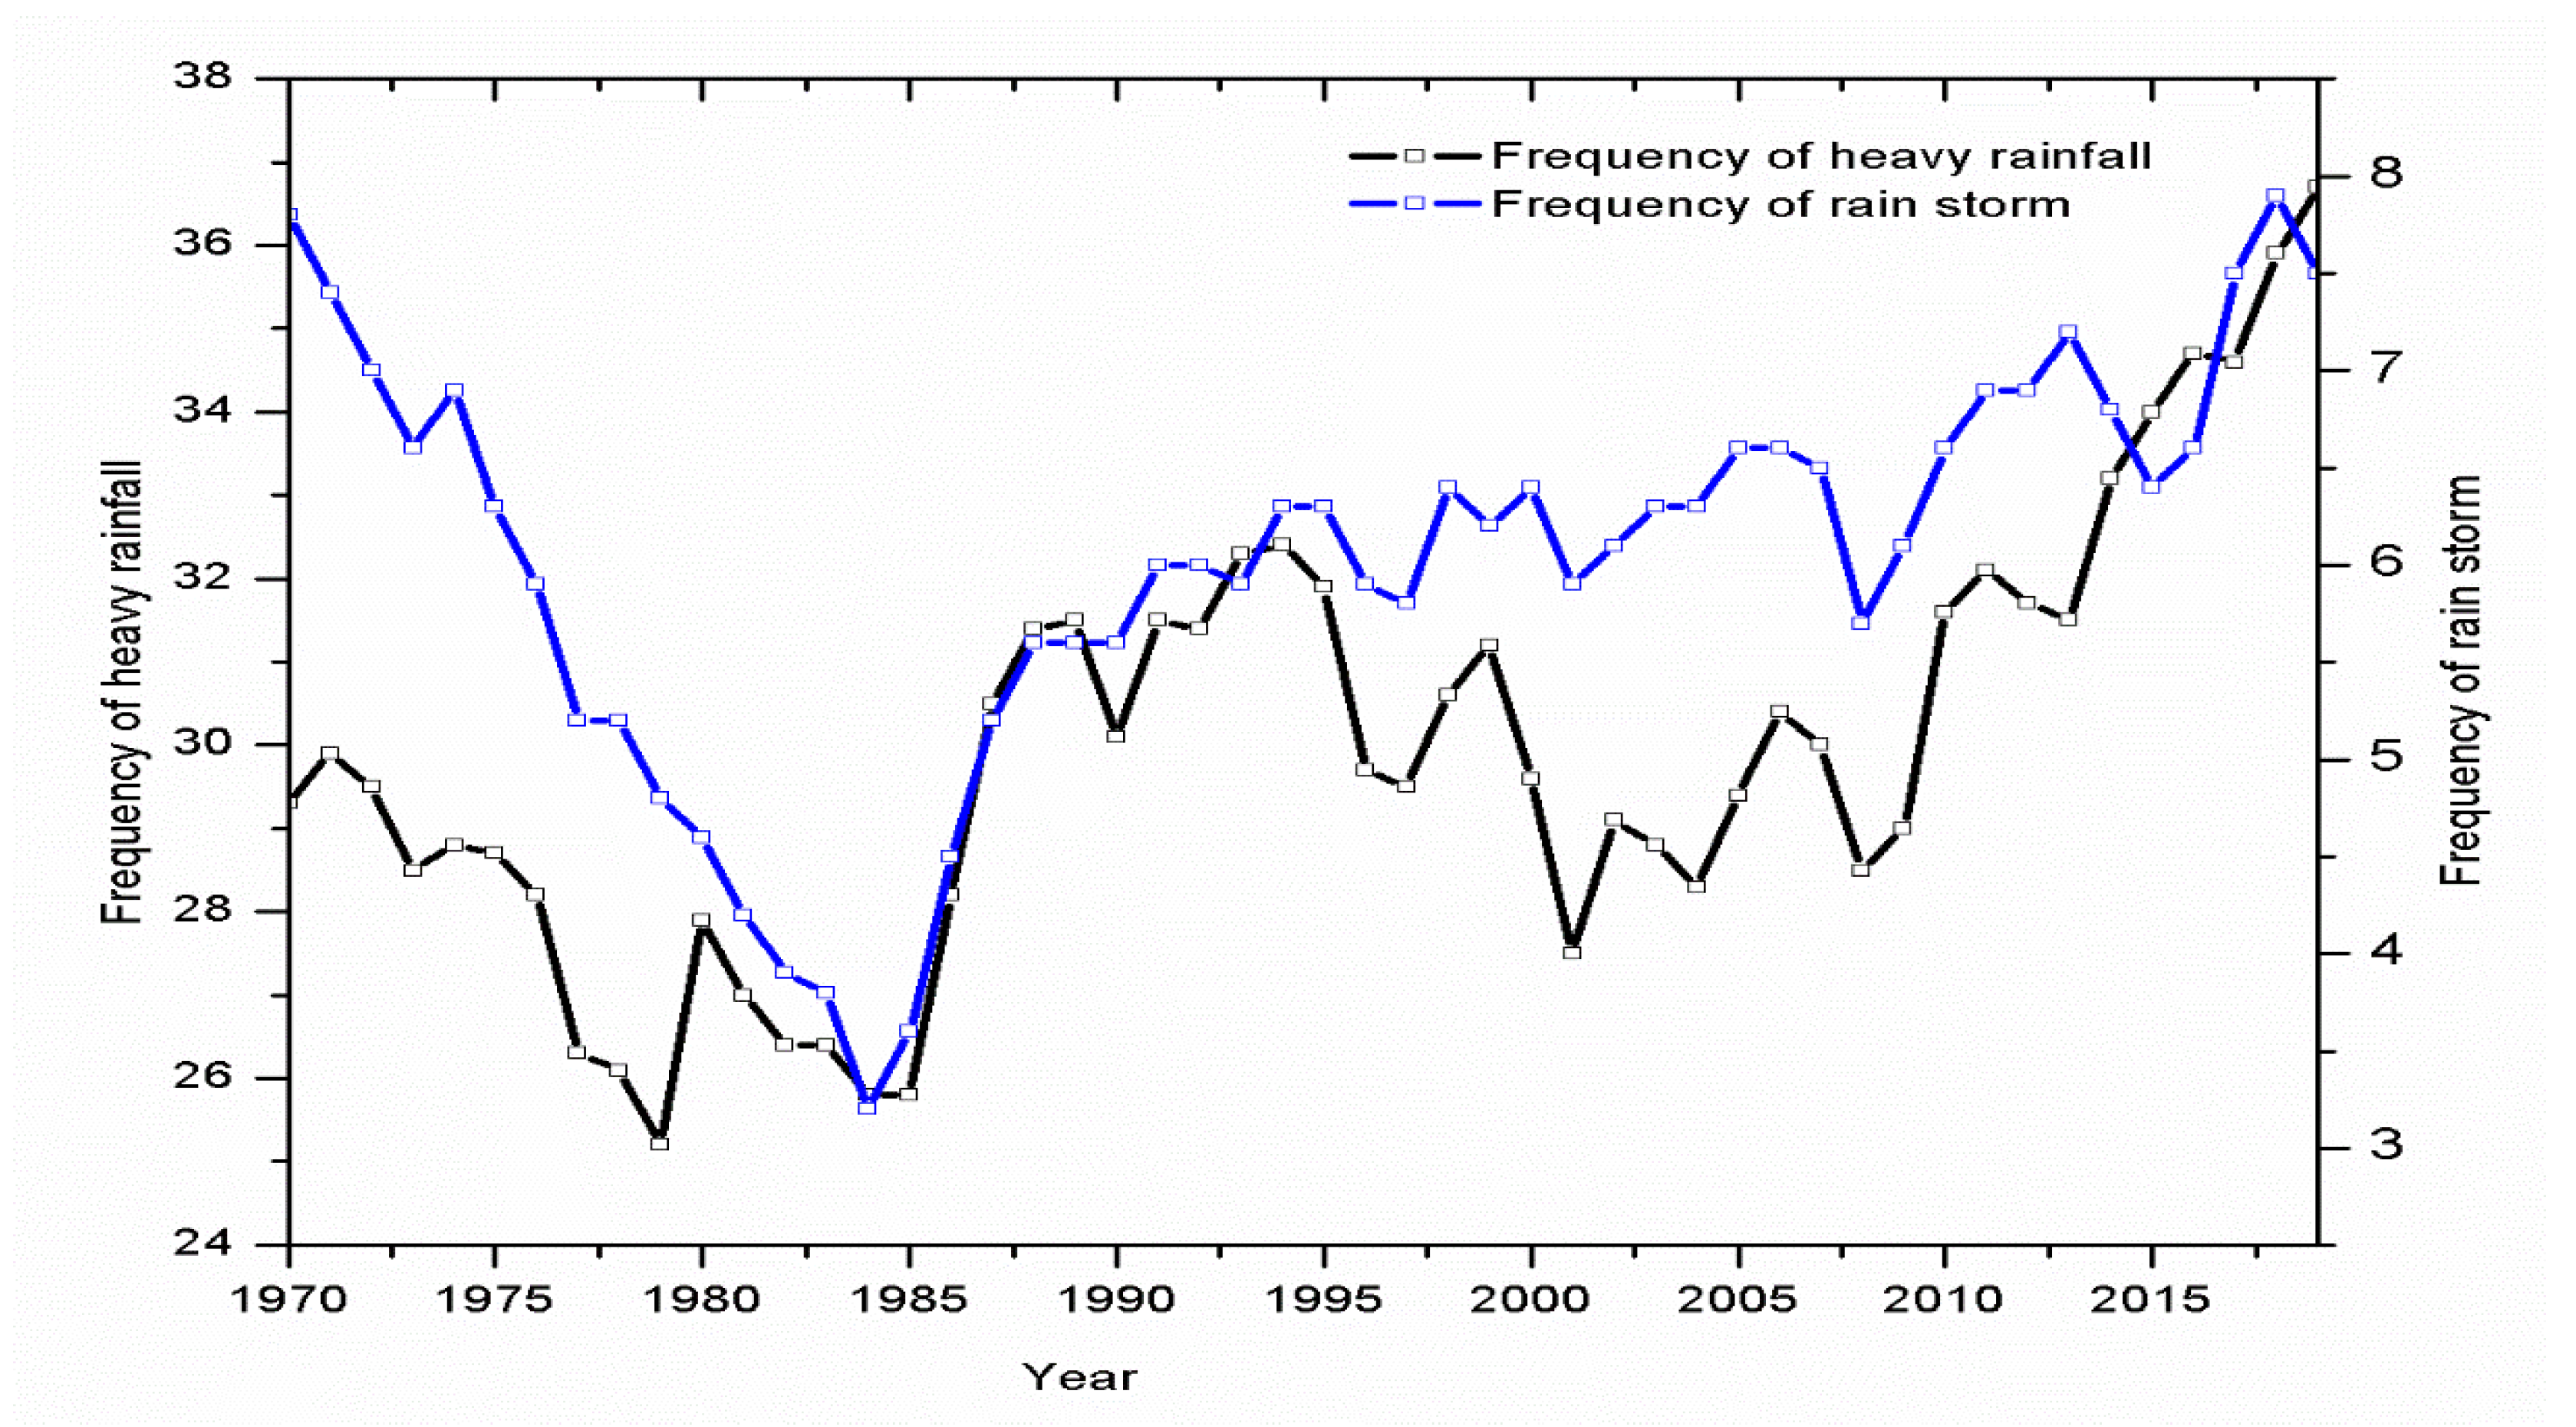
3.3.1. Interdecadal Heavy Rainfall Variability

The EOFs were examined with the first three eigenvectors of heavy rainfall in Northeast China for the 10-year running mean (Figure 6). The results revealed that the first EOF (EOF1), explaining 76% of the total variance, showed a dipole spatial pattern with positive loading in the south (southeast) (i.e., Liaoning and Jilin regions) and negative loading in the north (northwest) (i.e., Heilongjiang, Hulun Buir, Hinggan League, Chifeng, and Tongliao) (Figure 6a). The corresponding PC-1 is explained in Figure 6b. Moreover, the t-test from PC-1 exhibited interdecadal variability (Figure 6c). The MK test from PC1 shows abrupt changes in 2002 after an increase but decreased in 2015 (Figure 6d). EOF2, explaining 12.1% of the total variance, exhibited a dipole pattern similar to EOF1 (Figure 6e), revealing that the PC time series is related to EOF2 (PC2) (Figure 6f). The t-test results showed the highest peak for 1990, with a gradually significant decrease (Figure 6g). The MK test results revealed an abrupt change in extreme precipitation, increasing again in 2013, but decreasing in 2016 and onwards, as shown in Figure 6h. The third EOF (EOF3), explaining 5.5% of the total variance, showed a positive (negative) loading pattern similar to EOF1 (EOF2) (Figure 6i), and the time series of the interdecadal consistent PC was connected to EOF3 (PC3), as shown in Figure 6j. The t-test shows significantly decreases in heavy rainfall in the 1990s (Figure 6k). Moreover, the MK-test result showed an abrupt change in 1988 and, after, an increase to the highest peak in 1998, but decreased again in 2016 (Figure 6l). Therefore, all of the results for EOF1, EOF2, and EOF3 followed the same heavy rainfall pattern, which presented an increase in the south (southeast) and a decrease in the north (northwest) over Northeast China.

3.3.2. Large-Scale Atmospheric Circulation Pattern

Figure 7 elucidates the composite anomalies for a 500 hPa geopotential height and horizontal and vertical winds at 850 hPa based on the 95% confidence level for May–September during 1961−2019 across the heavier rainfall under cold vortex (MCVHR), less heavy rainfall under cold vortex (LCVHR), and their differences. Figure 7a presents the results of MCVHR years and reveals that the equipotential height is obviously located over the Sea of Japan, west of Northeast China and the Qinghai Tibet plateau. The 500 hPa equipotential height is shown to be at 35–80° N and 85–180° E (Figure 7a). Westerly (southwesterly) winds prevailed over Northeast China during MCVHR (Figure 7a) years. During LCVHR years, the equipotential height was in the Qinghai Tibet plateau (Figure 7b). Moreover, cyclonic circulation over the East China Sea and the north (northeasterly) wind prevailed over Northeast China during LCVHR years (Figure 7b). However, anticyclonic circulation over the Qinghai Tibet plateau was high (Figure 7b), therefore, resulting in stronger cold advection over Northeast China (Figure 7b). Figure 7c describes the difference between MCVHR years and LCVHR years and Figure 7a presents the results of MCVHR years, which revealed that the 500 hPa equipotential height is at 30–80° N and 85–180° E (Figure 7a). Moreover, the range of influence for the northeast cold vortex with the southward position expands, as shown in Figure 7c. The anticyclonic circulations over the East China Sea and the Sea of Japan (east), and the western (southwesterly) winds prevail over Northeast China with a relatively shallow cold trough over the Qinghai Tibet plateau (Figure 7c).
Figure 8 shows the relative humidity (RH) and winds at the 850 hPa level during 1961−2019 at the 95% significant level for MCVHR years and LCVHR years. Figure 8a presents 70–80% relative humidity (RH) in the eastern part of Northeast China, 60–70% RH in the western part of Northeast China, and southwest wind flow over Northeast China during MCVHR years. Moreover, during LCVHR years, 70–80% RH over Northeast China and southwest wind flow received were observed for the region (Figure 8b). However, the eastern inner Mongolia region exhibited less RH (60–70%) compared with other regions (Figure 8). As shown in Figure 8, four airflow currents with good humidity conditions affected Northeast China. One was from the tropical Indian Ocean, which traveled from east to west of the Philippines and then turned north; one was a direct northward flow from the South China Sea; one from the Bay of Bengal, also eastward and then northward; and one from the south side of the subtropical region with high pressure, westward and then northward. In comparison, the southwesterly rapids were stronger in MCVHR years, while the dry intrusion of cold air from Lake Baikal was evident. In MCVHR years, the relative humidity was higher, and the easterly rapids were stronger, intensifying the convergence of cyclones and leading to heavier rainfall.
Upon further examination of the vertical velocity of pressure (ω) over Northeast China during MCVHR years and LCVHR years along the latitudes 42°N and 50° N (Figure 9), the rising motion is related to low-level convergence and upper-level divergence. The results revealed that upward (rising) motions over the region were significant, positive anomalies at 42° and 50° N (Figure 9a,c). Satyamurty et al. [45] showed that the ascending motions greatly indicate cold vortex development. However, a rise (sink) in the east (central) region is seen at 50°N (Figure 9a,c). The sinking motion occurred over this region during LCVHR years, characterized by significant positive anomalies at 42° and 50° N (Figure 9b,d). However, the rising motion in the eastern part of Northeast China was seen at 42° N.

3.3.3. Relationships between the NECVHR and SST

This section of the study focuses on revealing the relationships between heavy rainfall under the cold vortex of Northeast China (NECVHR) and SST within the same time period. The time series of the NECVHR anomaly and the SST indexes (i.e., the southern oscillation index (SOI), Atlantic multidecadal oscillation (AMO), Arctic oscillation index (AO), North Pacific index (NP), North Atlantic oscillation (NAO), and Pacific decadal oscillation (PDO)) is shown in Figure 10. In addition, the correlation coefficients between various indices and NECVHR for the interdecadal component are shown in Table 1. The results show that the AMO index and NECVHR are highly significantly correlated (0.66) compared with other indices (i.e., NP, NAO, AO, PDO, and SOI).
Upon further examination of the interdecadal spatial correlation coefficients between the heavy rainfall under Northeast China cold vortex (NECVHR) and the AMO index from May to September during 1961–2019 (Figure 11), Figure 11a explains the weak positive correlation over the eastern side of the Northeast China region, especially in Heilongjiang province, and the weak negative correlation over the west central region of Inner Mongolia area during the early summer season of May. Moreover, a weak positive correlation was seen over Jilin and the northeast part of the Inner Mongolia area, but the northern tip of Heilongjiang, south of Heilongjiang (Inner Mongolia), showed a weak negative correlation in June (Figure 11b). During July, a significant positive correlation was seen over the northern (northeastern) part of northeast China, i.e., Inner Mongolia (Heilongjiang; Jilin (east) and Liaoning (south)) (Figure 11c). However, a significant negative correlation was seen in the western part of northeast China (i.e., south of Inner Mongolia) (Figure 11d). In August, the results showed that most areas showed a weak positive correlation, especially in eastern regions such as Heilongjiang, and the borders between Heilongjiang and Inner Mongolia and between Heilongjiang and Jilin. However, the north tip of Heilongjiang and south of Inner Mongolia showed weak negative correlations (Figure 11d).
The results observed a weak positive correlation between the northern, eastern, and southern parts of Northeast China; however, a weak negative correlation was observed in pockets of the study area (Figure 11f). Last but not least, Figure 11e revealed that most of Northeast China showed negative correlations except Jilin, Heilongjiang (south), and Inner Mongolia (south), which showed positive correlations during September. Figure 11f shows the average May–September correlation over the region. In summary, the interdecadal spatial correlation suggested that a positive AMO index leads to heavy rainfall from the Northeast China cold vortex (NECV), and vice versa. Our finding is in accordance with the Atlantic SST anomalies causing atmospheric diabatic heating, which simulates quasi-barotropic mid to high-latitude Rossby wave trains to move downstream through air–sea interactions [25,26,46].
Upon further study of the interdecadal variability in spatial distribution of the correlation coefficients between NECVHR and SST during May-September (1961–2019), shown in Figure 12, during May, the South China Sea, the Philippine Sea, the Pacific Ocean (north and east), and the Atlantic Ocean (north and south) displayed significant positive correlations (Figure 12a). Interestingly, the East China Sea showed weak negative correlations (Figure 12a). The North Pacific Ocean and the East China Sea presented significant negative correlations during June (Figure 12b). Oppositely, the Southeast Pacific Ocean and Atlantic Ocean (north and south) showed significant positive correlations in June (Figure 12b). Our results are in accordance with the previous findings by Fang et al. [26], which explained that the SST anomalies in the tropical Southeast pacific in May were due to the formation of double-blocking low-vortex types and East Asia Pacific teleconnection types during the early summer months, which resulted in anomalies in the NECV intensities. Moreover, Gao and Gao [47] indicated that the subtropical southeast Pacific SST anomaly can cause anomalous circulation in the mid-high latitudes of the northern hemisphere, thus, affecting the intensity of the NECV over Northeast China. Generally, the oceans showed significant positive correlations, except the southeast Pacific Ocean during July (Figure 12c). In August, the Southeast Pacific Ocean showed a negative correlation as opposed to the significant positive correlation of the China Sea, the North Pacific Ocean, and the Philippine Sea (Figure 12d). During September, most oceans showed cold SST spatial patterns with negative correlations except the Pacific Ocean (north and south) (Figure 12e). The season from May to September generally explained the significant positive correlation overall for all oceans but the negative correlation in the Southeast Pacific Ocean (Figure 12f).

4. Conclusions

In this study, we investigated the interdecadal spatiotemporal variability in heavy rainfall under the cold vortex of Northeast China (NECVHR) and its relationship with SST during 1961–2019 over Northeast China.
We concluded the following:
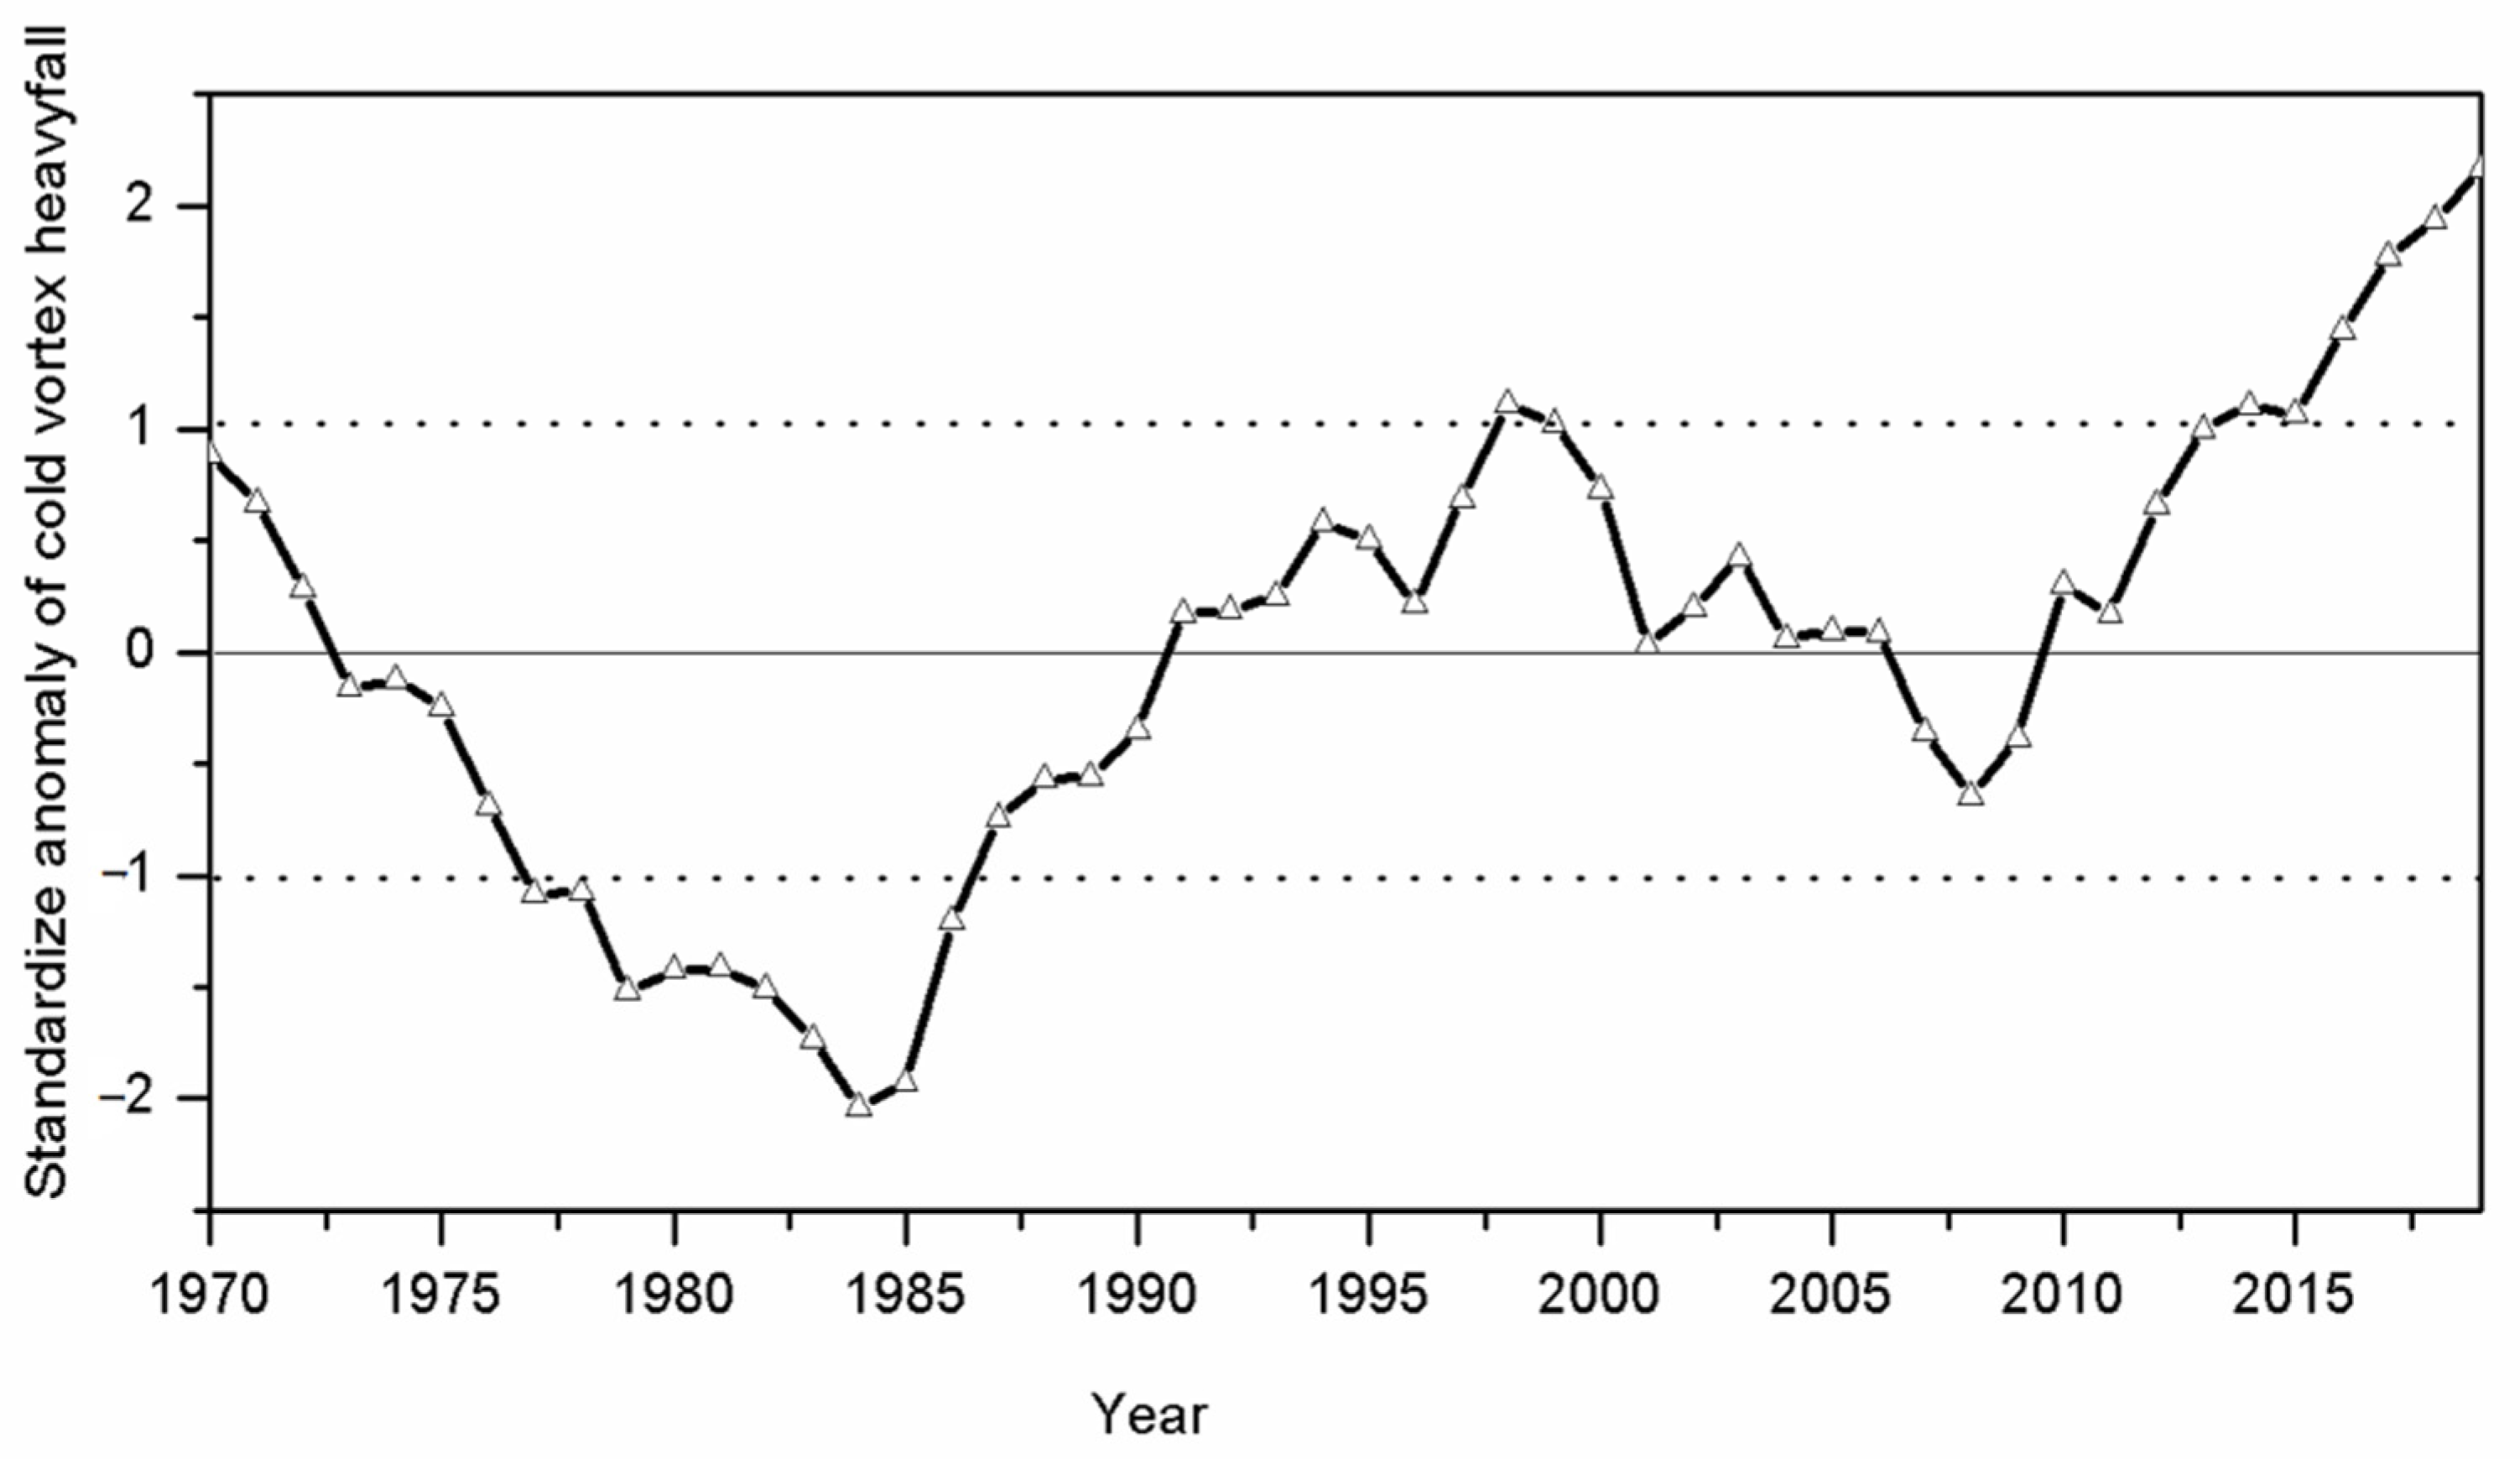
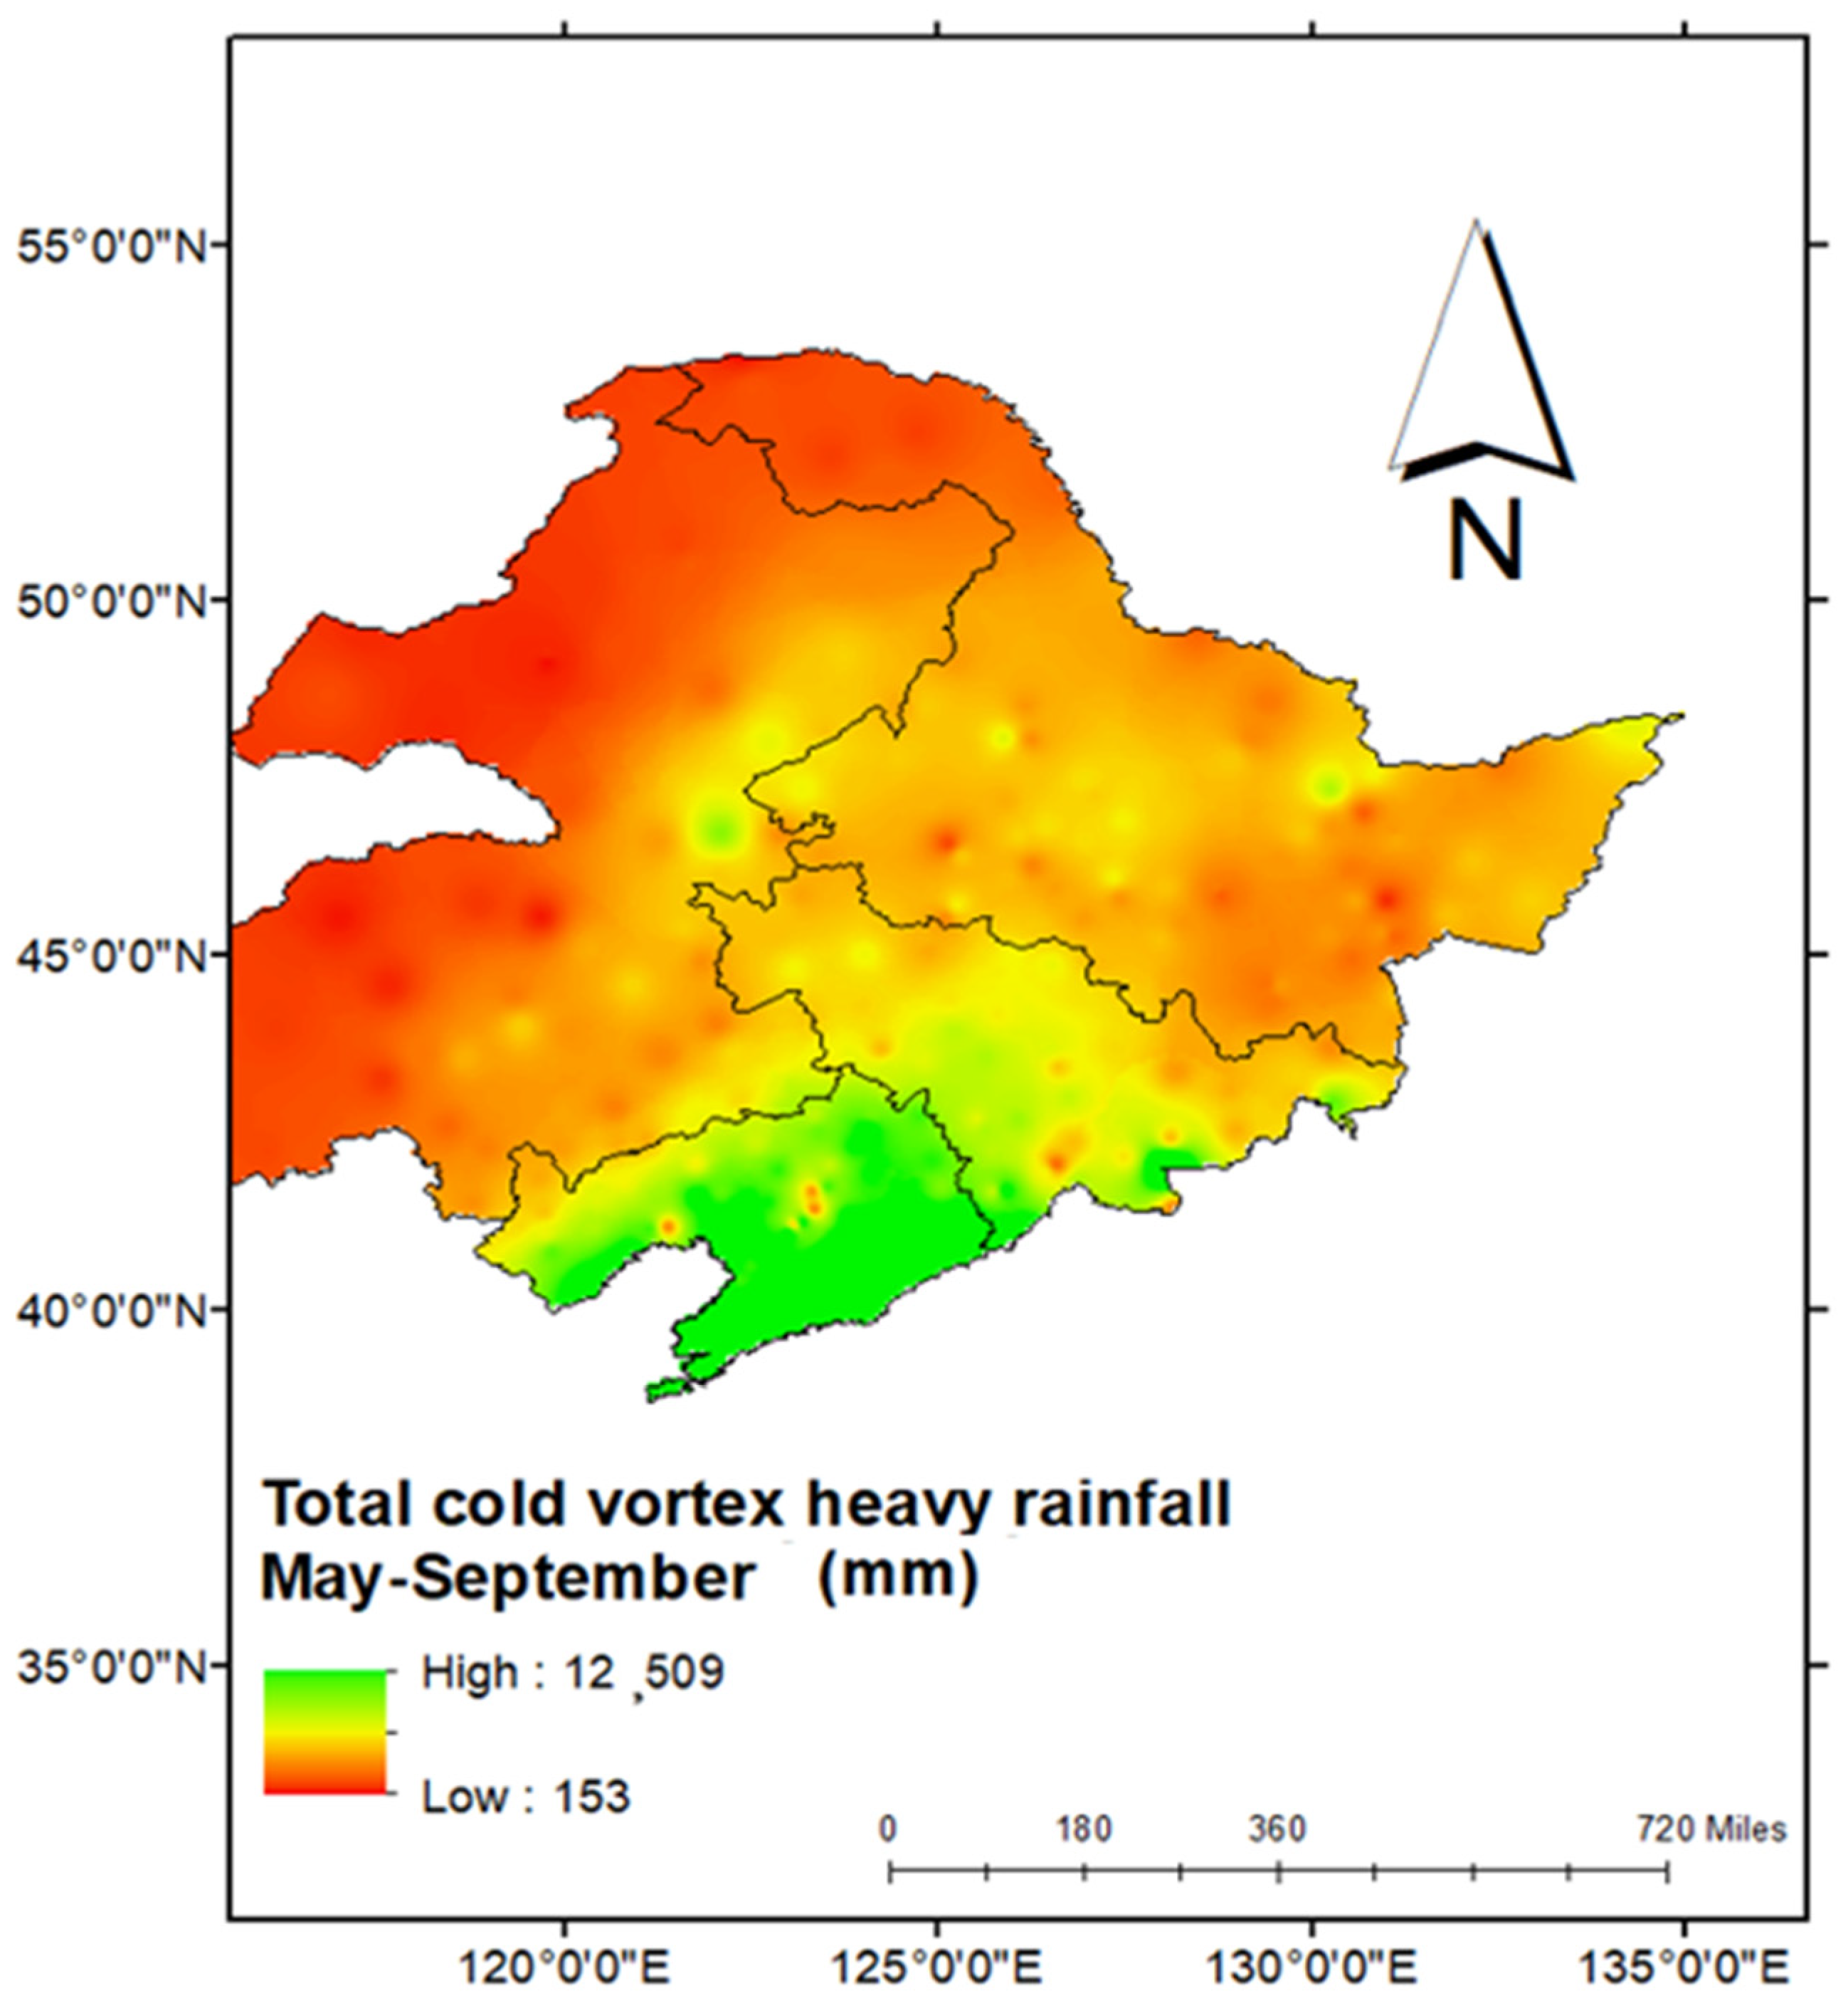
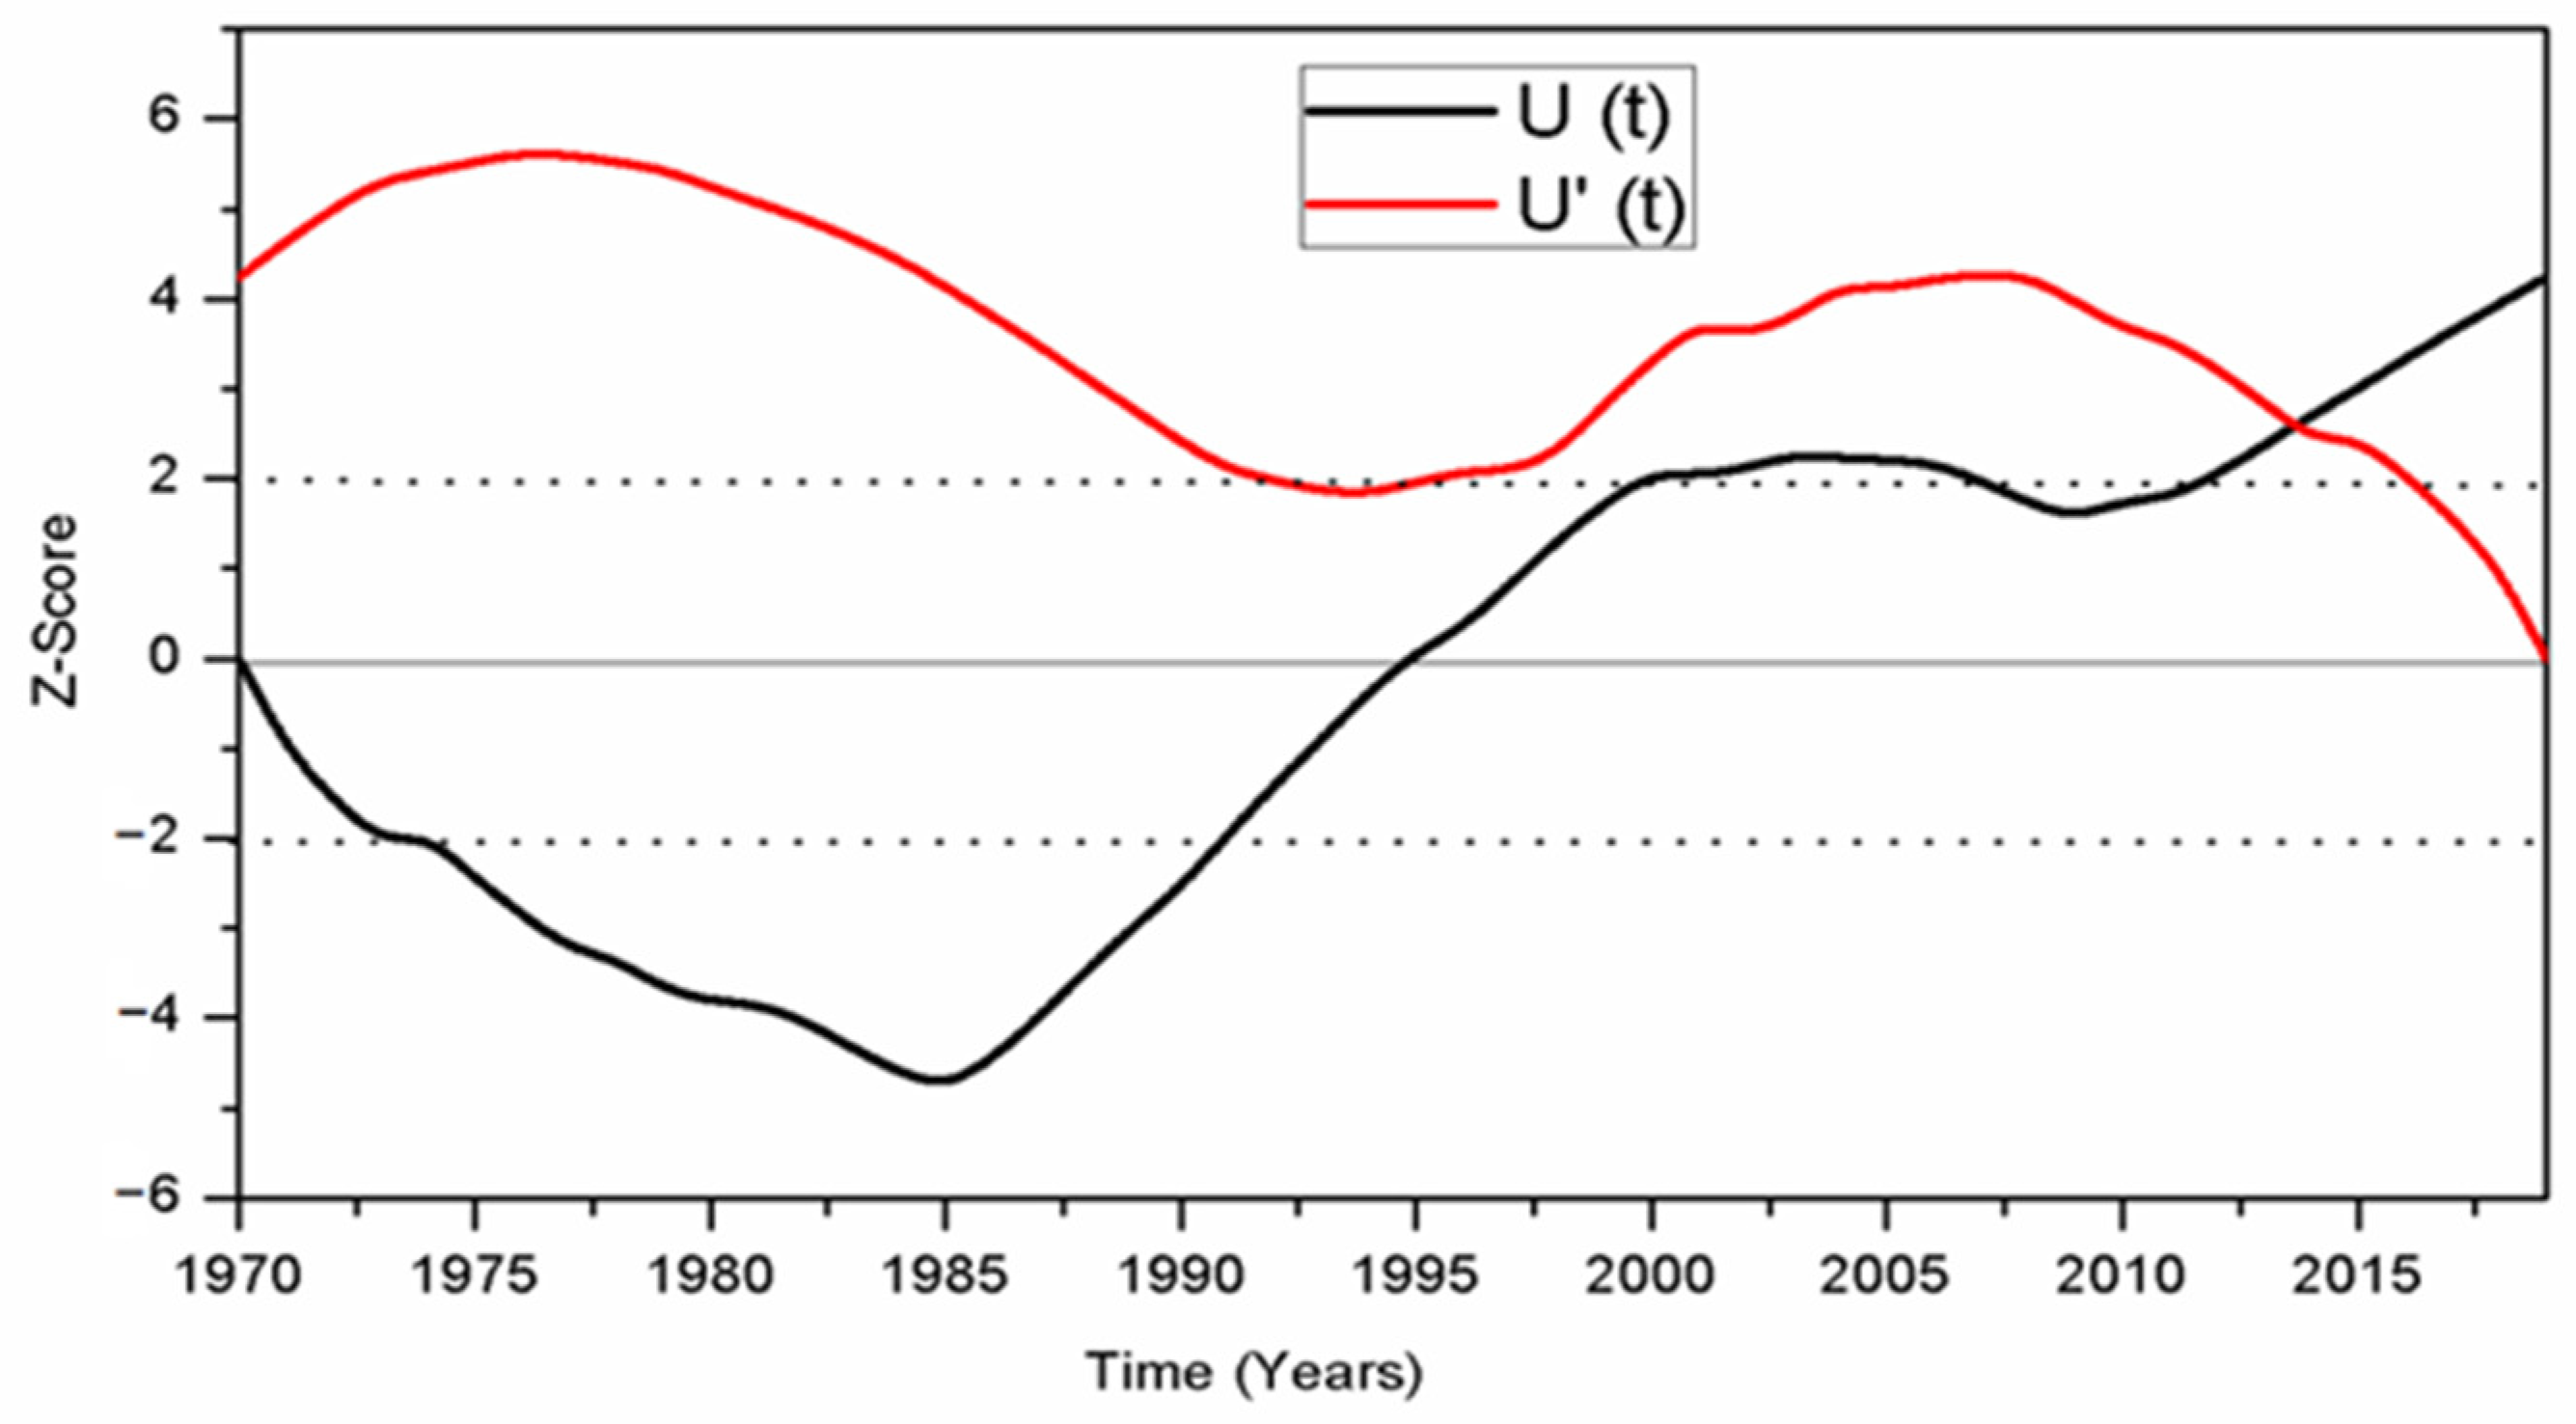
  • The total amount of cold vortex heavy rainfall in May–September ranged from 153 to 12,509 mm during 1961–2019. An abrupt interdecadal change was seen after 2014 in Northeast China.
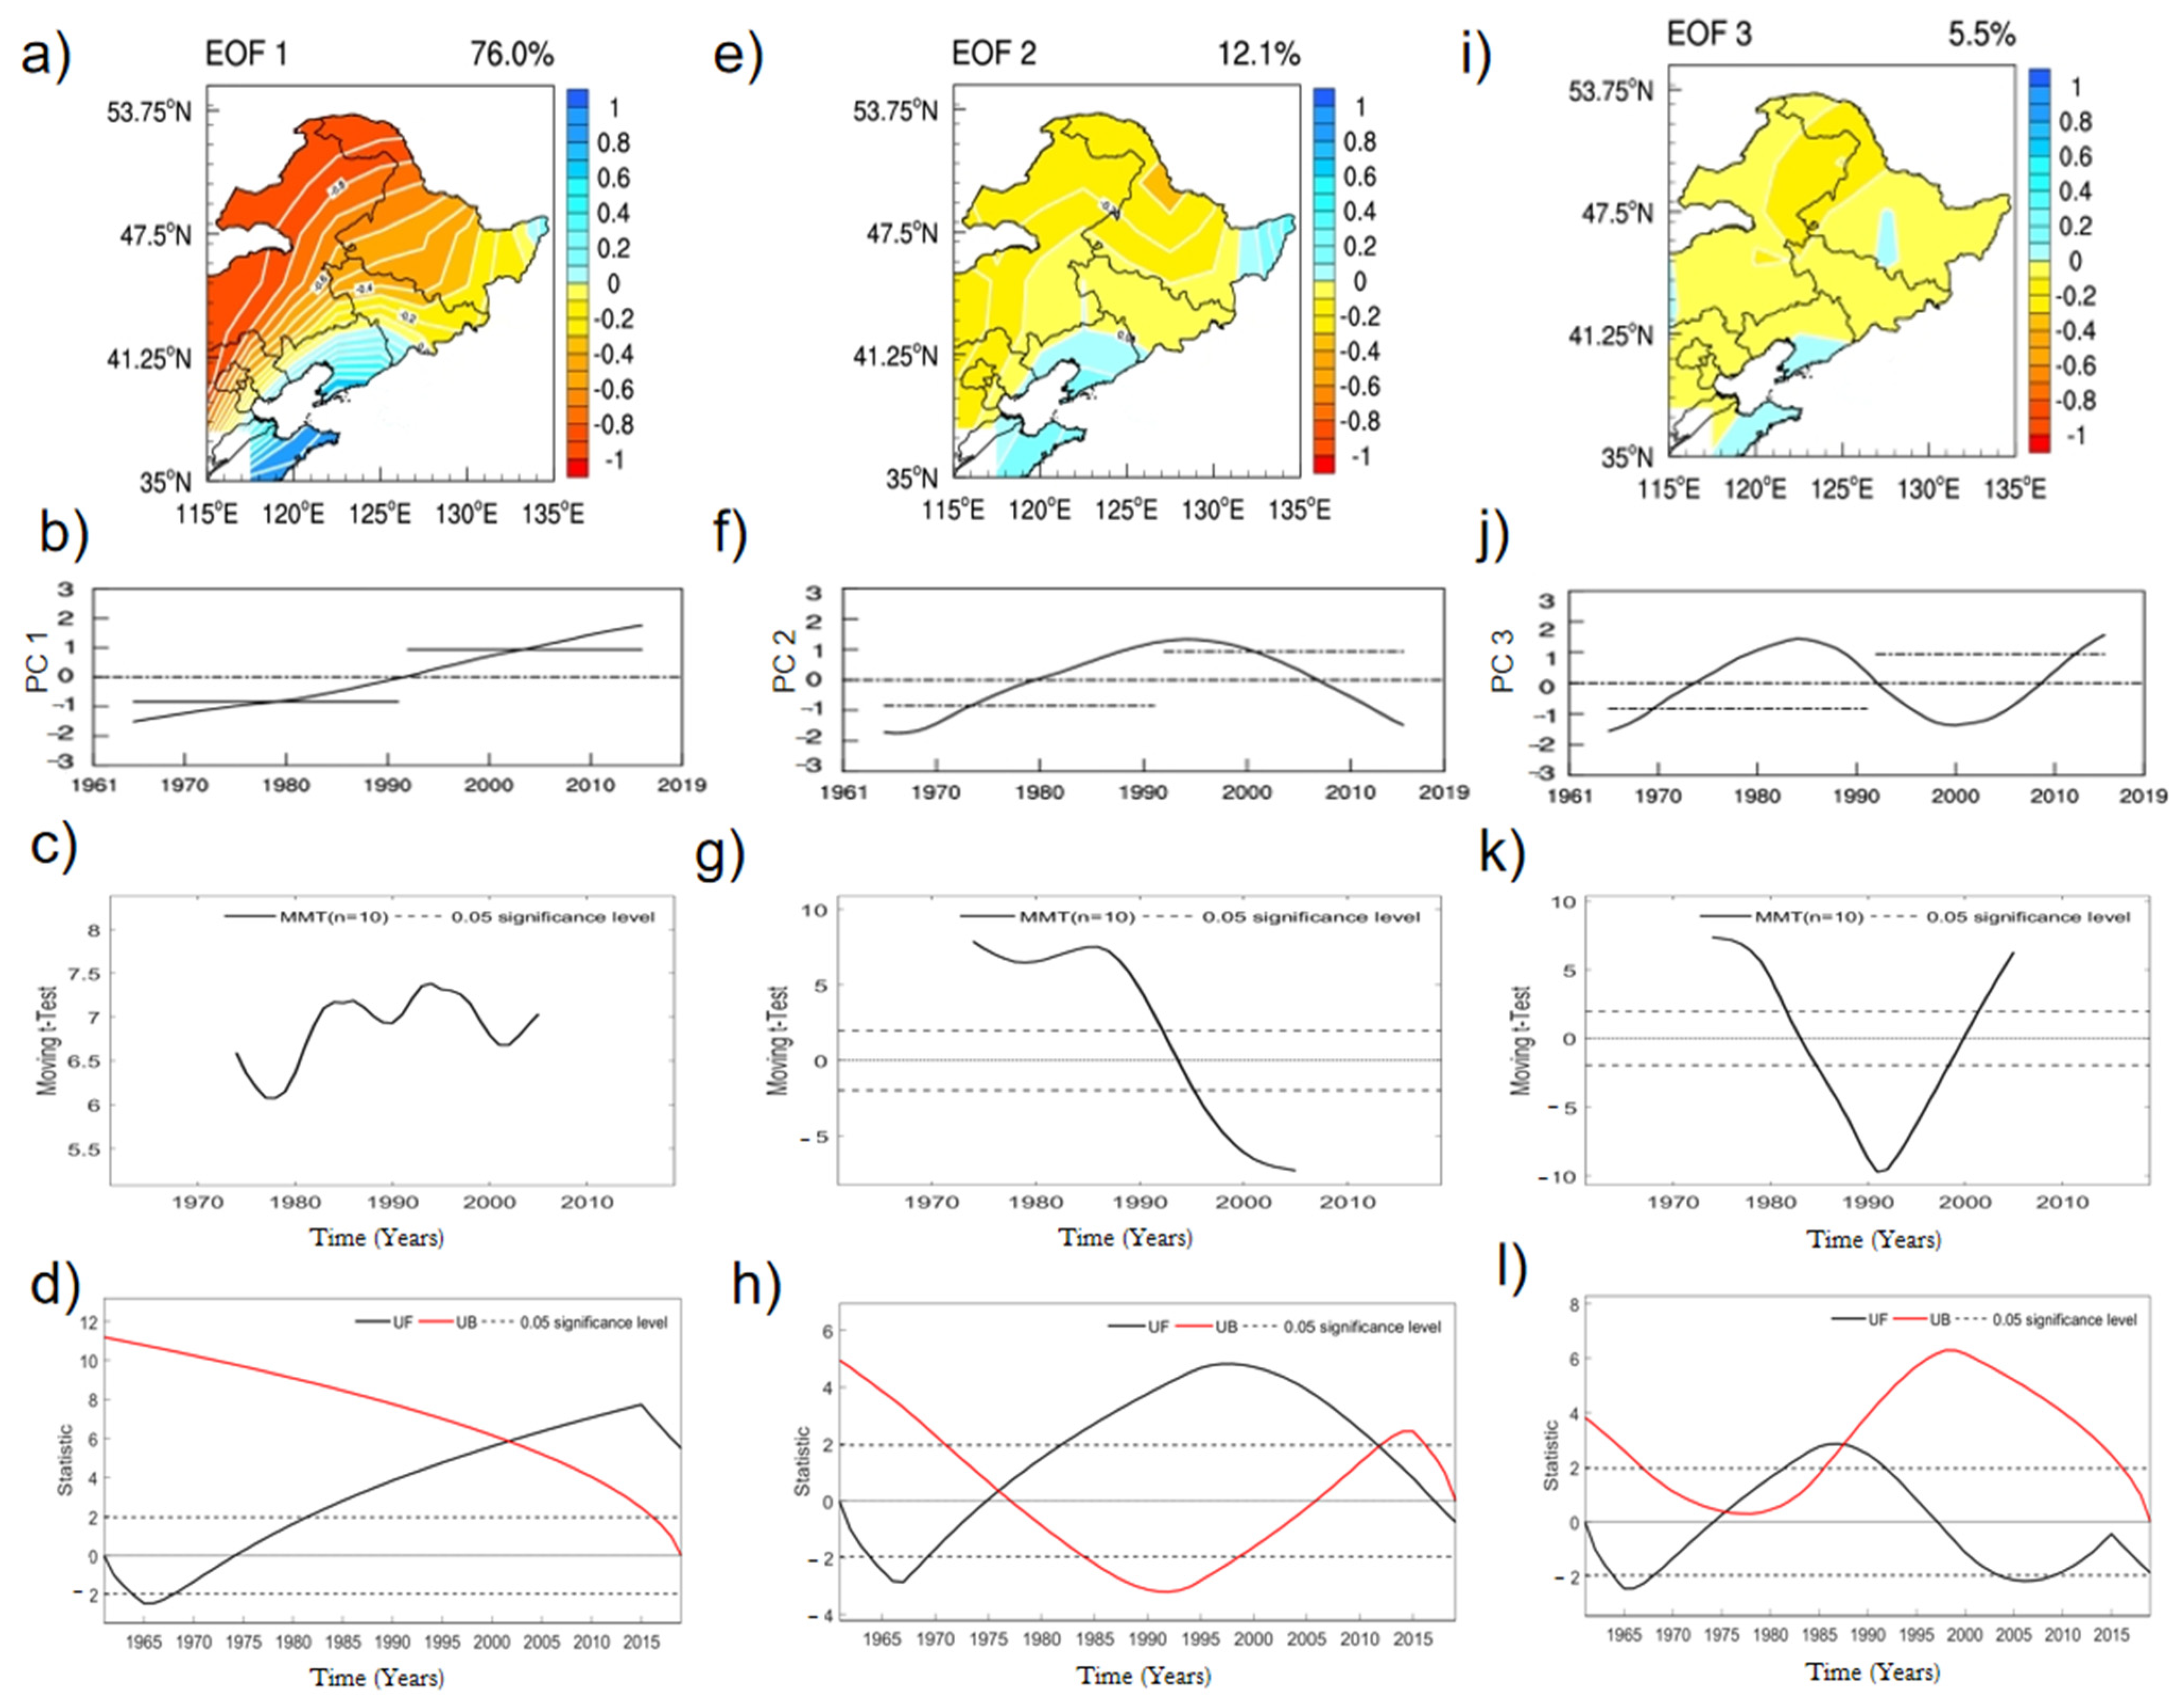
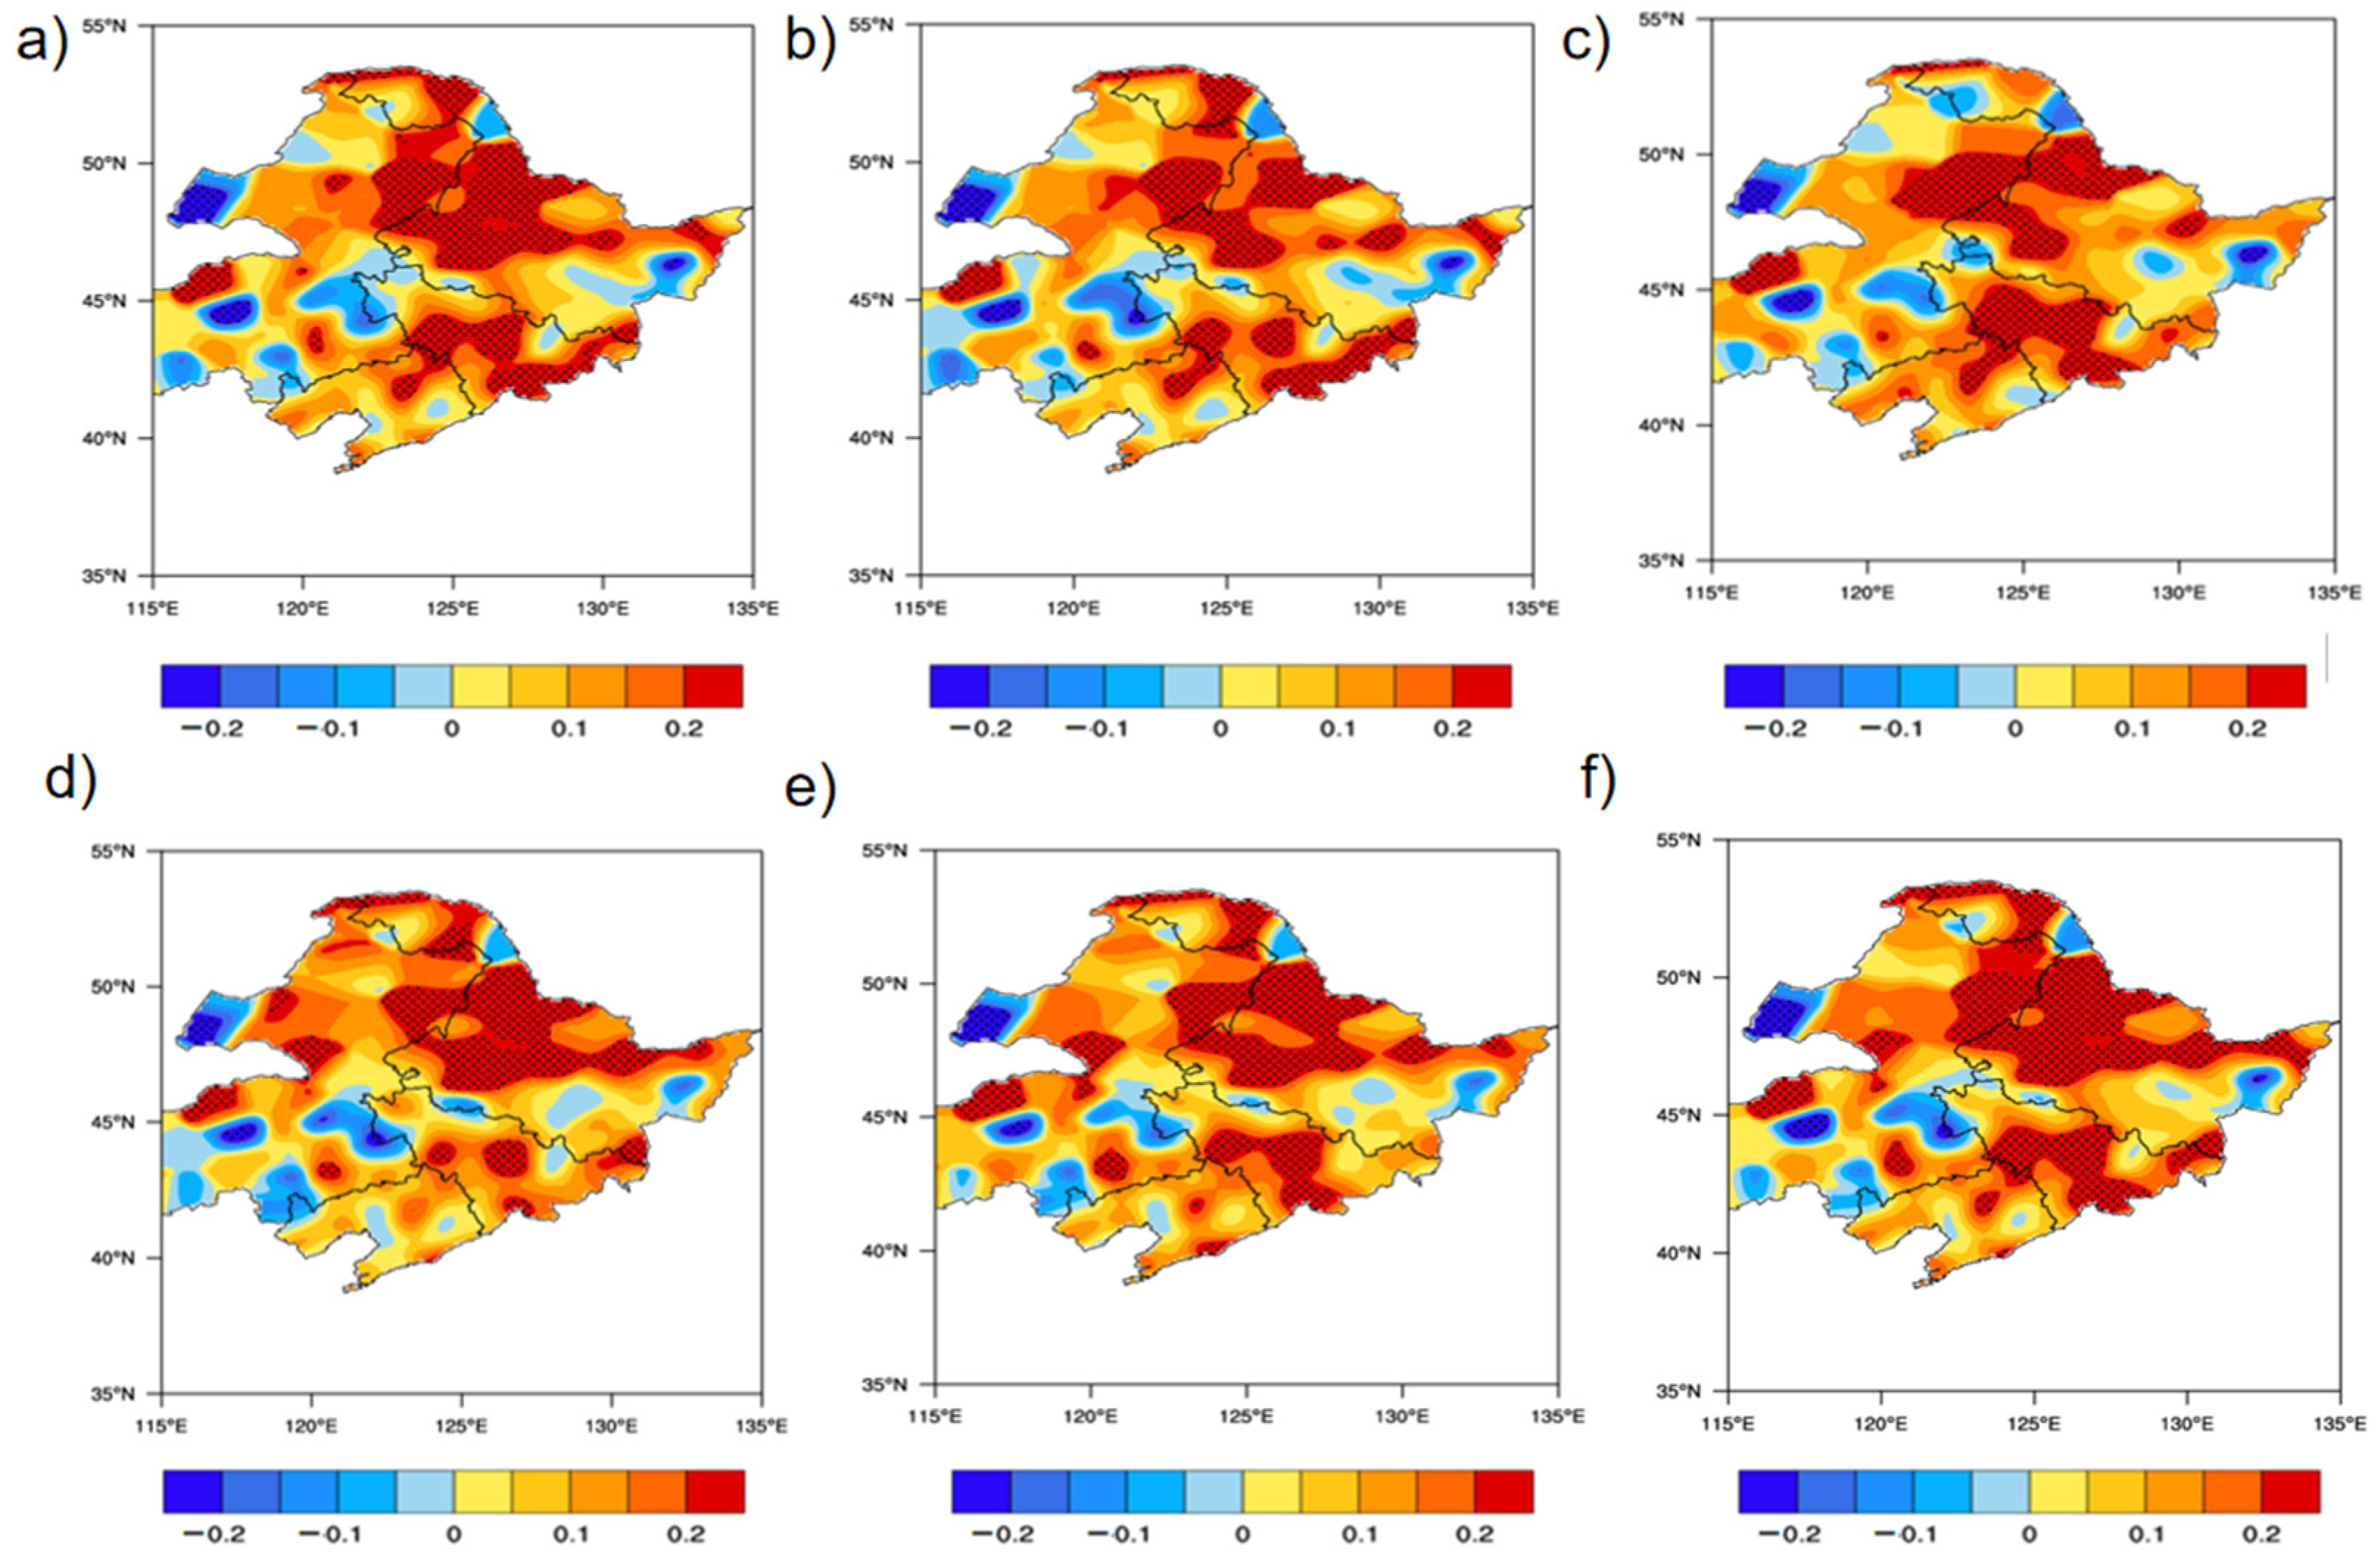
  • The EOFs examined revealed that the first, second, and third EOFs explain 76%, 12.1%, and 5.5% of the total variance, respectively. The EOF1, EOF2, and EOF3 followed the same heavy rainfall patterns, with increases in the south (southeast) and decreases in the north (northwest) over Northeast China.
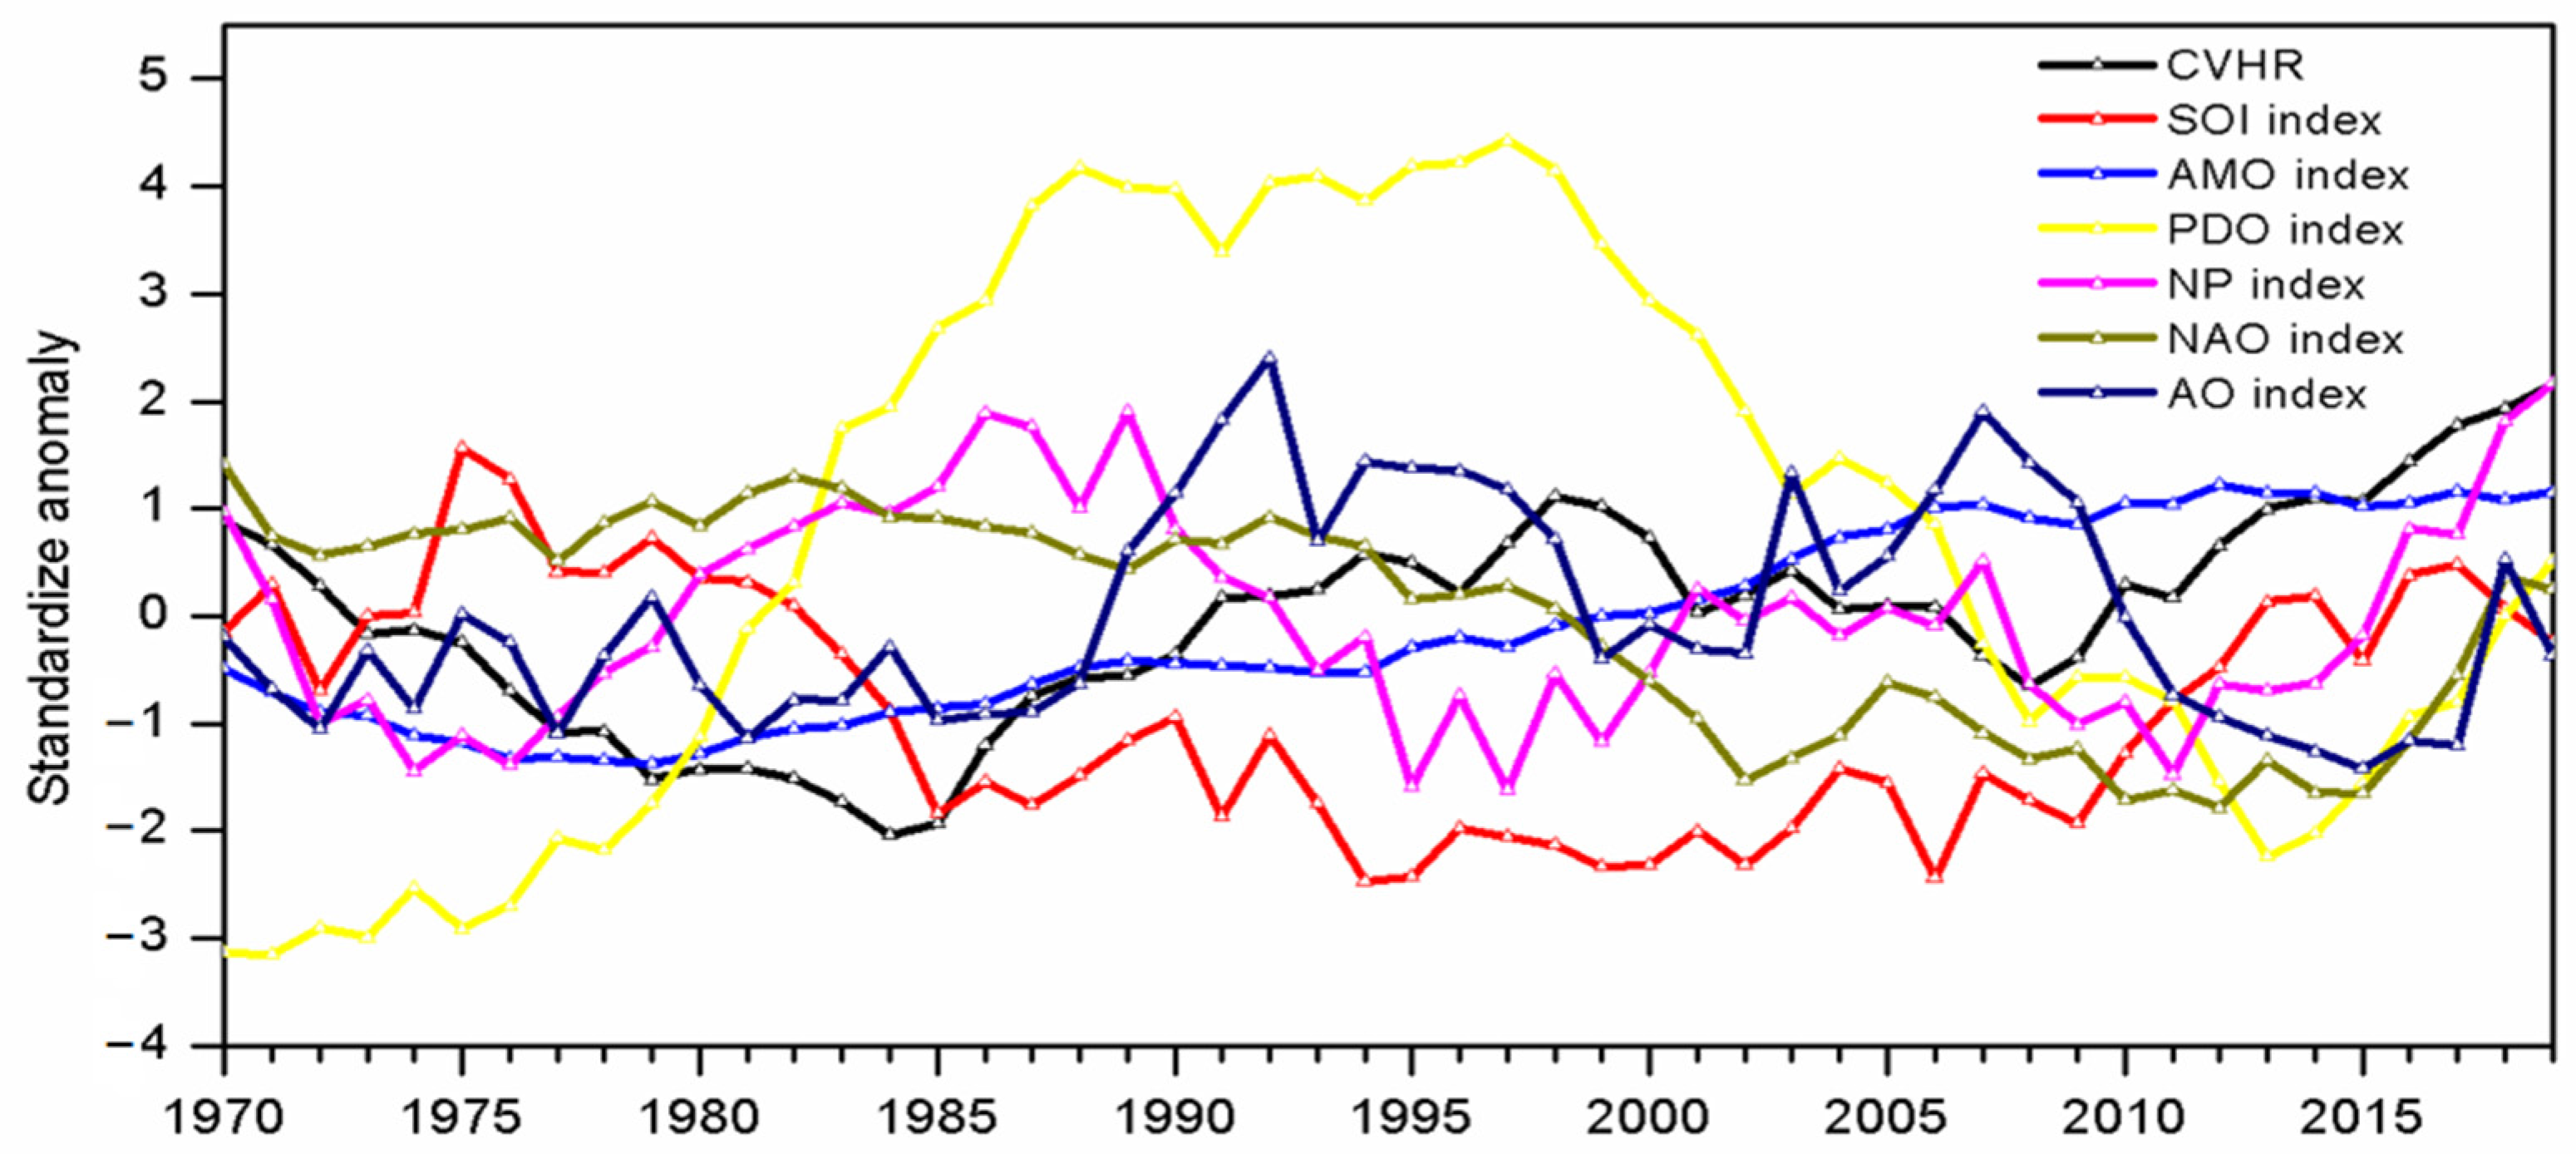
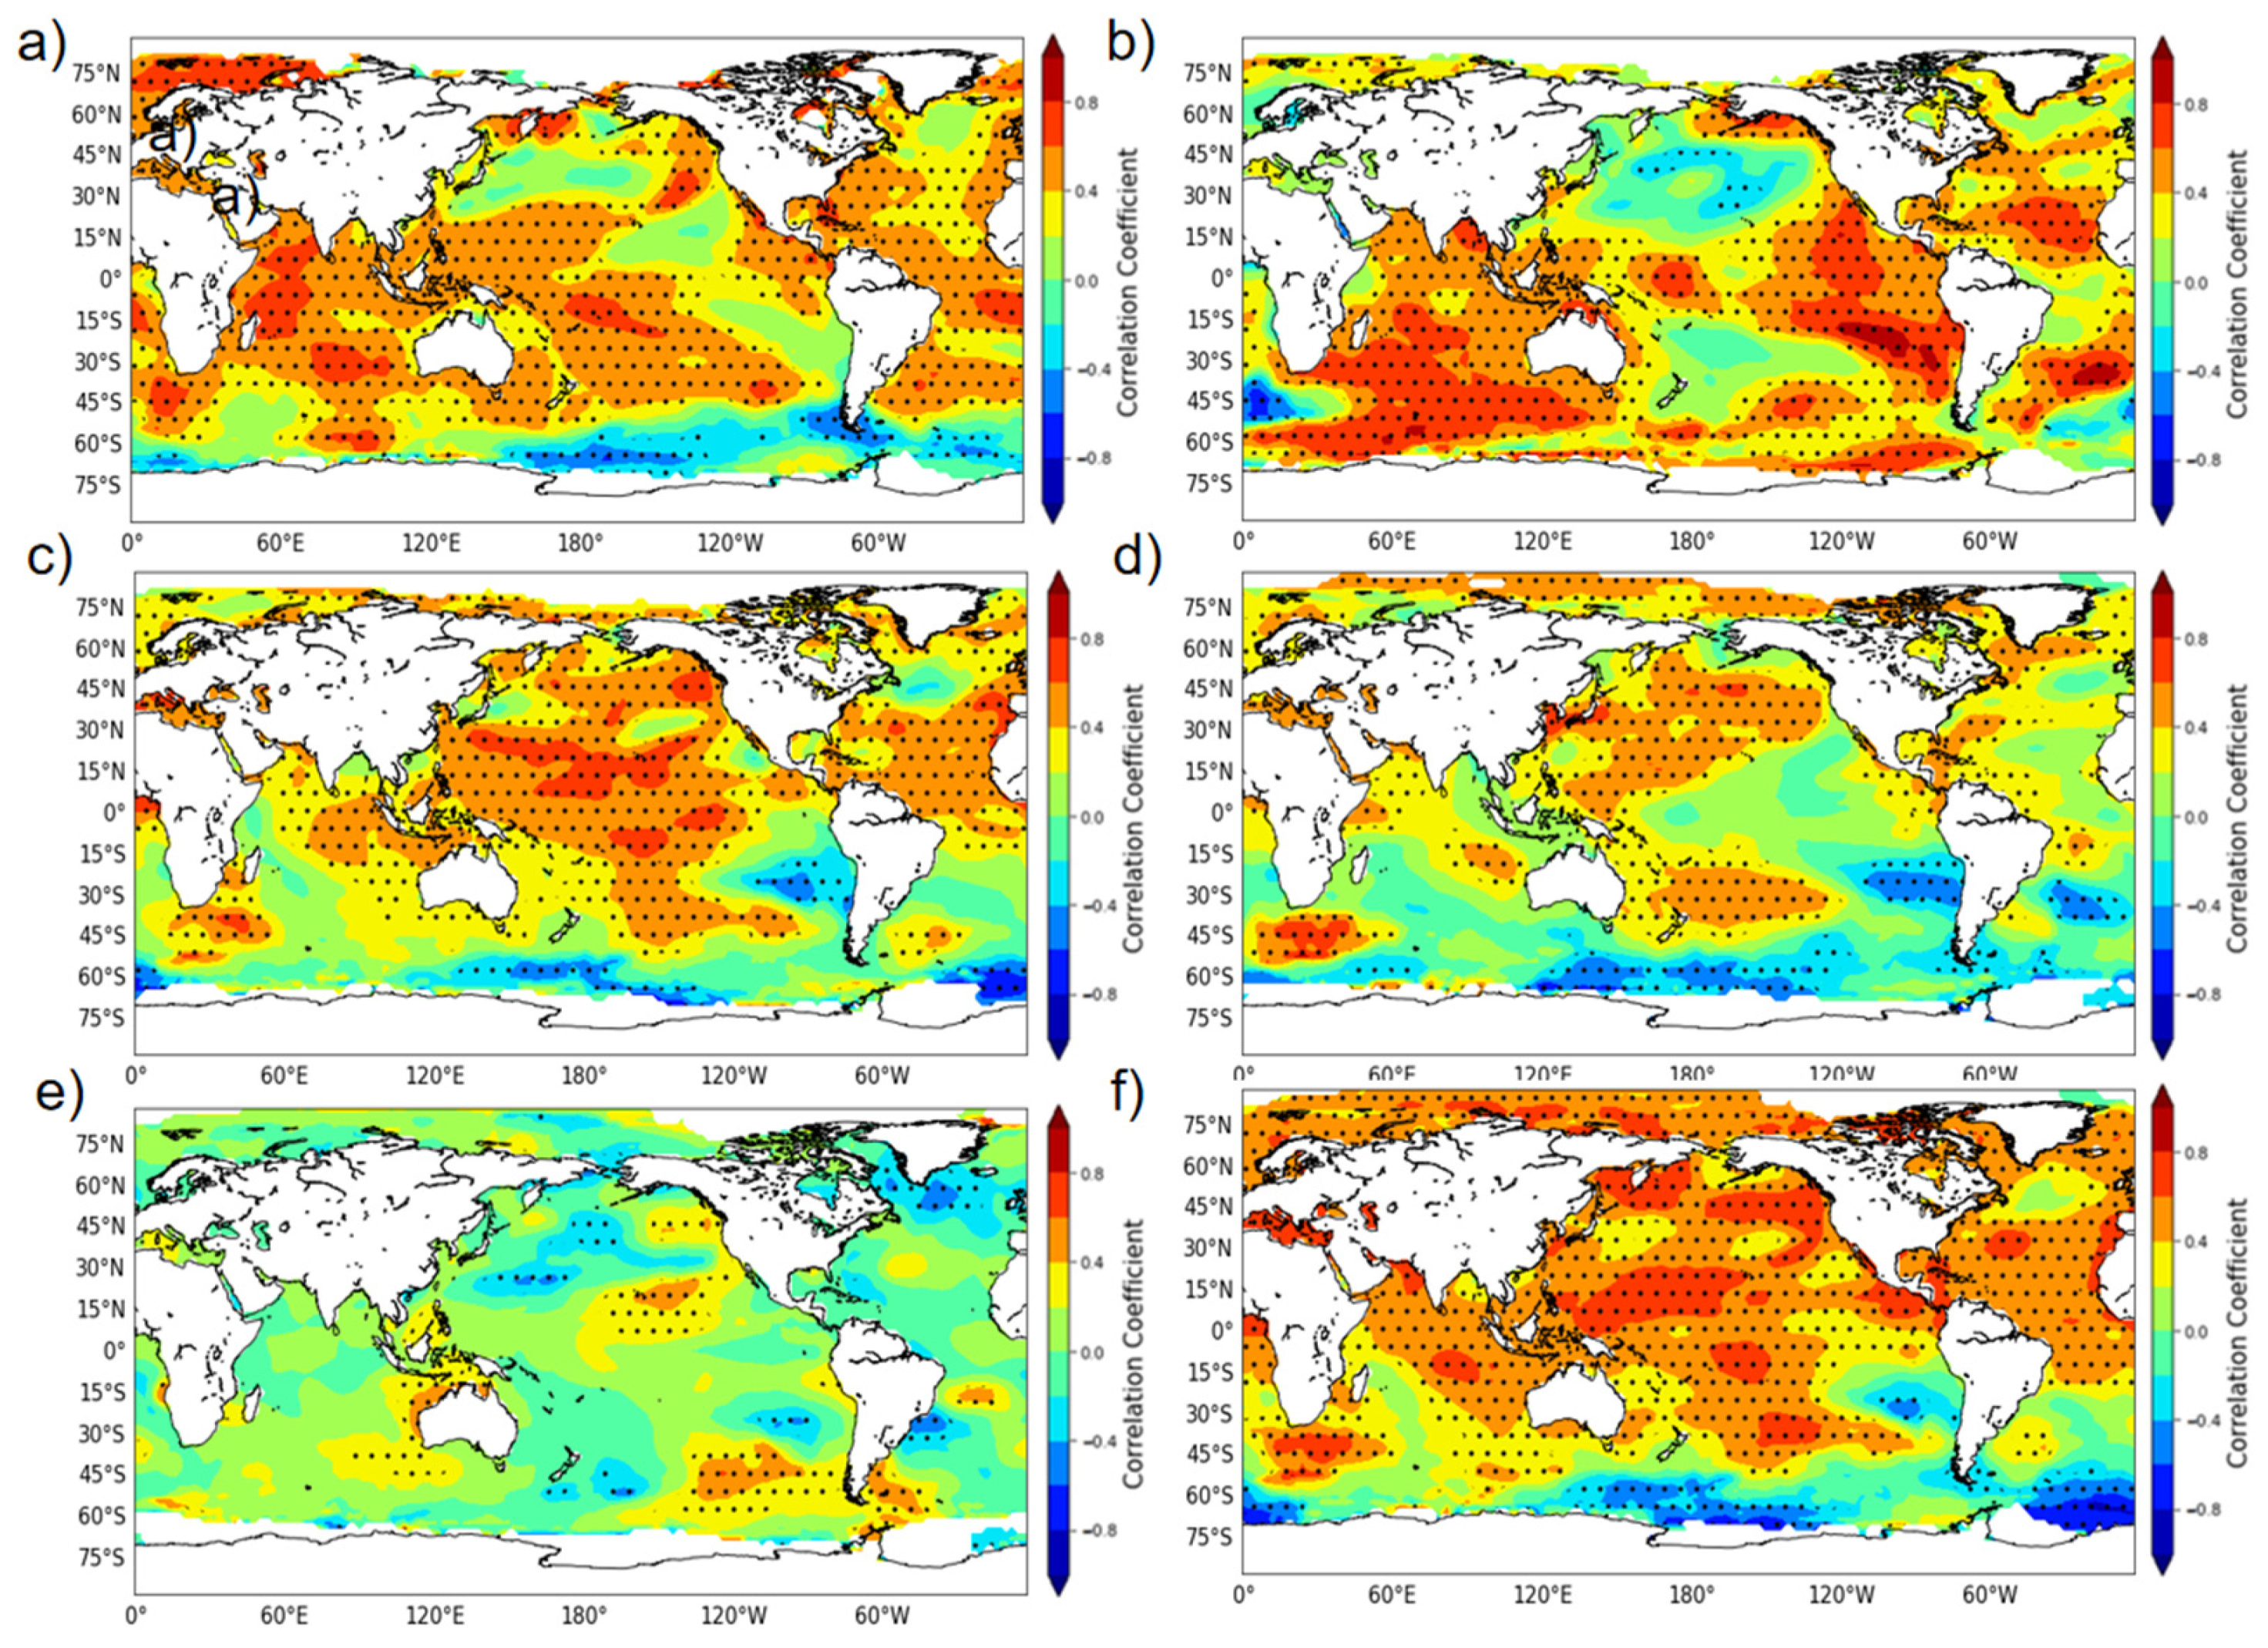
  • Heavy rainfall over Northeast China positively correlates with the Atlantic multidecadal oscillation (AMO) index.
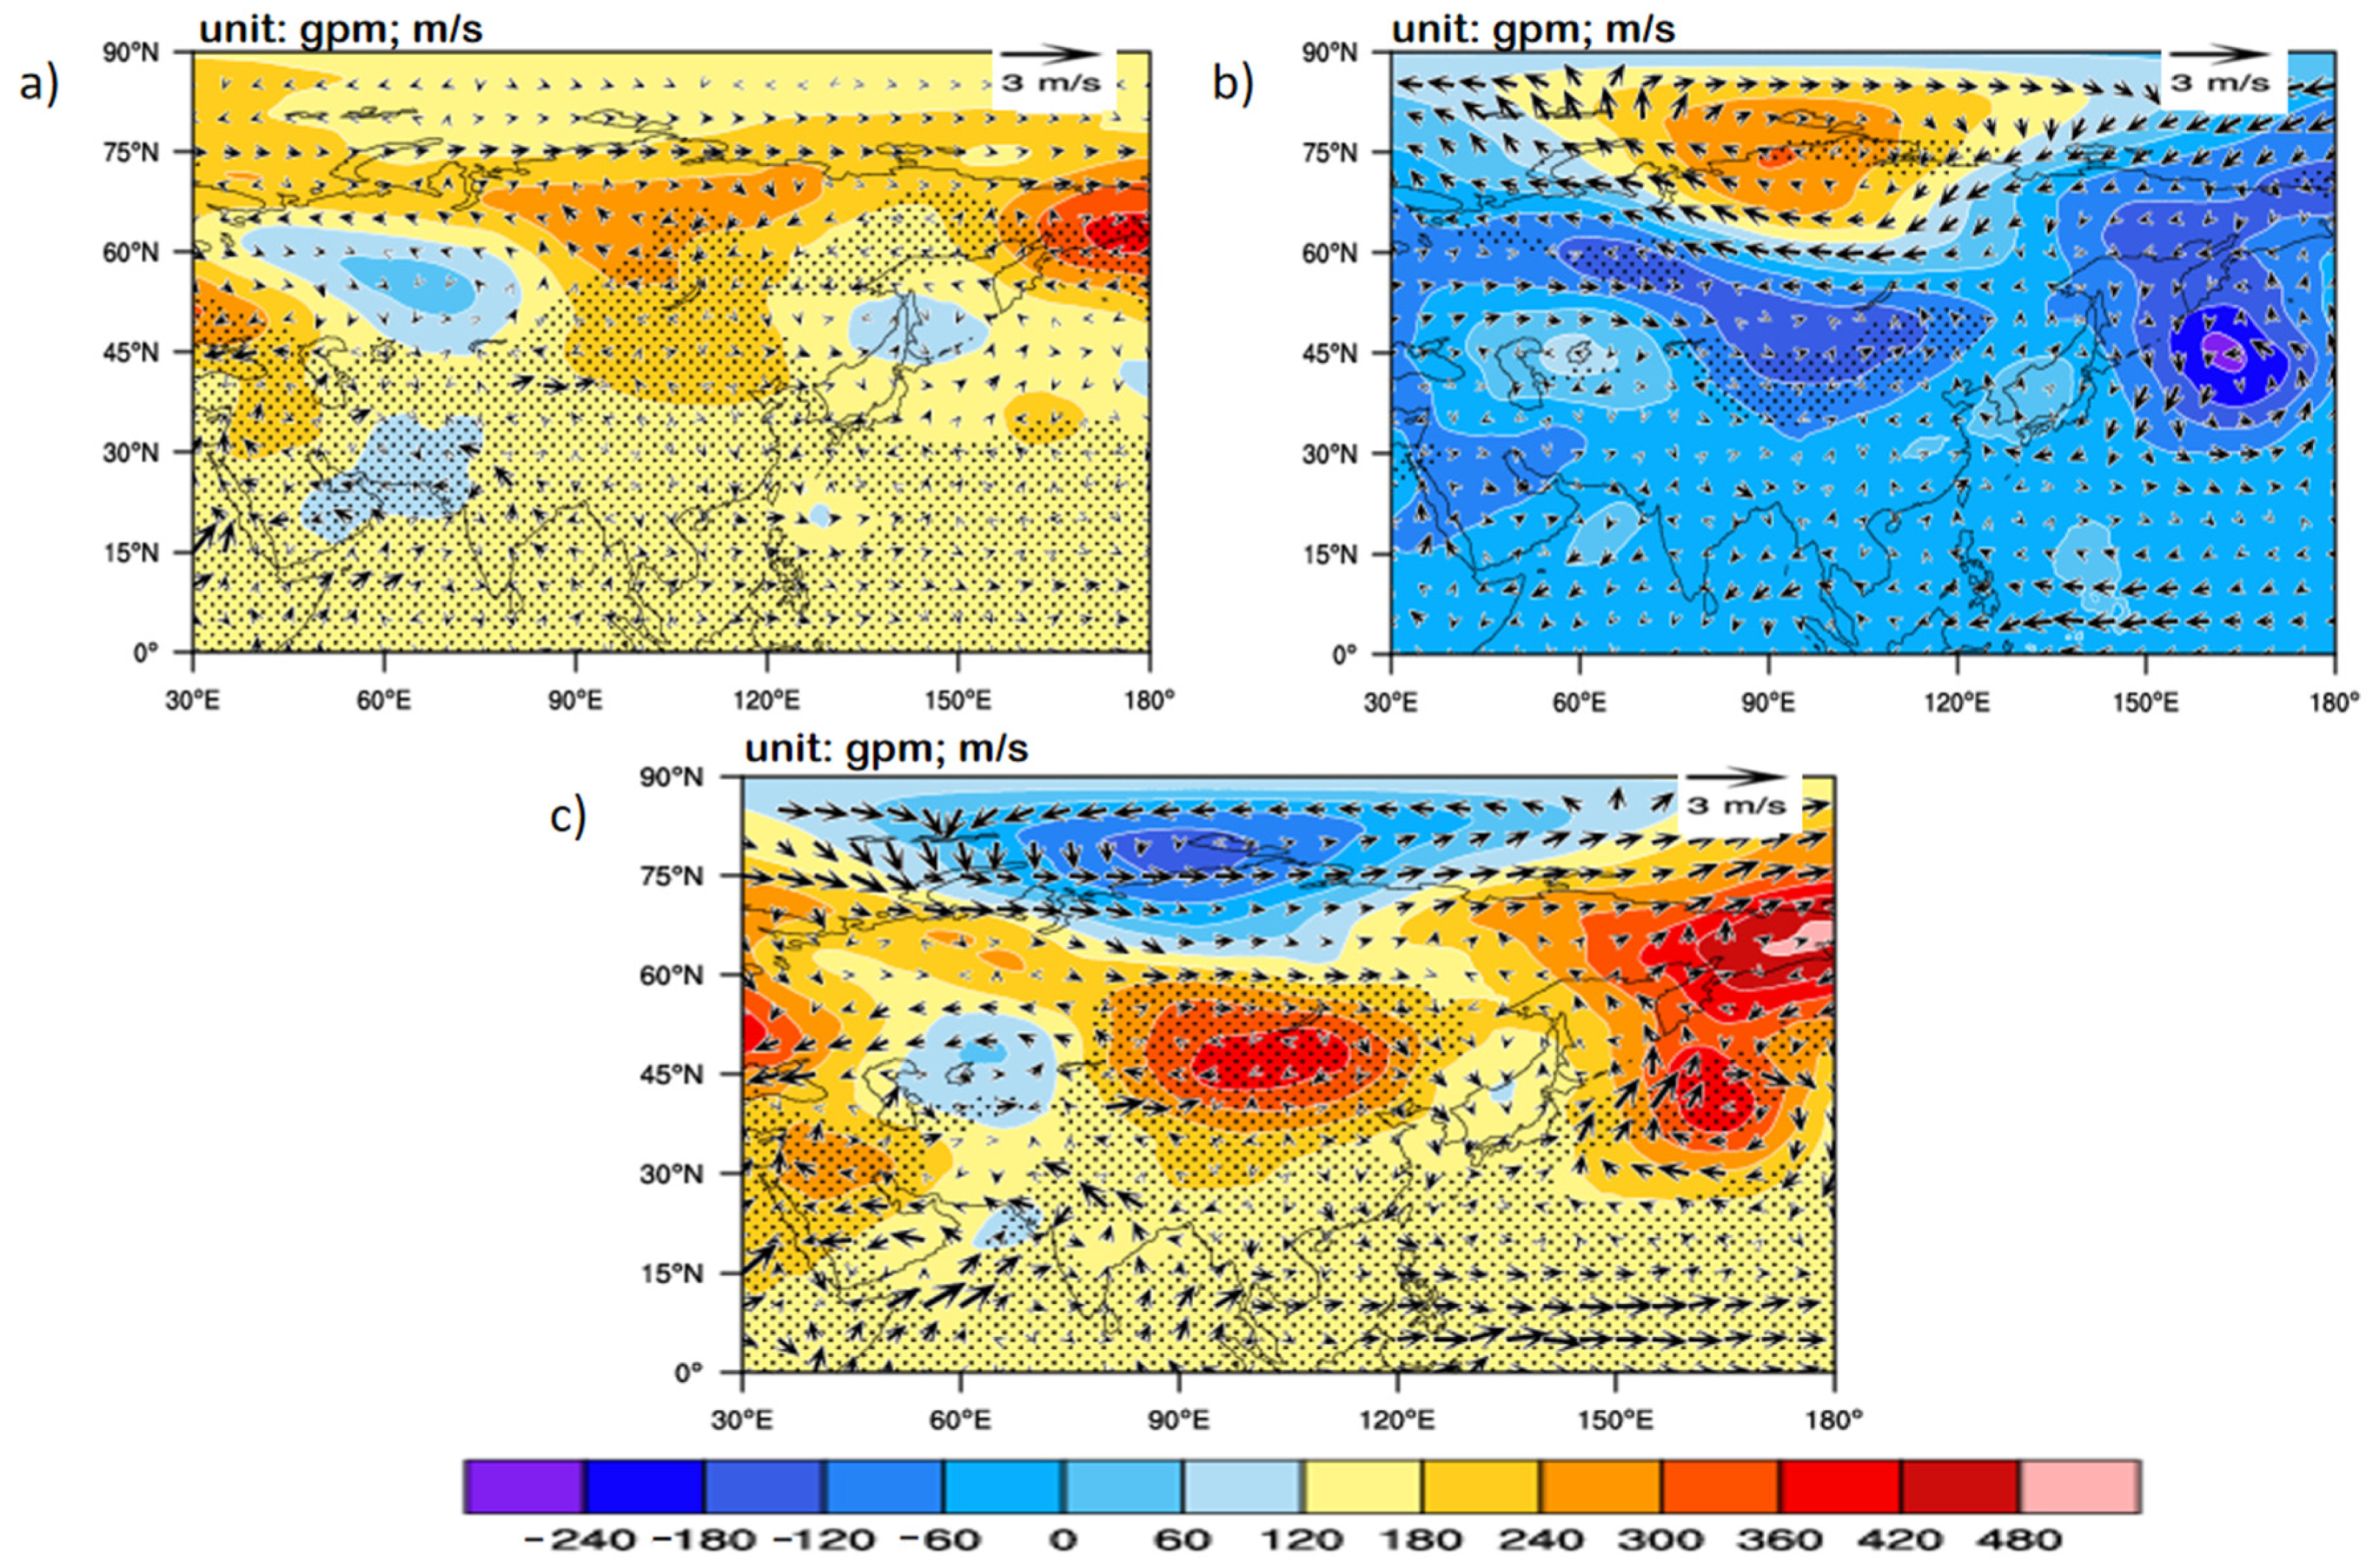
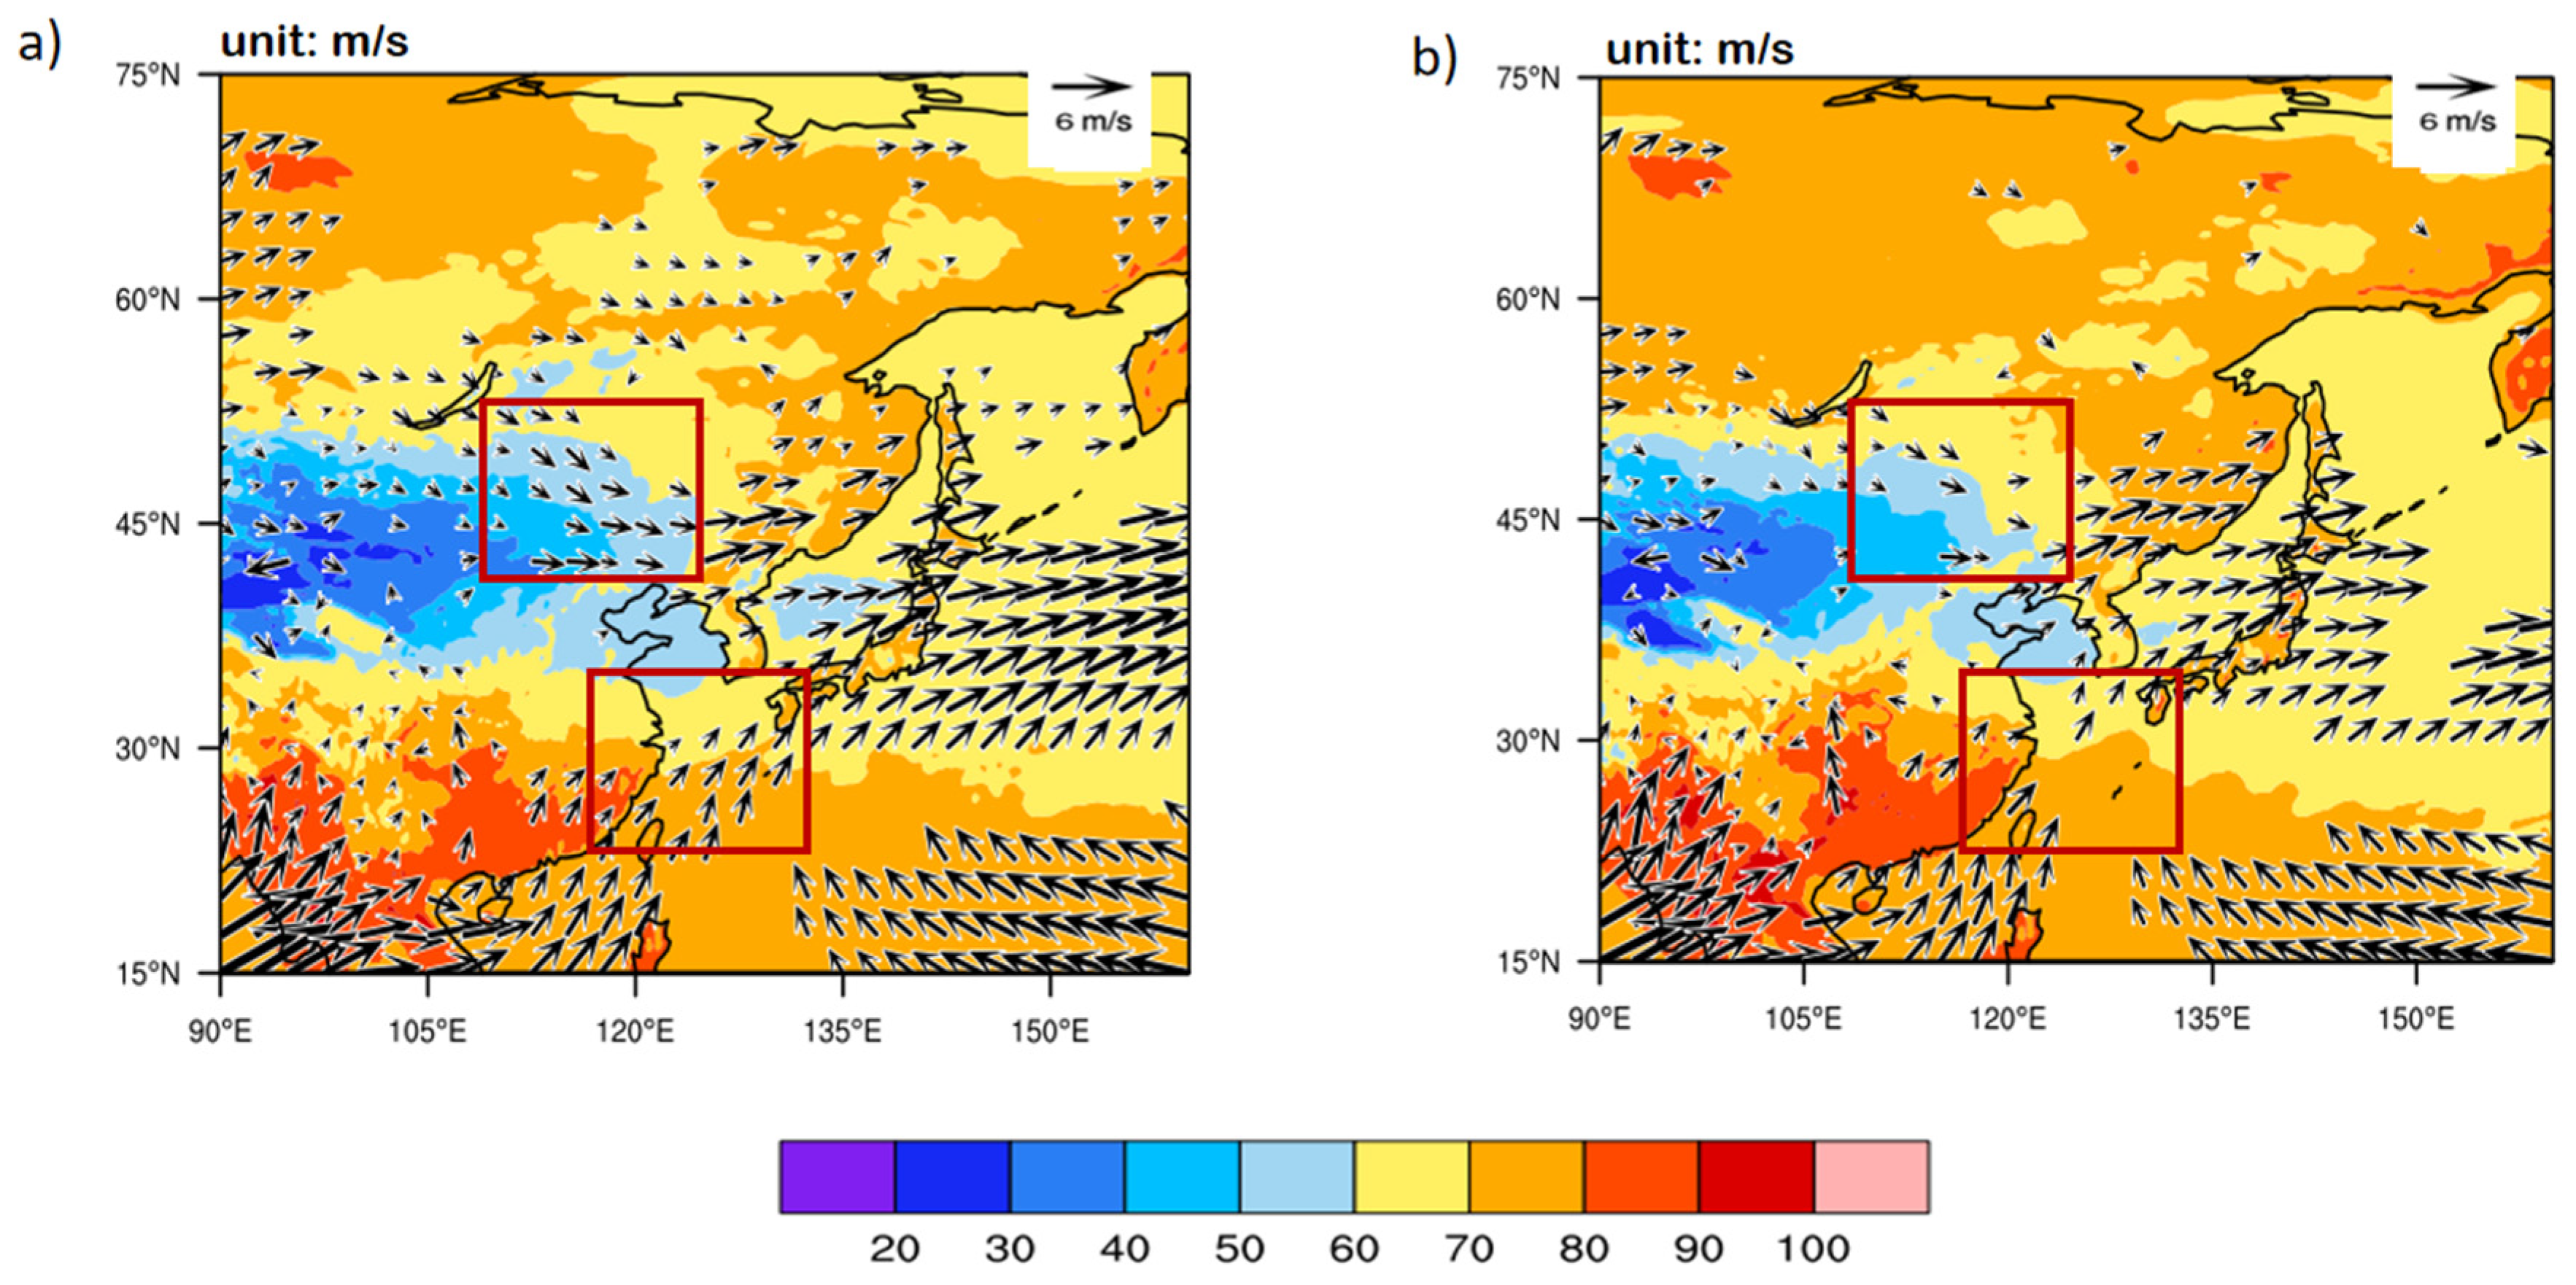
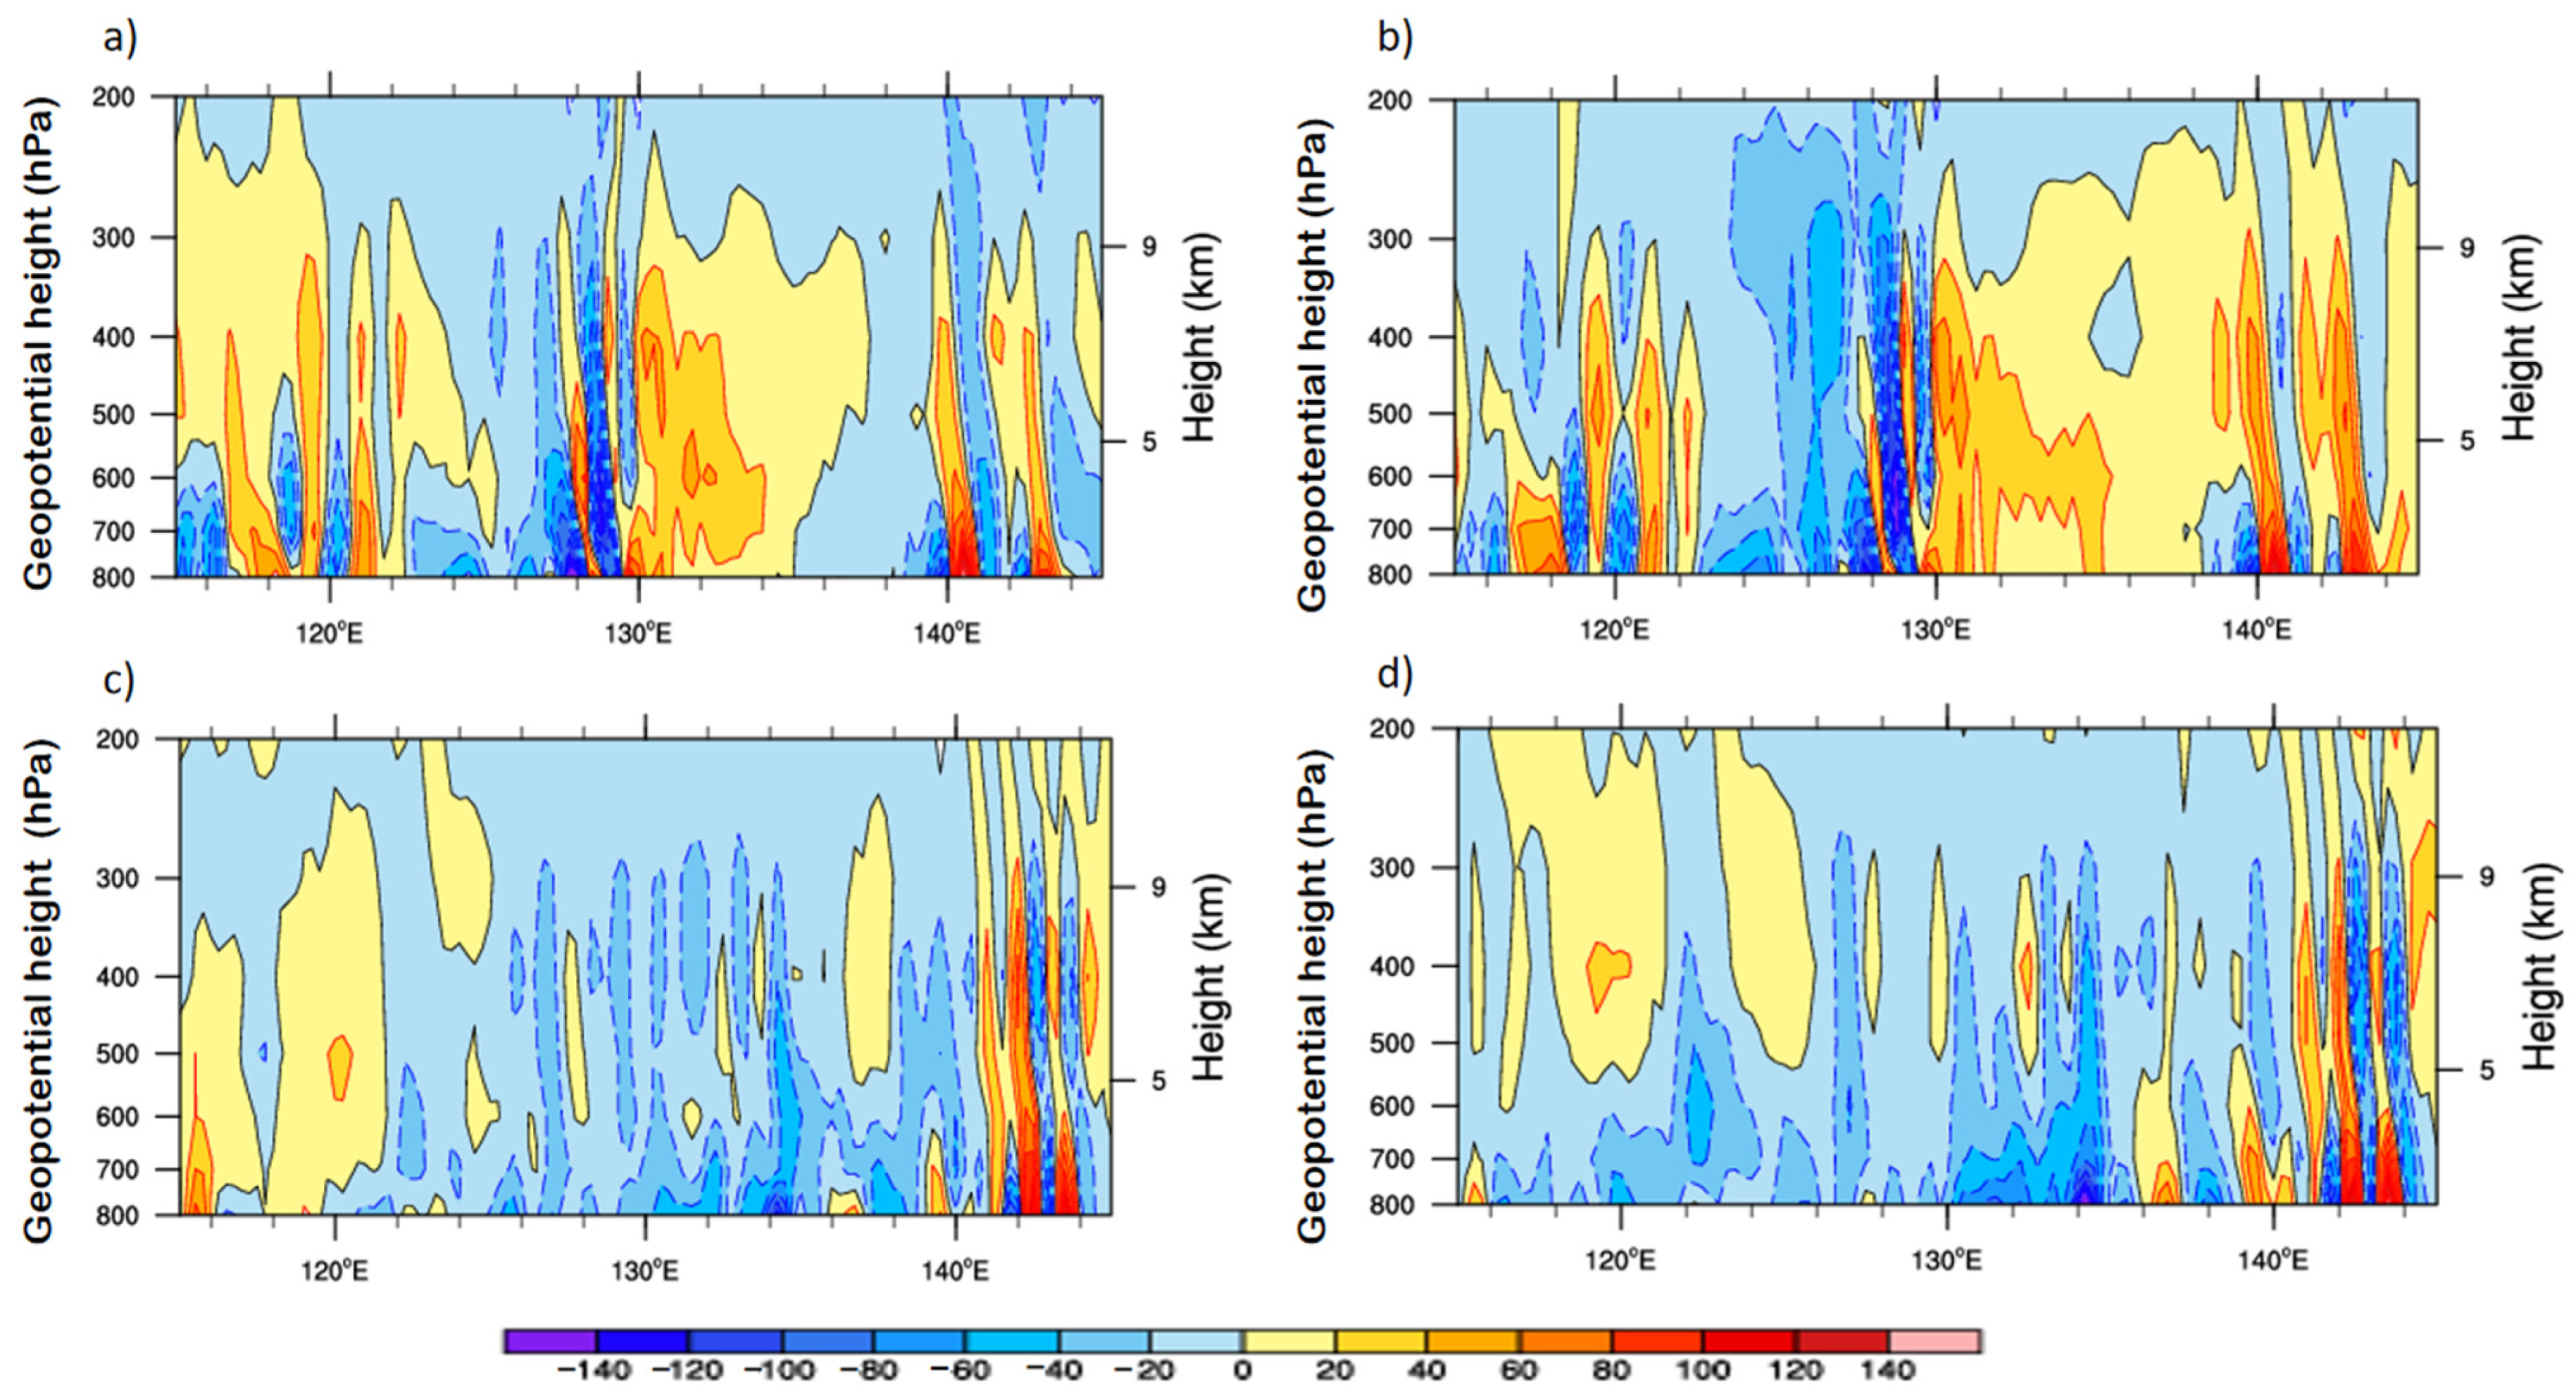
  • The relative humidity was higher, and the easterly rapids were stronger, intensifying the convergence of cyclones and leading to heavier rainfalls over Northeast China during MCVHR years. The results of MCVHR years revealed that the equipotential height was obviously located over the Sea of Japan, west of Northeast China and the Qinghai Tibet plateau. The cyclonic circulation over the East China Sea and north (northeasterly) wind prevails over Northeast China during LCVHR years.
  • The high anticyclonic circulation over the Qinghai Tibet plateau resulted in stronger cold advection over Northeast China. The anticyclonic circulations over the East China Sea and the Sea of Japan (east), and the western (southwesterly) winds prevail over Northeast China with a relatively shallow cold trough over the Qinghai Tibet plateau.
  • May–September showed generally significant positive correlations in the China Sea, the Pacific Ocean, and the Atlantic Ocean but negative correlations in the Southeast Pacific Ocean.
  • The findings in this paper provided a better understanding of the interdecadal variability in NECVHR over Northeast China. The findings can be helpful for several stakeholders regarding agricultural production, water resource management, and natural habitat conversation in Northeast China. However, thermodynamic and climate change affect extreme precipitation events and need to be better studied in the future. The linkage between SST and NECVHR is still at the stage of statistical analysis, and the feedback mechanisms, response mechanisms, and even the causality of extreme precipitation events by the NECV on an interdecadal scale need more scientific and technological support. Additionally, whether more exogenous forces, such as contemporaneous or advanced snowpack and deserts, exert an impact on the activity of the NECVHR needs to be investigated in more depth and detail. Finally, a numerical sensitivity test can better verify the physical mechanisms between NECVHR and SST and is a next step to be considered in the future.

Author Contributions

Conceptualization, X.Z., D.Z. and Z.M.M.S.; methodology, X.Z. and D.Z.; software, D.Z., Y.J. and M.P.; validation, X.Z., D.Z. and Z.M.M.S.; formal analysis and investigation, Y.J. and X.T.; resources and data curation, D.Z., Y.J. and X.T.; writing—original draft preparation, D.Z., Z.M.M.S., M.P.; writing—review and editing, X.Z.; visualization, D.Z., Y.J. and X.T.; supervision, X.Z.; project administration, X.Z.; funding acquisition, X.Z. All authors have read and agreed to the published version of the manuscript.

Funding

This research was funded by the National Key R&D Program of China (No. 2017YFC1502000) and Mesoscale Numerical Model Application Innovation Team of Changchun Meteorological Bureau (No. 202001).

Institutional Review Board Statement

Not applicable.

Informed Consent Statement

Not applicable.

Data Availability Statement

The datasets generated and/or analyzed during the current study are available from the corresponding author upon reasonable request.

Acknowledgments

We thank the four reviewers whose critical and useful comments greatly improved this work. Special thanks also go to the European Centre for Medium-Range Weather Forecasts (ECMWF) for providing the datasets used in this study.

Conflicts of Interest

The authors declare no conflict of interest.

References

  1. IPCC. Annex I: AR6 Climate Change 2021:The Physical Science Basis: The Physical Science Basis. Contribution of Working Group I to the Sixth Assessment Report of the Intergovernmental Panel on Climate Change. Available online: https://www.ipcc.ch/report/ar6/wg1/#FullReport (accessed on 3 February 2022).
  2. Shiu, C.J.; Liu, S.C.; Fu, C.; Dai, A.; Sun, Y. How much do precipitation extremes change in a warming climate? Geophys. Res. Lett. 2012, 39, 1–5. [Google Scholar] [CrossRef] [Green Version]
  3. Nieto, R.; Gimeno, L.; Laura, D.; Ribera, P.; Gallego, D.; García-Herrera, R.; García, J.; NUÑEz, M.; Redaño, A.; LORente, J. Climatological features of cutoff low systems in the Northern Hemisphere. J. Clim. 2005, 18, 3085–3103. [Google Scholar] [CrossRef] [Green Version]
  4. Qi, L.; Wang, Y.; Leslie, L.M. Numerical simulation of a cut-off low over southern Australia. Meteorol. Atmos. Phys. 2000, 74, 103–115. [Google Scholar] [CrossRef]
  5. Porcù, F.; Carrassi, A.; Medaglia, C.M.; Prodi, F.; Mugnai, A. A study on cut-off low vertical structure and precipitation in the Mediterranean region. Meteorol. Atmos. Phys 2006, 96, 121–140. [Google Scholar] [CrossRef]
  6. Pook, M.J.; Risbey, J.S.; Mcintosh, P.C. The Synoptic Climatology of Cool-Season Rainfall in the Central Wheatbelt of Western Australia. Mon.Weather Rev. 2012, 140, 28–43. [Google Scholar] [CrossRef]
  7. Pook, M.J.; Risbey, J.S.; Mcintosh, P.C. A comparative synoptic climatology of cool-season rainfall in major grain-growing regions of southern Australia. Theor. Appl. Climatol. 2014, 117, 521–533. [Google Scholar] [CrossRef]
  8. Molekwa, S.; Engelbrecht, C.J.; Rautenbach, C. Attributes of cut-off low induced rainfall over the Eastern Cape Province of South Africa. Theor. Appl. Climatol. 2014, 118, 307–318. [Google Scholar] [CrossRef] [Green Version]
  9. Lian, Y.; Shen, B.; Li, S.; Liu, G.; Yang, X. Mechanisms for the Formation of Northeast China Cold Vortex and Its Activities and Impacts: An Overview. J. Meteorol. Res. 2016, 6, 51–66. [Google Scholar] [CrossRef]
  10. Hu, K.X.; Lu, R.Y.; Wang, D.H. Cold Vortex over Northeast China and Its Climate Effect. J. Atmos. Sci. 2011, 35, 179–191. [Google Scholar] [CrossRef]
  11. Sein, Z.M.; Zhi, X.; Ullah, I.; Azam, K.; Ngoma, H.; Saleem, F.; Xing, Y.; Iyakaremye, V.; Syed, S.; Hina, S.; et al. Recent variability of sub-seasonal monsoon precipitation and its potential drivers in Myanmar using in-situ observation during 1981–2020. Int. J. Clim. 2021, 7419, 1–19. [Google Scholar] [CrossRef]
  12. Yang, X.Y.; Qin, Y.L.; Zhang, M.Y.; Zhang, T. Forecast of heavy rain caused by the northeast cold vortex using “ingredients method”. Trans. Atmos. Sci. 2018, 41, 475–482. [Google Scholar] [CrossRef]
  13. Hu, K.; Lu, R.; Wang, D. Seasonal climatology of cut-off lows and associated precipitation patterns over Northeast China. Meteorol. Atmos. Phys. 2009, 106, 37–48. [Google Scholar] [CrossRef]
  14. Liu, Y.; Liang, Z.; Li, Y. Observational and Simulative Study of a Local Severe Precipitation Event Caused by a Cold Vortex over Northeast China. Adv. Meteorol. 2017, 2017, 1–18. [Google Scholar] [CrossRef] [Green Version]
  15. Lee, T.-Y.; Shin, U.; Park, S.-H. Atmospheric Structure for Convective Development in the Events of Cloud Clusters over the Korean Peninsula. Asia-Pac. J. Atmos. Sci. 2020, 57, 511–531. [Google Scholar] [CrossRef]
  16. Barnes, M.A.; Turner, K.; Ndarana, T.; Landman, W.A. Cape storm: A dynamical study of a cut-off low and its impact on South Africa. Atmos. Res. 2021, 249, 1–18. [Google Scholar] [CrossRef]
  17. Barnes, M.A.; Ndarana, T.; Landman, W.A. Cut-off lows in the Southern Hemisphere and their extension to the surface. Clim. Dyn. 2021, 56, 3709–3732. [Google Scholar] [CrossRef]
  18. Zhao, S.; Sun, J. Study on cut-off low-pressure systems with floods over Northeast Asia. Meteorol. Atmos. Phys. 2007, 96, 159–180. [Google Scholar] [CrossRef]
  19. Wu, X.; Meng, F.; Liu, P.; Zhou, J.; Liu, D.; Xie, K.; Zhu, Q.; Hu, J.; Sun, H.; Xing, F. Contribution of the Northeast Cold Vortex Index and Multiscale Synergistic Indices to Extreme Precipitation Over Northeast China. Earth Space Sci. 2021, 8, 1–17. [Google Scholar] [CrossRef]
  20. Chen, D.; Gao, Y.; Sun, J.; Wang, H.; Ma, J. Interdecadal Variation and Causes of Drought in Northeast China in Recent Decades. J. Geophys. Res. Atmos. 2020, 125, 1–15. [Google Scholar] [CrossRef]
  21. Abba Omar, S.; Abiodun, B.J. Characteristics of cut-off lows during the 2015–2017 drought in the Western Cape, South Africa. Atmos. Res. 2020, 235, 104722. [Google Scholar] [CrossRef]
  22. Zhao, P.; Xiao, H.; Liu, J.; Zhou, Y. Precipitation efficiency of cloud and its influencing factors over the Tibetan plateau. Int. J. Climatol. 2021, 42, 416–434. [Google Scholar] [CrossRef]
  23. Zhu, D.; Zhi, X.; Wang, N.; Chen, C.; Tian, X.; Yu, Y. Impacts of Changbai Mountain Topography on the Extreme Precipitation From Super Typhoon Maysak. Front. Environ. Sci. 2021, 9, 818402. [Google Scholar] [CrossRef]
  24. Zhao, P.; Xiao, H.; Liu, J.; Zhou, Y.; Xu, X.; Hao, K. Evaluating a simple proxy for climatic cloud-to-ground lightning in Sichuan Province with complex terrain, Southwest China. Int. J. Climatol. 2021, 7451, 1–19. [Google Scholar] [CrossRef]
  25. Fang, Y.H.; Chen, K.Q.; Chen, H.S.; Xu, S.Q.; Geng, X.; Li, T.Y.; Teng, F.D.; Zhou, X.Y.; Wang, Y.G. The remote responses of early summer cold vortex precipitation in northeastern China to the precedent sea surface temperatures. Atmos. Res. 2018, 214, 399–409. [Google Scholar] [CrossRef]
  26. Fang, Y.H.; Lin, Y.T.; Ren, H.L.; Zhao, C.Y.; Zhou, F.; Li, Q.; Gu, C.L. Possible Relationships Between the Interannual Anomalies of the South-North Positions of the Northeastern China Cold Vortexes and the Sea Surface Temperatures (SSTs) During the Early Summer Periods. Front. Earth Sci. 2020, 8, 557014. [Google Scholar] [CrossRef]
  27. Fang, Y.H.; Zhang, M.M.; Zhao, C.Y.; Gong, Z.Q.; Zhang, W.Q. The Characteristics of Northeast China Cold Vortex With Different Active Paths in June and Their Relationship With Precipitation and Pre-SST. Front. Environ. Sci. 2021, 9, 1665394. [Google Scholar] [CrossRef]
  28. Du, H.; Wu, Z.; Zong, S.; Meng, X.; Wang, L. Assessing the characteristics of extreme precipitation over northeast China using the multifractal detrended fluctuation analysis. J. Geophys. Res. Atmos. 2013, 118, 6165–6174. [Google Scholar] [CrossRef]
  29. Hersbach, H.; Bell, B.; Berrisford, P.; Horanyi, A.; Sabater, J.M.; Nicolas, J.; Radu, R.; Schepers, D.; Simmons, A.; Soci, C.; et al. Global reanalysis: Goodbye ERA-Interim, hello ERA5. ECMWF Newsl. 2019, 159, 17–24. [Google Scholar]
  30. Olauson, J. ERA5: The new champion of wind power model ling? Renew. Energy 2018, 126, 322–331. [Google Scholar] [CrossRef] [Green Version]
  31. Huang, B.; Thorne, P.W.; Banzon, V.F.; Boyer, T.; Zhang, H.M. Extended Reconstructed Sea Surface Temperature, Version 5 (ERSSTv5): Upgrades, Validations, and Intercomparisons. J. Clim. 2017, 30, 8179–8205. [Google Scholar] [CrossRef]
  32. Lorenz, E.N. Empirical Orthogonal Functions and Statistical Weather Prediction; Scientific Report No. 1; Massacusets University of Technology: Cambridge, MA, USA, 1956; pp. 1–49. [Google Scholar]
  33. North, G.R.; Bell, T.L.; Cahalan, R.F.; Moeng, F. Sampling errors in the estimation of empirical orthogonal functions. Mon. Weather Rev. 1982, 110, 1–9. [Google Scholar] [CrossRef]
  34. Kwang, -Y.K.; North, G.R.; Jianping, H. EOFs of One-Dimensional Cyclostationary Time Series: Computations, Examples, and Stochastic Modeling. J. Atmos. Sci. 1996, 53, 1007–1017. [Google Scholar] [CrossRef]
  35. Mardia, K.V. Multi-dimensional multivariate Gaussian Markov random fields with application to image processing. J. Multivar. Anal. 1988, 24, 265–284. [Google Scholar] [CrossRef] [Green Version]
  36. Hannachi, A.; Jolliffe, I.T.; Stephenson, D.B. Empirical orthogonal functions and related techniques in atmospheric science: A review. Int. J. Climatol. 2007, 27, 1119–1152. [Google Scholar] [CrossRef]
  37. Dawson, A. eofs: A Library for EOF Analysis of Meteorological, Oceanographic, and Climate Data. J. Open Res. Softw. 2016, 4, 1–4. [Google Scholar] [CrossRef] [Green Version]
  38. Walsh, J.E.; Mostek, A. A quantitative analysis of meteorological anomaly patterns over the United States, 1900–1977. Mon. Weather Rev. 1980, 108, 615–630. [Google Scholar] [CrossRef]
  39. Sein, Z.Z.; Zhi, X. Interannual variability of summer monsoon rainfall over Myanmar. Arab. J. Geosci. 2016, 9, 469. [Google Scholar] [CrossRef]
  40. Mann, H.B. Nonparametric tests against trend. Econometrica 1945, 13, 245–259. [Google Scholar] [CrossRef]
  41. Hamed, K.H.; Rao, A.R. A modified Mann-Kendall trend test for autocorrelated data. J. Hydrol. 1998, 204, 182–196. [Google Scholar] [CrossRef]
  42. Ullah, I.; Ma, X.; Yin, J.; Asfaw, T.G.; Azam, K.; Syed, S.; Liu, M.; Arshad, M.; Shahzaman, M. Evaluating the meteorological drought characteristics over Pakistan using in situ observations and reanalysis products. Int. J. Climatol. 2021, 41, 4437–4459. [Google Scholar] [CrossRef]
  43. Du, R.; Shang, F.; Ma, N. Automatic mutation feature identification from well logging curves based on sliding t test algorithm. Clust. Comput. 2018, 22, 14193–14200. [Google Scholar] [CrossRef]
  44. Donges, J.F.; Zou, Y.; Marwan, N.; Kurths, J. Complex networks in climate dynamics. Eur. Phys. J. Spec. Top. 2009, 174, 157–179. [Google Scholar] [CrossRef] [Green Version]
  45. Satyamurty, P.; Teixeira, M.; Padilha, C.K. Warm and Dry Spells (WDS) in Austral Winter over Central South America. Ann. Geophys. 2007, 25, 1049–1069. [Google Scholar] [CrossRef] [Green Version]
  46. Lu, R.; Zhu, Z.W.; Li, T.; Zhang, H.Y. Interannual and Interdecadal Variabilities of Spring Rainfall over Northeast China and Their Associated Sea Surface Temperature Anomaly Forcings. J. Clim. 2020, 33, 1423–1435. [Google Scholar] [CrossRef]
  47. Gao, J.; Gao, H. Relationship between Summer Precipitation over Northeastern China and Sea Surface Temperature in the Southeastern Pacific and the Possible Underlying Mechanisms. J. Atmos. Sci. 2015, 39, 967–977. [Google Scholar] [CrossRef]
Figure 1. Map of the study area showing elevation (m) and the meteorological stations used in the study; the inset is the location of Northeast China within the country.
Atmosphere 13 00354 g001
Figure 2. Climatology of heavy rainfall under cold vortex during May–September (1961–2019) (mm, shaded).
Atmosphere 13 00354 g002
Figure 3. Interdecadal variability in heavy rainfall under cold vortex over northeast China during 1961–2019.
Atmosphere 13 00354 g003
Figure 4. Interdecadal variability in frequency of heavy rainfall and rainstorms over northeast China during 1961–2019.
Atmosphere 13 00354 g004
Figure 5. Abrupt change in heavy rainfall under NECV derived from the sequential Mann-Kendall test; U(t), forward sequential statistic; U’(t), backward sequential statistic; the upper and lower dashed lines represent significance at the 95% confidence level.
Atmosphere 13 00354 g005
Figure 6. Normalized time series of EOF1-3 (PC1-3) for NECVHR over Northeast China during 1961–2019: (a,e,i) the spatial distribution of the EOF1-3, (b,f,j) analysis of variance of PC1-3 variability, (c,g,k) the t-test, and (d,h,l) MK test at the 95% confidence level.
Atmosphere 13 00354 g006
Figure 7. Composite 500 hPa geopotential height anomaly (gpm, shaded) and 850 hPa wind anomaly (m/s, vectors) of the two rainfall patterns in Northeast China during 1961−2019: (a) pattern A; (b) pattern B; and (c) pattern A minus pattern B. The dots indicate that the 500 hPa height anomaly exceeds the 95% confidence level; red (blue) shaded areas: positive (negative) values. The vector values were estimated using Student’s t-test.
Atmosphere 13 00354 g007
Figure 8. Relative humidity (shaded) and wind (m/s, vectors) components at 850 hPa for the two rainfall patterns in Northeast China during 1961–2019: (a) pattern A; (b) pattern B; areas reaching 95% significant test are dotted; the red box marks the differences.
Atmosphere 13 00354 g008
Figure 9. Pressure vertical velocity (ω) (10−5 Pa s−1, shaded) over Northeast China during MCVHR years (2016–2019) and LCVHR years (1979 and 1983–1985): (a) MCVHR years at 42° N, (b) LCVHR years at 42° N, (c) MCVHR years at 50° N, and (d) LCVHR years at 50° N. The red (blue) color indicates a positive (negative) significant anomaly. The dashed (solid) lines show ascending (descending) motion. Negative (positive) values indicate an upward (downward) motion.
Atmosphere 13 00354 g009
Figure 10. Interdecadal variability in the 10-year running mean NECVHR anomaly based on the standard deviation, southern oscillation index (SOI), Atlantic multidecadal oscillation (AMO), Arctic oscillation index (AO), North Pacific index (NP), North Atlantic oscillation (NAO), and Pacific decadal oscillation (PDO). Interdecadal component of correlation coefficients between various indices and NECVHR as shown in Table 1.
Atmosphere 13 00354 g010
Figure 11. Spatial distribution of the correlation coefficients between NECVHR and AMO during 1961–2019 (shaded). (a) May; (b) June; (c) July; (d) August; (e) September; (f) average for May–September. Dotted areas indicate the 90% confidence level.
Atmosphere 13 00354 g011
Figure 12. Spatial distribution of the correlation coefficients between the NECVHR and SST during 1961–2019 (shaded). (a) May; (b) June; (c) July; (d) August; (e) September; and (f) average for May–September. The dotted areas indicate the 90% confidence level.
Atmosphere 13 00354 g012
Table 1. Correlation coefficients between various indices and NECVHR for interdecadal component. * Significant value at the 95% confidence level. Southern oscillation index (SOI), Atlantic multidecadal oscillation (AMO), Arctic oscillation index (AO), North Pacific index (NP), North Atlantic oscillation (NAO), and Pacific decadal oscillation (PDO).
IndicesInterdecadal Component
NP0.08
NAO−0.45
AO−0.11
PDO−0.03
AMO0.66 *
SOI−0.09
Publisher’s Note: MDPI stays neutral with regard to jurisdictional claims in published maps and institutional affiliations.

