
Transboundary Air Pollution Transport of PM10 and Benzo[a]pyrene in the Czech–Polish Border Region


Abstract
:1. Introduction
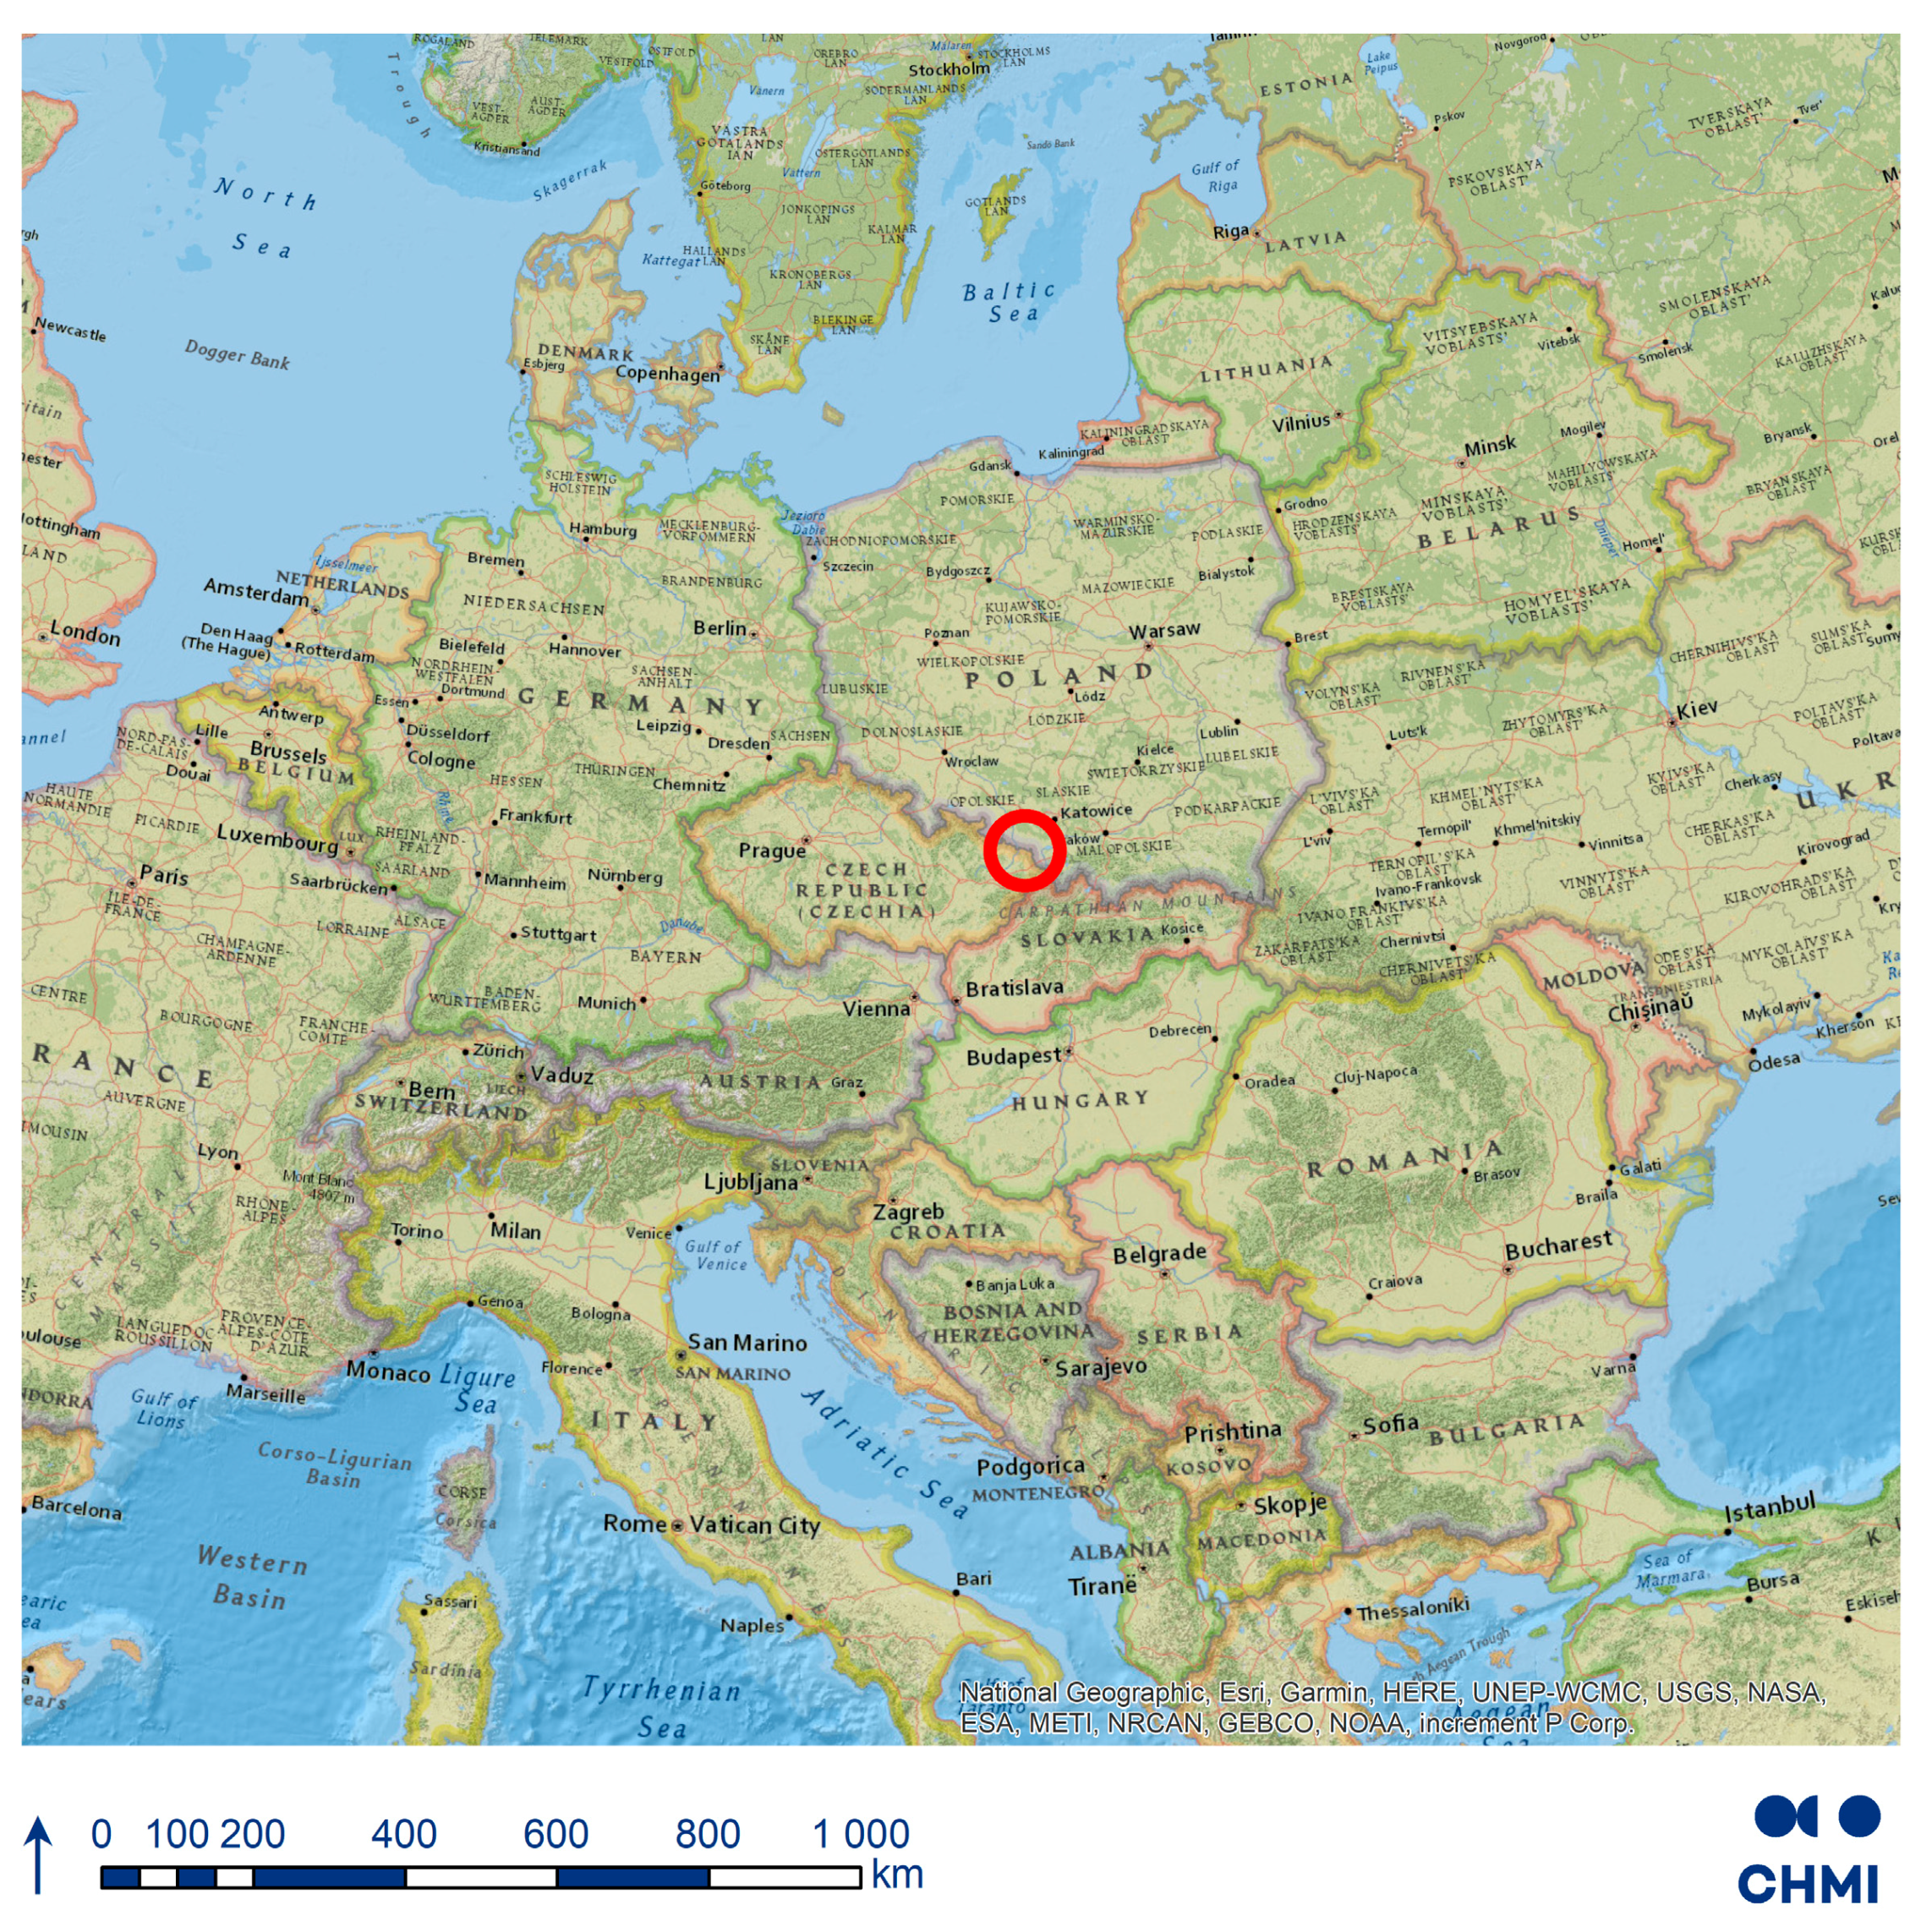
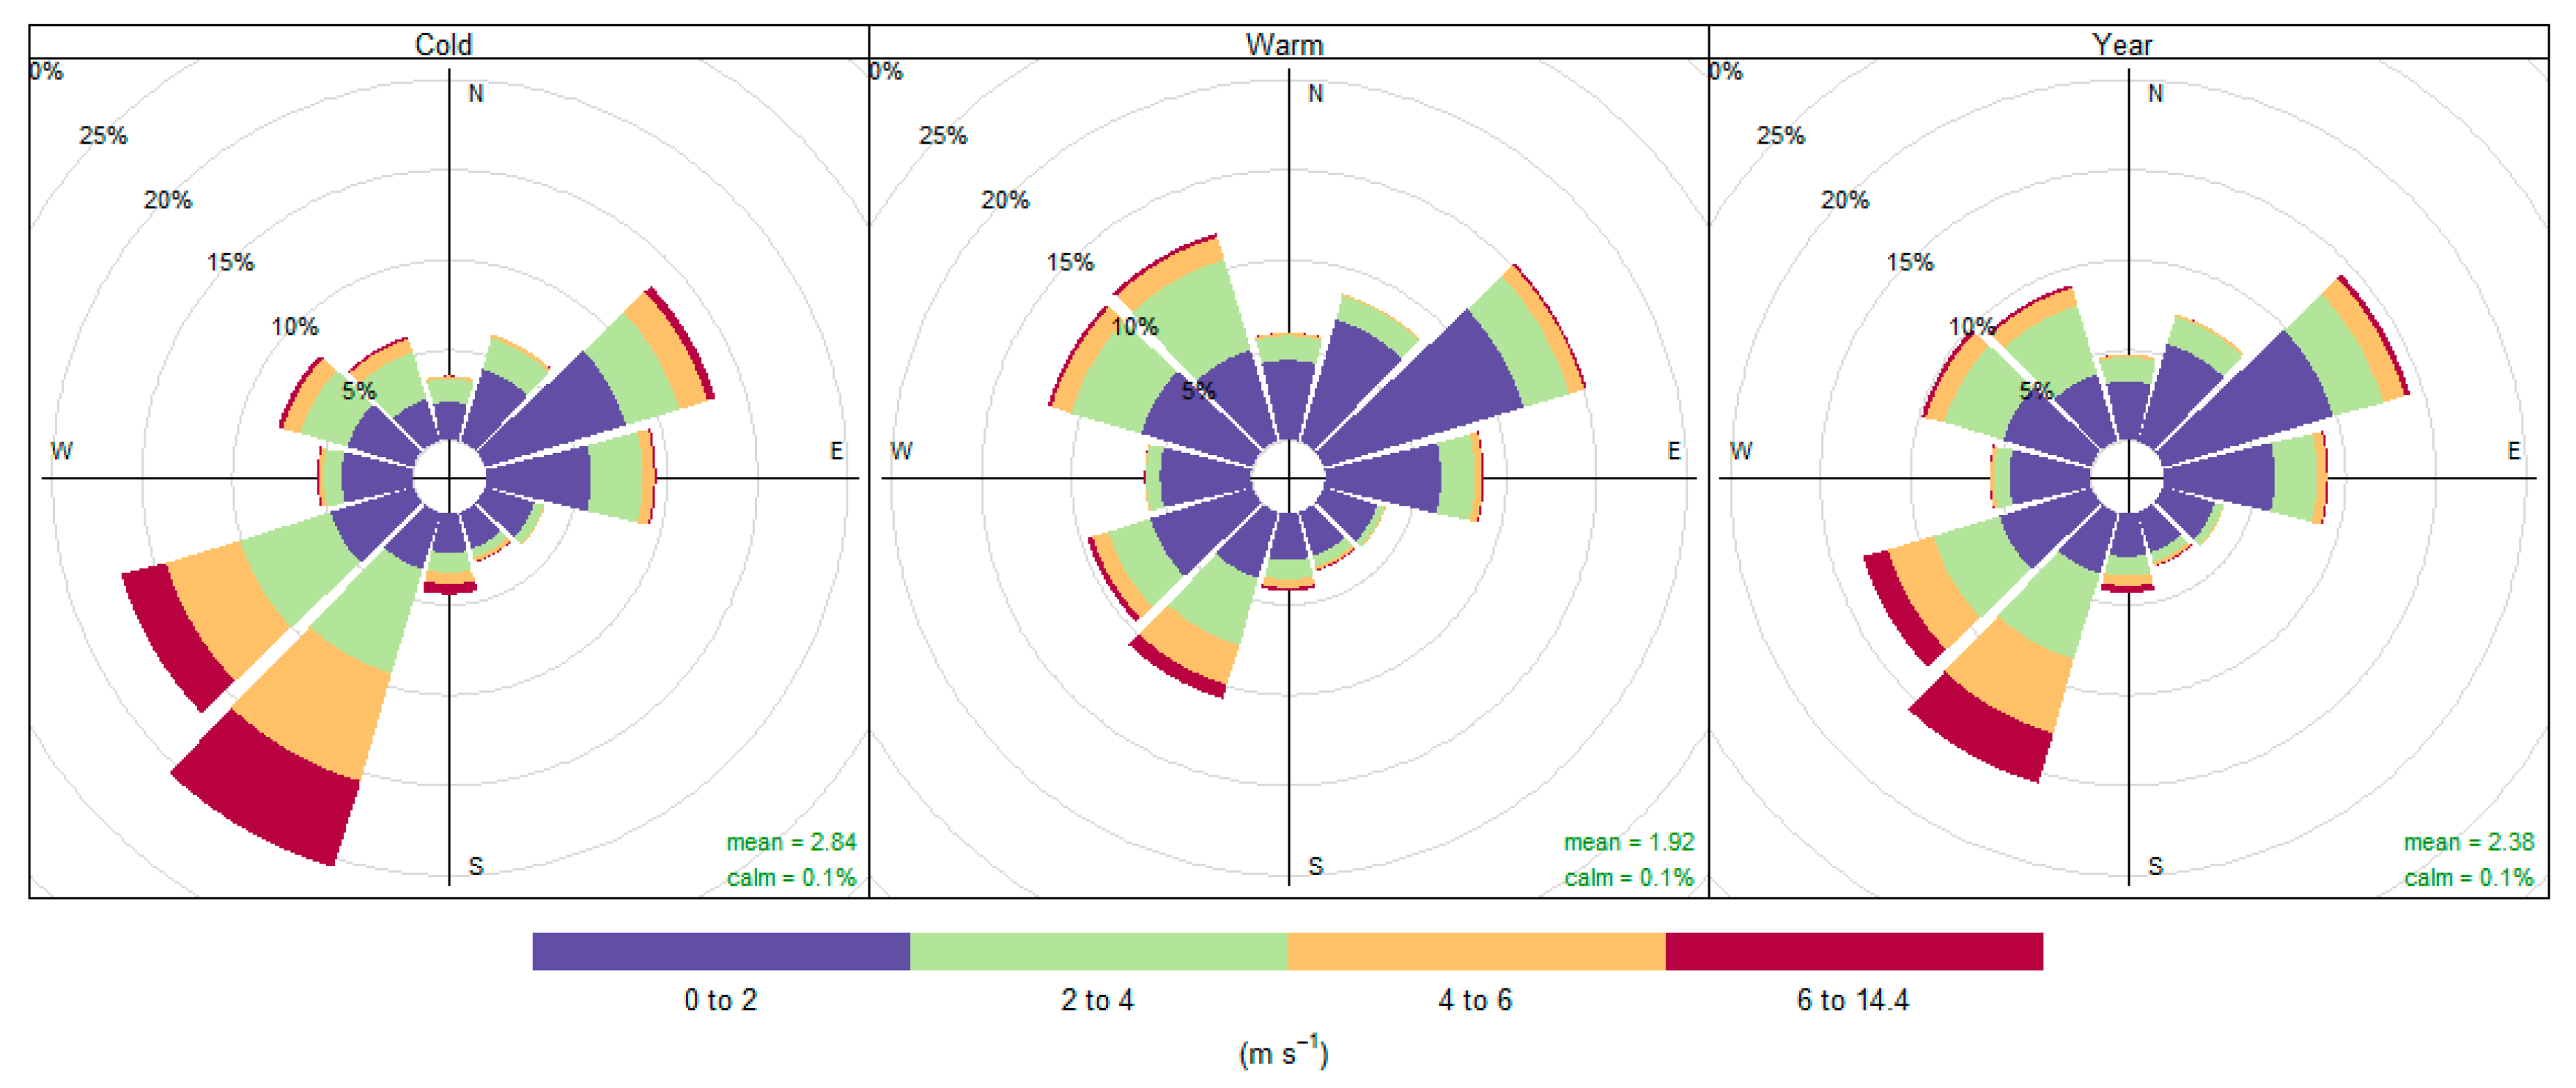
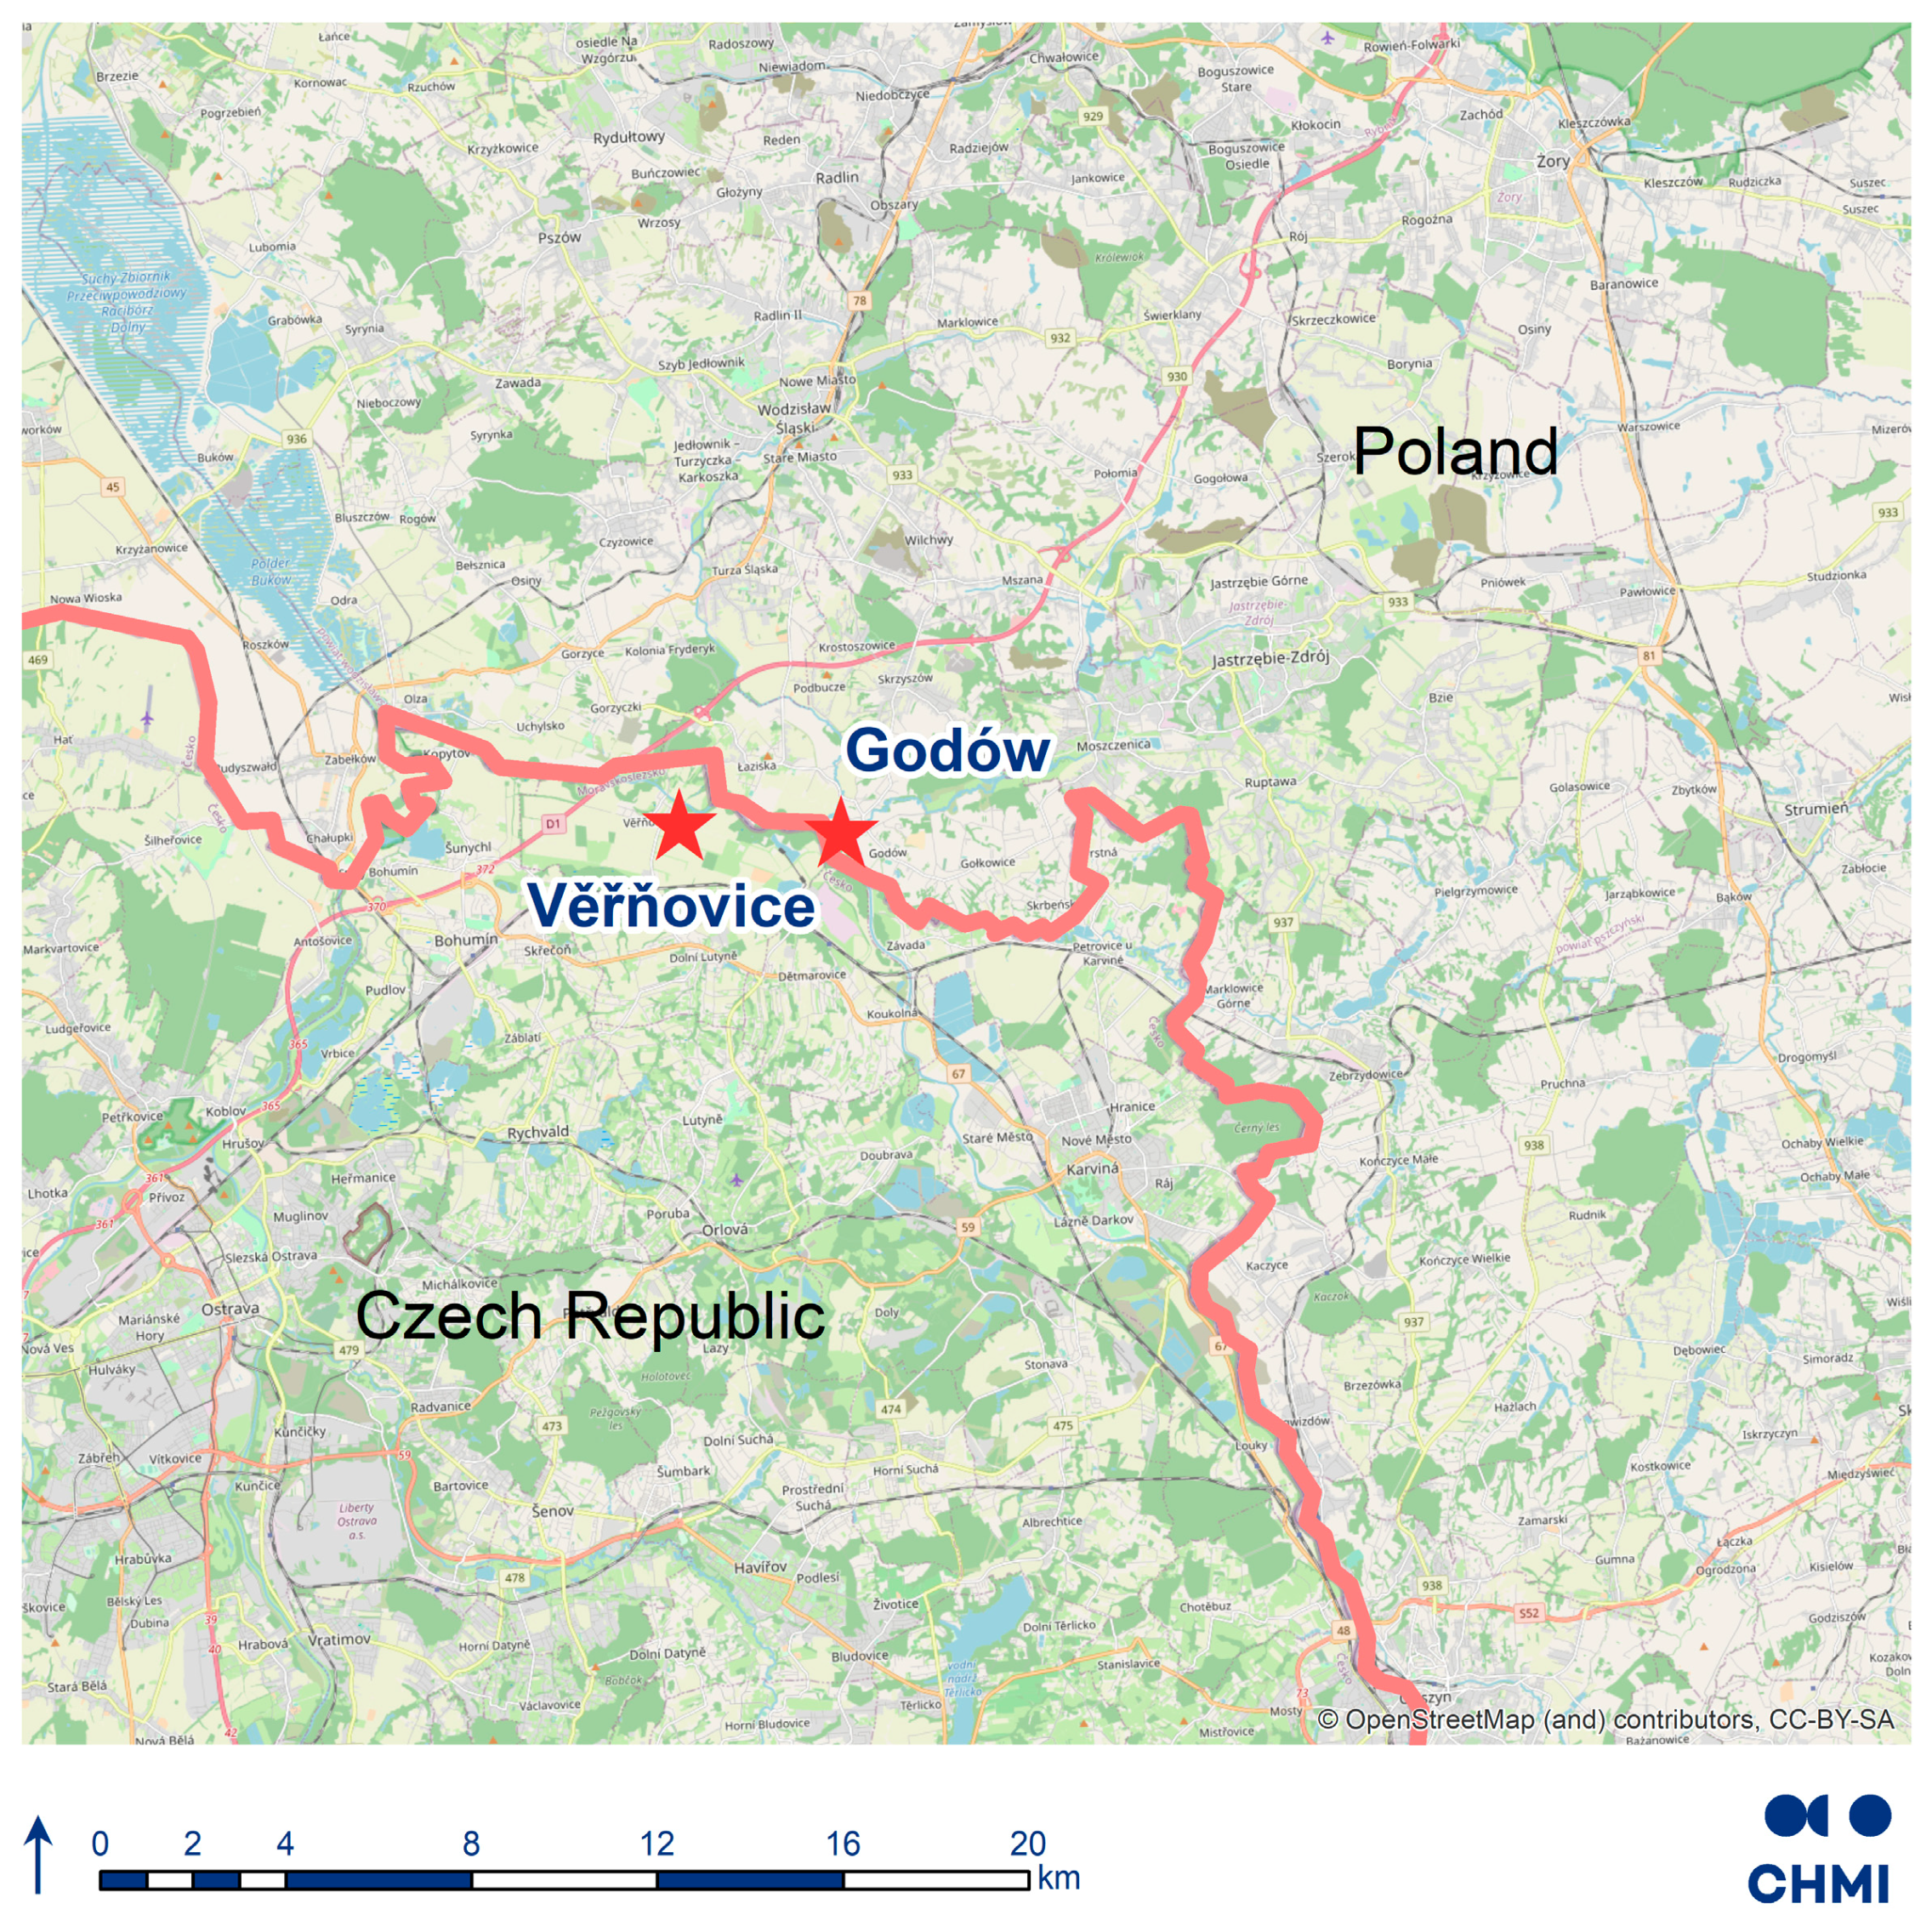
2. Experiments
3. Results
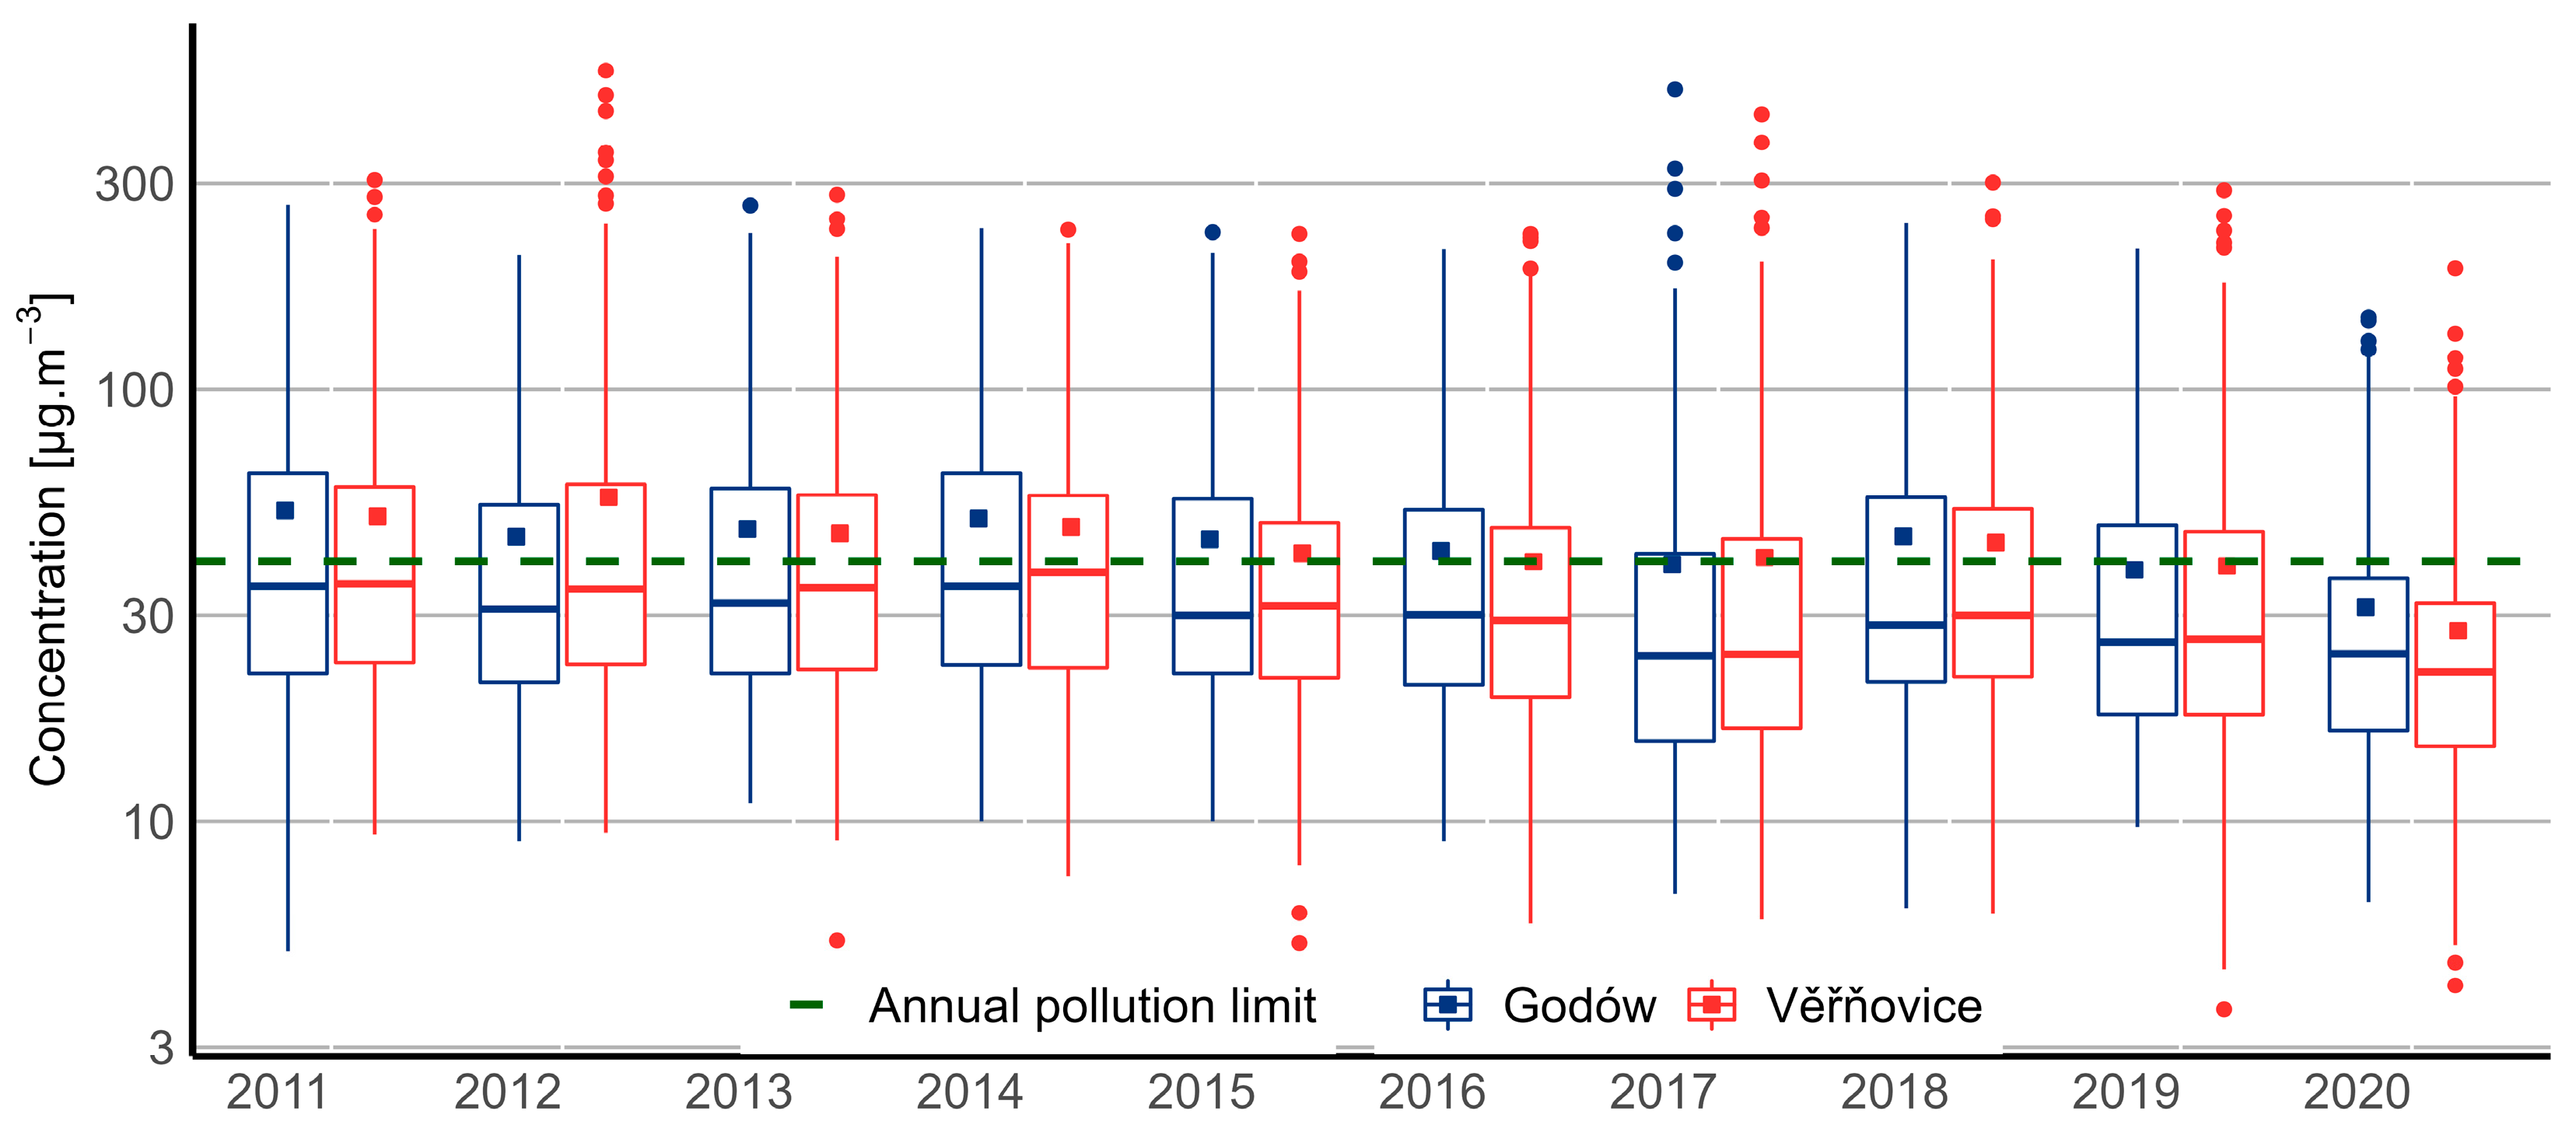
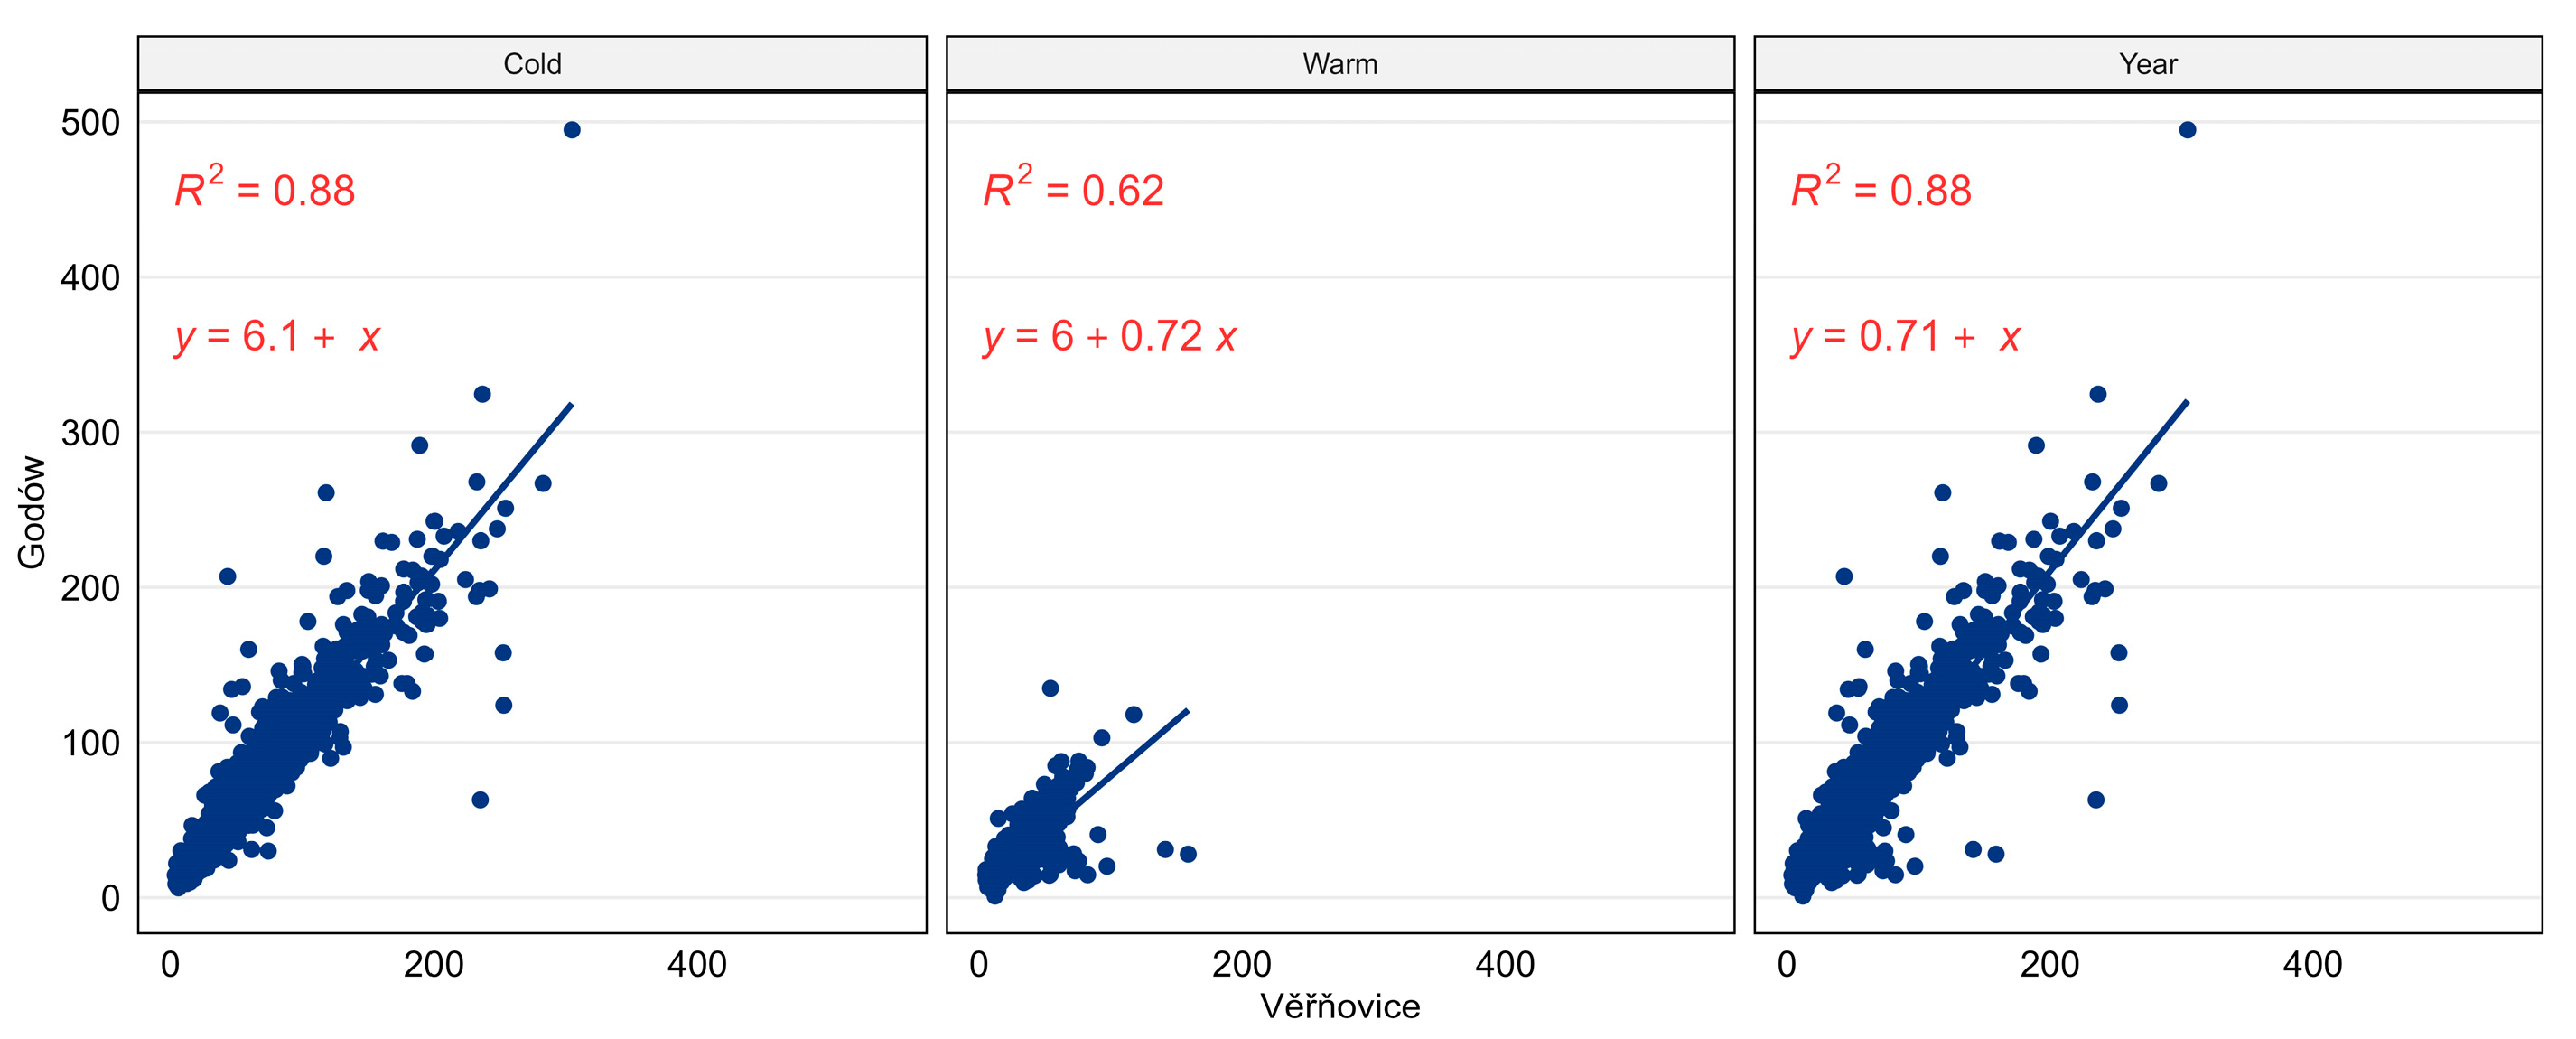
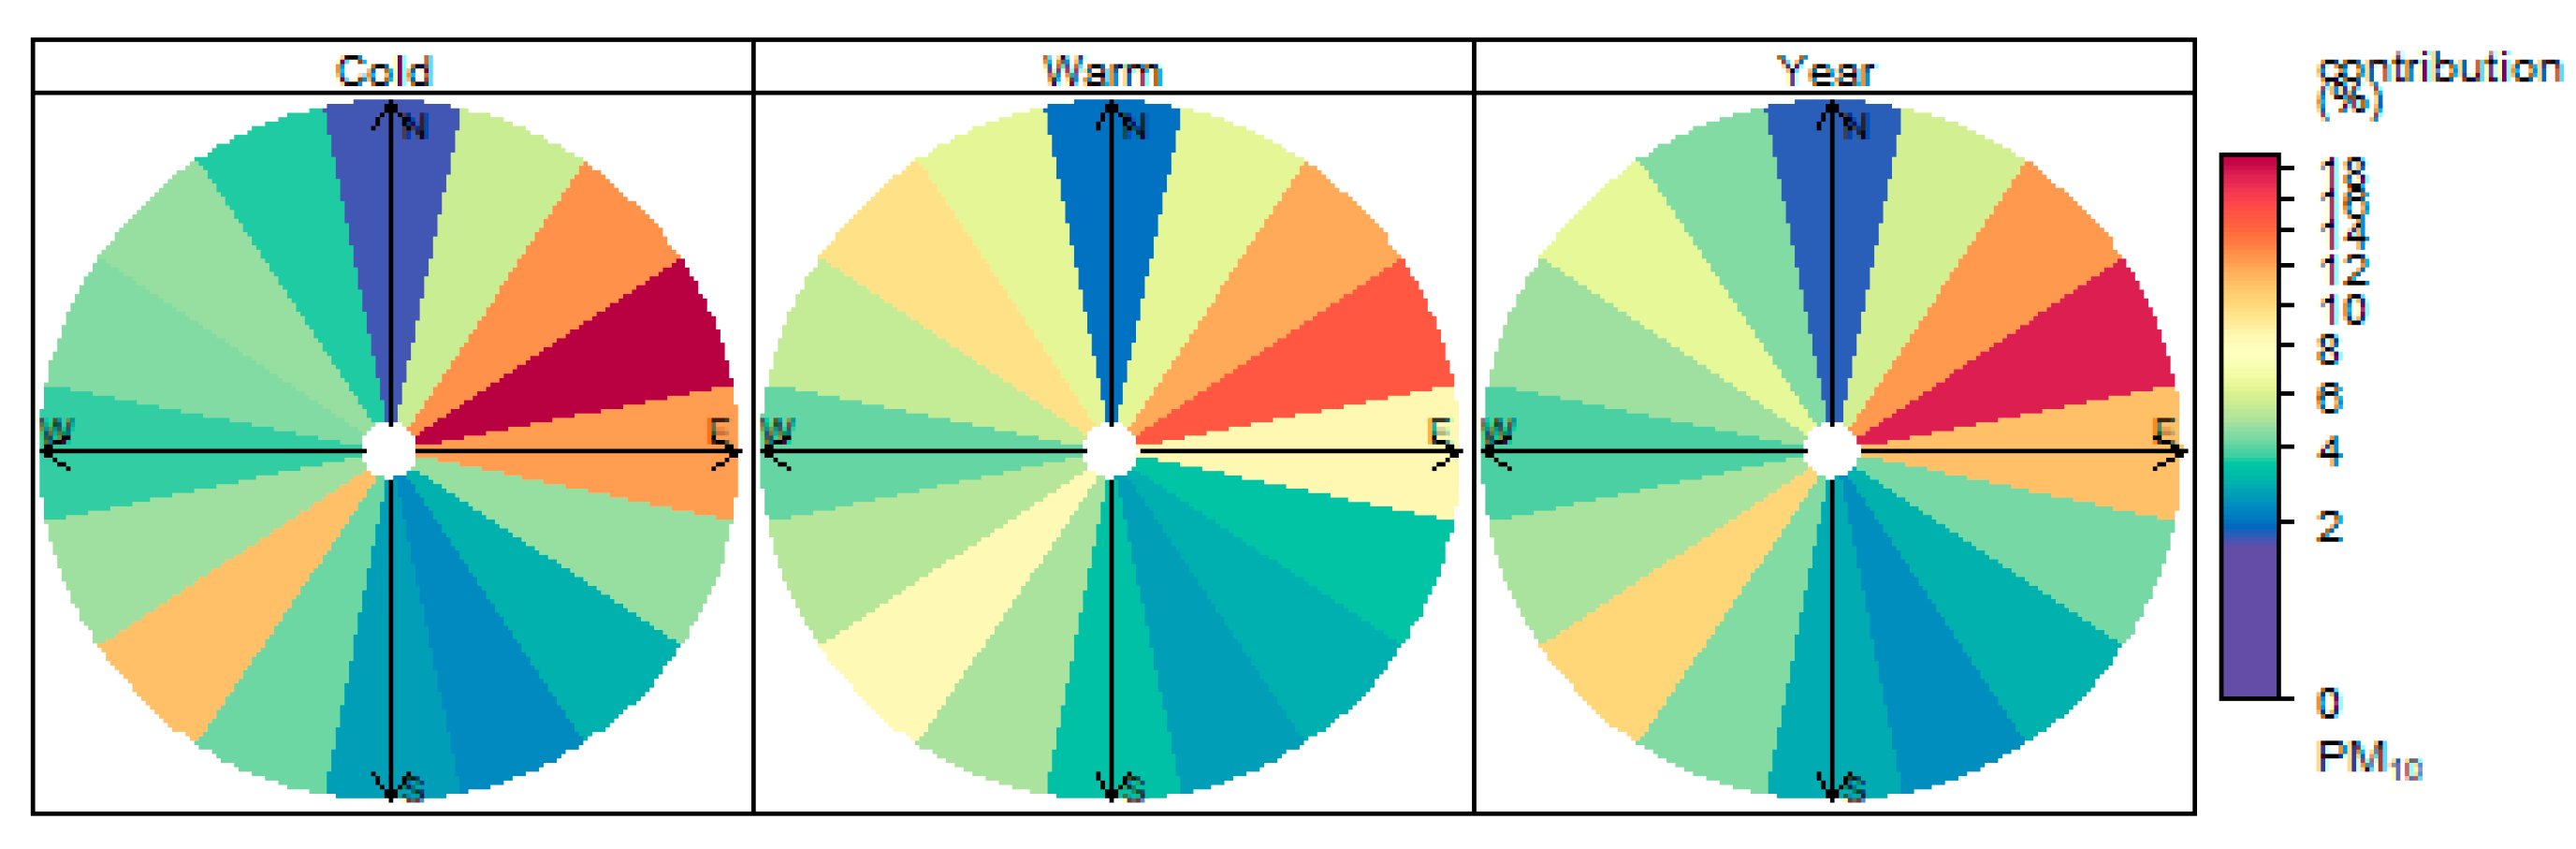
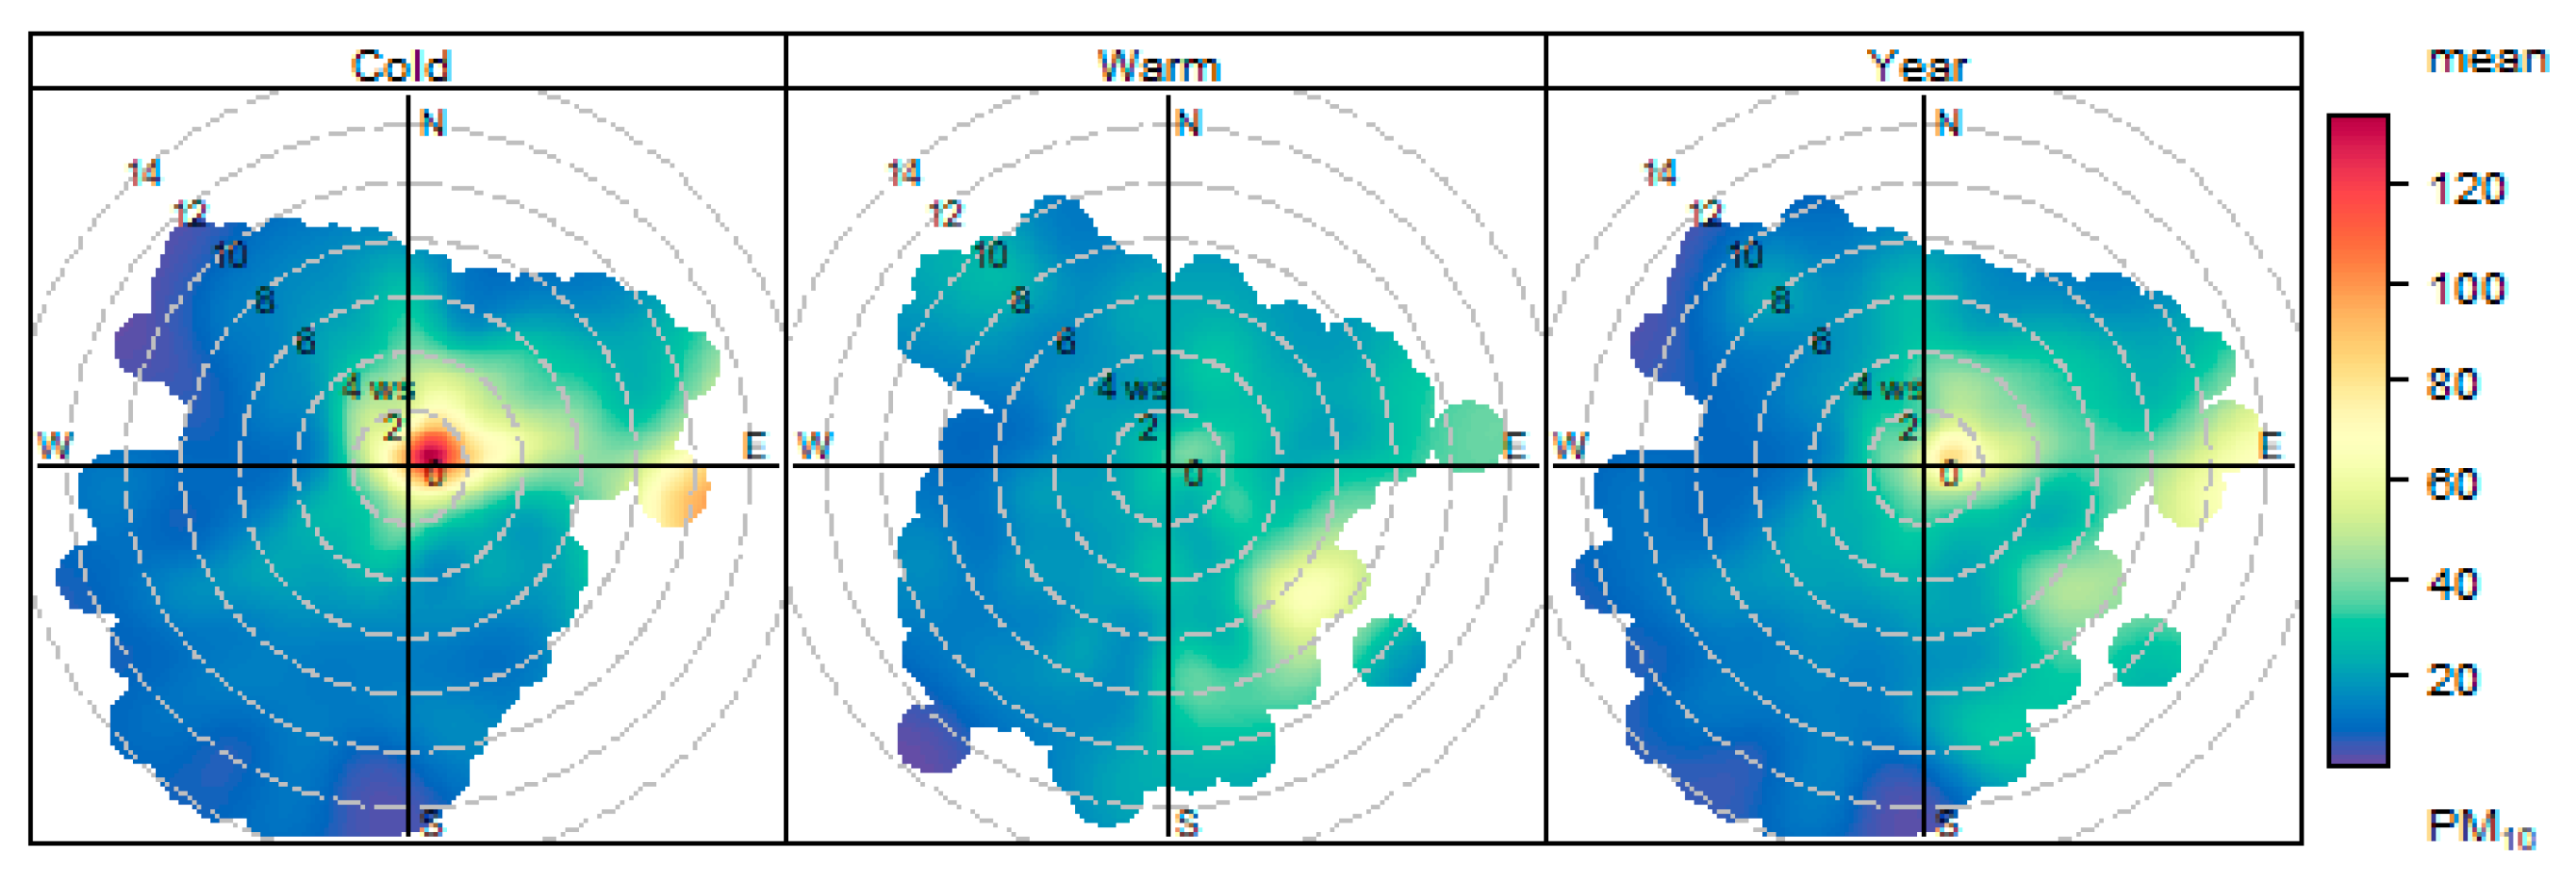
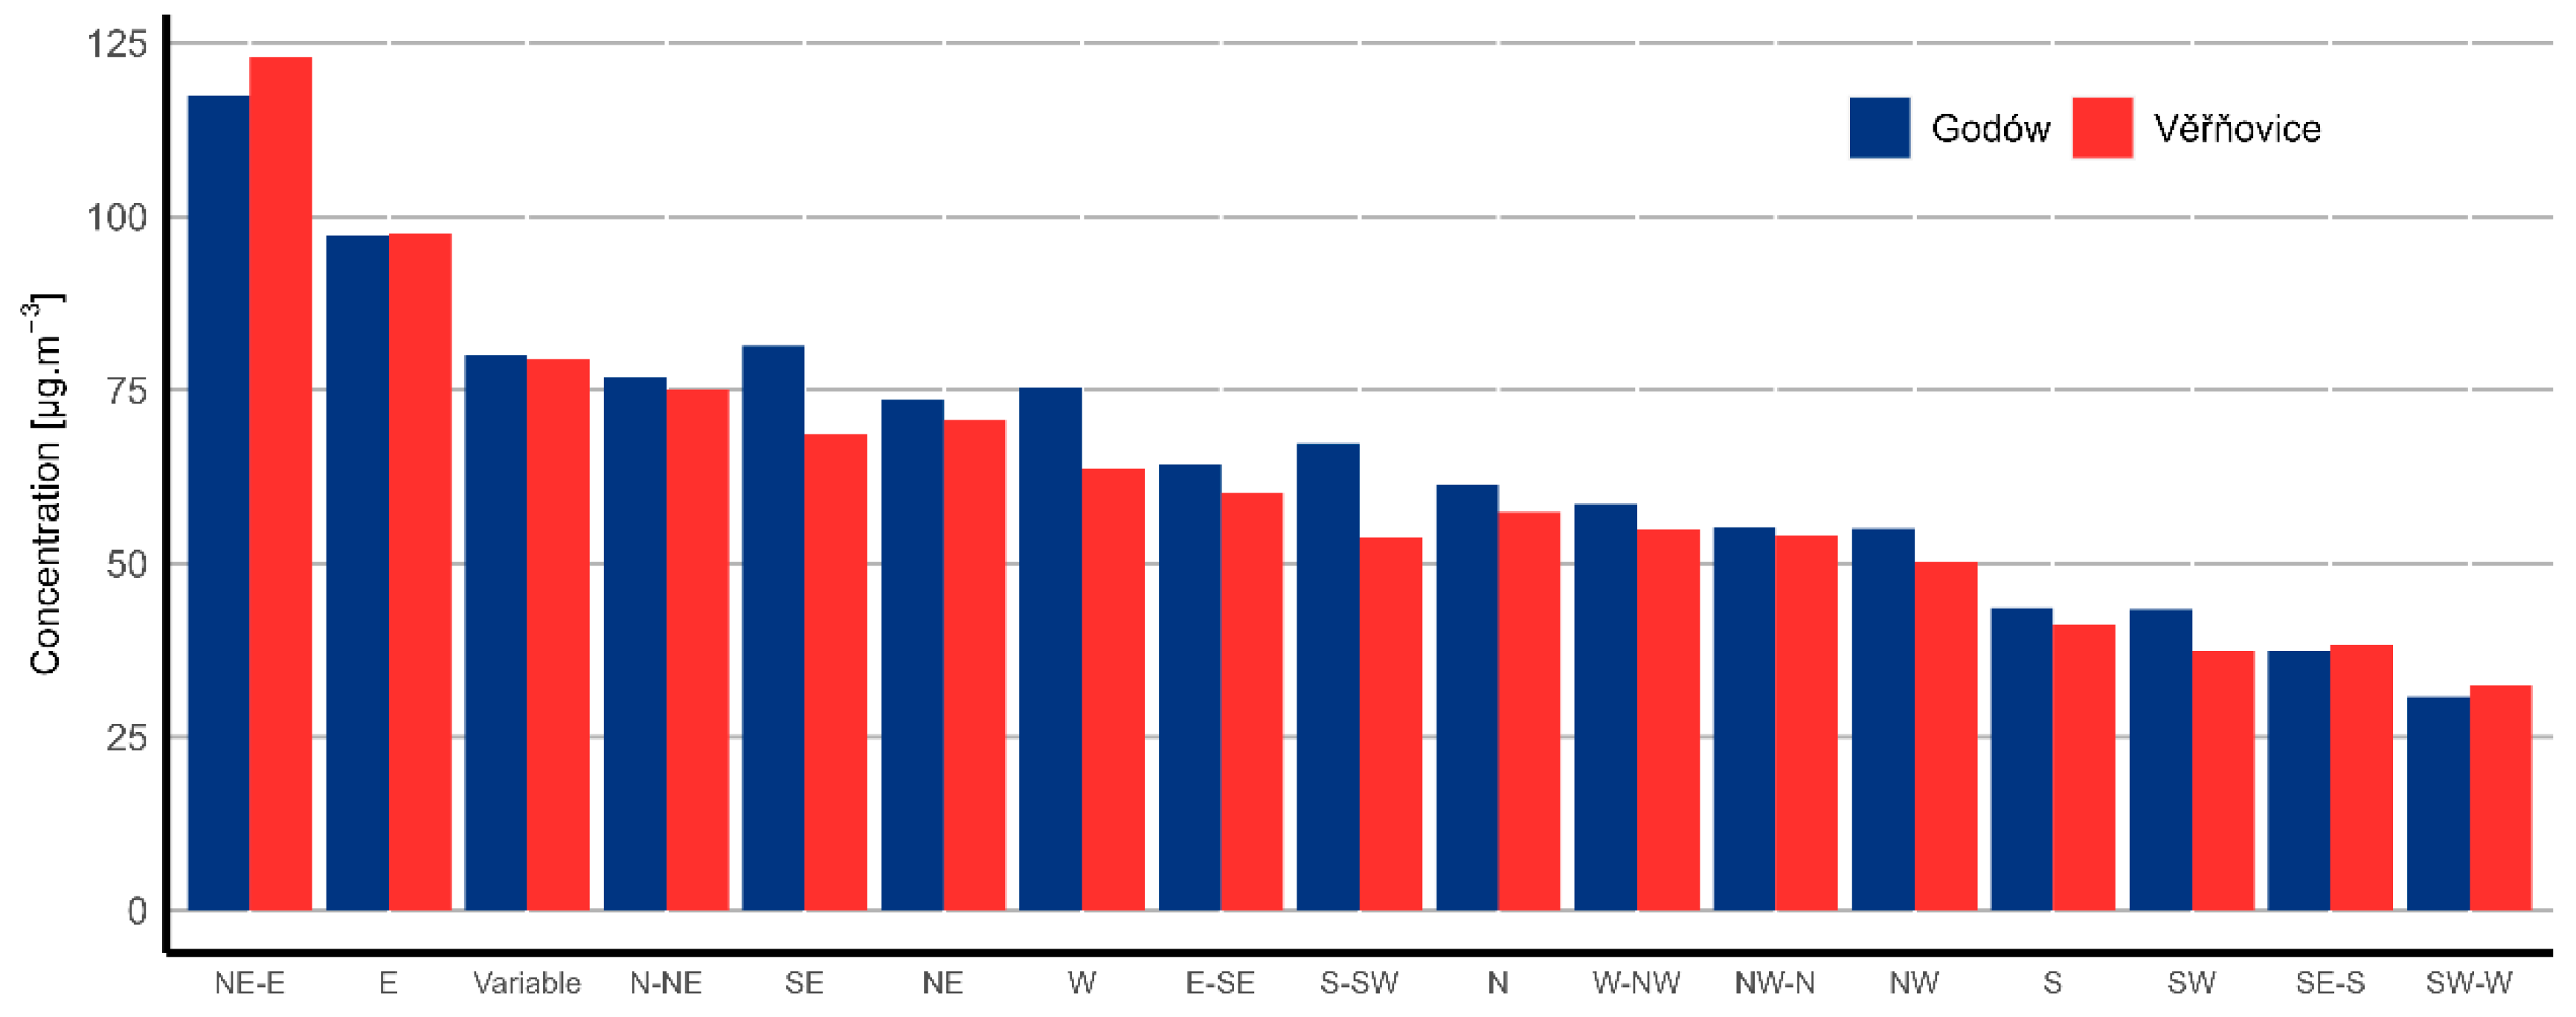
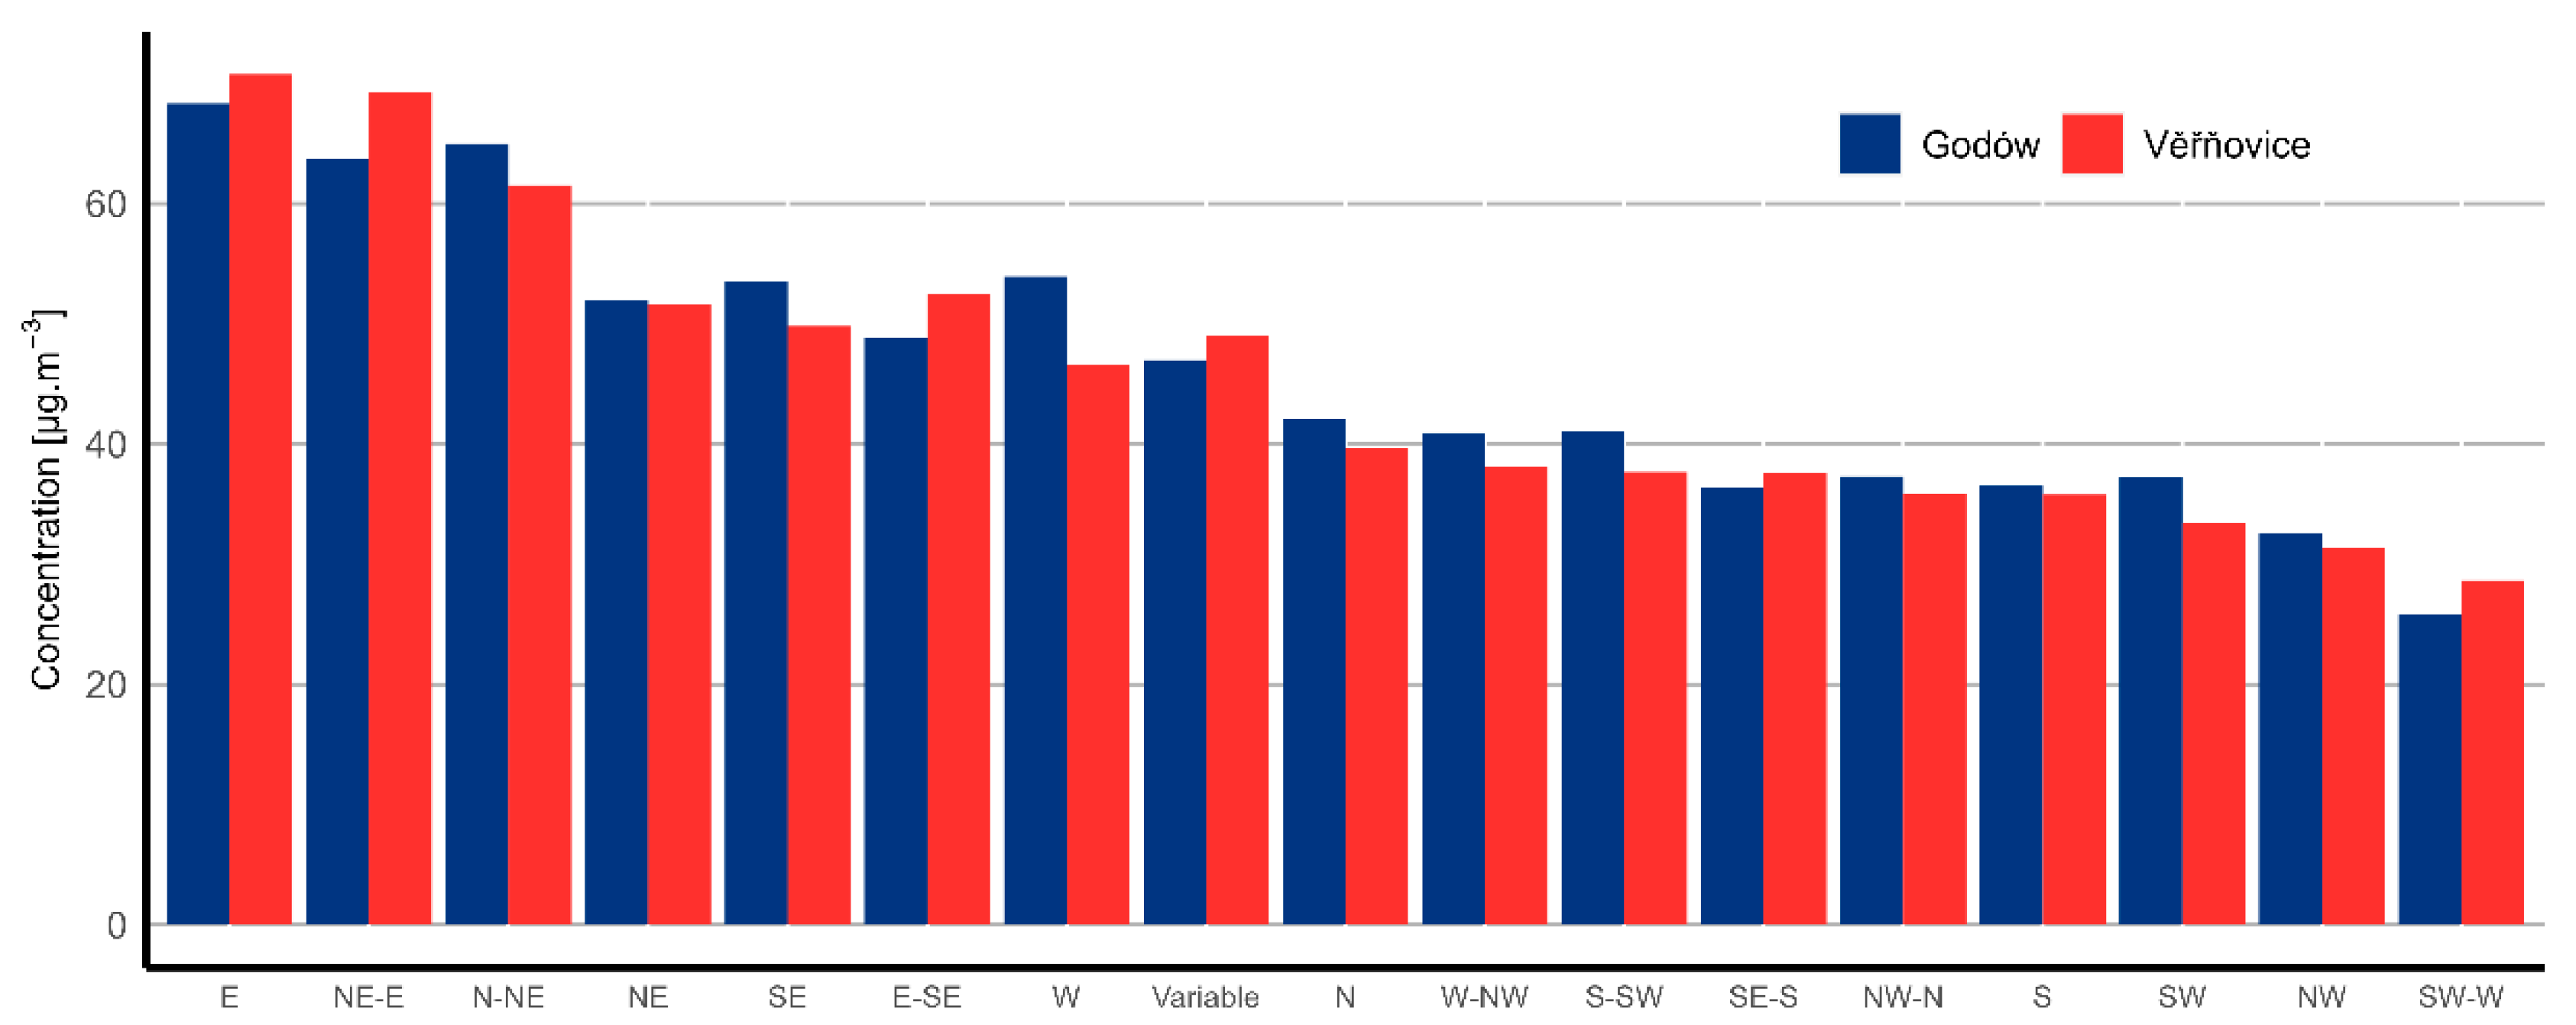
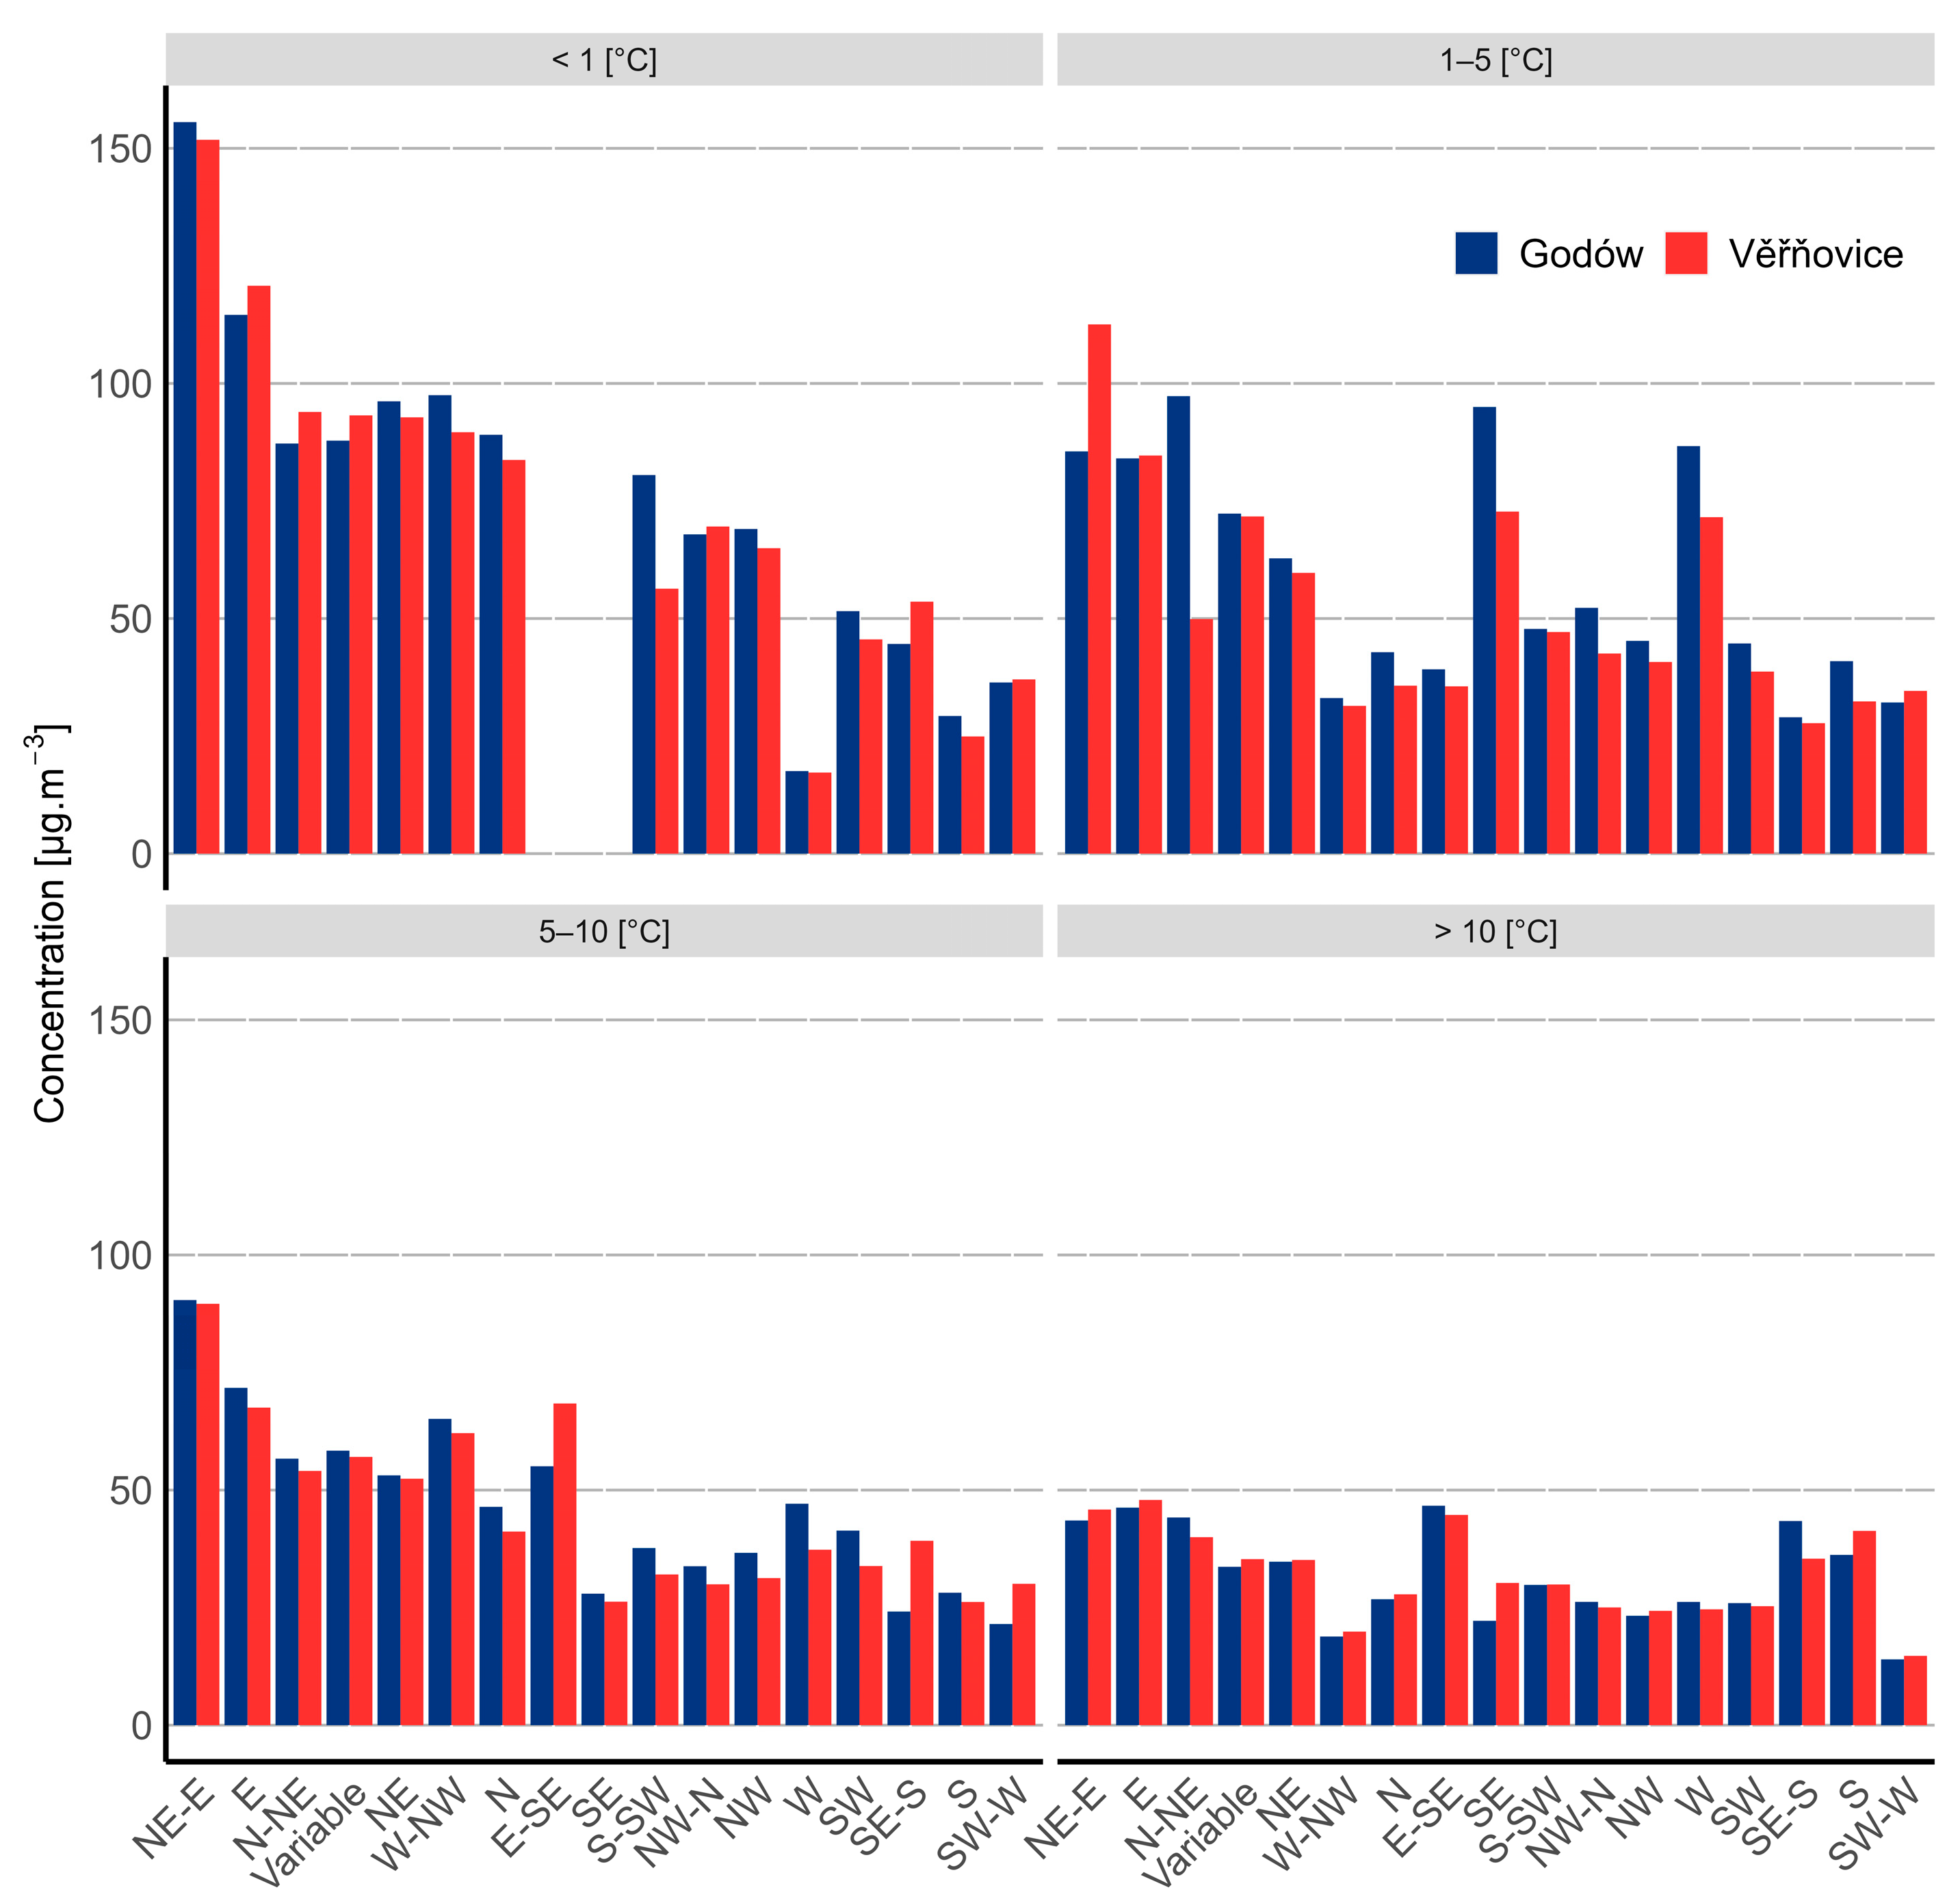
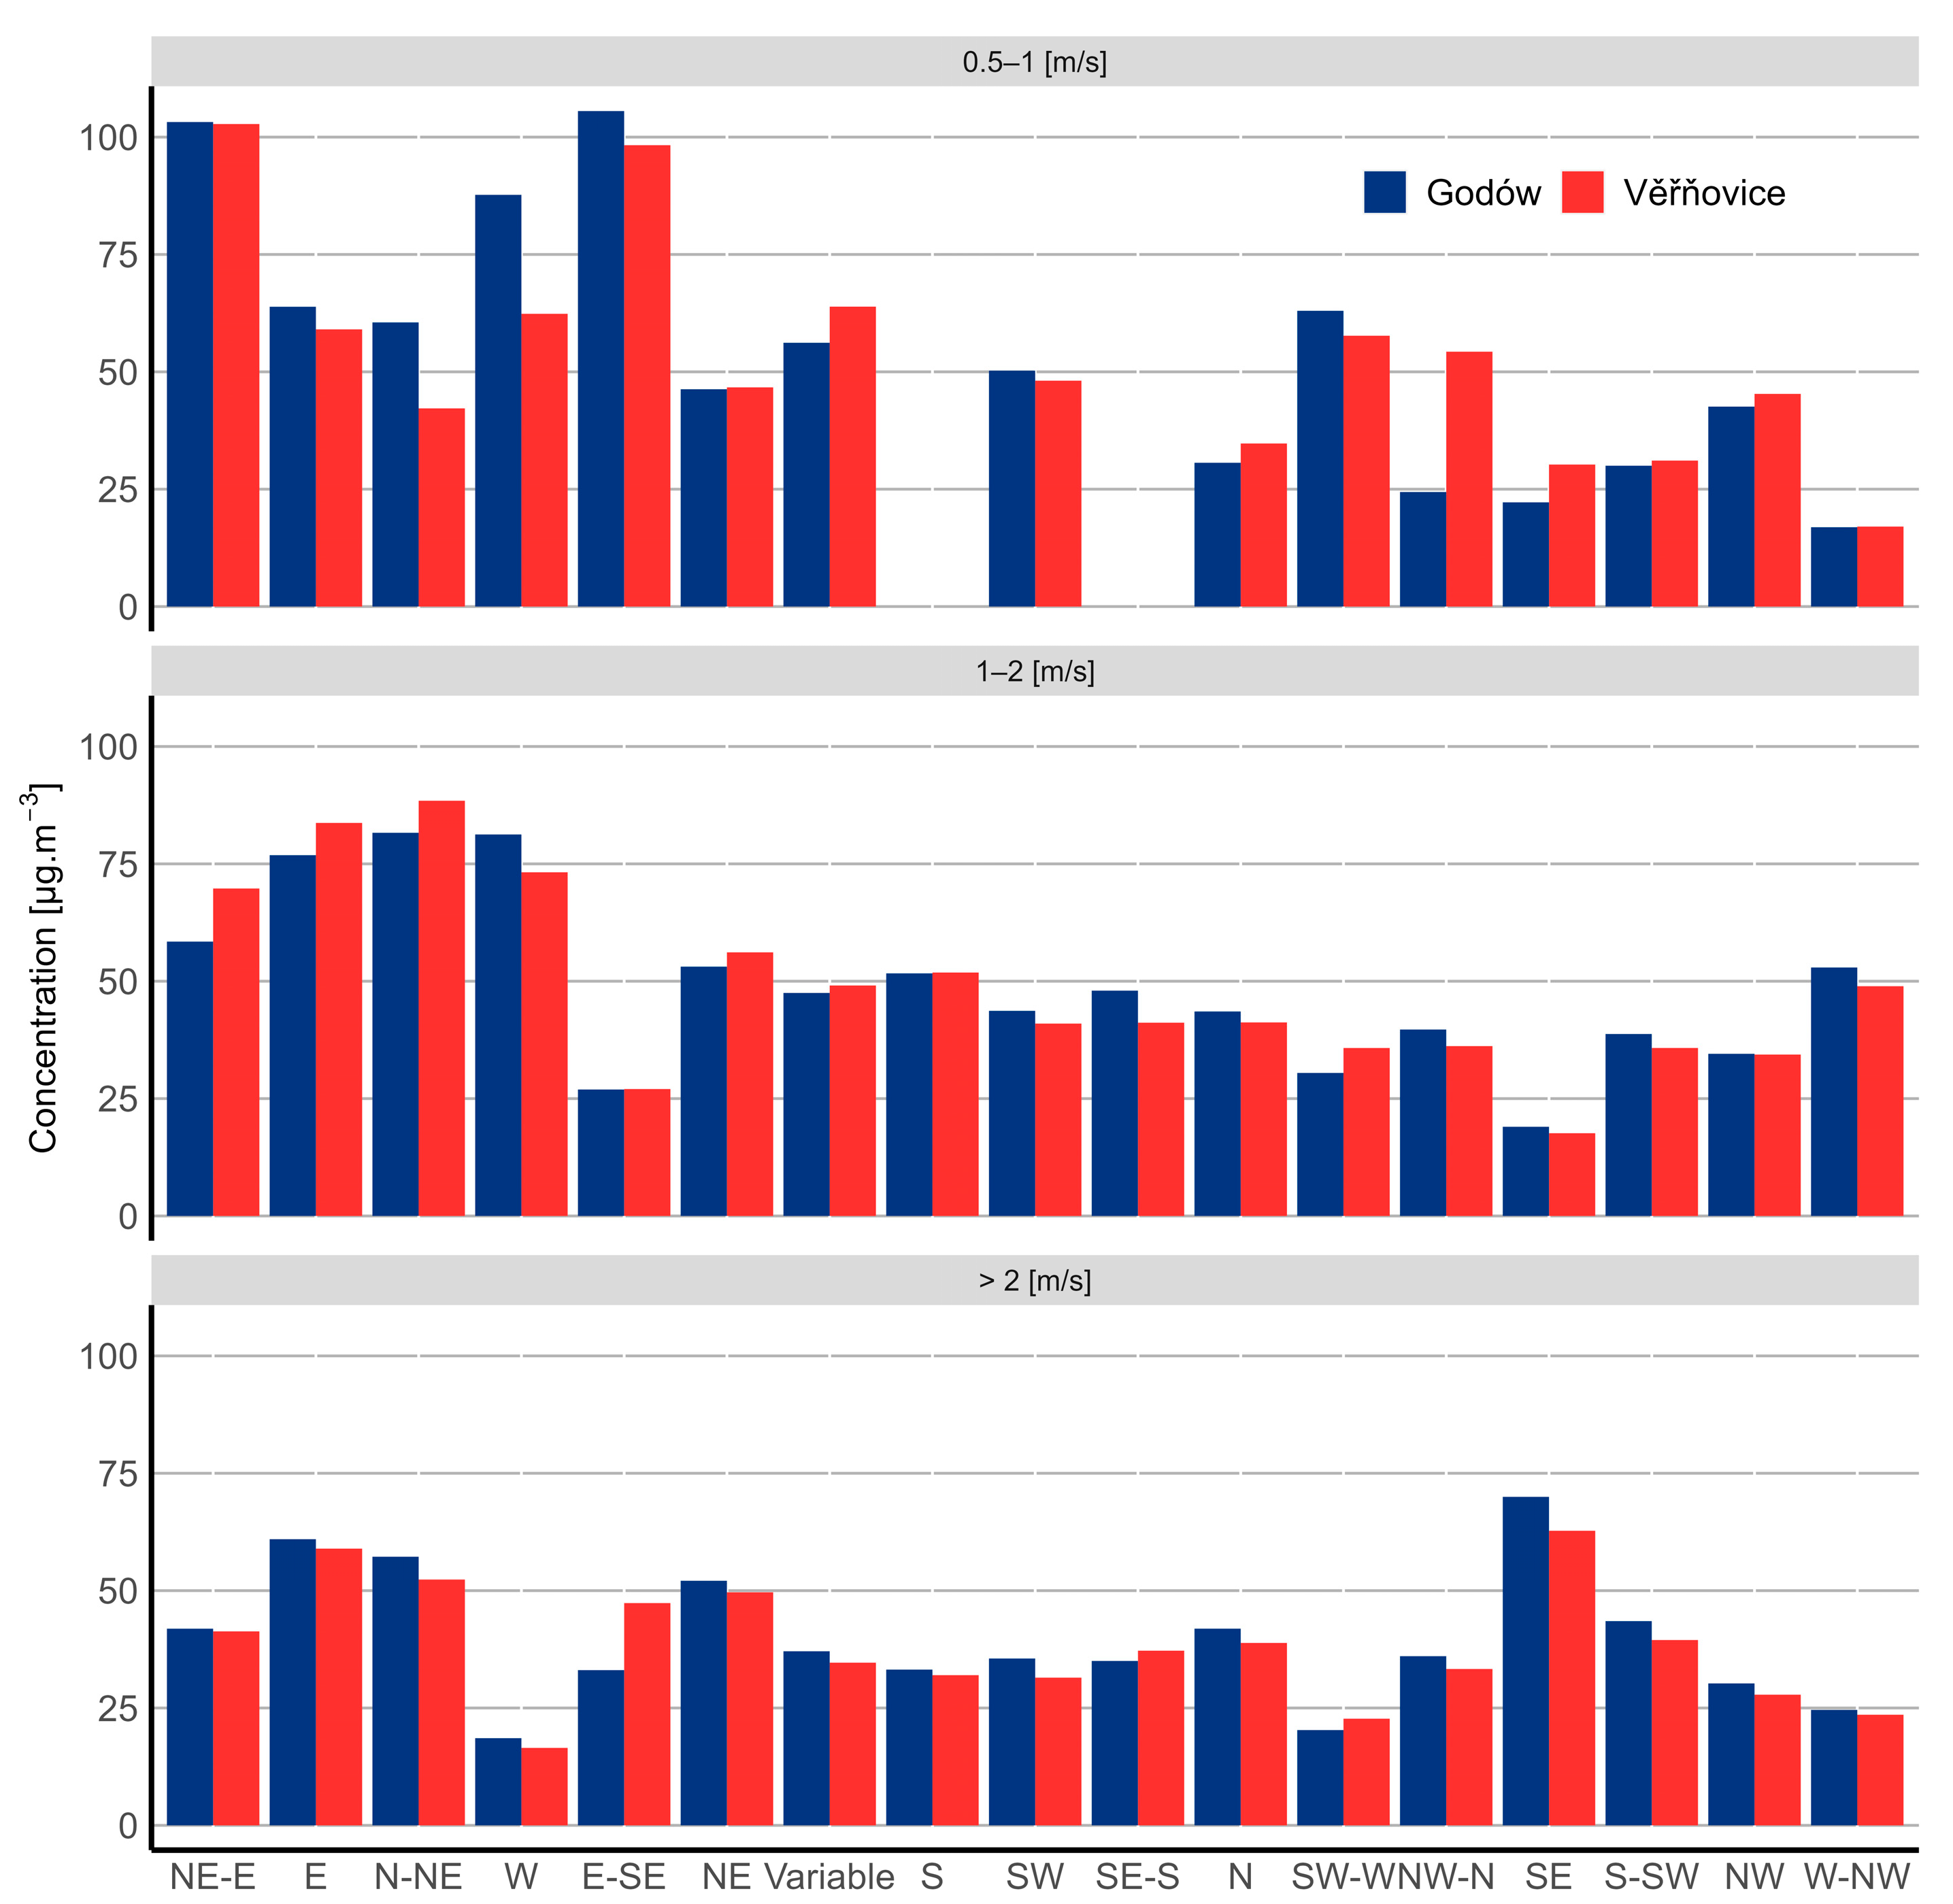
3.1. Evaluation of PM10 Concentrations
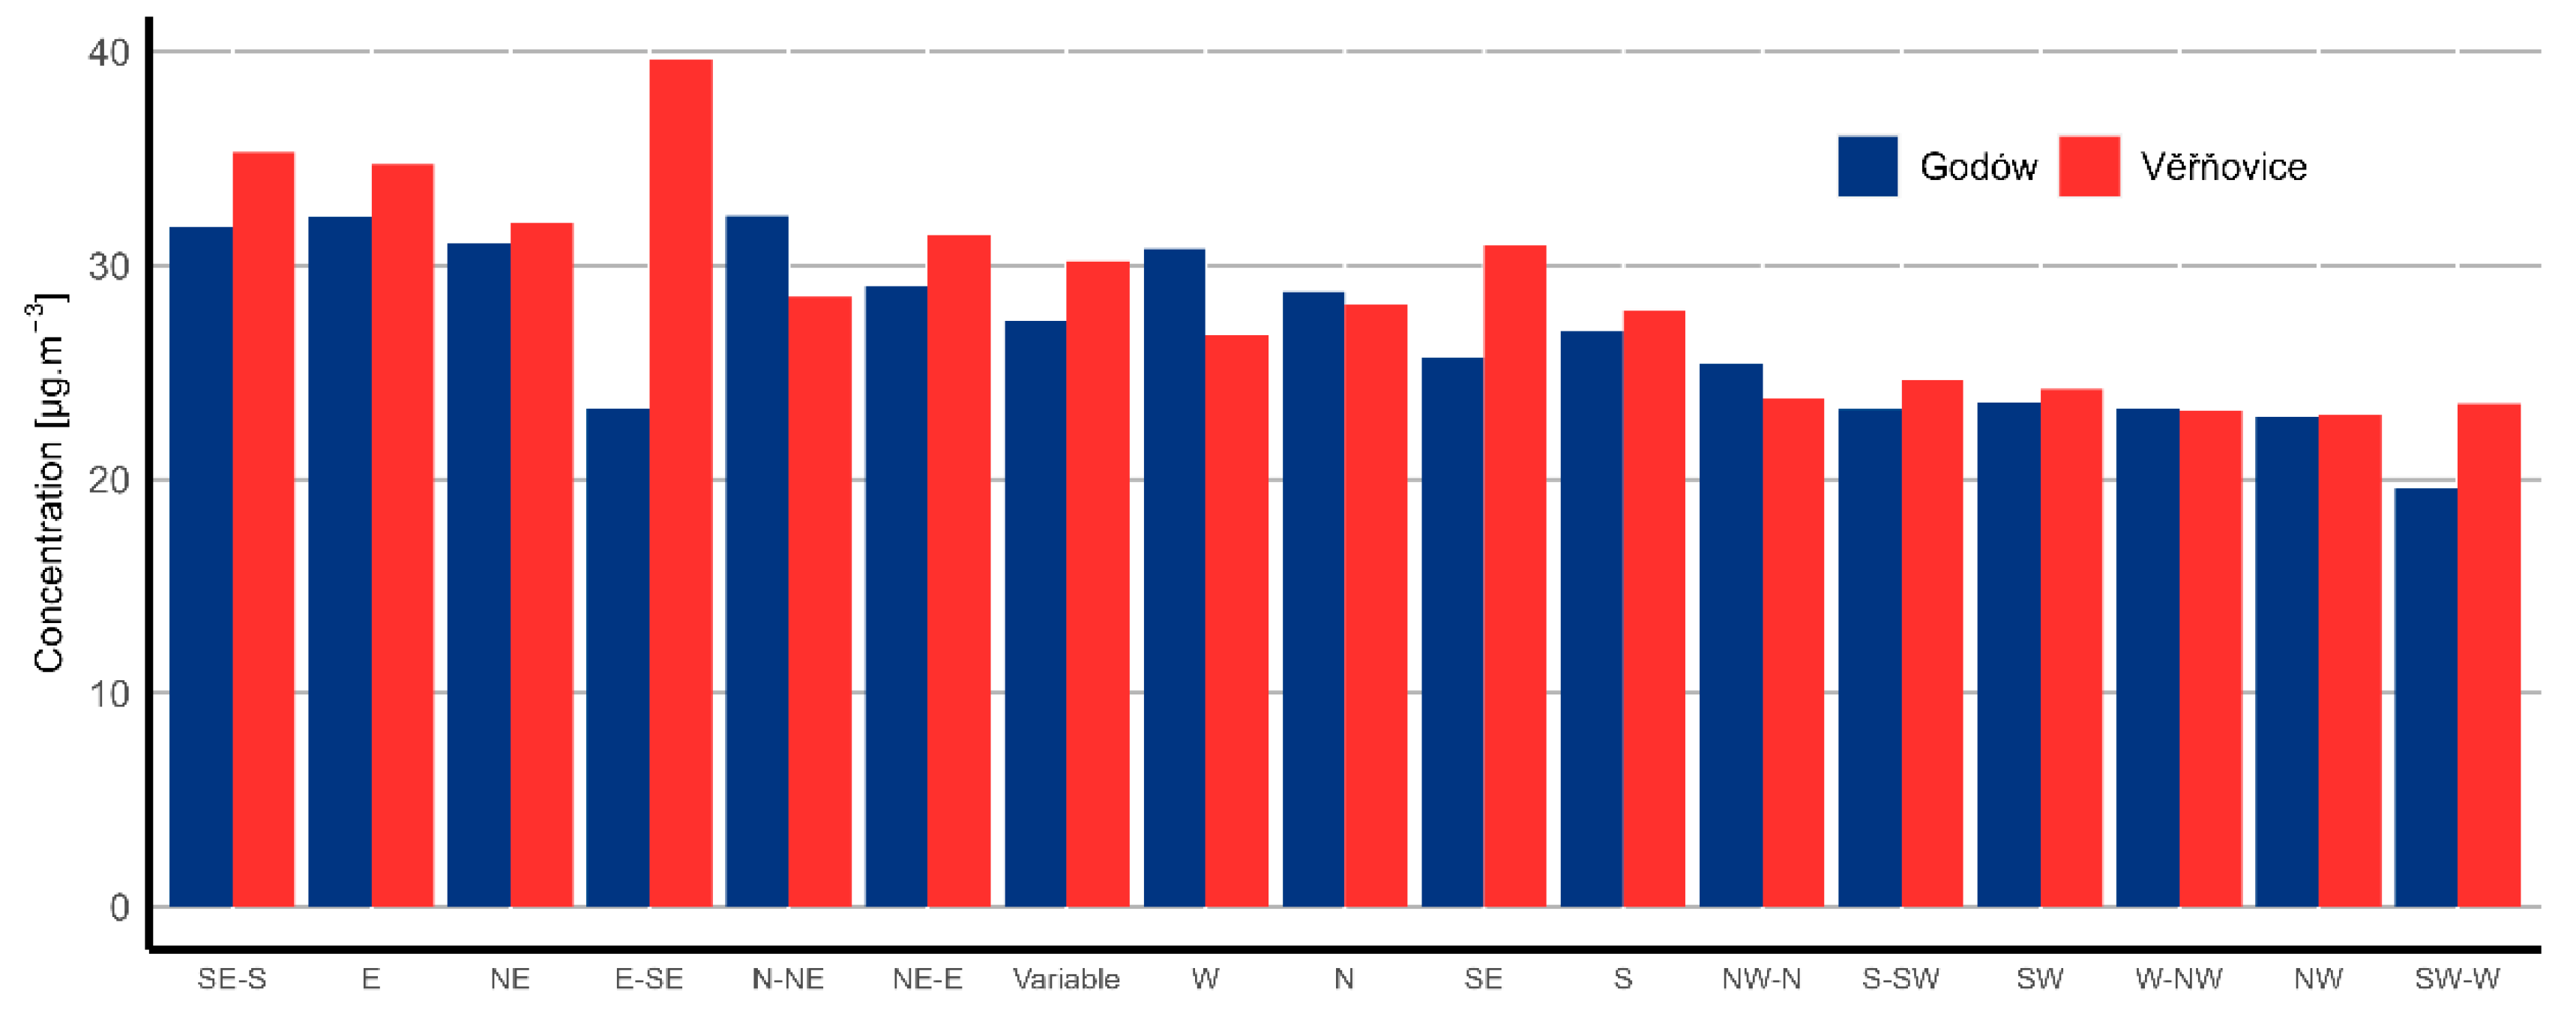
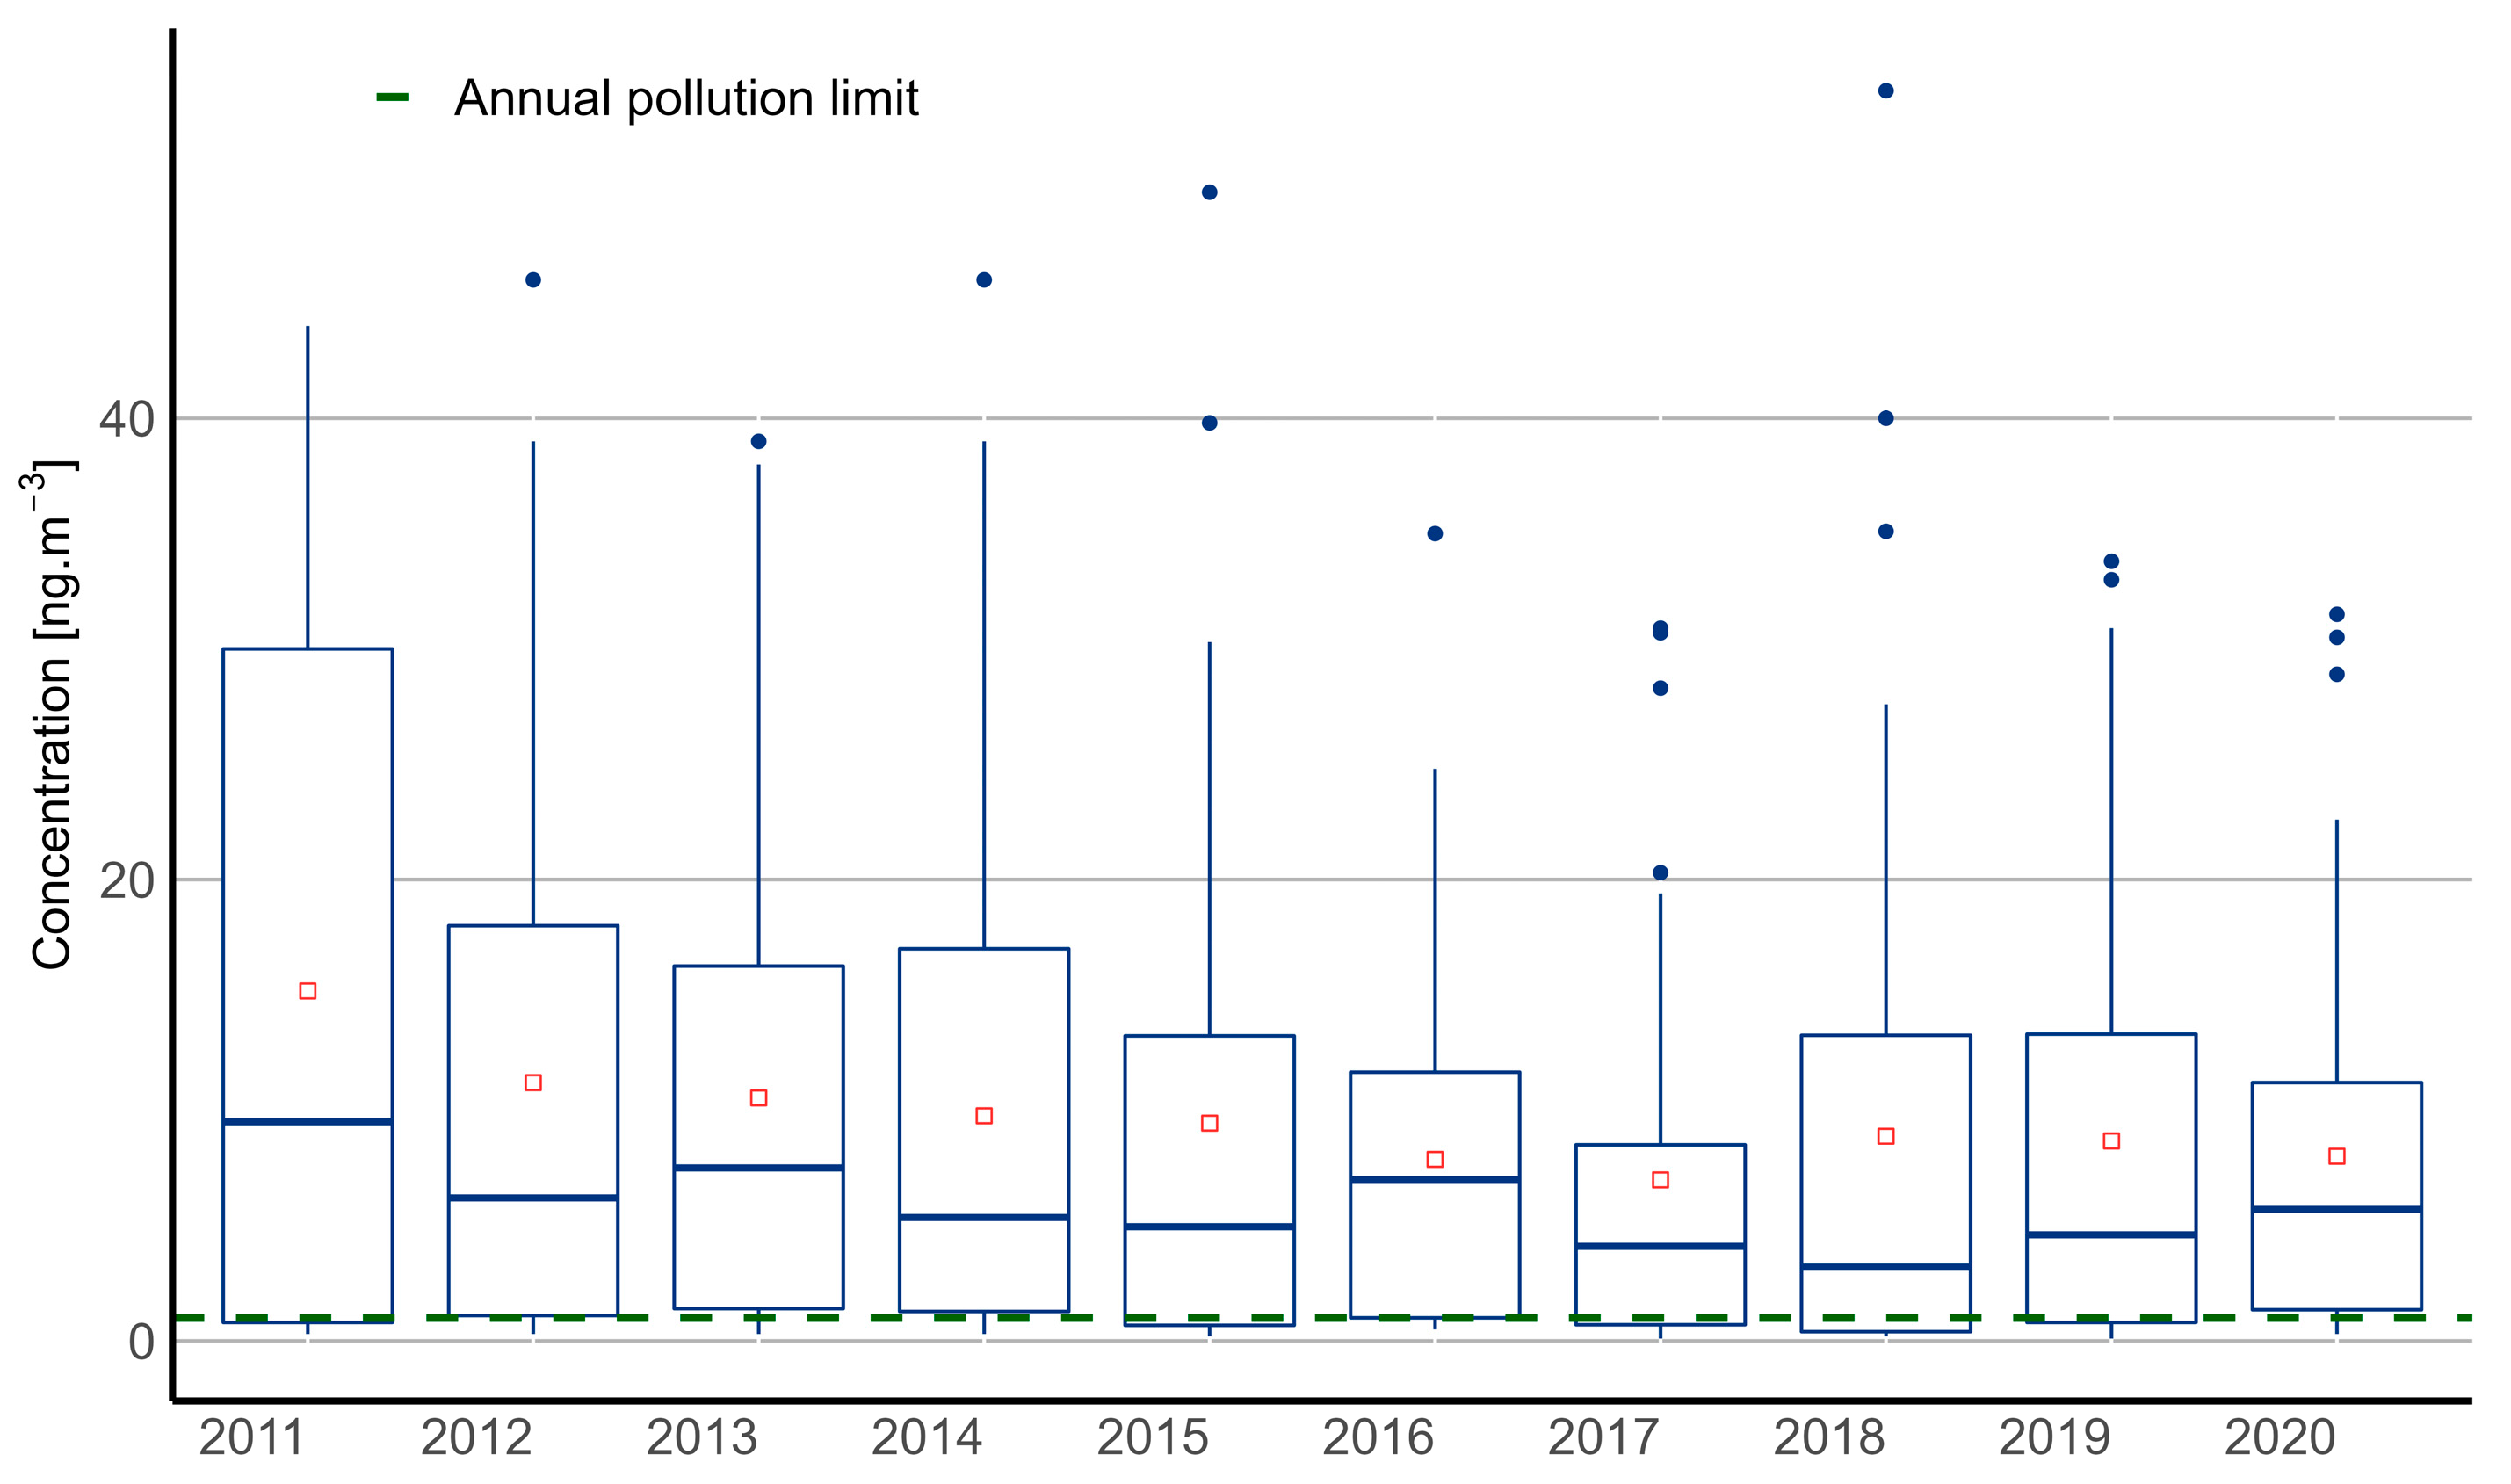
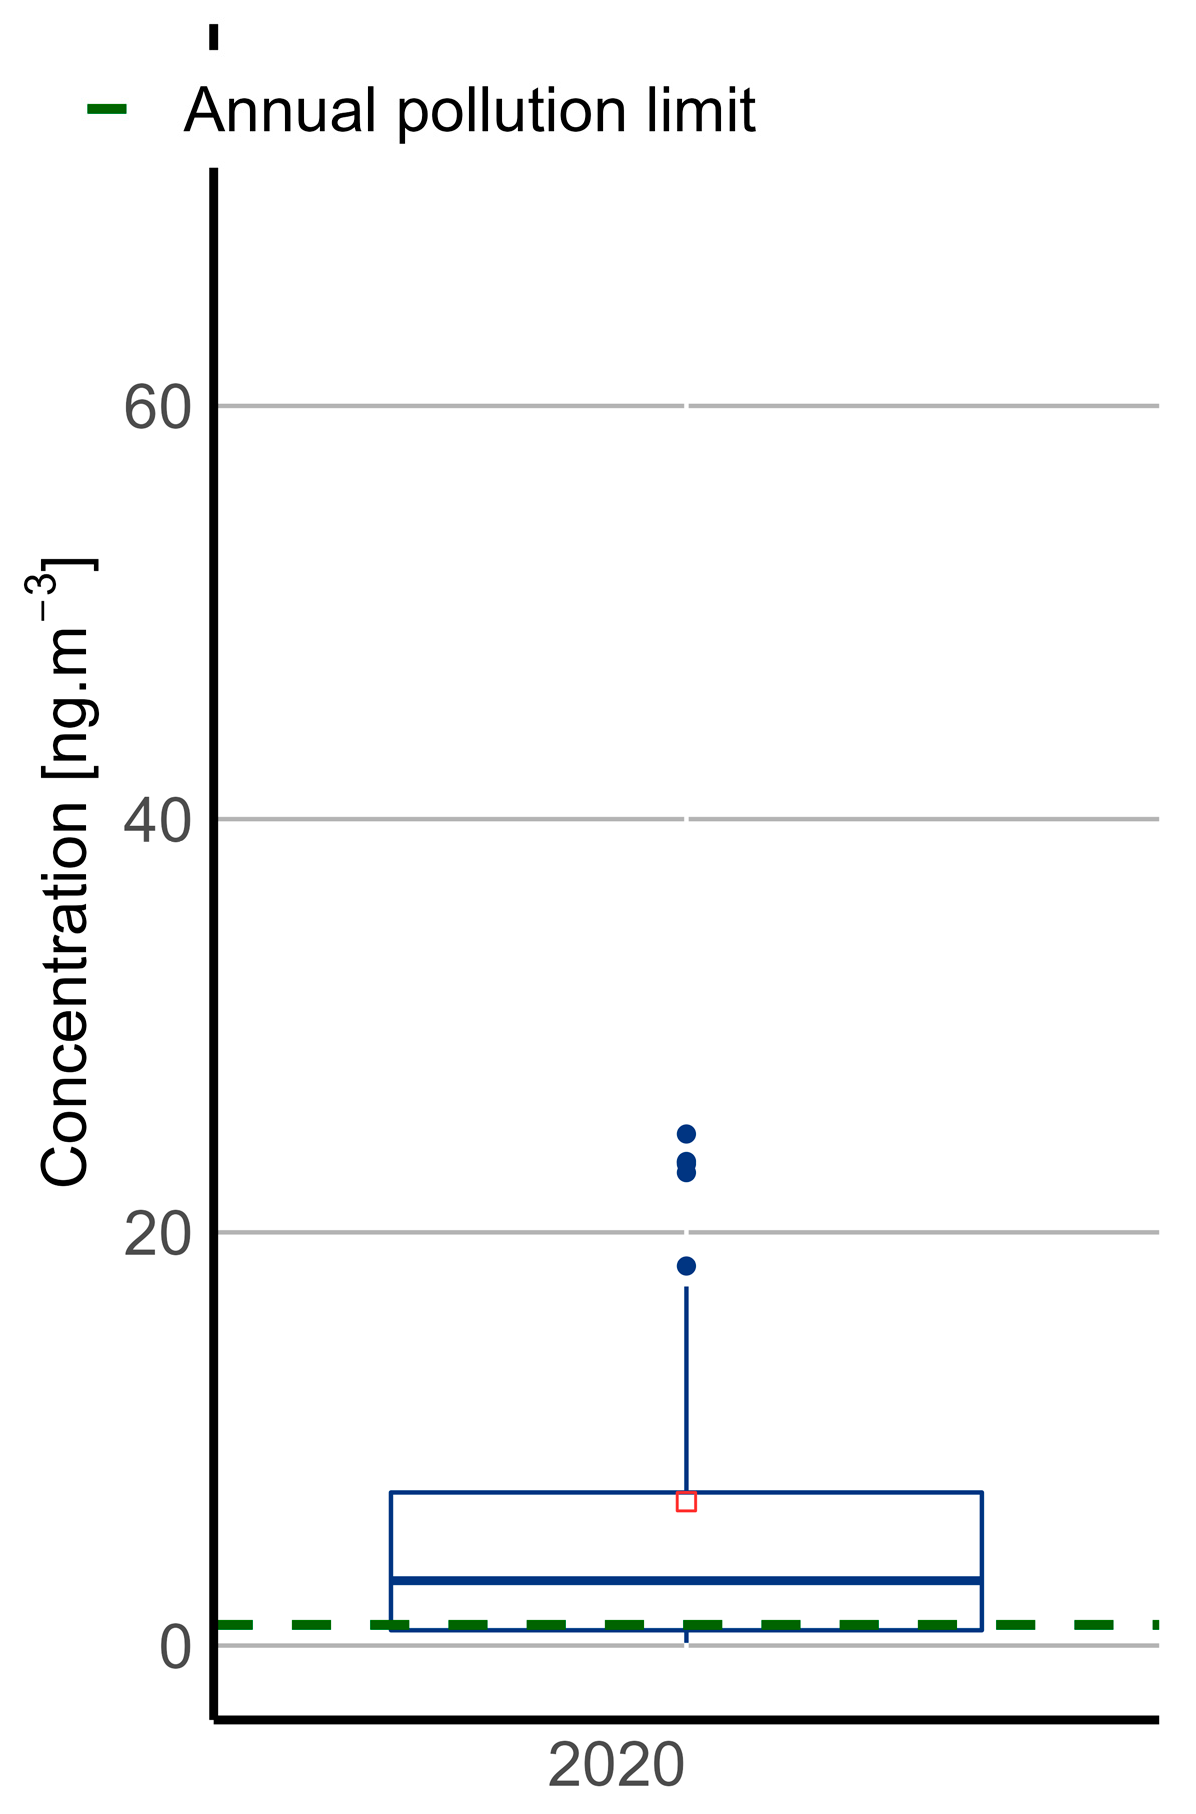
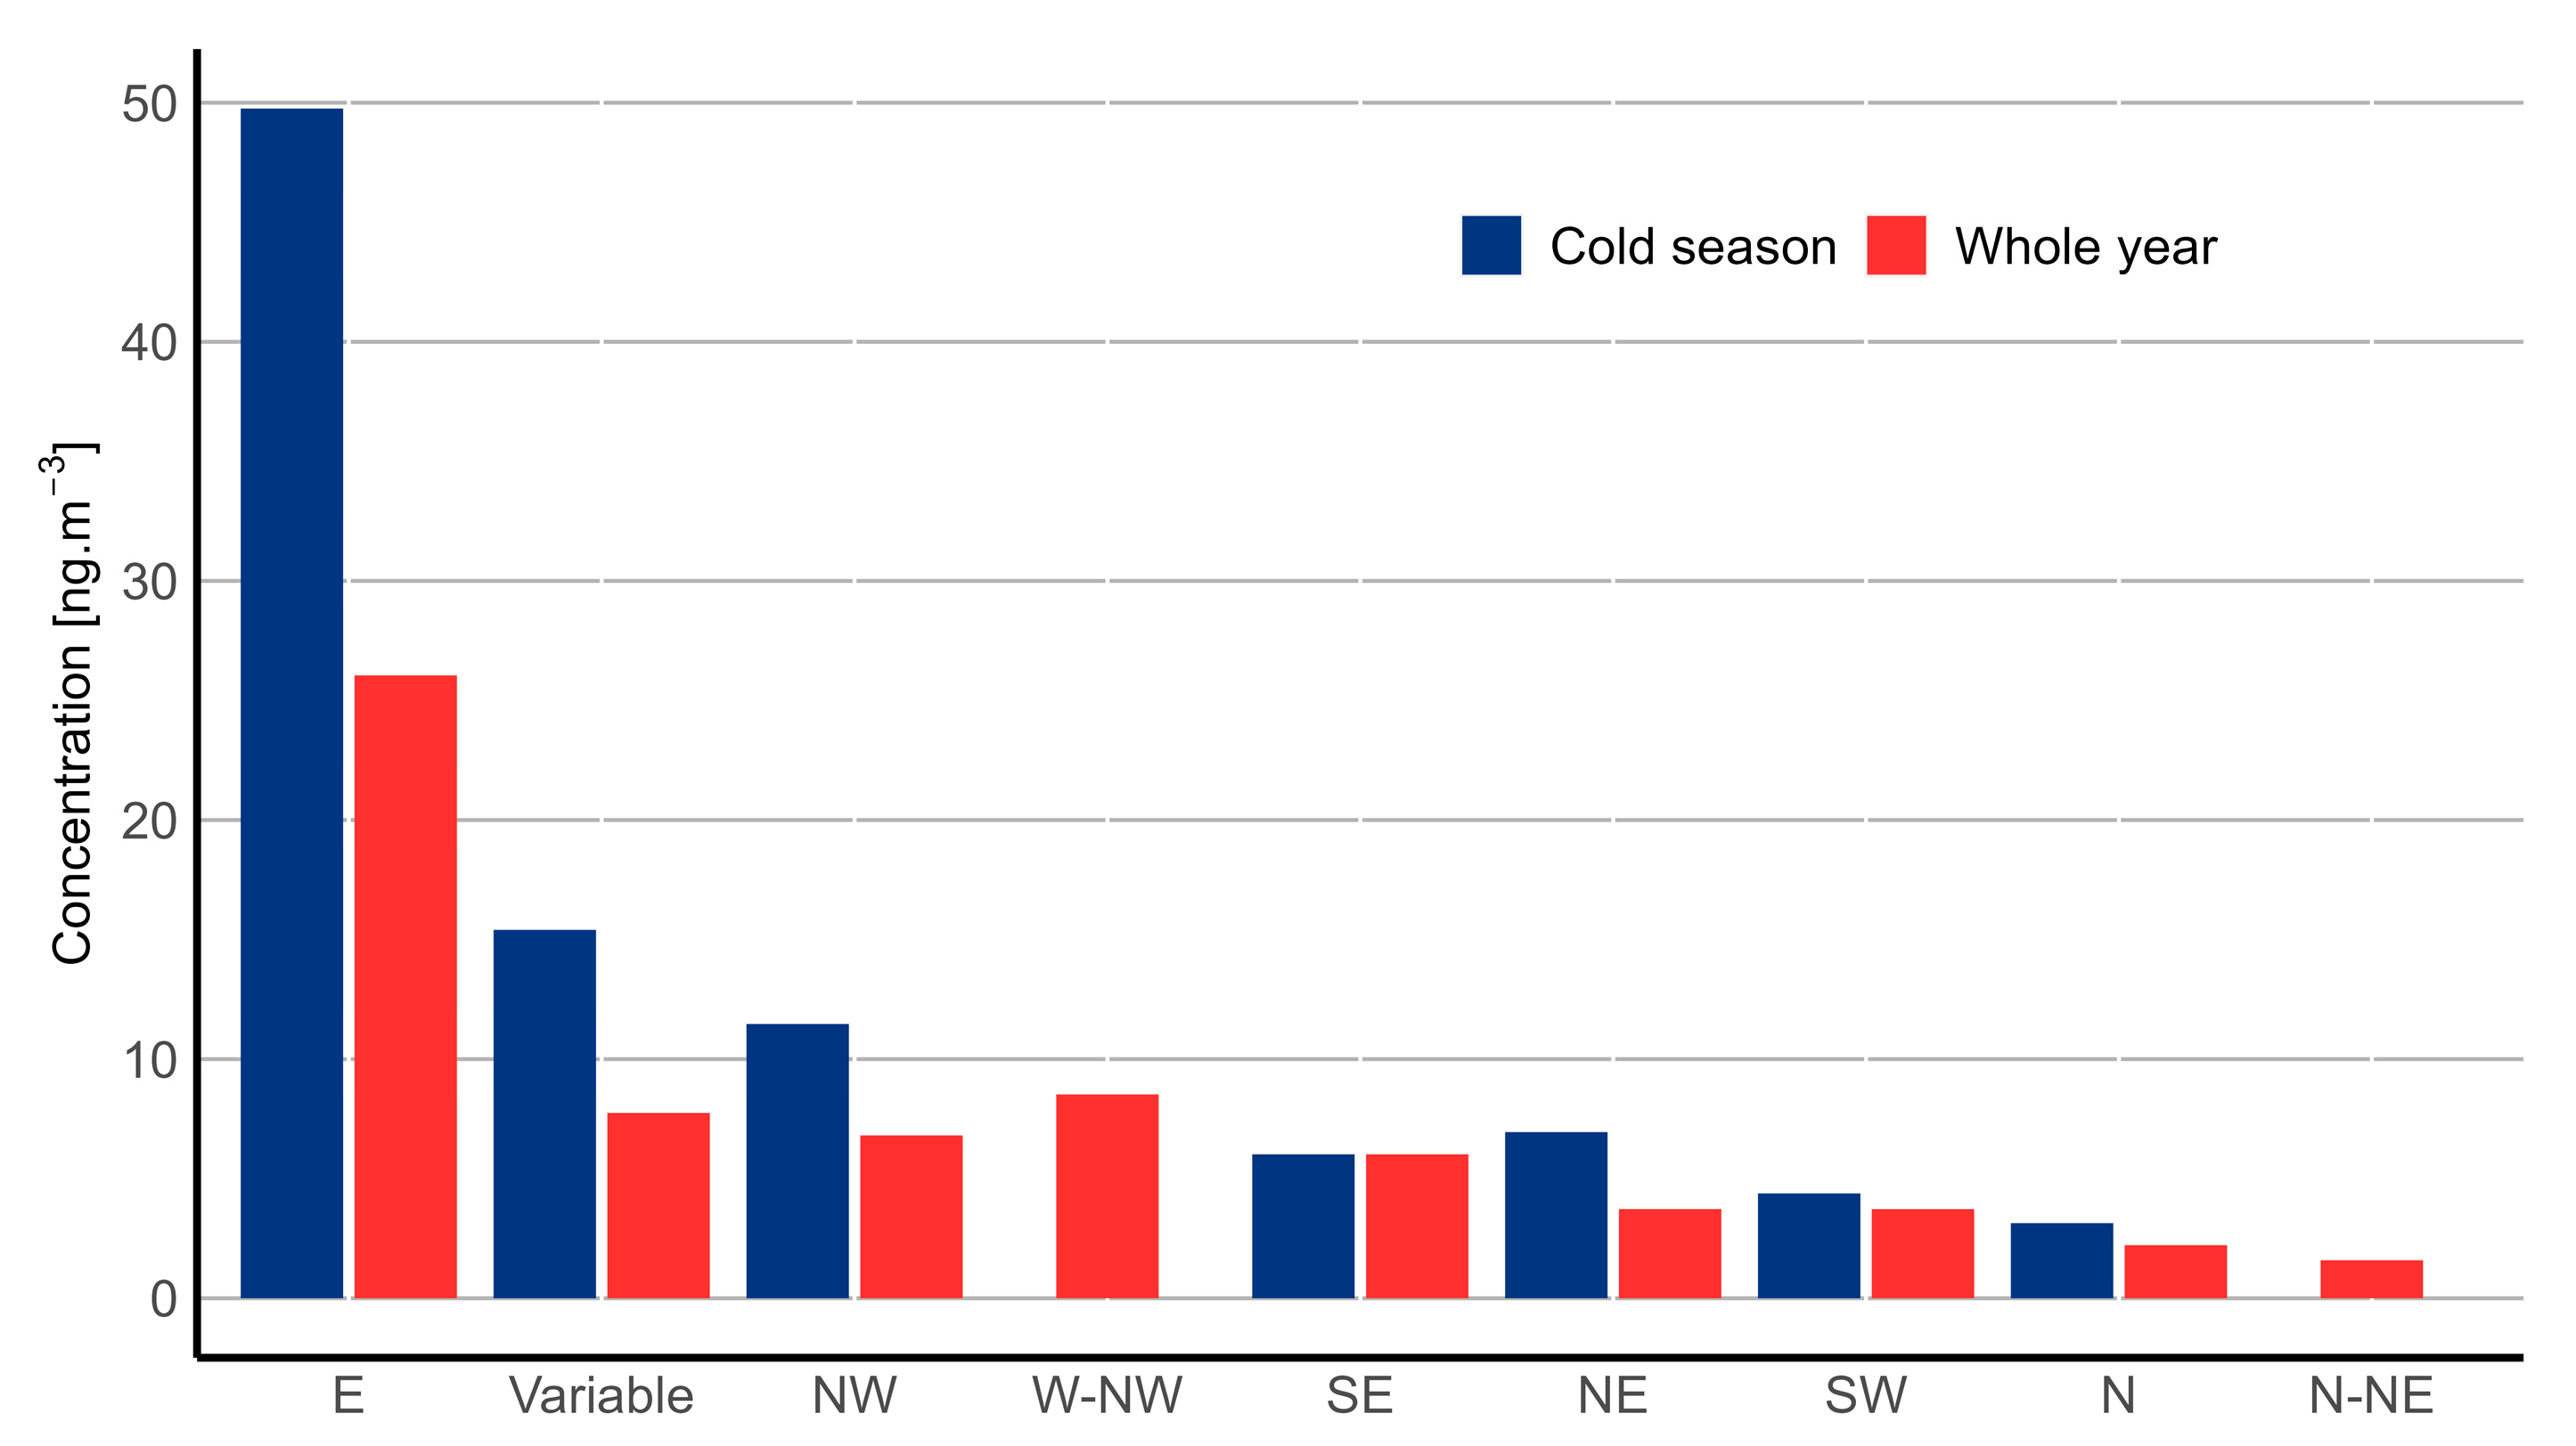
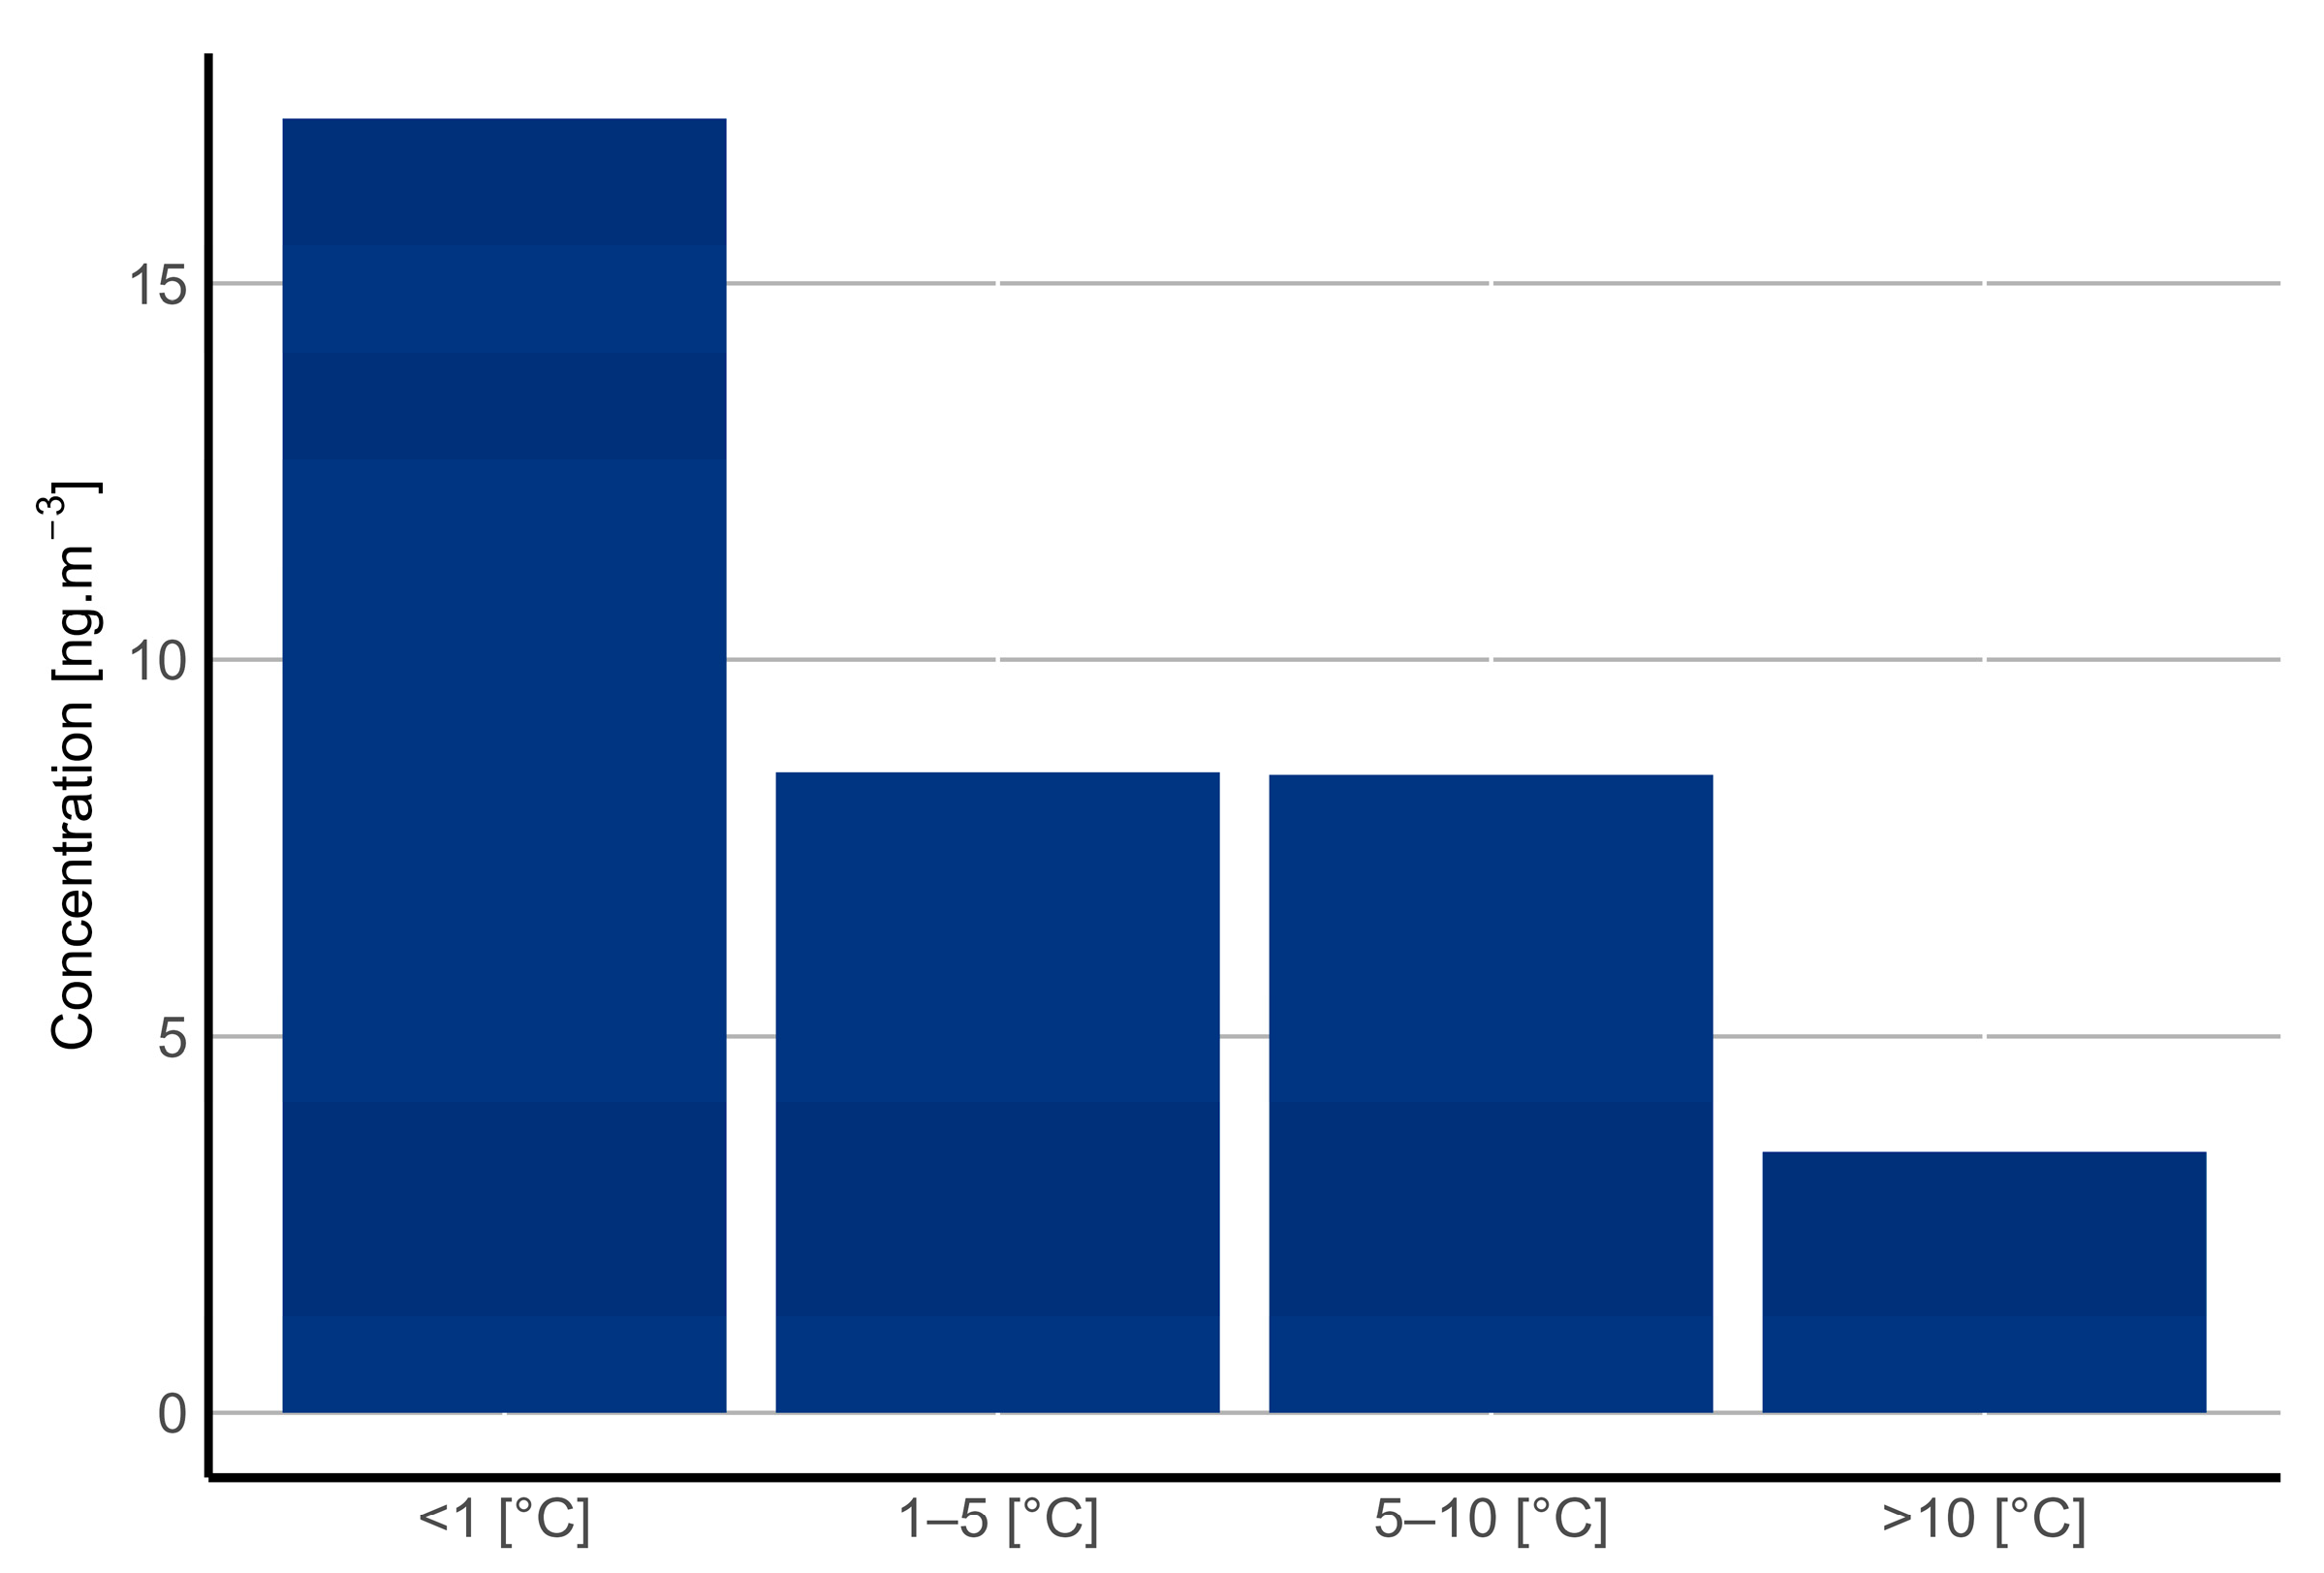
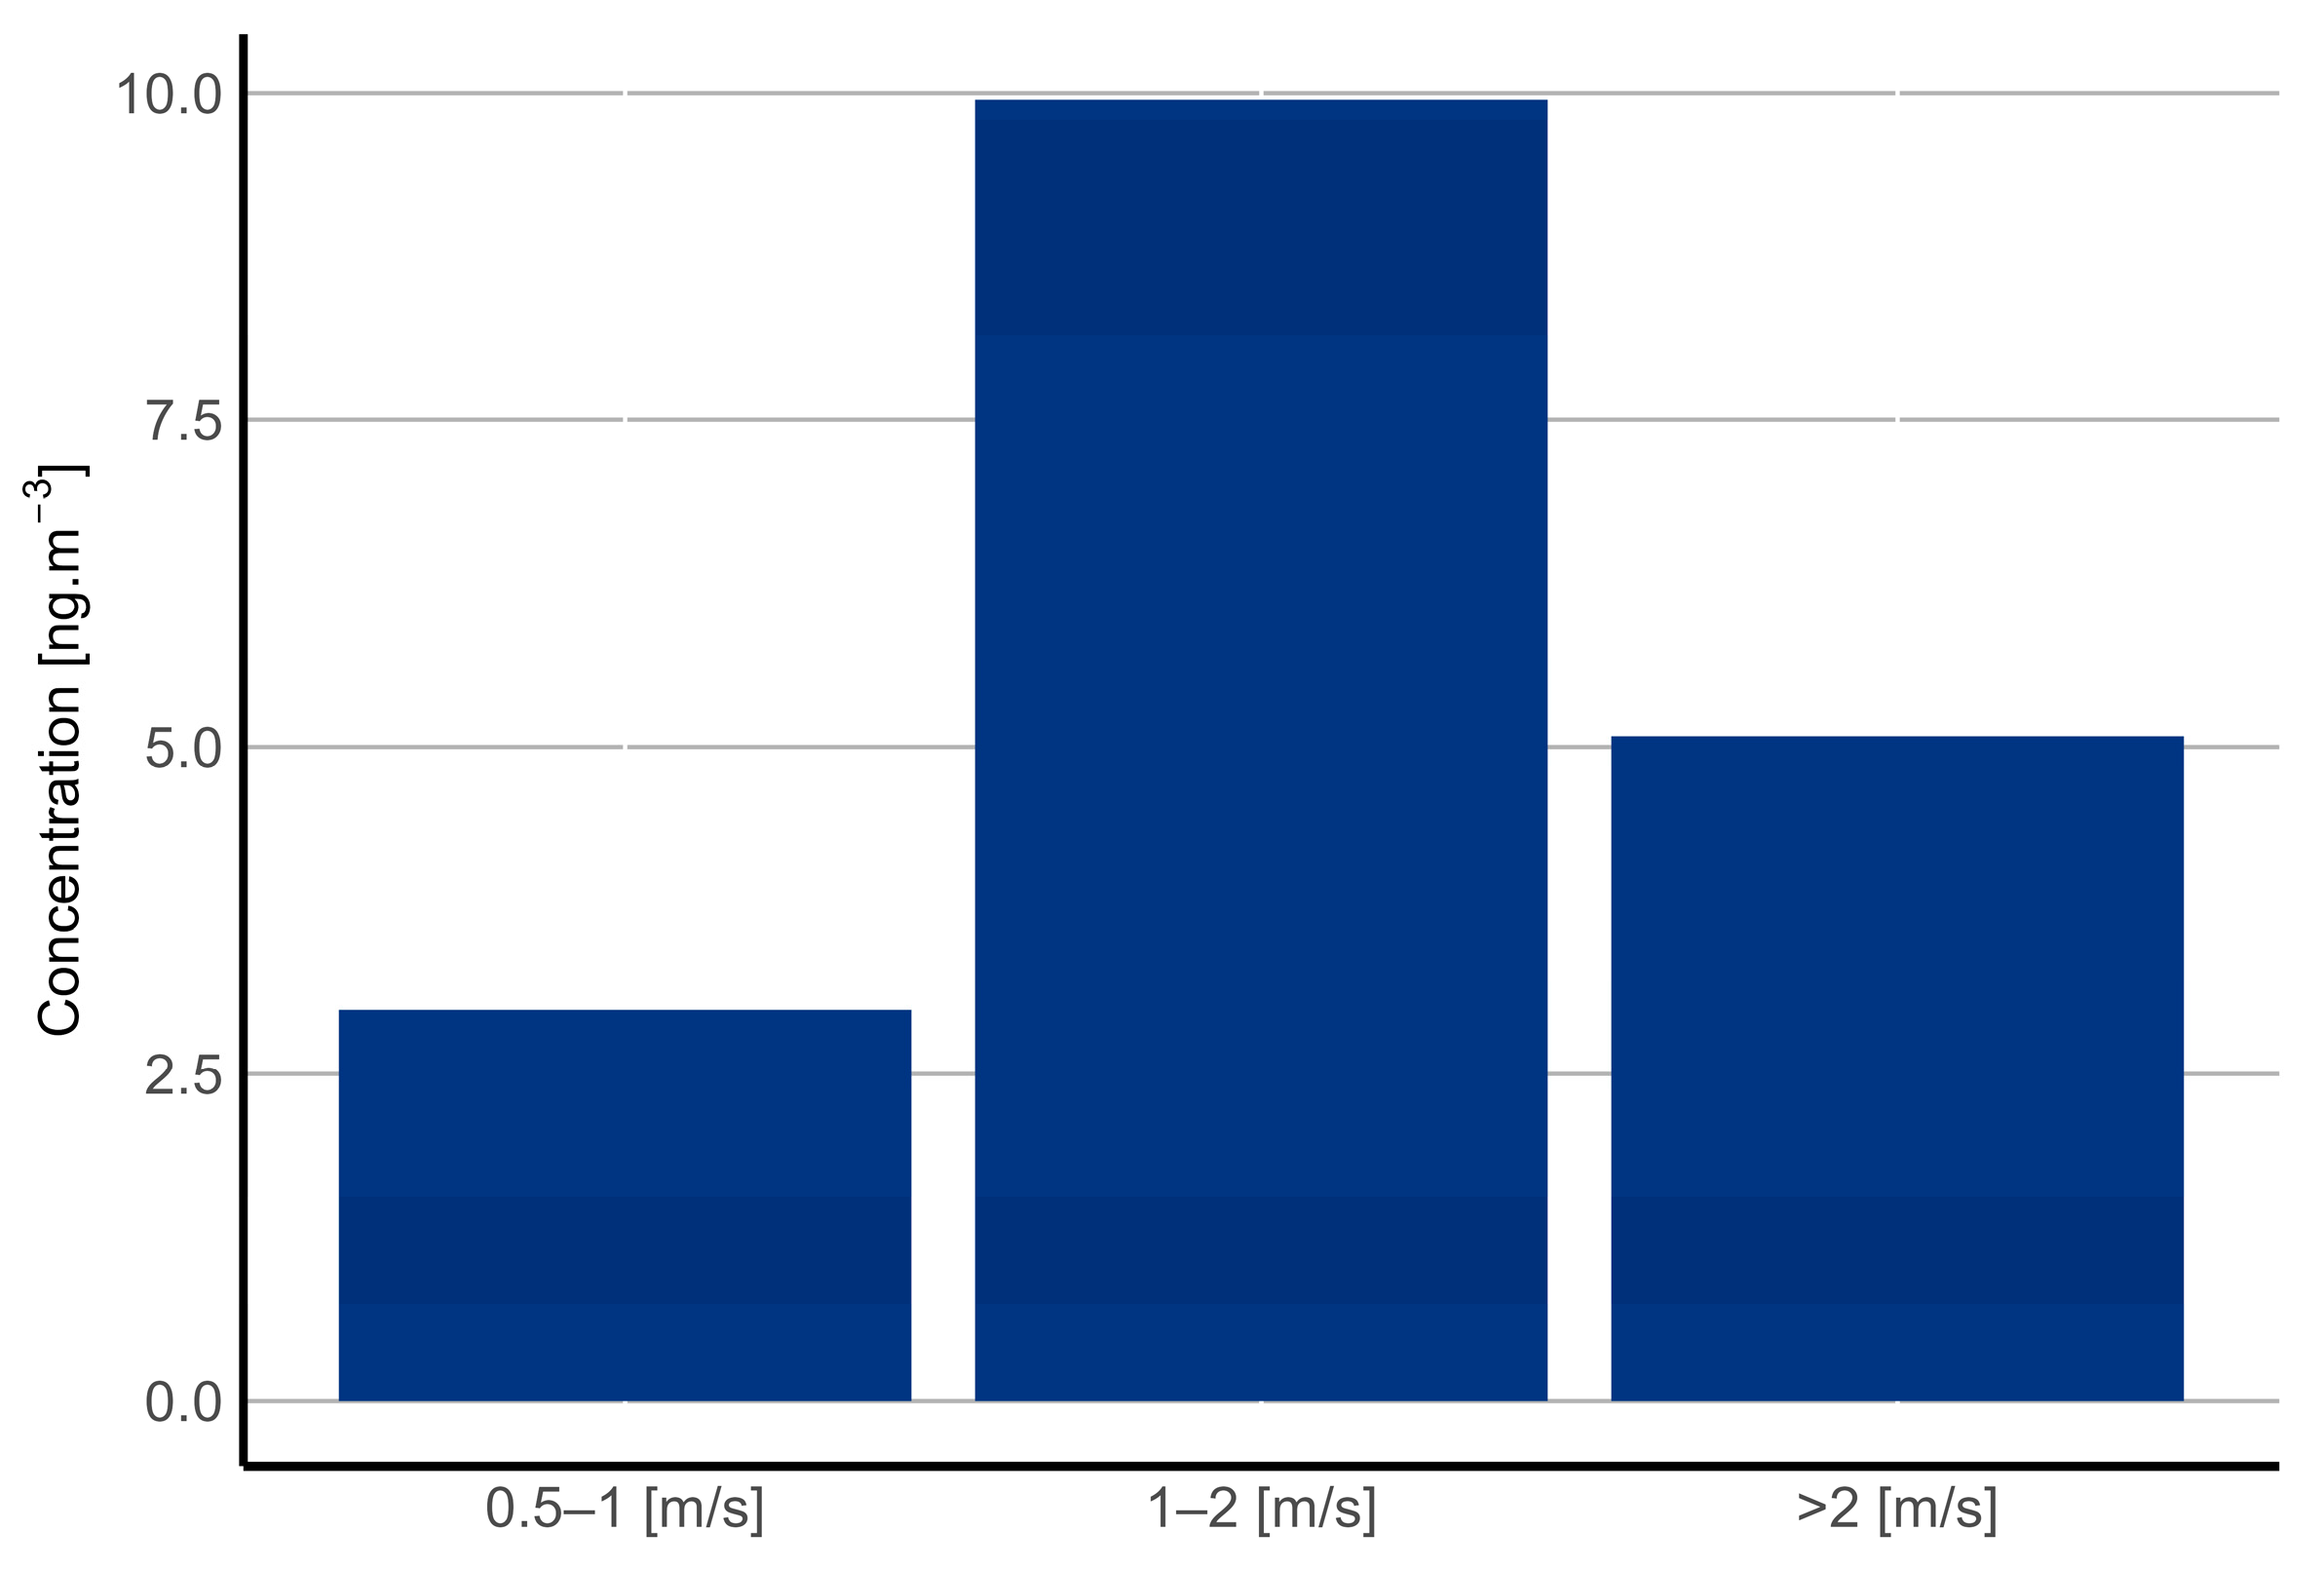
3.2. Evaluation of BaP Concentrations
4. Discussion
5. Conclusions
Author Contributions
Funding
Institutional Review Board Statement
Informed Consent Statement
Data Availability Statement
Acknowledgments
Conflicts of Interest
References
- Schwartz, J. Air Pollution and Blood Markers of Cardiovascular Risk. Environ. Health Perspect. 2001, 109, 405. [Google Scholar] [PubMed] [Green Version]
- Pope, C.A.; Dockery, D.W. Health Effects of Fine Particulate Air Pollution: Lines that Connect. J. Air Waste Manag. Assoc. 2006, 56, 709–742. [Google Scholar] [CrossRef] [PubMed]
- World Health Organization. Health Effects of Particulate Matter; Policy Implications for Countries in Eastern Europe, Caucasus and Central Asia, 2nd ed.; WHO Regional Office for Europe: Copenhagen, Denmark, 2013; ISBN 978 92 890 0001 7. [Google Scholar]
- World Health Organization. Ambient (outdoor) Air Pollution. Available online: https://www.who.int/en/news-room/fact-sheets/detail/ambient-(outdoor)-air-quality-and-health (accessed on 2 February 2020).
- Kampa, M.; Castanas, E. Human health effects of air pollution. Environ. Pollut. 2008, 151, 362–367. [Google Scholar] [CrossRef] [PubMed]
- European Environment Agency. Air Quality in Europe—2019 Report, 1st ed.; Publications Office of the European Union: Copenhagen, Denmark, 2019; ISBN 978-92-9480-088-6. [Google Scholar]
- Hůnová, I. Ambient Air Quality in the Czech Republic: Past and Present. Atmosphere 2020, 11, 214. [Google Scholar] [CrossRef] [Green Version]
- Guerreiro, C.B.; Foltescu, V.; De Leeuw, F. Air quality status and trends in Europe. Atmos. Environ. 2014, 98, 376–384. [Google Scholar] [CrossRef] [Green Version]
- European Council. Directive 2004/107/EC of the European Parliament and of the Council of 15 December 2004 Relating to Arsenic, Cadmium, Mercury, Nickel and Polycyclic Aromatic Hydrocarbons in Ambient Air; EC: Brussel, Belgium, 2005. [Google Scholar]
- European Council. Directive 2008/50/EC of the European Parliament and of the Council of 21 May 2008 on Ambient Air Quality and Cleaner Air for Europe; EC: Brussel, Belgium, 2008. [Google Scholar]
- Stull, R.B. An Introduction to Boundary Layer Meteorology; Kluwer Academic Publishers: Dordrecht, The Netherlands, 1988; 666p. [Google Scholar]
- Bednář, J. Meteorologie (Meteorology); Úvod do Studia Dějů v Zemské Atmosféře (Introduction to the Study of Events in the Earth’s Atmosphere), 1st ed.; Portál: Praha, Czech Republic, 2003; ISBN 80-7178-653-5. (In Czech) [Google Scholar]
- Tai, A.P.; Mickley, L.J.; Jacob, D.J. Correlations between fine particulate matter (PM2.5) and meteorological variables in the United States: Implications for the sensitivity of PM2.5 to climate change. Atmos. Environ. 2010, 44, 3976–3984. [Google Scholar] [CrossRef]
- Kozáková, J.; Leoni, C.; Klán, M.; Hovorka, J.; Racek, M.; Koštejn, M.; Ondráček, J.; Moravec, P.; Schwarz, J. Chemical Characterization of PM1–2.5 and its Associations with PM1, PM2.5-10 and Meteorology in Urban and Suburban Environments. Aerosol Air Qual. Res. 2018, 18, 1684–1697. [Google Scholar] [CrossRef] [Green Version]
- Leoni, C.; Pokorná, P.; Hovorka, J.; Masiol, M.; Topinka, J.; Zhao, Y.; Křůmal, K.; Cliff, S.; Mikuška, P.; Hopke, P.K. Source apportionment of aerosol particles at a European air pollution hot spot using particle number size distributions and chemical composition. Environ. Pollut. 2018, 234, 145–154. [Google Scholar] [CrossRef]
- Kozáková, J.; Pokorná, P.; Vodička, P.; Ondráčková, L.; Ondráček, J.; Křůmal, K.; Mikuška, P.; Hovorka, J.; Moravec, P.; Schwarz, J. The influence of local emissions and regional air pollution transport on a European air pollution hot spot. Environ. Sci. Pollut. Res. 2019, 26, 1675–1692. [Google Scholar] [CrossRef]
- Czernecki, B.; Półrolniczak, M.; Kolendowicz, L.; Marosz, M.; Kendzierski, S.; Pilguj, N. Influence of the atmospheric conditions on PM10 concentrations in Poznań, Poland. J. Atmos. Chem. 2017, 74, 115–139. [Google Scholar] [CrossRef] [Green Version]
- Oleniacz, R.; Bogacki, M.; Szulecka, A.; Rzeszutek, M.; Mazus, M. Assessing the impact of wind speed and mixing-layer height on air quality in Krakow (Poland) in the years 2014–2015. JCEEA 2016, 33, 315–342. [Google Scholar] [CrossRef] [Green Version]
- Reizer, M.; Juda-Rezler, K. Explaining the high PM10 concentrations observed in Polish urban areas. Air Qual. Atmos. Health 2016, 9, 517–531. [Google Scholar] [CrossRef]
- Holst, J.; Mayer, H.; Holst, T. Effect of meteorological exchange conditions on PM10 concentration. Metz 2008, 17, 273–282. [Google Scholar] [CrossRef] [Green Version]
- Rein, F. Znečištění ovzduší a mezní vrstva atmosféry z hlediska klimatologie (Air pollution and atmospheric boundary layer in terms of climatology). Meteorol. Zprávy 1971, 24, 74–79. (In Czech) [Google Scholar]
- Jaňour, Z. Modelování Mezní Vrstvy Atmosféry, 1st ed.; [učební text pro posluchače Matematicko-fyzikální fakulty UK] (Atmospheric boundary Layer Modeling; [textbook for students of Faculty of Mathematics and Physics of Charles University]); Karolinum: Praha, Czech Republic, 2001; ISBN 80-246-0330-6. (In Czech) [Google Scholar]
- Blažek, Z.; Černikovský, L.; Krajny, E.; Krejčí, B.; Ośródka, L.; Volná, V.; Wojtylak, M. Vliv Meteorologických Podmínek na Kvalitu Ovzduší v Přeshraniční Oblasti Slezska a Moravy (Influence of Meteorological Conditions on air Quality in the Cross-Border Region of Silesia and Moravia); 1st ed.; Český Hydrometeorologický Ústav: Praha, Czech Republic, 2013; ISBN 978-80-87577-15. (In Czech) [Google Scholar]
- Blažek, Z.; Černikovský, L.; Krejčí, B.; Volná, V. Air Silesia—Meteorologicko-imisní vztahy a odhad transhraničního přenosu (Air Silesia—Meteorological and air pollution relations and estimation of transboundary transmission). Ochr. Ovzduší 2014, 26, 53–61. (In Czech) [Google Scholar]
- Blažek, Z.; Černikovský, L.; Krejčí, B.; Volná, V. Transboundary Air-Pollution Transport in the Czech-Polish Border Region between the Cities of Ostrava and Katowice. Cent. Eur. J. Public Health 2016, 24, 45–50. [Google Scholar]
- Air Border. Available online: http://airborder.vsb.cz/cs/ (accessed on 10 January 2022).
- Air Tritia. Available online: https://www.interreg-central.eu/Content.Node/AIR-TRITIA.html (accessed on 10 January 2022).
- Czech Hydrometeorological Institute. Věřňovice. Available online: http://portal.chmi.cz/files/portal/docs/uoco/web_generator/locality/pollution_locality/loc_TVER_CZ.html (accessed on 12 August 2021).
- Główny Inspektor Ochrony Środowiska. Godów. Available online: http://powietrze.gios.gov.pl/pjp/current/station_details/info/810 (accessed on 12 August 2021).
- Ministry of the Environment of the Czech Republic. Sdělení Odboru Ochrany Ovzduší, Kterým se Stanoví Seznam Stanic Zahrnutých do Státní Sítě Imisního Monitoring (Communication from the Air Protection Department, Which Establishes a List of Stations Included in the National Air Pollution Monitoring Network). Available online: http://portal.chmi.cz/files/portal/docs/uoco/oez/emise/evidence/aktual/Vestnik_2016_1.pdf (accessed on 22 March 2020). (In Czech).
- Czech Hydrometeorological Institute. Air Pollution and Atmospheric Deposition in Data, the Czech Republic. 2018. Summary Tabular Survey. Available online: http://portal.chmi.cz/files/portal/docs/uoco/isko/tab_roc/2018_enh/index_CZ.html (accessed on 20 March 2020).
- Carslaw, D.C.; Ropkins, K. openair—An R package for air quality data analysis. Environ. Model. Softw. 2012, 27–28, 52–61. [Google Scholar] [CrossRef]
- Znečištění Ovzduší na Území České republiky v Roce 2015 (Air pollution in the Czech Republic in 2015), 1st ed.; Český Hydrometeorologický Ústav: Praha, Czech Republic, 2016; ISBN 978-80-87577-60-8. (In Czech)
- Czudek, T. Reliéf Moravy a Slezska v Kvartéru (Relief of Moravia and Silesia in Quaternary), 1st ed.; Sursum: Tišnov, Czech Republic, 1997; ISBN 80-85799-27-8. (In Czech) [Google Scholar]
- Weissmannová, H. Ostravsko, 1st ed.; Agentura Ochrany Přírody a Krajiny ČR: Praha, Czech Republic, 2004; ISBN 80-86064-67-0. (In Czech) [Google Scholar]
- Ministry of the Environment of the Czech Republic. Air Quality Improvement Program of Aglomeration Ostrava/Karviná/Frýdek-Místek—CZ08A; Ministry of the Environment of the Czech Republic: Praha, Czech Republic, 2016. (In Czech)
- Ministry of the Environment of the Czech Republic. Air Quality Improvement Program of Aglomeration Ostrava/Karviná/Frýdek-Místek—CZ08A; Ministry of the Environment of the Czech Republic: Praha, Czech Republic, 2020. Available online: https://www.mzp.cz/C1257458002F0DC7//cz/vestnik_mzp_2020/$FILE/SOTPR-Vestnik_zari_2020_priloha-200922.pdf (accessed on 9 January 2022). (In Czech)
- Volná, V.; Hladký, D. Detailed Assessment of the Effects of Meteorological Conditions on PM10 Concentrations in the Northeastern Part of the Czech Republic. Atmosphere 2020, 11, 497. Available online: https://www.mdpi.com/2073-4433/11/5/497 (accessed on 9 January 2022). [CrossRef]
- Volná, V.; Blažek, Z.; Krejčí, B. Assessment of Air Pollution by PM10 Suspended Particles in the Urban Agglomeration of Central Europe in the Period from 2001 to 2018. Urban Clim. 2021, 39, 100959. [Google Scholar] [CrossRef]
- Seibert, R.; Nikolova, I.; Volná, V.; Krejčí, B.; Hladký, D. Air Pollution Sources’ Contribution to PM2.5 Concentration in the Northeastern Part of the Czech Republic. Atmosphere 2020, 11, 522. [Google Scholar] [CrossRef]
- Jančík, P.; Pavlíková, I.; Bitta, J.; Hladký, D. Atlas Ostravského Ovzduší (Atlas of Ostrava Air); Vysoká Škola Báňská—Technická Univerzita Ostrava (Technical University of Ostrava): Ostrava, Czech Republic, 2013; ISBN 978-80-248-3006-3. [Google Scholar]
- Control.com. Calculating an Average Value of the Wind Direction. 2010. Available online: http://www.control.com/thread/1026210133 (accessed on 9 January 2022).
- Grange, S.K. Technical Note: Averaging wind Speeds and Directions; University of Auckland: Auckland, New Zealand, 2014. [Google Scholar] [CrossRef]
- U.S. Environmental Protection Agency. Meteorological Monitoring Guidance for Regulatory Modeling Applications. Office of Air and Radiation. Office of Air Quality Planning and Standards. EPA-454/R-99-005; 2000. Available online: http://www.epa.gov/scram001/guidance/met/mmgrma.pdf (accessed on 9 January 2022).
- Glickman, T.S. Glossary of Meteorology, 2nd ed.; The Council of the American Meteorological Society (AMS), Ed.; 2000; Available online: http://amsglossary.allenpress.com/glossary (accessed on 9 January 2022).
- Atmospheric Research & Technology, LLC. Vector vs. Scalar Averaging of Wind Data. 2013. Available online: http://www.sodar.com/VectorScalar.htm (accessed on 9 January 2022).
- WebMET.com. Meteorological Data Processing/Wind Direction and Wind Speed/Vector Computations. 2002. Available online: http://www.webmet.com/met_monitoring/622.html (accessed on 9 January 2022).
- Yoshino, A.; Takami, A.; Hara, K.; Nishita-Hara, C.; Hayashi, M.; Kaneyasu, N. Contribution of Local and Transboundary Air Pollution to the Urban Air Quality of Fukuoka, Japan. Atmosphere 2021, 12, 431. [Google Scholar] [CrossRef]
- EMEP MSC-W. Data Note 1/2016 Individual Country Reports: Transboundary Air Pollution by Main Pollutants (S, N, O3) and PM—Czech Republic. Michael Gauss, Ágnes Nyíri, Anna Benedictow, Heiko Klein. 2016. Available online: http://emep.int/mscw/mscw_publications.html (accessed on 10 January 2022).
- Ciarelli, G.; Aksoyoglu, S.; Crippa, M.; Jimenez, J.-L.; Nemitz, E.; Sellegri, K.; Äijälä, M.; Carbone, S.; Mohr, C.; O’Dowd, C.; et al. Evaluation of European air quality modelled by CAMx including the volatility basis set scheme. Atmos. Chem. Phys. 2016, 16, 10313–10332. [Google Scholar] [CrossRef] [Green Version]


| Cold Season 2011–2020 (%) | Warm Season 2011–2020 (%) | 2011–2020 (%) | |
|---|---|---|---|
| Czechia → Poland | 46 | 22 | 34 |
| Poland → Czechia | 30 | 41 | 36 |
| Variable | 22 | 35 | 29 |
| Unclassifiable | 2 | 1 | 2 |
| Cold Season 2011–2020 | Warm Season 2011–2020 | 2011–2020 | ||||||||||
|---|---|---|---|---|---|---|---|---|---|---|---|---|
| Godów (µg·m−3) | Godów (%) | Věřňov. (µg·m−3) | Věřňov. (%) | Godów (µg·m−3) | Godów (%) | Věřňov. (µg·m−3) | Věřňov. (%) | Godów (µg·m−3) | Godów (%) | Věřňov. (µg·m−3) | Věřňov. (%) | |
| Czechia → Poland | 44 | 17 | 38 | 16 | 24 | 23 | 25 | 23 | 37 | 21 | 34 | 20 |
| Poland → Czechia | 78 | 30 | 77 | 31 | 27 | 26 | 27 | 25 | 48 | 27 | 48 | 28 |
| Variable | 80 | 31 | 79 | 32 | 27 | 27 | 30 | 28 | 47 | 27 | 49 | 28 |
| Unclassifiable | 56 | 22 | 53 | 21 | 24 | 24 | 27 | 25 | 43 | 24 | 41 | 24 |
| Cold Season 2011–2020 | Warm Season 2011–2020 | 2011–2020 | ||||||||||
|---|---|---|---|---|---|---|---|---|---|---|---|---|
| Godów | Godów (%) | Věřňov. | Věřňov. (%) | Godów | Godów (%) | Věřňov. | Věřňov. (%) | Godów | Godów (%) | Věřňov. | Věřňov. (%) | |
| Czechia → Poland | 245 | 30 | 198 | 25 | 12 | 14 | 19 | 16 | 257 | 28 | 217 | 24 |
| Poland → Czechia | 334 | 41 | 330 | 42 | 40 | 45 | 43 | 36 | 374 | 41 | 373 | 41 |
| Variable | 231 | 28 | 251 | 32 | 36 | 41 | 56 | 47 | 267 | 29 | 307 | 34 |
| Unclassifiable | 12 | 1 | 10 | 1 | 0 | 0 | 2 | 2 | 12 | 1 | 12 | 1 |
| Cold Season 2011–2020 | Warm Season 2011–2020 | 2011–2020 | ||||||||||
|---|---|---|---|---|---|---|---|---|---|---|---|---|
| Godów | Godów (%) | Věřňov. | Věřňov. (%) | Godów | Godów (%) | Věřňov. | Věřňov. (%) | Godów | Godów (%) | Věřňov. | Věřňov. (%) | |
| Czechia → Poland | 58 | 20 | 42 | 16 | 0 | 0 | 0 | 0 | 58 | 19 | 42 | 15 |
| Poland → Czechia | 124 | 42 | 128 | 47 | 1 | 33 | 0 | 0 | 125 | 42 | 128 | 47 |
| Variable | 109 | 37 | 95 | 35 | 2 | 67 | 3 | 100 | 111 | 37 | 98 | 36 |
| Unclassifiable | 6 | 2 | 6 | 2 | 0 | 0 | 0 | 0 | 6 | 2 | 6 | 2 |
Publisher’s Note: MDPI stays neutral with regard to jurisdictional claims in published maps and institutional affiliations. |
© 2022 by the authors. Licensee MDPI, Basel, Switzerland. This article is an open access article distributed under the terms and conditions of the Creative Commons Attribution (CC BY) license (https://creativecommons.org/licenses/by/4.0/).
Share and Cite
Volná, V.; Hladký, D.; Seibert, R.; Krejčí, B. Transboundary Air Pollution Transport of PM10 and Benzo[a]pyrene in the Czech–Polish Border Region. Atmosphere 2022, 13, 341. https://doi.org/10.3390/atmos13020341
Volná V, Hladký D, Seibert R, Krejčí B. Transboundary Air Pollution Transport of PM10 and Benzo[a]pyrene in the Czech–Polish Border Region. Atmosphere. 2022; 13(2):341. https://doi.org/10.3390/atmos13020341
Chicago/Turabian StyleVolná, Vladimíra, Daniel Hladký, Radim Seibert, and Blanka Krejčí. 2022. "Transboundary Air Pollution Transport of PM10 and Benzo[a]pyrene in the Czech–Polish Border Region" Atmosphere 13, no. 2: 341. https://doi.org/10.3390/atmos13020341
APA StyleVolná, V., Hladký, D., Seibert, R., & Krejčí, B. (2022). Transboundary Air Pollution Transport of PM10 and Benzo[a]pyrene in the Czech–Polish Border Region. Atmosphere, 13(2), 341. https://doi.org/10.3390/atmos13020341