Article

Improvement of Airflow Distribution and Contamination Control for a Biotech Cleanroom

1
Department of Refrigeration, Air Conditioning and Energy Engineering, National Chin-Yi University of Technology, Taichung 411, Taiwan
2
Graduate Institute of Precision Manufacturing, National Chin-Yi University of Technology, Taichung 411, Taiwan
3
Yuanlin Christian Hospital, Changhua 510, Taiwan
4
Department of Energy Science and Engineering, Indian Institute of Technology Delhi, New Delhi 110016, India
*
Author to whom correspondence should be addressed.
Atmosphere 2022, 13(2), 335; https://doi.org/10.3390/atmos13020335
Submission received: 31 December 2021 / Revised: 13 February 2022 / Accepted: 15 February 2022 / Published: 17 February 2022
(This article belongs to the Special Issue Atmospheric Boundary Layer: Observation and Simulation)

Abstract

:
The biotech cleanroom industry presents a biological basis for living organisms or their components (bacteria or enzymes) to produce helpful medicine. However, biotech industries such as vaccine production need a clean critical environment and contamination control that is always a vital concern for the manufacturing process. This study investigates a biotech cleanroom through a comprehensive field measurement and numerical simulation. The field measurement test results conformed to the design specification to satisfactorily meet with the cleanroom standard of PIC/S and EU GMP. Furthermore, the field measurement data were used as a basic validation and boundary condition for numerical simulation. The numerical simulation results revealed that the concentration distribution in case 1 as a baseline case showed satisfactory results, with a removal efficiency of 75.2% and ventilation efficiency of 80%. However, there was still a high concentration accumulated in certain areas. The improvement strategy was analyzed through non-unidirectional flow ventilation with different face velocities and by adding one return air grille for case 2 and two return air grilles for case 3. The results revealed that case 2 presented the best results in this study, with a removal efficiency of 86.7% and ventilation efficiency of 82% when supplying air velocity at 0.2 m/s. In addition, increasing the supply air velocity to 0.3 m/s could enhance removal ventilation by around 19% and ventilation efficiency by around 5%.

1. Introduction

Through the development of technology industries, the need for a better cleanrooms design has increased, especially in biotech industries. The increasing demand could be related to the semiconductor industry, research laboratory, biotech, microelectronics, pharmaceutical, and nanotechnology [1]. Cleanrooms are classified according to the number and size of particles permitted per air volume in a specific amount of time. There are three levels of condition (occupancy states) for testing and characterizing the performance of cleanrooms: as-built, at-rest, and operational. The standards such as International Organization for Standardization (ISO) 14644-1 [2], Pharmaceutical Inspection Co-operation Scheme (PIC/S) [3], and European Good Manufacturing Practice (EU GMP) [4] are related to the cleanroom and associated environments. The industries require their process with a specific environment to prevent contamination because the manufacturing process or products are sensitive to indoor environmental parameters, including temperature, relative humidity, airborne particles, room pressurization, and illumination [5]. The cleanroom is designed and built to control these environmental parameters to achieve all of the requirements.
The field measurements and verification for cleanrooms must be carried out to ensure the cleanrooms are well-operated and comply with the standards and guidelines [6]. Besides, the contamination could not be minimized, but targeted monitoring should be undertaken through the data reviewed and examined for trends [7]. Testing results would be a basic validation for a cleanroom. Furthermore, computational fluid dynamics (CFD) represents an essential tool for simulation, especially in the heating, ventilation, and air conditioning (HVAC) field, e.g., in predicting airflow patterns in a cleanroom and its ability to remove airborne particles [8]. The CFD methods are cheaper and less interfering than the traditional experimental test for the full-scale ventilation performance test. It allows for investigating different cases and solutions without being as intrusive as the original case [9].
Some CFD studies of indoor ventilation systems have already been carried out. Memarzadeh et al. [10] have used CFD to represent that unidirectional flow conditions are the best option for a cleanroom by controlling the risk of contamination. Swift et al. [11] have discussed the impact of different air distribution on infection control and the effect of lighting and equipment on laminar airflow systems. Srebric et al. [12] have demonstrated that the accuracy of CFD simulation depends on the considered obstacles in the room, e.g., occupants, equipment, the appropriate boundary condition settings, and numerical simulation parameters such as contaminant source. In addition, many researchers also conducted studies by changing the velocity of supply air to control contamination in the cleanroom. The relatively low velocity in the cleanroom room will affect the concentration of the microbe-carrying particles (MCP) and the velocity of deposition in the room [13]. This indicates that there may be a risk of microbiological contamination from surfaces exposed to areas that have low speeds. It was also shown that higher supply velocity (≥0.38 m/s) caused flow disturbance [14]. Another study by Liu et al. [15] conducted four different air supply velocities (0.16, 0.24, 0.29, and 0.33 m/s). Greater cleanliness in the cleanroom area can be ensured by an air supply velocity greater than 0.24 m/s. Whereas, when the air supply velocity continues to increase (0.33 m/s), it will increase the bioaerosols deposition in the cleanroom area.
Two typical general ventilation modes, the natural supply air + mechanical exhaust (NM) system and the mechanical supply air combined with natural supply air + mechanical exhaust (NMM) system were numerically investigated. The results revealed that NMM presented a higher removal and ventilation efficiency. As the ACH (air change per hour) increased from 10 ACH to 20 ACH, there was a corresponding increase in the removal efficiency [16]. Air ventilation rate plays an essential role in maintaining the indoor air quality conditions in the space [17]. A higher airflow rate ventilation system can control the indoor contaminants in the cleanroom facilities. Khoo et al. [18] conducted four different air change rates experimentally. The results revealed that a higher air change rate results in a lower particle in the cleanroom. The air change rate influences the particle concentration, but the equipment layout or position could affect the particle deposition [19]. In addition, a higher air change rate could also shorten the duration of concentration decay to dilute and reach the desired level of concentration [20]. Besides the airflow ventilation rate, pressurization could also help separate and isolate the contaminated air from the doorway opening or infiltration [21]. Maintaining the pressure differential at 10 Pa or higher can reduce the particle migration from less clean areas to clean areas [22].
The indoor ventilation efficiency could be assessed using the tracer gas method to achieve a good environmental condition. Particle experiments and tracer gas experiments are widely used. However, most researchers simplify the pathogen as particles or gaseous without considering their biological characteristics [23]. Chung [24] used CO2 as a pollutant to assess indoor ventilation efficiency. In addition, Chen [25] used SF6 to obtain the gas concentration field where a particular concentration for 5 or 10 min, respectively, was released as a simulated leaking source. The efficiency comparison of mixing ventilation (MV) and impinging jet ventilation (IJV) was conducted by Wang et al. [26]. The results revealed that the removal efficiency of IJV for fine particles could reach double than MV. The contaminant removal effectiveness as an index enable to assess the efficiency of pollutant removal depending on the location of pollutant source and layout of the cleanroom system; it could also highlight some malfunctions ventilation system [27].
Even though many studies have been conducted on field measurements and CFD simulations, there is still limited knowledge on cleanrooms, especially on cleanroom vaccine production. This study investigated the indoor environment parameter for a biotech cleanroom through a comprehensive field measurement test to verify with the standard and to analyze the cleanroom system’s effectiveness. The CFD simulation was also conducted to analyze the existing design in order to find some improvement strategies. The improvement is expected to allow cleanrooms to ensure product reliability and meet the required standards.

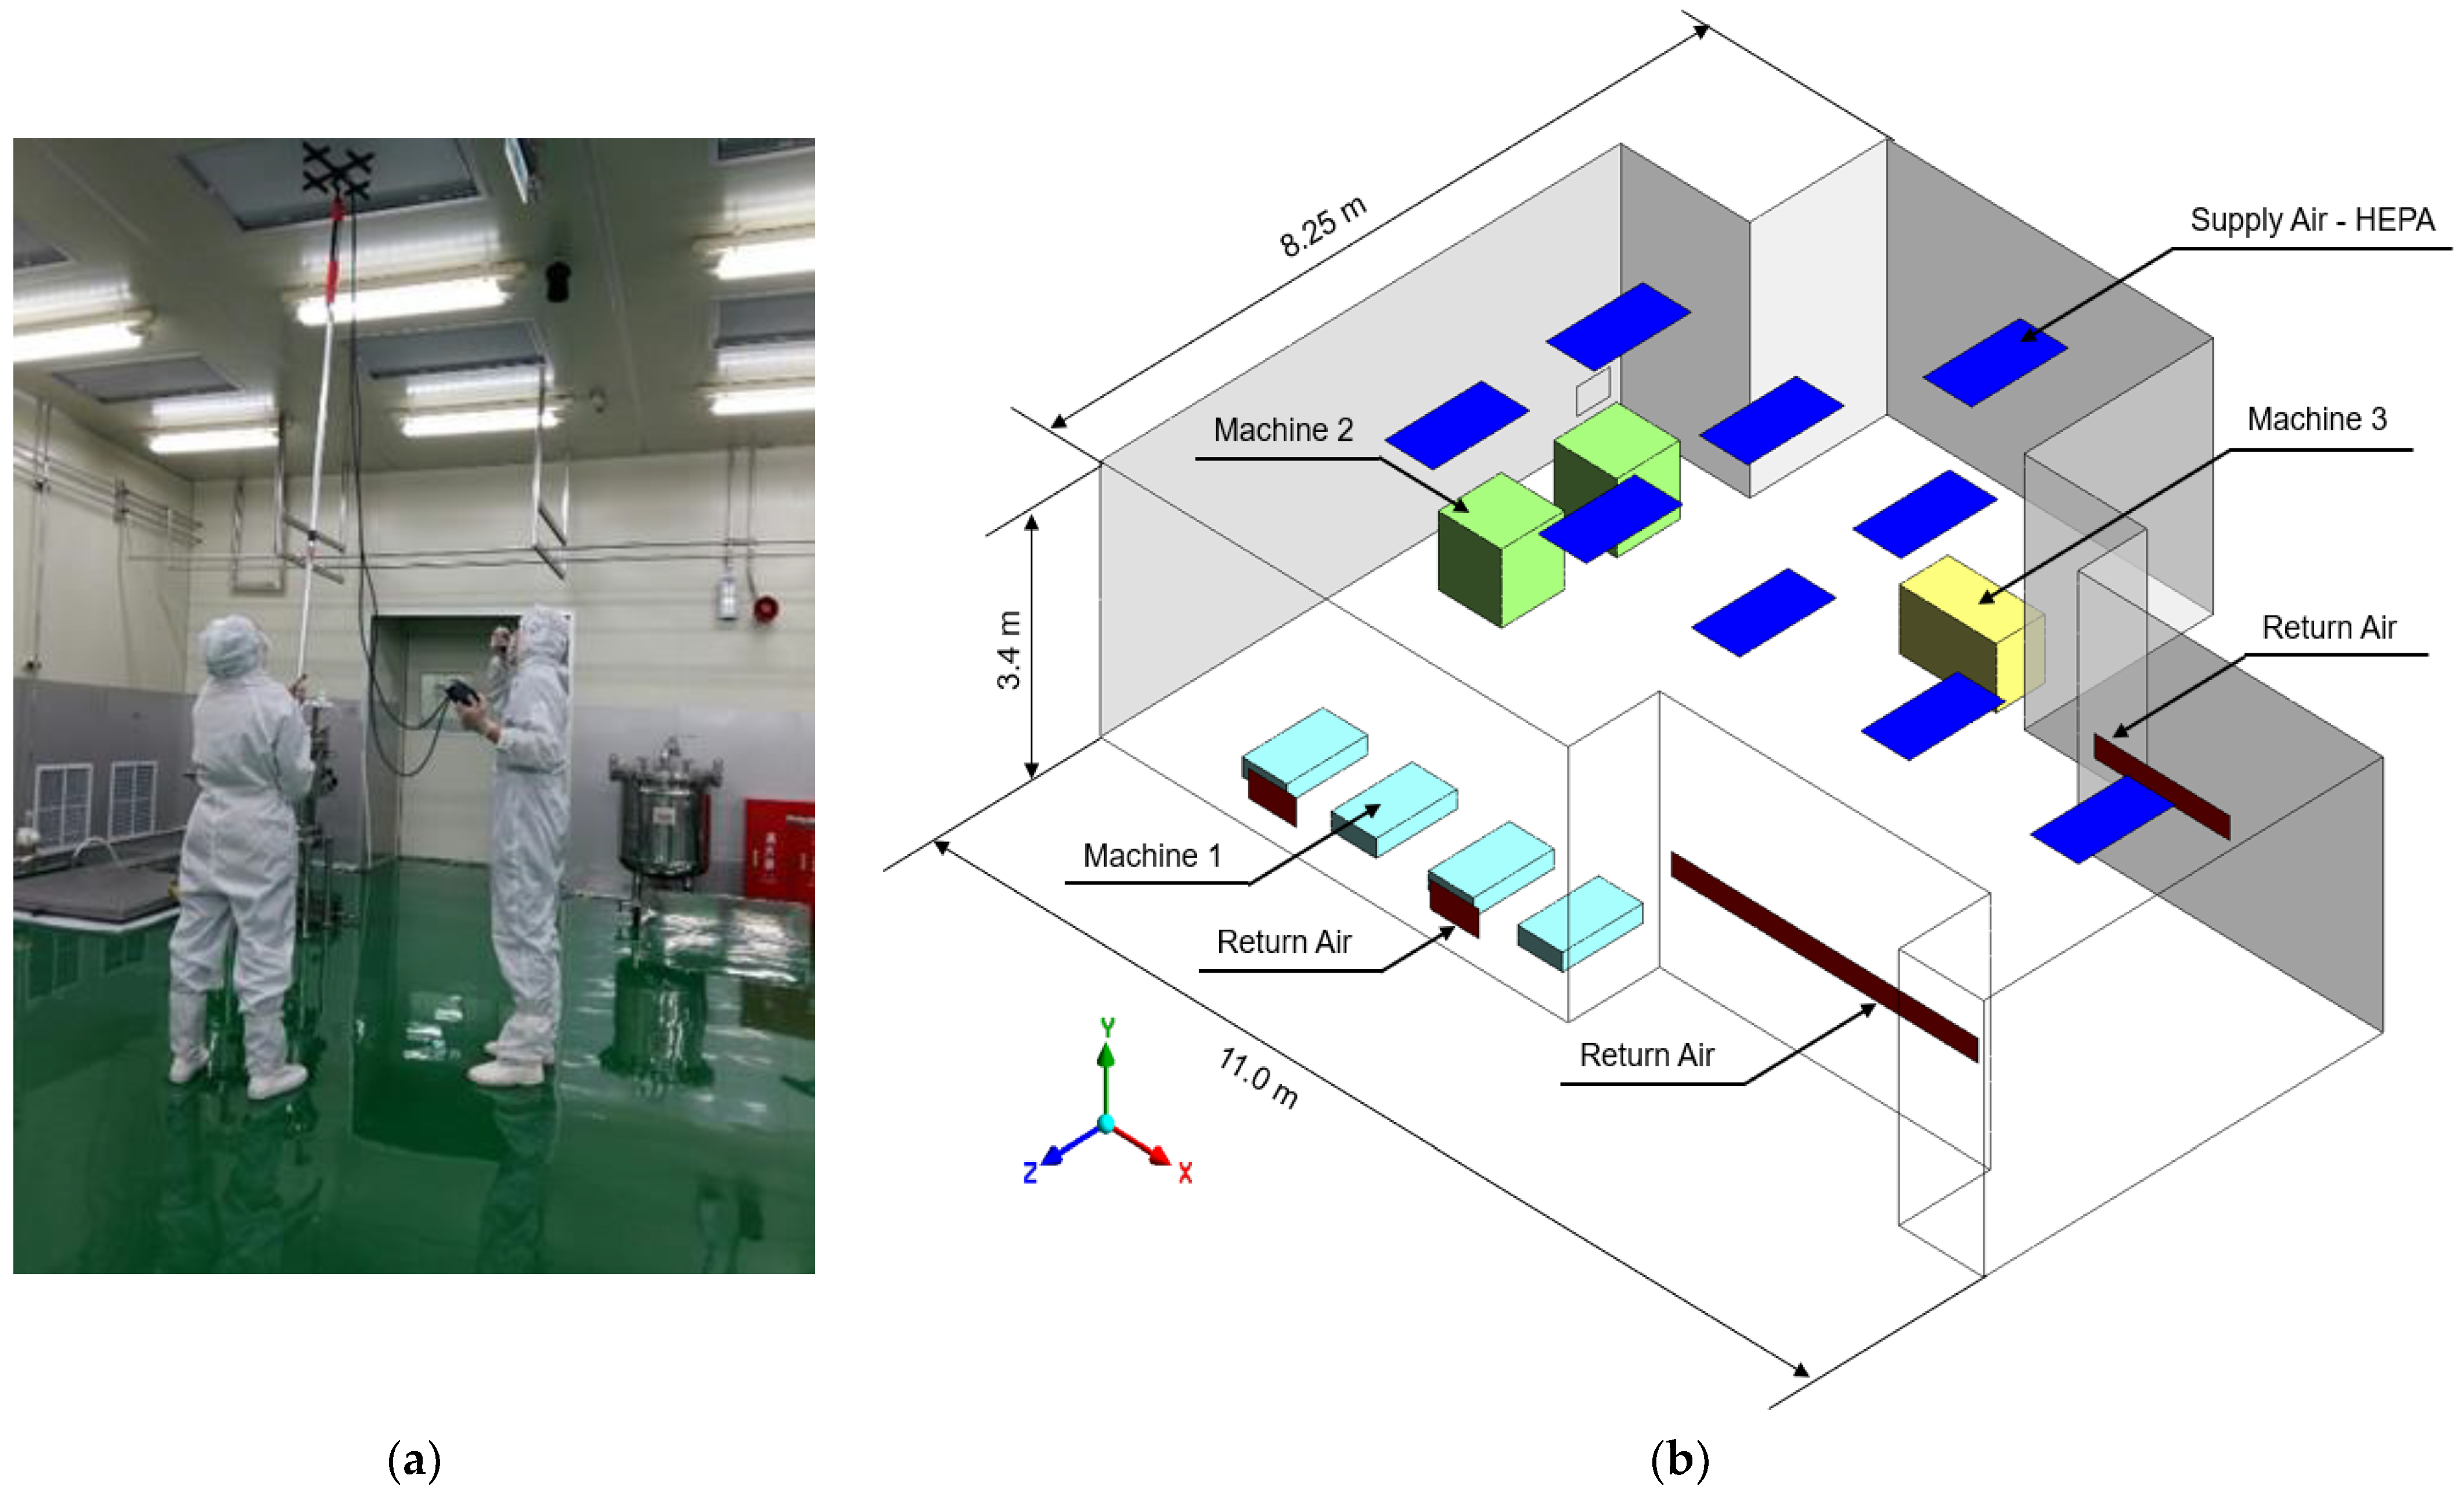
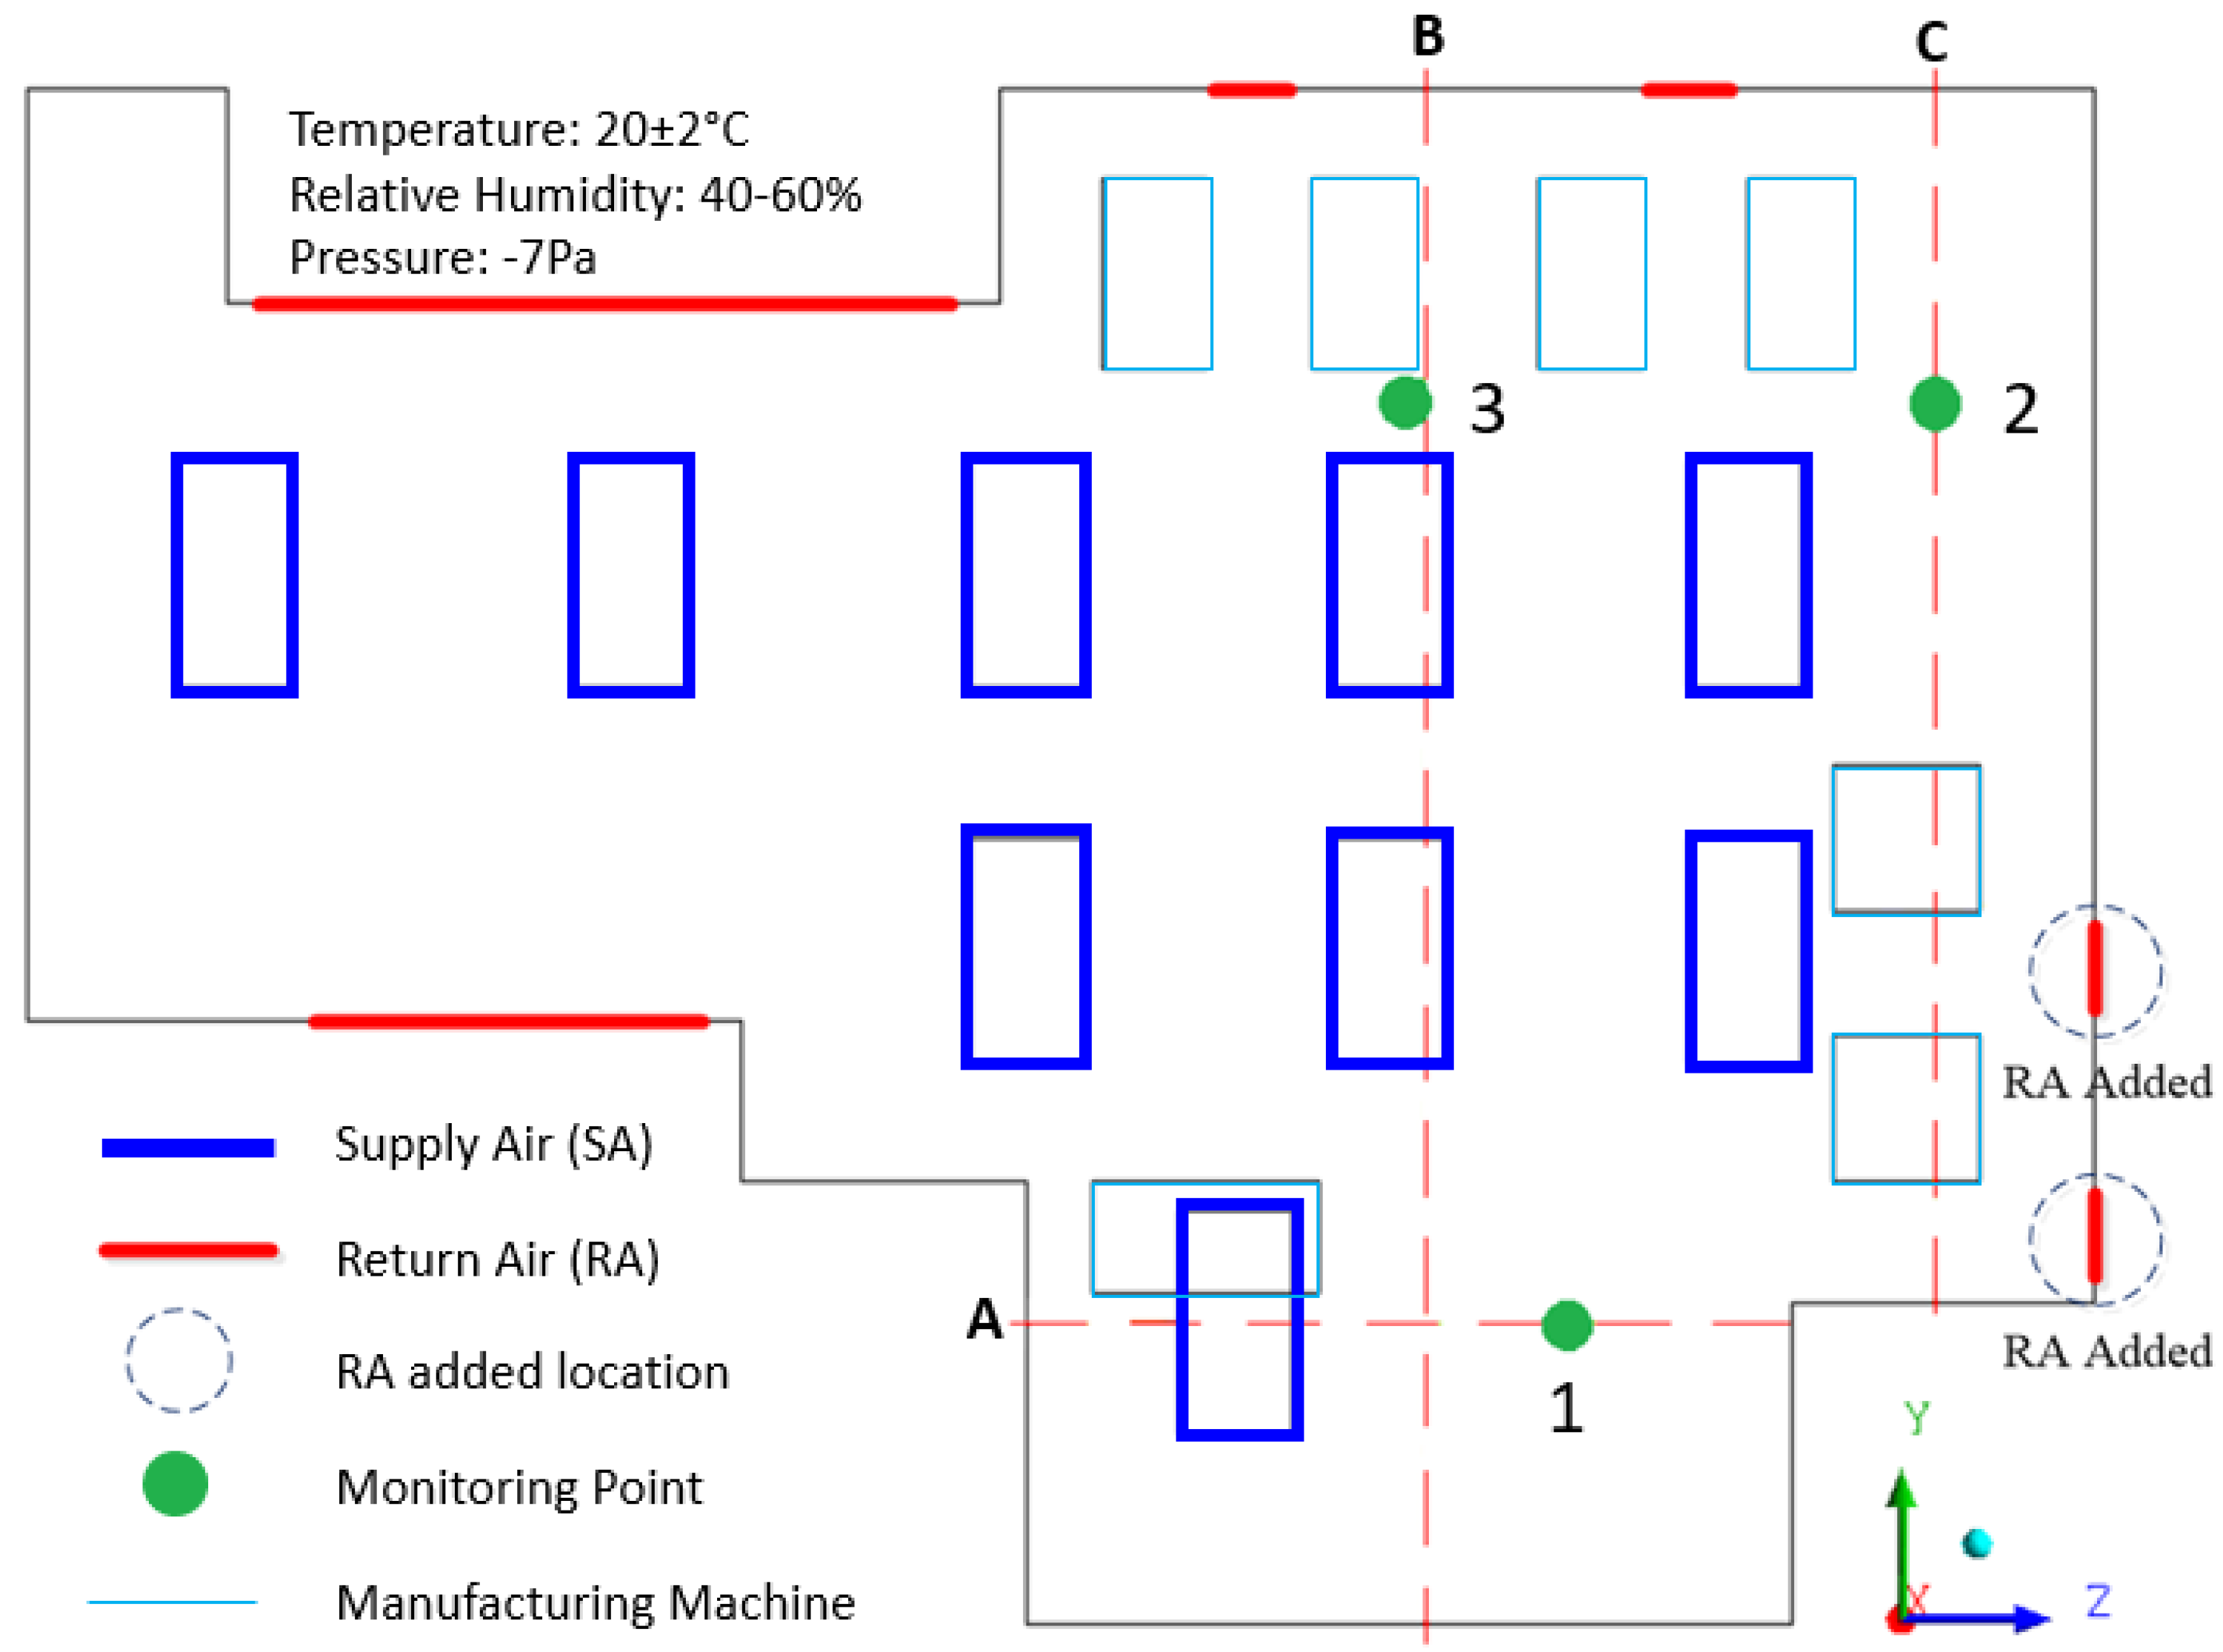
2. System Description

The investigated biotech cleanroom is displayed in Figure 1. The HVAC system for this cleanroom used central air conditioning. Supply air was distributed from the air handling unit (AHU) through ducts and high-efficiency particulate air (HEPA) filters above the cleanroom. A regulating damper was set on each room for adjusting the airflow rate. The field measurement test was conducted for all of the main room processes. The dimension of the investigated cleanroom was 11.0 m long, 8.25 m wide, and 3.4 m high; the total area of this room was 90.75 m2. The cleanroom is equipped with 9 units of HEPA filters (1.2 m × 0.6 m) with a filtration efficiency over 99.97% above 0.5 µm. Based on PIC/S and EU GMP by WHO guidelines [28], this cleanroom showed a cleanliness level of Grade C, with a maximum limit of particulates less than 352,000 at 0.5 µm/m3 for at-rest condition and less than 3,520,000 µm/m3 for operational condition.

3. Methods

The proposed methodology of this research is illustrated in Figure 2. It generally consisted of three steps: field measurement test, CFD simulation, and performance improvement strategy.

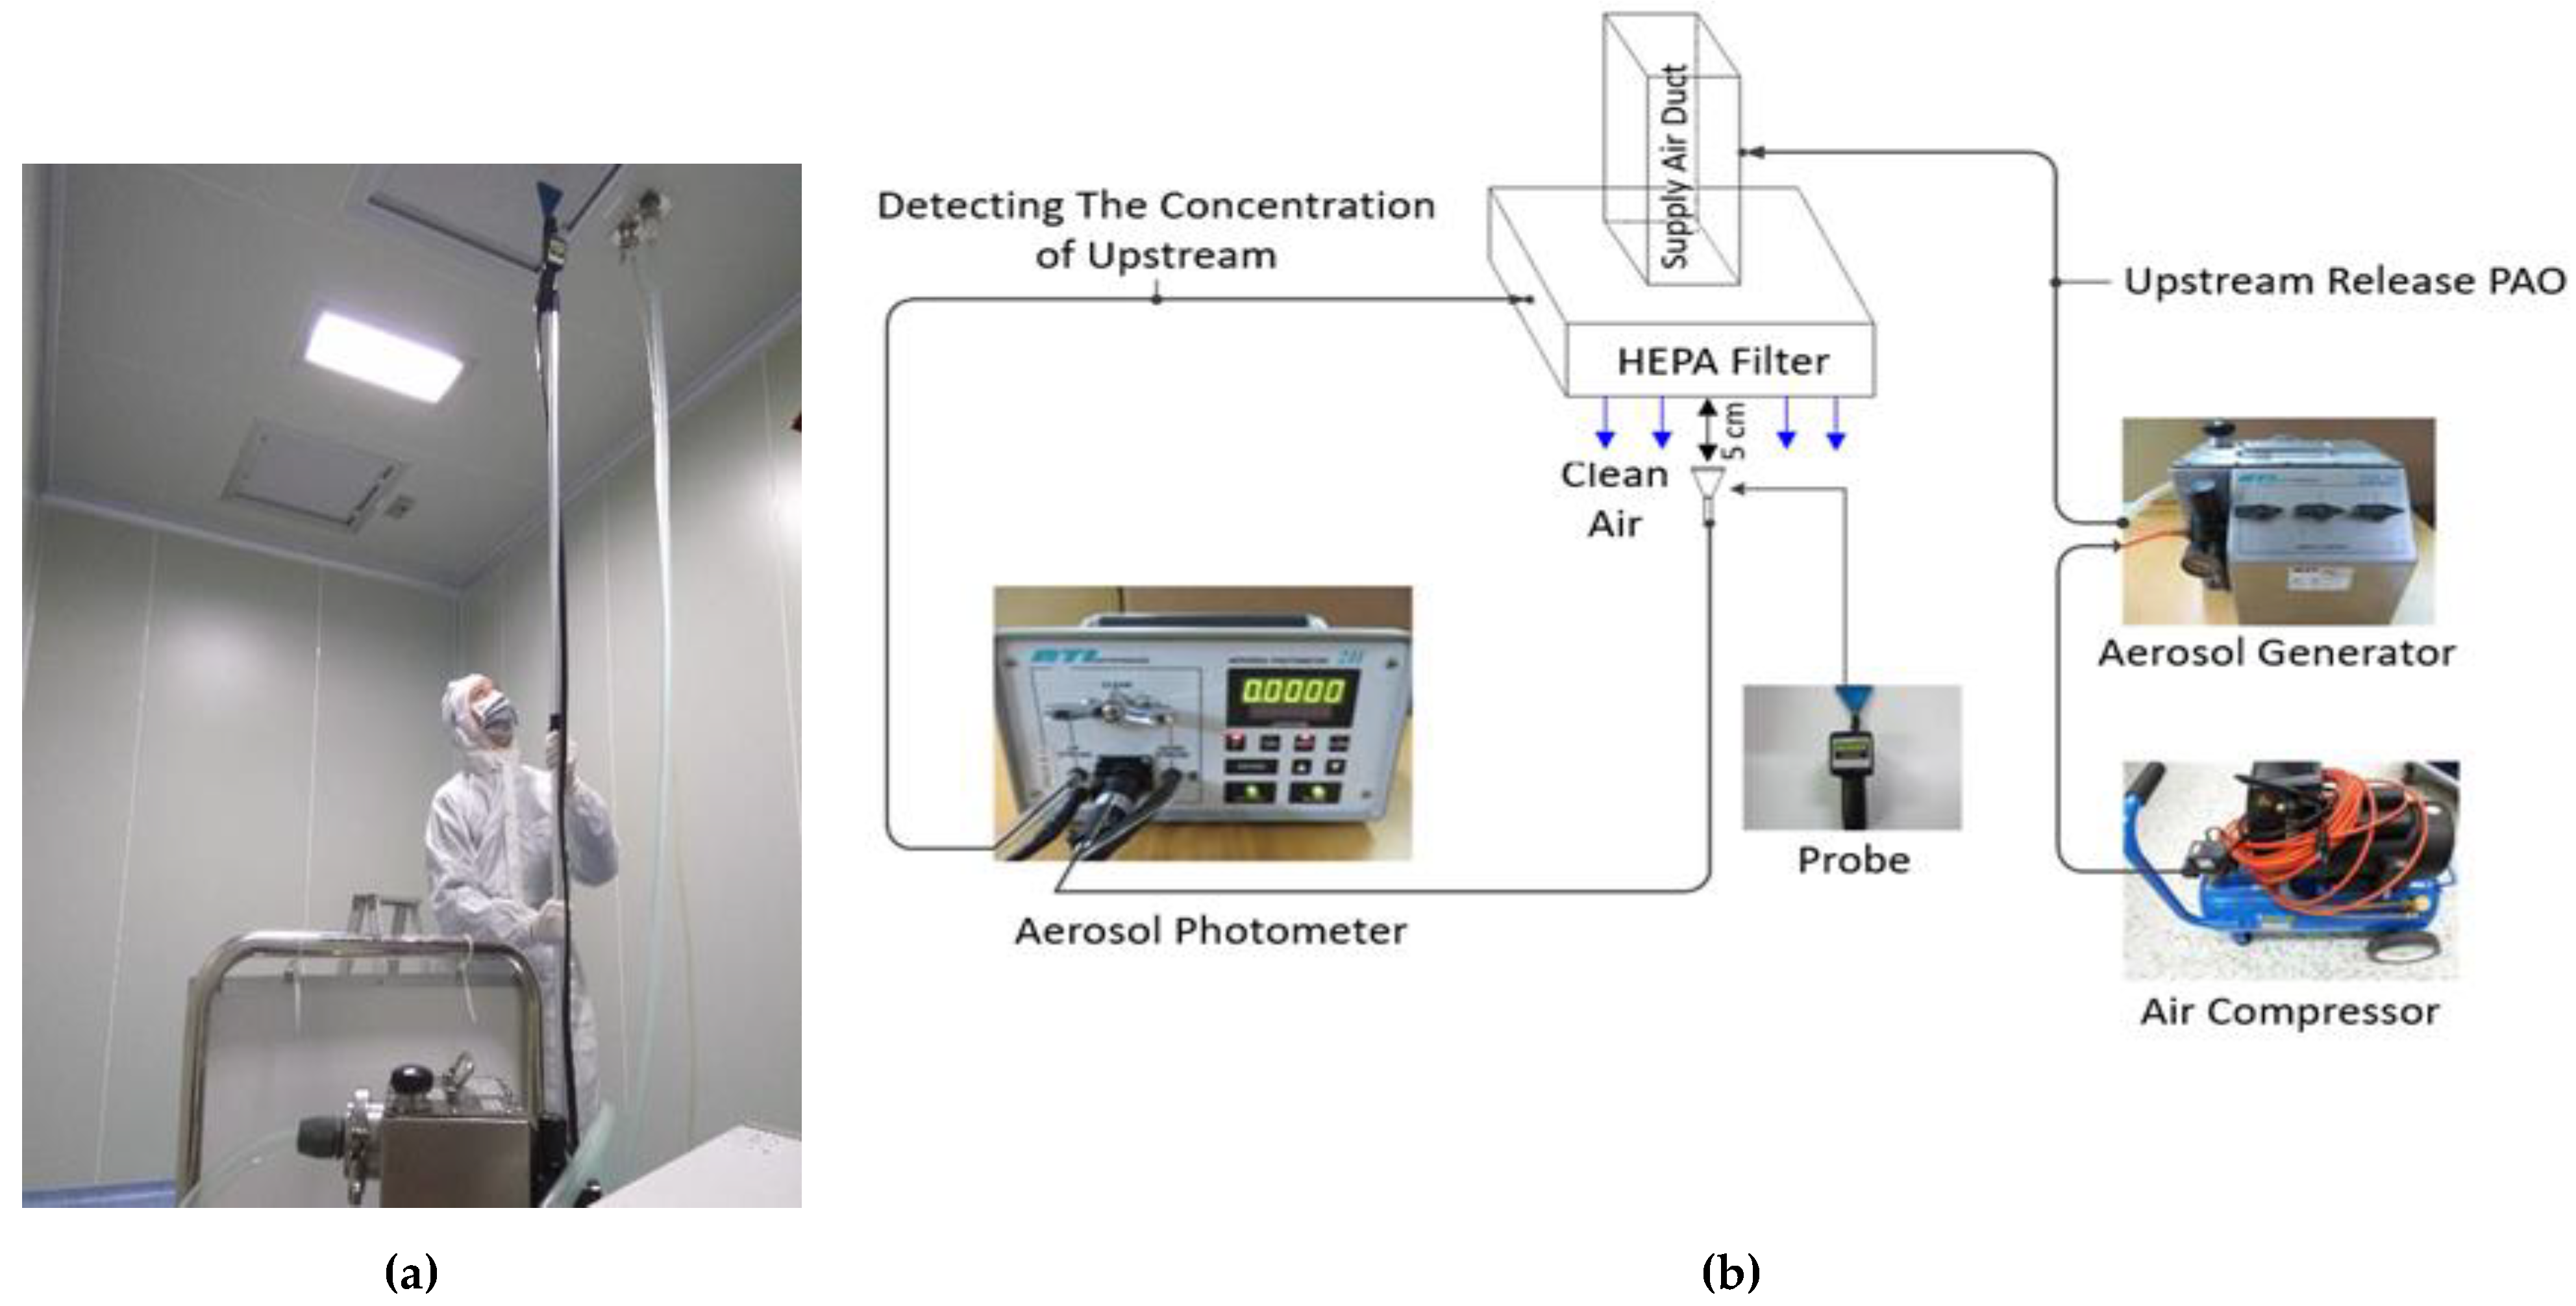
3.1. Field Measurement Test
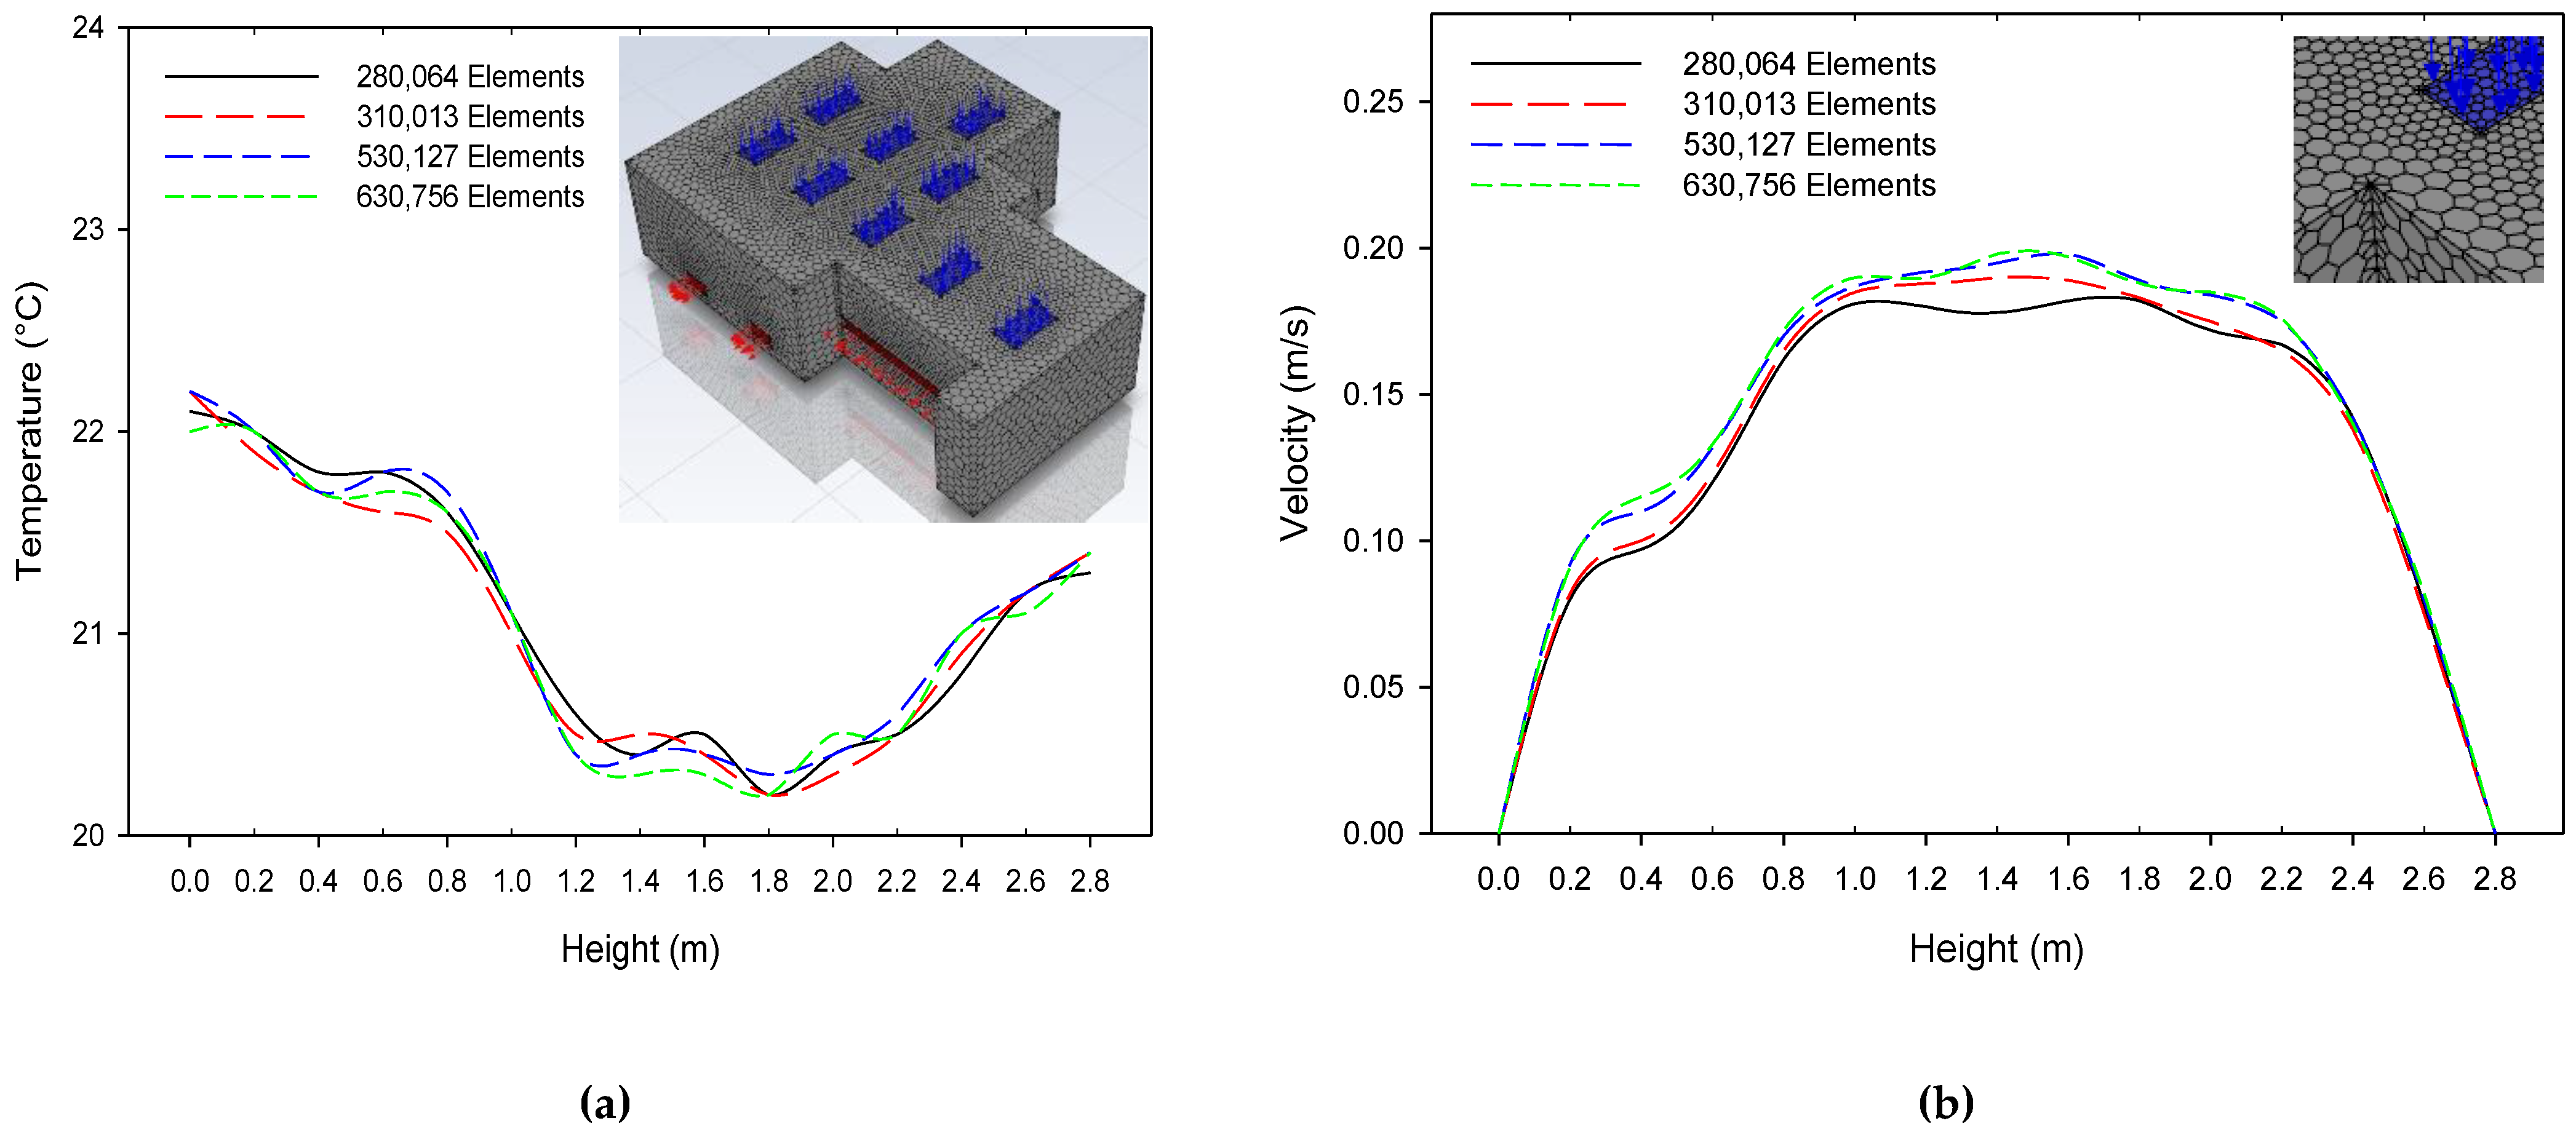
The indoor environmental parameters of this investigated biotech cleanroom were examined during the unoccupied (at-rest) state condition. All of the parameters must be qualified according to the cleanroom standard of PIC/S. Before conducting of retrieving the experimental data, HEPA leakage testing is necessary to ensure the HVAC system in the cleanroom is in good condition. The schematic diagram of the HEPA leak test is illustrated in Figure 3. The HEPA filter must remove at least 99.97% of all airborne particles greater than 0.5 µm from the air that passes through it. The leak test was performed for 1 min; the maximum permissible leakage should be 0.01%. Poly alpha Olefin (PAO) testing is a process that tests the integrity of the HEPA filter using PAO solutions in their operational conditions. These tests generate the aerosol, which has a similar characteristic with particles. The test will certify that the HEPA filter is fully functioning and that there is no leakage or damage. PAO tests were conducted, as well with an ATI TDA-2H photometer. After the HEPA filter is fully functioning, the retrieval data for airflow rate, temperature, relative humidity, pressure, and particle counts can be performed. The apparatus for the field measurement test is listed in Table 1.

3.2. CFD Simulation

The layout of the investigated biotech cleanroom is illustrated in Figure 4. The geometry of the research object is according to the actual size. The manufacturing machines were designed in the layout, as well. The CFD simulation has proven to be a powerful and efficient tool in airflow distribution and concentration profile cases. In this study, steady-state numerical simulation has been carried out using Ansys Fluent Workbench version 2020 R2 [29]. Transient numerical simulation was carried out in this study with the airflow turbulence simulation model using the renormalization group (RNG) k-ε model. The airflow distribution, temperature, pressurization, and concentration were simulated for around 450 s. The 3D computational domain of the biotech cleanroom was discretized with a polyhedral mesh made of tetrahedral elements. The iterative coupling calculation for this stage is solved by the semi-implicit method for pressure linked equations (SIMPLE) method. The residual value was set to 10−6. The contamination airborne was set at the species model used species transport with carbon-monoxide as a mixture material. The CO2 concentration in the outdoor atmosphere is about 400 ppm, used as the concentration value for supplying air from HEPA [30]. The initial contaminant concentration in the biotech cleanroom was set to 3000 ppm on the whole room, which could be the maximum limit of CO2 concentration (hazardous) [31], while the initial temperature was set at 27 °C and velocity at 0 m/s. The temperature and velocity of the HEPA filters have been measured through a field measurement test to provide reliable measurement data as the boundary condition of CFD simulation. Furthermore, all of the boundary conditions for the solution domain were clearly defined according to the actual field measurement tests data to carry out the accurate solutions. The heat flux from the machine was based on the machine specification. The boundary condition for numerical simulation is displayed in Table 2.

3.3. Performance Improvement Strategy

The performance improvement strategy was proposed and analyzed by numerical simulation with different approaches, which were conducted and assessed comprehensively. In Case 1 as a baseline case, the existing design and layout of the outlet air grilles may not be the best location to remove the concentration and cause the contamination residue. The addition of return air grilles position was implemented in case 2 and case 3. This section aims to explore the more prominent location of room pollutant residues to be improved. In addition, the higher airflow rates or supply air velocity are also possible to enhance the concentration removal. In this study, the existing velocity was 0.20 m/s, which might be not the optimal in removing the concentration inside the biotech cleanroom. Furthermore, the velocity increased to 0.25 m/s and 0.3 m/s, respectively, compared with the existing design to check whether the indoor air contamination distribution was appropriately adjusted. Three monitoring points were set at the height of 1.4 m above the floor that might generate a higher concentration in that area.

3.4. Concentration Decay and System Efficiency

A tracer gas concentration decay method could be used to evaluate the ventilation rate. CO2 was selected as a tracer gas, and it was injected into the spaces. Then it was monitored until it reached the desired concentration level, approaching the CO2 concentration background level of 400 ppm. In addition, the ventilation efficiency index could be chosen for assessment. Ventilation efficiency is the ratio between contaminant concentration in the occupied spaces and the concentration in the exhaust air. It measures how effectively the air present in a space is replaced by fresh air from the ventilation system. The indoor ventilation efficiency is expressed by Equation (1).
ε = C e C s ( C ) C s × 100 %
where ε is ventilation efficiency, Ce is pollutant concentration at the exhaust, and Cs is pollutant concentration at supply. Thus, (C) is the average pollutant concentration.
Contaminant removal effectiveness is the ratio between contaminant concentration in the exhaust air and the concentration at a point in the occupied space. It measures how quickly an airborne contaminant is removed from the room. The removal efficiency Equation (2) is as follows.
ε = Tpcs ( 0 ) Tpcs ( t ) Tpcs ( 0 )
where ε is removal efficiency, Tpcs(0) is the total number of particles released at the beginning (0 s), Tpcs(t) is the total number of residual particles in the room based on-time rate, and t is time with the unit of second (s).

4. Results and Discussion
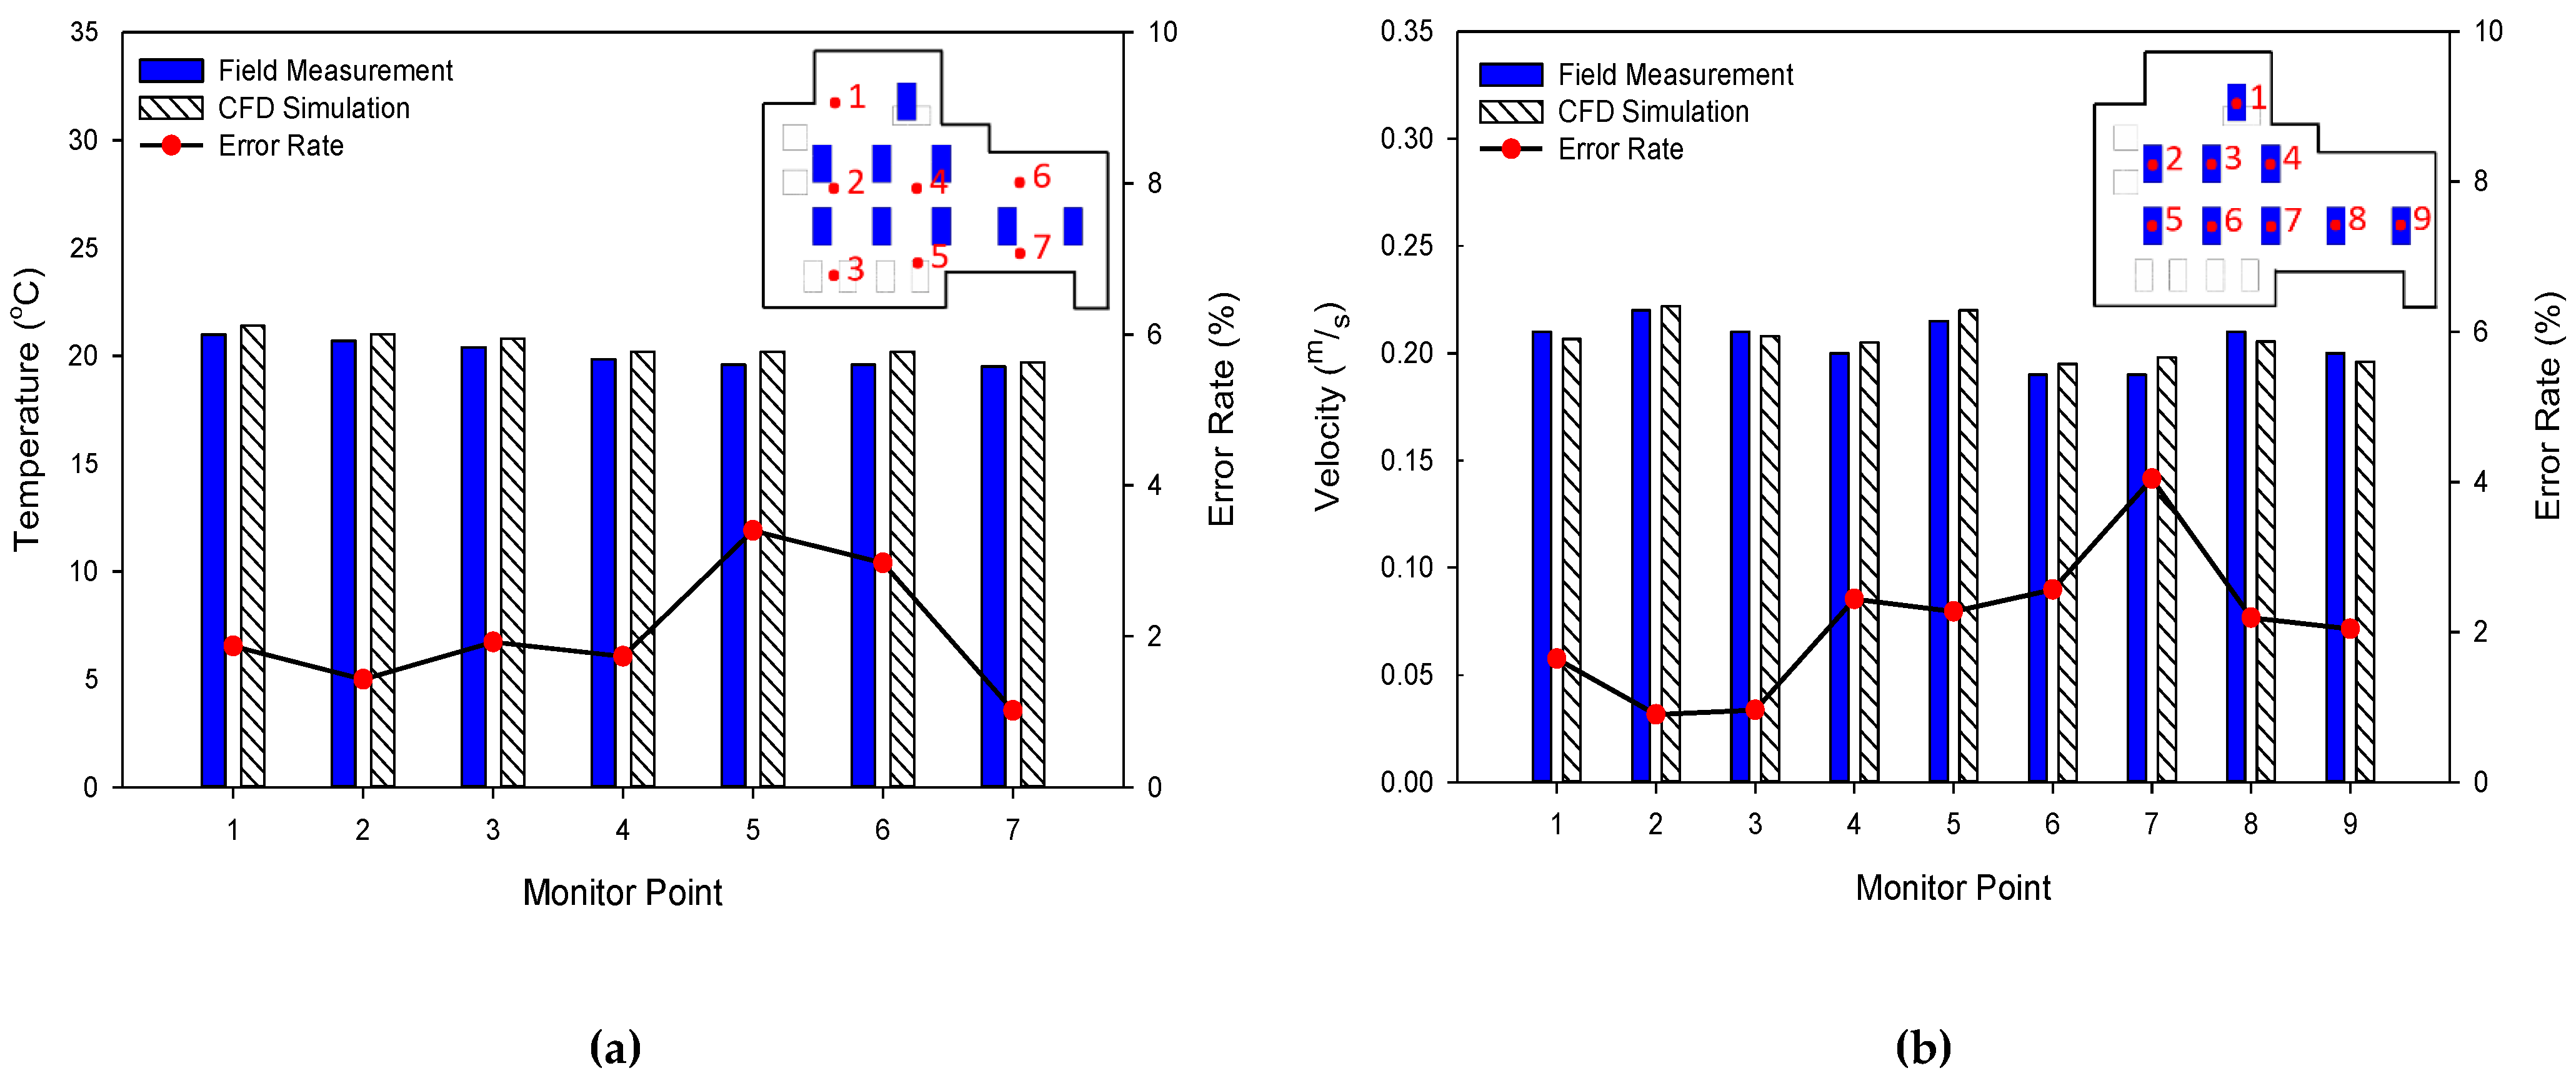
4.1. Validation

During the simulation process, the parameters could change the level of accuracy, as the number of elements in the mesh will increase the accuracy of the simulation results [32]. In this research, four sets of elements numbers are selected to verify simulation accuracy, 280,064 elements, 310,013 elements, 530,127 elements, and 630,756 elements (Figure 5). The mesh independence tests were conducted on both sides, temperature and velocity. The different changes in temperature and velocity were analyzed according to the height of the investigated room. The results revealed that they did not present significant changes between both sides. Moreover, increasing the number of elements makes the simulation results more precise. However, this requires a long time and sufficient resources. In this research, the elements number of 530,127 was chosen as a follow-up numerical simulation of the elements number in order to have an efficient computational time.
Validation deals with assessing the comparison between adequately accurate computational results and the experimental data. Data validation is the process of ensuring that data has encountered data cleansing to ensure it holds data quality that is both correct and useful. Validation requires the estimation process for error, and uncertainty must occur on both sides: numerical simulation and experiment. This process does not assume that the experimental measurements are more accurate than the computational result but only asserts that the experimental measurements are the most faithful reflections of reality for validation. The validation between the field measurement and CFD simulation are illustrated in Figure 6. The temperature and velocity error rate between numerical simulation and field measurement test is less than 4%, which could be the acceptance criteria of measurement and validation [33].

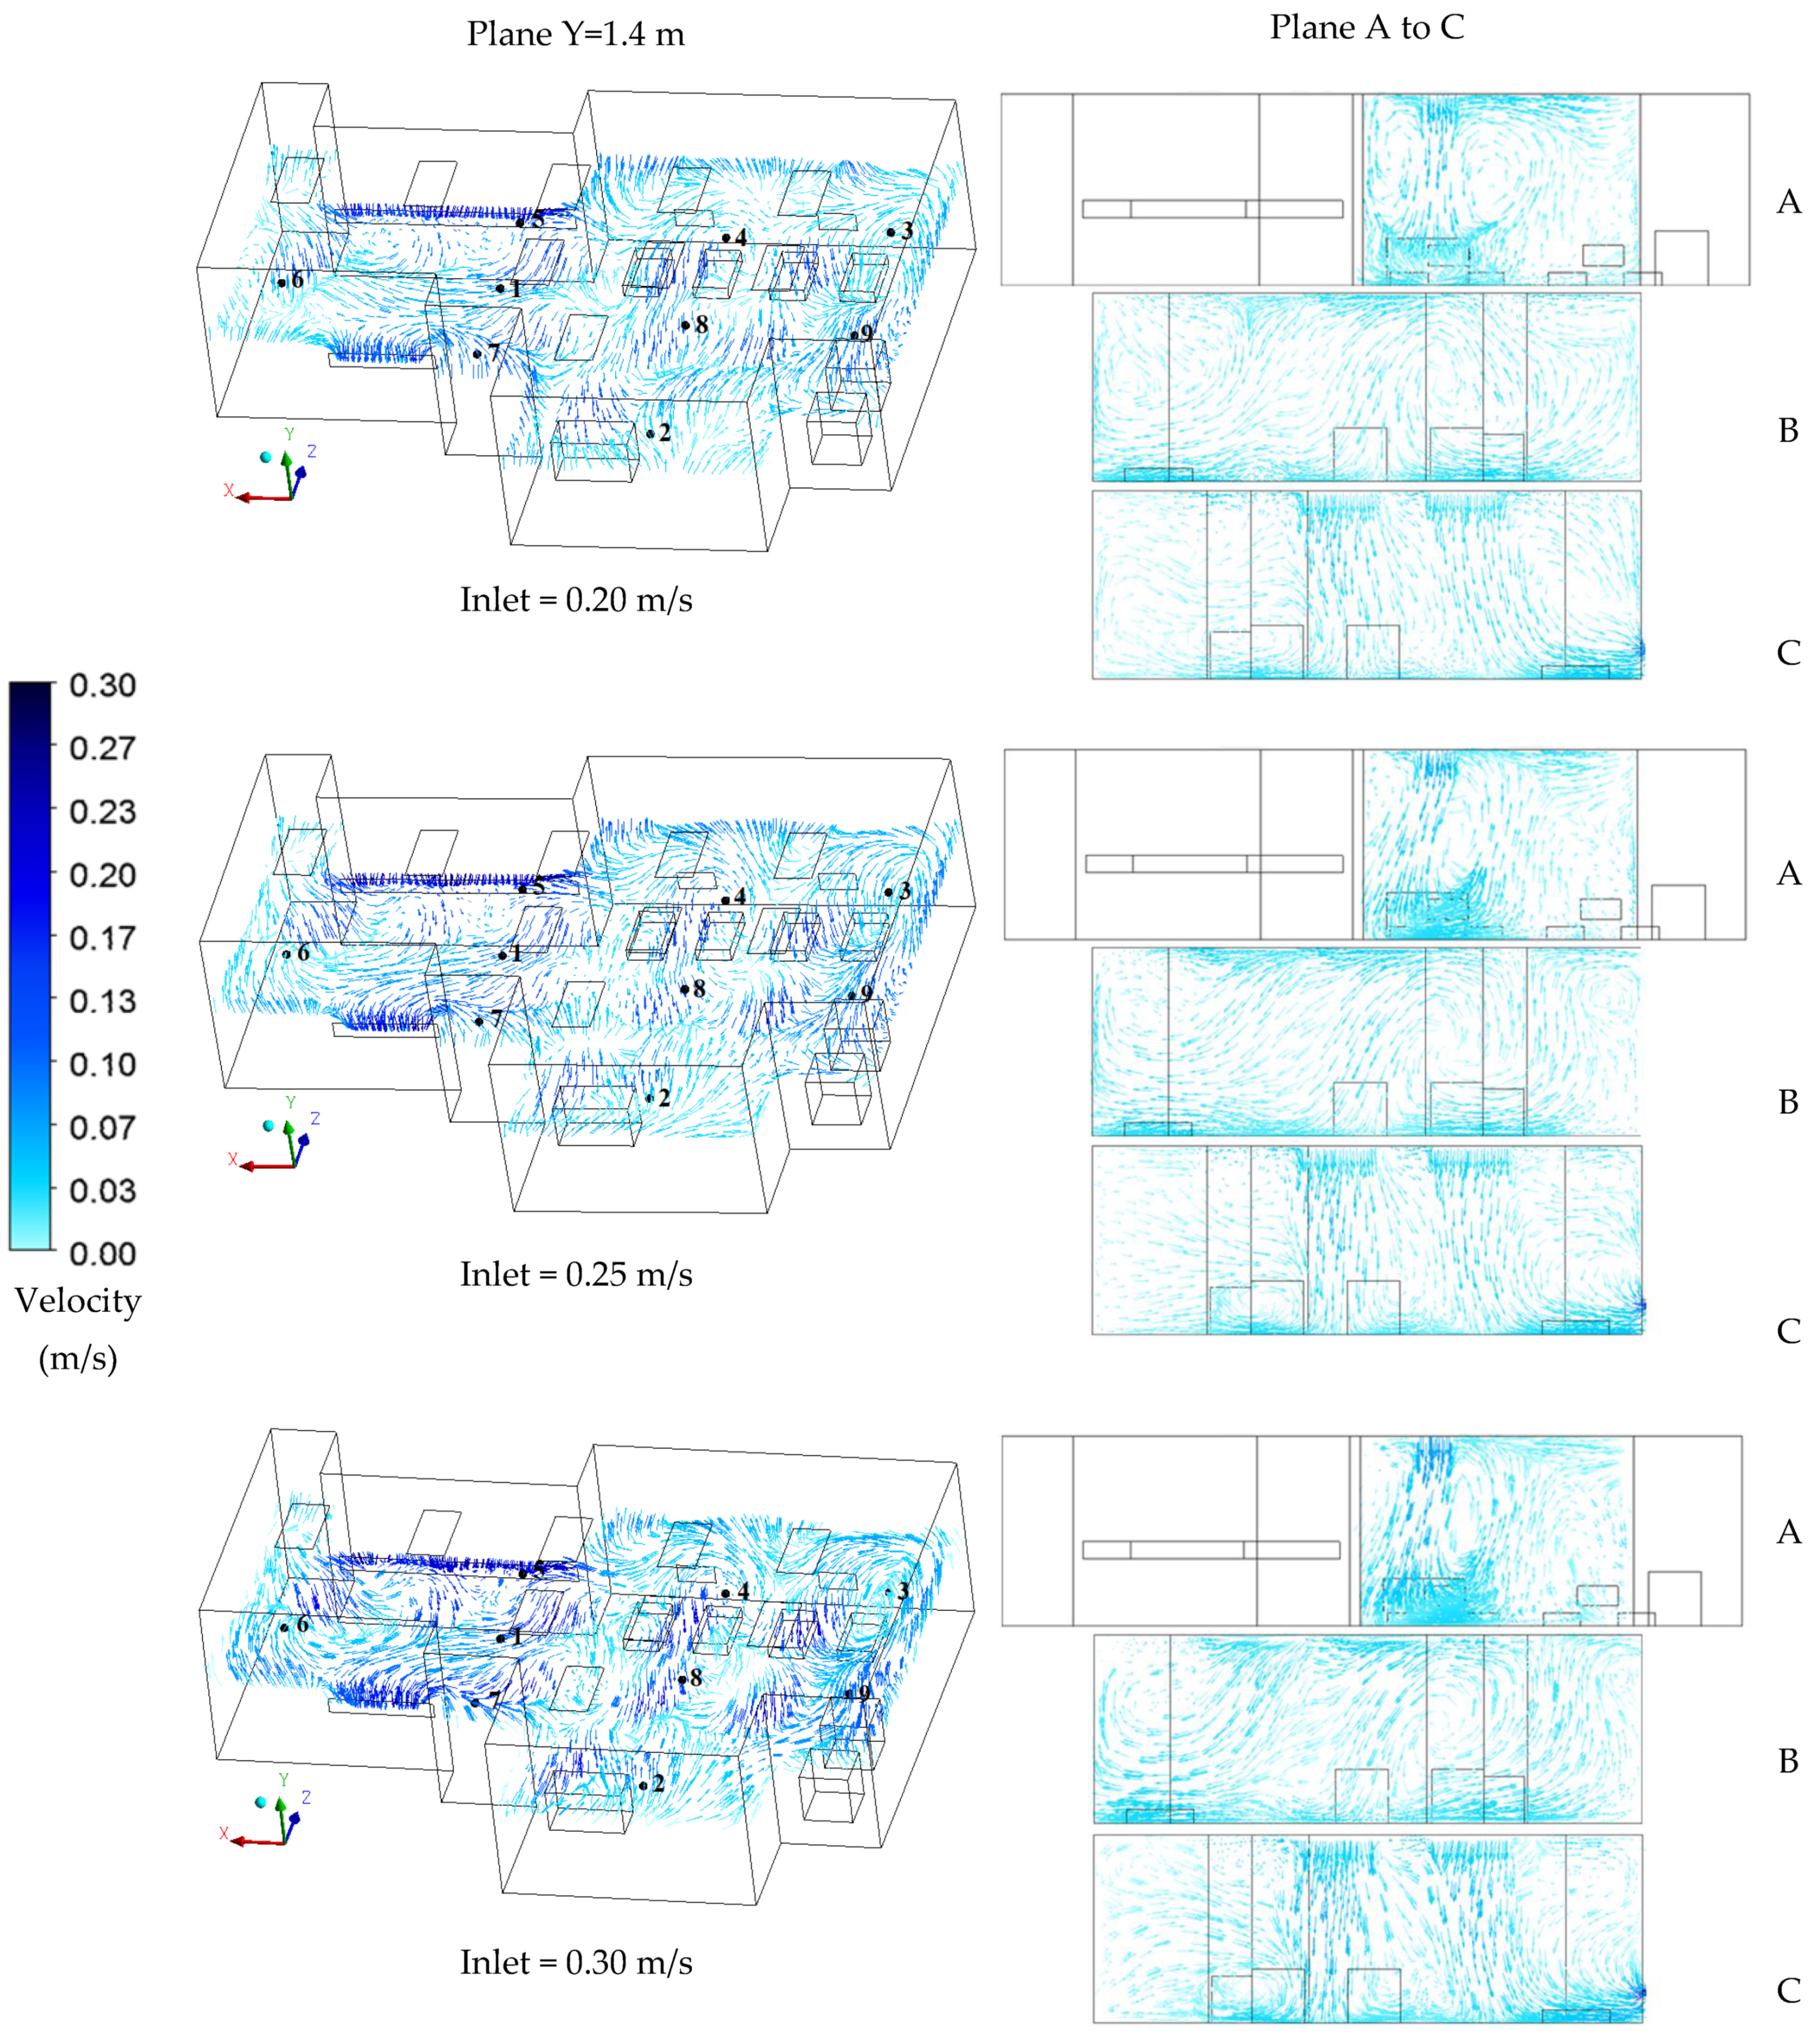
4.2. Contamination Removal Analysis in Different Face Velocities

The cleanliness was also maintained at the static environmental condition required for this area. Therefore, this section will discuss the appropriate measures to increase the velocity face at supply air. The existing face velocity from the supply air is at 0.20 m/s (ACH = 21.9), which has been carried out from the field measurement test. In order to increase the performance improvement and contamination control, a higher velocity or ventilation rate is increased to 0.25 m/s (ACH = 28.7) and 0.3 m/s (ACH 34.4), respectively, and analyzed numerically. The temperature will be reached quickly with a higher ventilation rate. Figure 7. shows the results of airflow velocity distribution in different cases.
Followed by the observation of contaminant removal, the airflow distribution of the interception was analyzed. A total of nine monitoring points and four-section planes were analyzed in this study. At the face velocity of 0.20 m/s, the high contaminant concentration happened around the monitoring points A, B, and C. It showed that the contaminant concentration was around 700 ppm the monitoring point A. In addition, it also shows the accumulation of contamination at the corner of the biotech cleanroom. The reason is that the distribution of air is not evenly distributed to the cleanroom, especially to the corner. The face velocity of the HEPA or supply-air grille did not distribute to the outer part or corner and may cause the contamination residue due to the return air pattern between the return air is open. In the area that more airflow was distributed evenly, such as monitoring point 6 and point 8 has better performance of contamination removal.
The contaminant concentration with the face velocity of 0.25 m/s represents the most directly affected by the relationship between contaminant concentration and ventilation rate or ACH. Therefore, in this part, the contaminant concentration in the biotechnology cleanroom decreased slightly compared with the face velocity at 0.20 m/s. When the air velocity was increased, the overall distribution was similar to the baseline case. However, a variable such as an increase in the air velocity is not likely to exert a great change in the condition of the velocity in the room and the location of the return air grille unchanged. Then as the face velocity increased to 0.30 m/s, the contaminant concentration was still similar to the former. Therefore, the cumulative contamination concentration decreases due to the increases in ventilation rate and the removal rate. As a result, less than 1000 ppm of the cumulative concentration occurred in the biotechnology cleanroom after 450 s of transient analysis.

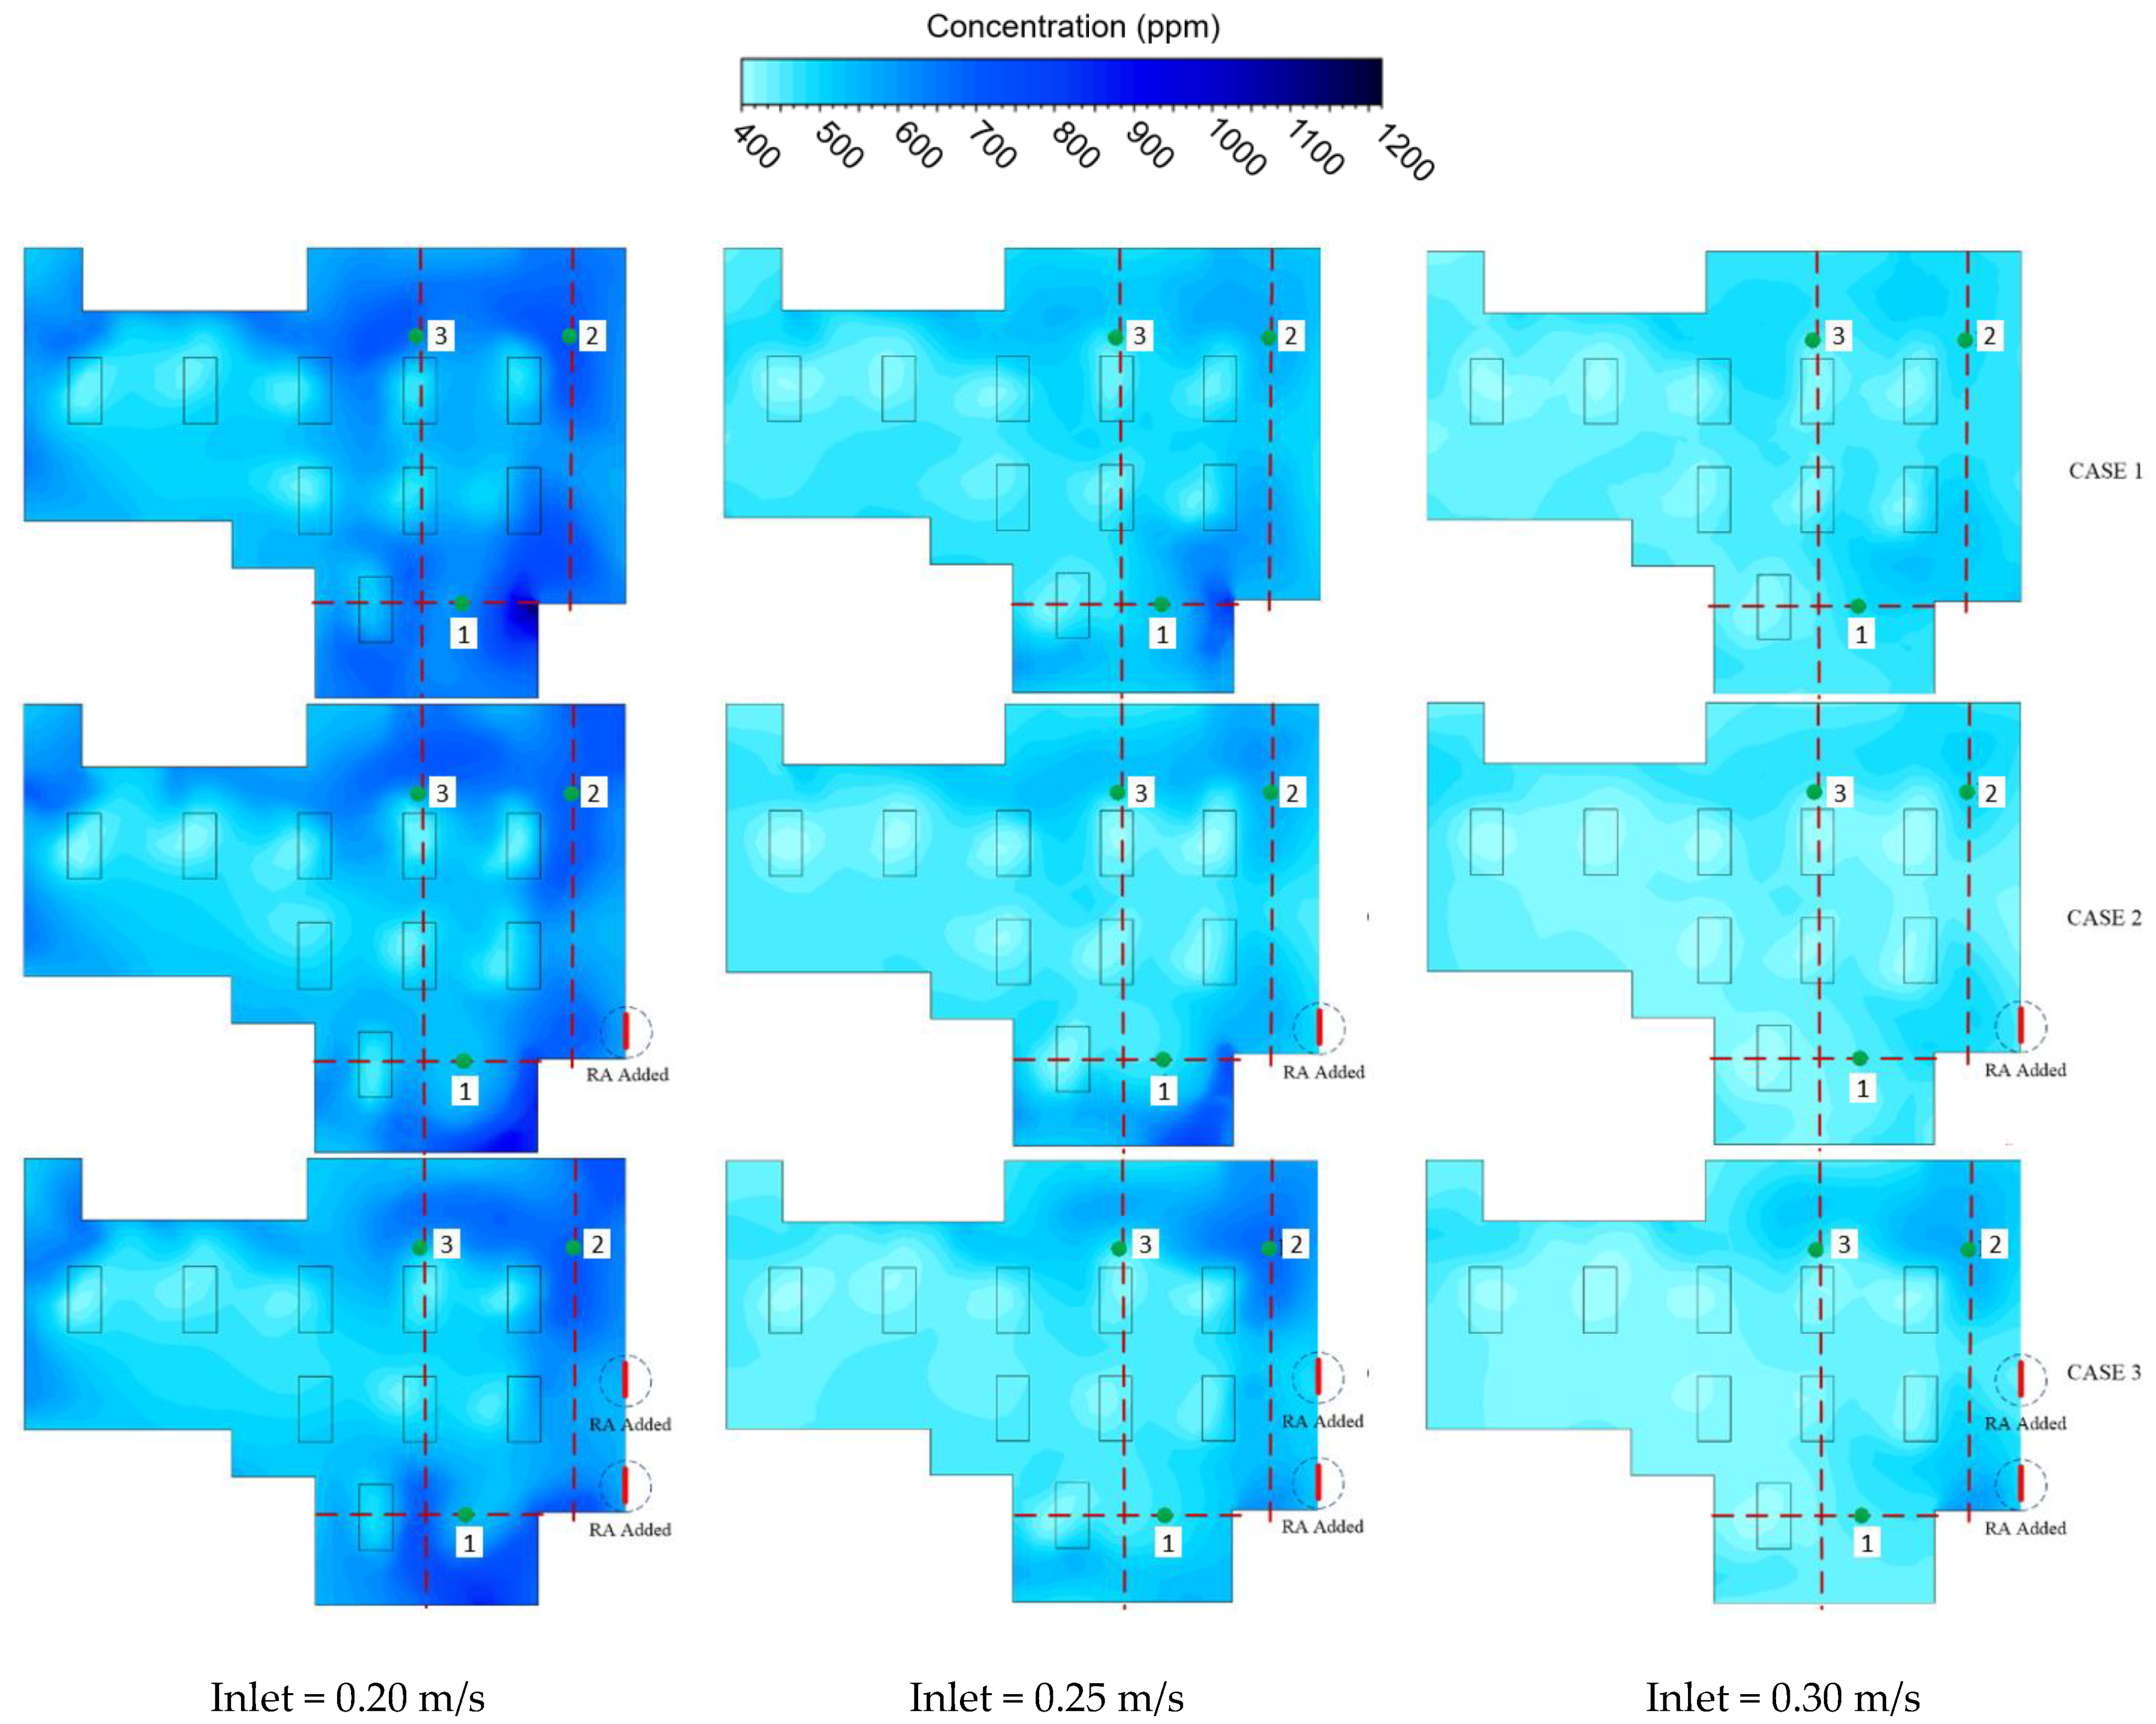
4.3. Contamination Removal Analysis by Adding Return Air Grilles

In this section, the location of the return air grille may affect the airflow in the cleanroom. The monitoring Point 2 is located at the corner of the biotech cleanroom and nearby a manufacturing machine. Point 1 is located near a corner of the cleanroom and Point 3 has a manufacturing machine nearby. The vortex phenomenon is found in case 1, which reveals that the contamination in that region is less to flow back to the outlet so that it can accumulate the contaminants. Therefore, the improvement strategy to enhance the contamination control was conducted in this study of the existing state (baseline case) of the biotech cleanroom. In addition, case 2 and case 3 are shown the added return air grille at the biotech cleanroom to improve the contamination control.
According to the numerical simulation results, Figure 8 represents the contaminant concentration profile at Plane Y = 1.4 m of case 1, case 2, and case 3 with the defined face velocity. The accumulation of contamination appeared around a monitoring point 1 in case 1. The concentration of the contaminant is about 1084 ppm. There was a reduction in return air grille installation on the case 2. The results showed a slight improvement on contamination control at the biotech cleanroom with 853 ppm. Then, two return air grille was added at biotechnology cleanroom for case 3, which presented a lower concentration than other cases. Ventilation rate can affect concentration results. Therefore, when the air velocity increased, the contaminant concentration in the biotech cleanroom decreased compared to case 1 and case 2. As a result, less than 1000 ppm of the cumulative concentration occurred in the biotech cleanroom after 450 s of transient analysis. On the other hand, there is no outlet air near the point A. So, it also could generate a higher concentration than the other’s point. The cumulative contamination concentration decreases due to the increases in ventilation rate and the removal rate. Case 2 presents a good concentration distribution, but some locations near the room corner still have some accumulated contaminants. However, after adjusting to the higher ventilation rate, case 3 presents the most distributed and low concentration contaminants.

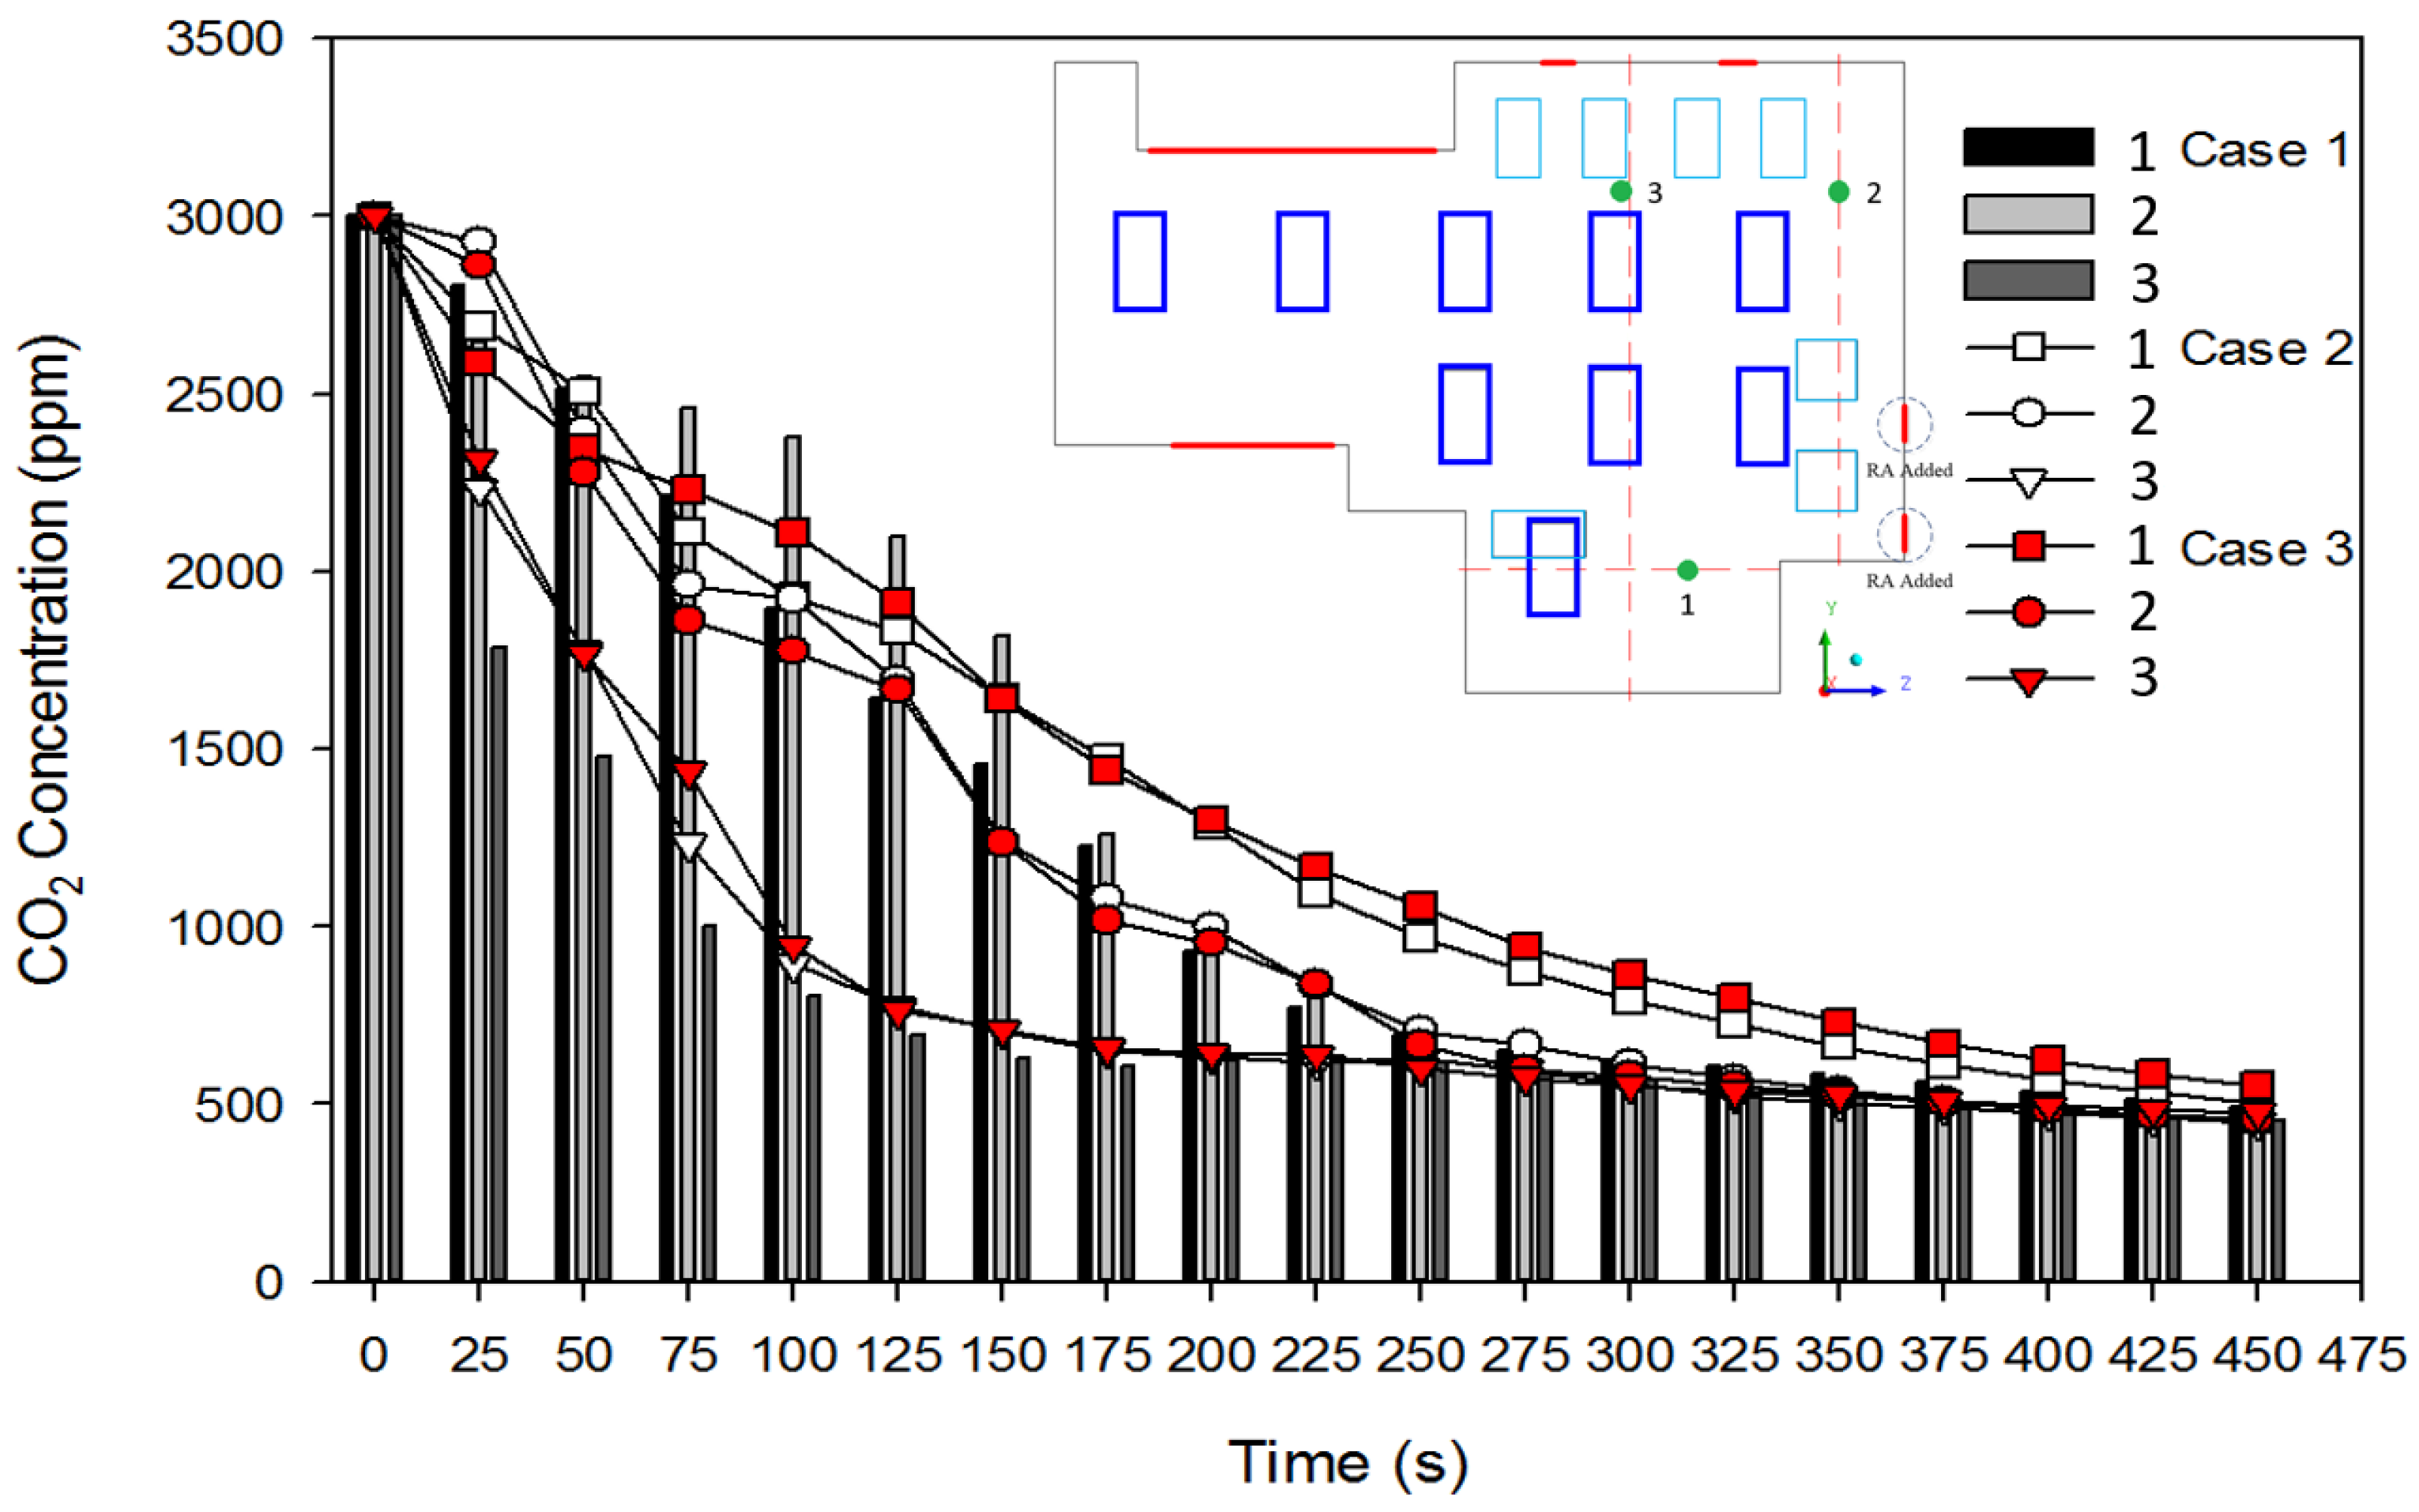
4.4. Concentration Contaminant Decay

Figure 9 illustrates the contaminant concentration decay with face velocity at 0.30 m/s. The X-axis shows the time (second), and Y-axis shows concentration (ppm) respectively. The bars depict the monitoring point of Case 1. The white triangle, circle, and square represent the monitoring points of Case 2. The red triangle, circle, and square are the monitoring point of Case 3. Case 3 showed a higher concentration result than other cases. At 175 s, points A and B were more than 1000 ppm and point C less than 660 ppm. The concentration is slowly declining until 450 s. The result showed that Case 2 exhibited a better result than other cases. Point 2 of case 2 represents the better contaminant removal with 450 ppm. By analyzing the distribution of contaminants by increasing the velocity, the results showed that increasing the velocity caused enhancement of contaminant removal. The increasing face velocity is based on the cleanroom standard or design requirement around 0.2 m/s until 0.5 m/s. In addition, the increasing velocity can remove the contaminant in a relatively short period. The result revealed that adding 1 return air grille caused the contamination control improvement by analyzing adding return air grilles. The location of adding a return air grille is near because only the air grille can be done on that wall side. Another wall is connected directly to another process room and corridor.

4.5. Removal and Ventilation Efficiency

Contamination control is one way to improve the cleanliness of the biotech cleanroom. By increasing the supply air velocity (airflow rate) it is possible to improve the contamination control. This section discusses the removal and ventilation efficiency of the concentration contaminant. The ventilation efficiency and the difference between the inlet and exhaust also the average concentration of indoor pollutants. Table 3 represent the contamination concentration result at Plane Y and the whole cleanroom with different face velocity and cases. The average contaminant concentration in a whole cleanroom revealed that the face velocity influences the removal rate in the cleanroom. The cumulative concentration of contamination is more decreased due to the increase in the removal rate. Based on different cases, Case 2 is the case with adding 1 return air grille in the cleanroom showing the effective removal of contamination than another case. Case 2 with 0.3 m/s of face velocity possesses an effective removal rate of 431 ppm.
Figure 10 depicts the removal efficiency and ventilation efficiency of the biotech cleanroom. Three cases are simulated with a numerical simulation. Case 2 held the highest removal rate in every adjustment velocity based on the removal efficiency. The contamination in the cleanroom can be removed efficiently than in other cases. As for the removal efficiency, the ventilation efficiency shows that case 2 present better performance than case 1. With good ventilation strategies, then contamination removal can be more effective.

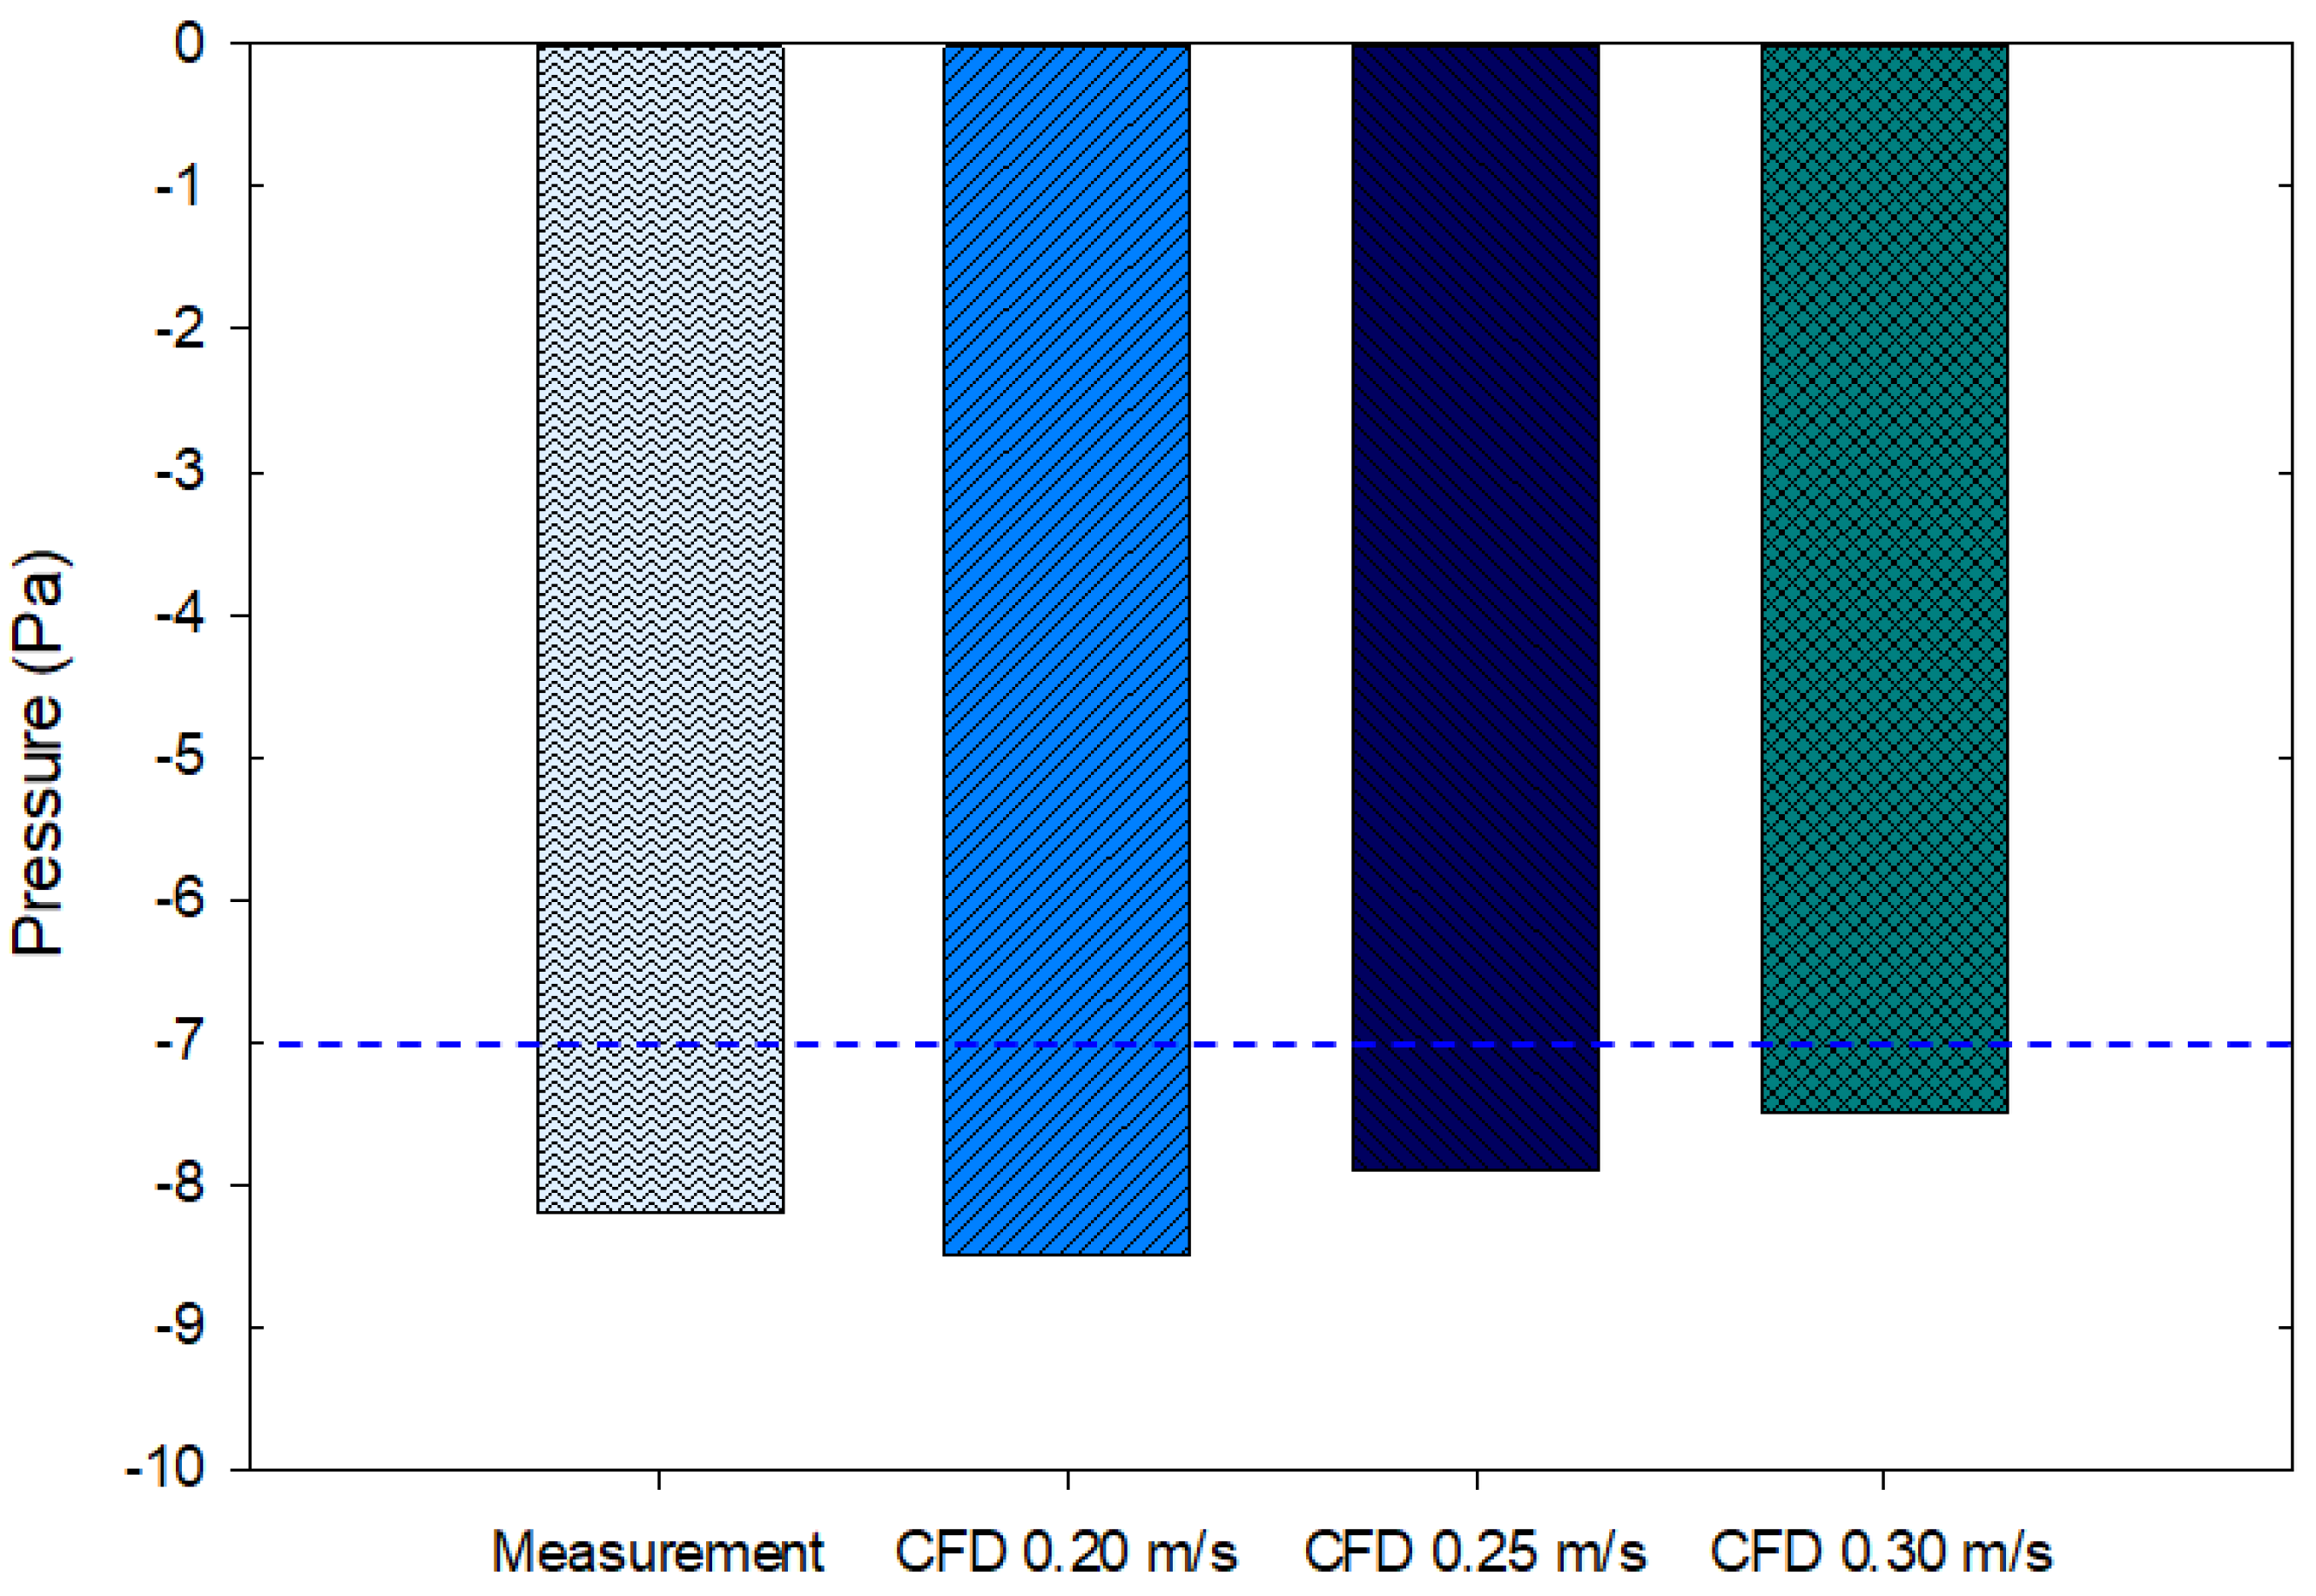
4.6. Pressurization Effect at Different Face Velocities

A negative pressure design is required to prevent contamination leakage to other rooms, especially for vaccine production, which contains a biohazard, so the negative pressurized cleanroom is necessary. The pressurized design specification of this cleanroom should be maintained less than −7 Pa. The different results from the field measurement test and also numerical simulation in each case also result in various pressurization. Figure 11. depicts the results of the pressurization in a different scheme. The field measurement was conducted with the pressurization at −8.2 Pa, compared to the numerical simulation with the pressurization of −8.5 Pa, which has been validated; the results are close to the experimental. The study aims to find the optimal results in contamination control concerns by increasing the face velocity. When the existing velocity of 0.205 m/s was increased to 0.25 m/s and 0.30 m/s resulting in higher pressure, the results were −7.9 and −7.5 Pa, respectively. The different pressurization results in this study are acceptable because they are still in the range of the design specification.

5. Conclusions

This study investigated the indoor environment parameter during at-rest occupancy state conditions in the biotech cleanroom through field measurement tests and numerical simulation. The performance of indoor environment parameters has been evaluated comprehensively. All indoor environmental condition has been reached and conformed with the design specification and cleanroom standard, including temperature, relative humidity, pressurization, and particle counts. Furthermore, the testing results were used as a basic validation and boundary condition for CFD simulation.
The results from numerical simulation revealed that the increase of face velocity is feasible, and that the improvement of contamination control could be achieved satisfactorily by adding a return air grille. The utilization of adding a return air grille was also assessed though the numerical simulation technique; it is used for airflow distribution and the concentration decay calculation. The performance improvement occurred by adding a return air grille. Case 2 with 0.30 m/s of velocity adjustment has a better contamination control result than other cases, and velocity with an average contaminant concentration is about 440 ppm. Furthermore, based on the improvement parameter of ventilation performance, the removal efficiency results in case 2 are about 94%, and the ventilation efficiency is about 85%. Higher removal efficiency happened because the airflow was well distributed. The vortexes or turbulence airflow that occurs in case 2 does not appear too much, so it does not cause a large accumulation of contaminant concentration. Results also revealed that it is possible to identify the best practice for investigating contamination control for the biotech cleanroom.

Author Contributions

Conceptualization, F.W., I.P. and K.L.; Data curation, I.P. and P.P.R.; Formal analysis, I.P., D.R. and P.P.R.; Investigation, F.W., I.P. and K.L.; Methodology, I.P.; Validation, I.P.; Visualization, I.P.; Writing—original draft, P.P.R., and I.P.; Writing—review and editing, F.W. and I.P. All authors have read and agreed to the published version of the manuscript.

Funding

This study was supported by the Ministry of Science and Technology under the grant no. MOST 109-2622-E-167-002-CC3.

Institutional Review Board Statement

Not applicable.

Informed Consent Statement

Not applicable.

Data Availability Statement

The data presented in this study are available on request from the corresponding author.

Conflicts of Interest

The authors declare no conflict of interest.

References

  1. Esteves, S.C.; Bento, F.C. Implementation of cleanroom technology in reproductive laboratories: The question is not why but how. Reprod. Biomed. Online 2016, 32, 9–11. [Google Scholar] [CrossRef] [PubMed]
  2. International Organization for Standard (ISO) 14644-1; Cleanroom and Associate Controlled Environments Part 1: Classification of Air Cleanliness. ANSI: Geneva, Switzerland, 2015.
  3. Pharmaceutical Inspection Convention and Pharmaceutical Inspection Co-operation Scheme (PIC/S). Guide to Good Manufacturing Practice for Medicinal Products Annexes; Pharmaceutical Inspection Convention and Pharmaceutical Inspection Co-Operation Scheme (PIC/S): Geneva, Switzerland, 2018. [Google Scholar]
  4. ISO 22716; Good Manufacturing Practices (GMP) Guidelines on Good Manufacturing Practices. ANSI: Geneva, Switzerland, 2007.
  5. Yang, L.; Gan, C.E. Costing small cleanrooms. Build. Environ. 2007, 42, 743–751. [Google Scholar] [CrossRef]
  6. Yang, Z.; Hao, Y.; Shi, W.; Shao, X.; Dong, X.; Cheng, X.; Li, X.; Ma, X. Field test of pharmaceutical cleanroom cleanliness subject to multiple disturbance factors. J. Build. Eng. 2021, 42, 103083. [Google Scholar] [CrossRef]
  7. Sandle, T. Pharmaceutical Microbiology: Essentials for Quality Assurance and Quality Control; Woodhead Publishing: Cambridge, UK, 2015. [Google Scholar]
  8. Tung, Y.C.; Shih, Y.C.; Hu, S.C. Numerical study on the dispersion of airborne contaminants from an isolation room in the case of door opening. Appl. Therm. Eng. 2009, 29, 1544–1551. [Google Scholar] [CrossRef]
  9. Sun, Z.; Wang, S. A CFD-based test method for control of indoor environment and space ventilation. Build. Environ. 2010, 45, 1441–1447. [Google Scholar] [CrossRef]
  10. Memarzadeh, F.; Manning, A.P. Comparison of operating room ventilation systems in the protection of the surgical site. ASHRAE Trans. 2002, 108, 1–13. [Google Scholar]
  11. Swift, J.; Avis, E.; Millard, B.; Lawrence, T.M. Air distribution strategy impact on operating room infection control. In Proceedings of the Clima 2007-WellBeing Indoors, Helsinki, Finland, 10–14 June 2007. [Google Scholar]
  12. Srebric, J.; Vukovic, V.; He, G.; Yang, X. CFD boundary conditions for contaminant dispersion, heat transfer and airflow simulations around human occupants in indoor environments. Build. Environ. 2008, 43, 294–303. [Google Scholar] [CrossRef]
  13. Aganovic, A.; Cao, G.; Stenstad, L.I.; Skogås, J.G. Impact of surgical lights on the velocity distribution and airborne contamination level in an operating room with laminar airflow system. Build. Environ. 2017, 126, 42–53. [Google Scholar] [CrossRef]
  14. Chow, T.T.; Lin, Z.; Bai, W. The integrated effect of medical lamp position and diffuser discharge velocity on ultra-clean ventilation performance in an operating theatre. Indoor Built Environ. 2006, 15, 315–331. [Google Scholar] [CrossRef]
  15. Liu, Z.; Zhang, M.; Cao, G.; Tang, S.; Liu, H.; Wang, L. Influence of air supply velocity and room temperature conditions on bioaerosols distribution in a class I operating room. Build. Environ. 2021, 204, 108116. [Google Scholar] [CrossRef]
  16. Yang, Y.; Zhang, Y.; Liu, F.; Wang, Y.; Cao, Q.; Fan, J.N.; Chen, H. Distribution and removal efficiency of sulfuric droplets under two general ventilation modes. Build. Environ. 2022, 207, 108563. [Google Scholar] [CrossRef]
  17. Franco, A.; Schito, E. Definition of optimal ventilation rates for balancing comfort and energy use in indoor spaces using CO2 concentration data. Buildings 2020, 10, 135. [Google Scholar] [CrossRef]
  18. Khoo, C.Y.; Lee, C.C.; Hu, S.C. An experimental study on the influences of air change rate and free area ratio of raised floor on cleanroom particle concentrations. Build. Environ. 2012, 48, 84–88. [Google Scholar] [CrossRef]
  19. Zhou, L.; Sun, W.; Huang, C.; Li, H.; Zou, Z.; Wu, C. Studies on Comparison of Particle Concentration Models for Cleanroom. Procedia. Eng. 2017, 205, 3308–3315. [Google Scholar] [CrossRef]
  20. Bullová, I.; Kapalo, P.; Katunský, D. Quantification of Air Change Rate by Selected Methods in a Typical Apartment Building. Buildings 2021, 11, 174. [Google Scholar] [CrossRef]
  21. Adams, N.J.; Johnson, D.L.; Lynch, R.A. The effect of pressure differential and care provider movement on airborne infectious isolation room containment effectiveness. Am. J. Infect. Control. 2011, 39, 91–97. [Google Scholar] [CrossRef]
  22. Sun, W. Cleanroom airlock performance and beyond. ASHRAE J. 2018, 60, 64–69. [Google Scholar]
  23. Peng, S.; Chen, Q.; Liu, E. The role of computational fluid dynamics tools on investigation of pathogen transmission: Prevention and control. Sci. Total. Environ. 2020, 31, 142090. [Google Scholar] [CrossRef]
  24. Chung, K.C.; Hsu, S.P. Effect of ventilation pattern on room air and contaminant distribution. Build. Environ. 2001, 36, 989–998. [Google Scholar] [CrossRef]
  25. Chen, S.C.; Tsai, C.J.; Li, S.N.; Shih, H.Y. Dispersion of gas pollutant in a fan-filter-unit (FFU) cleanroom. Build. Environ. 2007, 42, 1902–1912. [Google Scholar] [CrossRef]
  26. Wang, L.; Dai, X.; Wei, J.; Ai, Z.; Fan, Y.; Tang, L.; Ge, J. Numerical comparison of the efficiency of mixing ventilation and impinging jet ventilation for exhaled particle removal in a model intensive care unit. Build. Environ. 2021, 200, 107955. [Google Scholar] [CrossRef]
  27. Rouaud, O.; Havet, M. Numerical investigation on the efficiency of transient contaminant removal from a food processing clean room using ventilation effectiveness concepts. J. Food Eng. 2005, 68, 163–174. [Google Scholar] [CrossRef]
  28. World Health Organization (WHO). Environmental Monitoring of Clean Rooms in Vaccine Manufacturing Facilities; World Health Organization (WHO): Geneva, Switzerland, 2012. [Google Scholar]
  29. ANSYS. Ansys Fluent, Workbench 2020 R2. Available online: https://www.scribd.com/document/478910198/ANSYS-FluentTutorial-Guide-2020-R2-pdf (accessed on 6 March 2021).
  30. Minnesota Department of Health United States. Carbon Dioxide (CO2). Available online: https://www.health.state.mn.us/communities/environment/air/toxins/co2.html (accessed on 15 June 2021).
  31. Green Econometrics, Economic Analysis and Analytics for Sustainability and Process Improvement. 3 Metrics to Guide Air Quality Health & Safety. Available online: https://greenecon.net/3-metrics-to-guide-air-quality-health-safety/carbon-footprint.html (accessed on 20 July 2021).
  32. Wan, J.; Wei, J.; Lin, Y.; Zhang, T. Numerical Investigation of Bioaerosol Transport in a Compact Lavatory. Buildings 2021, 11, 526. [Google Scholar] [CrossRef]
  33. BPI Consulting, LLC. Acceptance Criteria for Measurement Systems Analysis. Available online: https://www.spcforexcel.com/knowledge/measurement-systems-analysis/acceptance-criteria-for-MSA (accessed on 15 November 2021).
Figure 1. The investigated biotech cleanroom: (a) snapshot; (b) geometry model.
Atmosphere 13 00335 g001
Figure 2. The proposed methodology framework.
Atmosphere 13 00335 g002
Figure 3. The HEPA leakage test; (a) snapshot; (b) schematic test diagram.
Atmosphere 13 00335 g003
Figure 4. The layout of the investigated biotech cleanroom for CFD simulation.
Atmosphere 13 00335 g004
Figure 5. Mesh independence test of the investigated cleanroom; (a) temperature; (b) velocity.
Atmosphere 13 00335 g005
Figure 6. Validation; (a) error rate temperature results; (b) error rate velocity results.
Atmosphere 13 00335 g006
Figure 7. Air velocity distribution of the investigated cleanroom at different face velocities case 1.
Atmosphere 13 00335 g007
Figure 8. Contaminant concentration profile for different cases.
Atmosphere 13 00335 g008
Figure 9. Contaminant concentration decay with face velocity at 0.30 m/s.
Atmosphere 13 00335 g009
Figure 10. Removal and ventilation efficiency of the biotech cleanroom.
Atmosphere 13 00335 g010
Figure 11. The pressurization results in different cases.
Atmosphere 13 00335 g011
Table 1. Apparatus for field measurement tests.
ParametersApparatus ModelOperative RangeAccuracy
HEPA Leakage TestATI TDA-2H50–120 µg/L1%
Airflow RateTSI-83800.125–12.5 (m/s)3%
Temperature
Relative Humidity
Pressurization
TSI-9555-P−10~60 (℃),
0–100 (%RH)
−3735~+3735 Pa
0.3 ℃
3% RH
1 Pa
Particle CountsBeckman Counter 34130.3, 0.5, 1, 3, 5, 10 µm5%
Table 2. The boundary condition for numerical simulations.
ParameterTypeValue
Supply AirVelocity InletVelocity: 0.205 m/s
Temperature: 19.2 °C
Concentration: 400 ppm
Return AirPressure OutletTemperature: 24 °C
Pressure: −8.2 Pa
Machine 1WallHeat Flux: 21.2 W/m2
Machine 2WallHeat Flux: 33.0 W/m2
Machine 3WallHeat Flux: 36.3 W/m2
WallsWallHeat Flux: 4.17 W/m2
Table 3. Contamination concentration results at steady-state condition at 450 s.
Cases
Study
Velocity
(m/s)
Average Concentration
at Height 1.4 m
(ppm)
Highest Concentration
at Height 1.4 m
(ppm)
Fluid
Average (ppm)
Case 10.205791093553
0.25494817485
0.30458528456
Case 20.20556876516
0.25481765456
0.30443502431
Case 30.20547821511
0.25483660467
0.30452586441
Publisher’s Note: MDPI stays neutral with regard to jurisdictional claims in published maps and institutional affiliations.

