Article

Contribution of Physical and Chemical Properties to Dithiothreitol-Measured Oxidative Potentials of Atmospheric Aerosol Particles at Urban and Rural Sites in Japan

1
Faculty of Science and Technology, Keio University, 3-14-1, Hiyoshi, Yokohama 223-8522, Japan
2
Institute of Nature and Environmental Technology, Kanazawa University, Kakuma, Kanazawa 920-1192, Japan
*
Author to whom correspondence should be addressed.
Atmosphere 2022, 13(2), 319; https://doi.org/10.3390/atmos13020319
Submission received: 16 January 2022 / Revised: 5 February 2022 / Accepted: 10 February 2022 / Published: 14 February 2022

Abstract

:
Dithiothreitol-measured oxidative potential (OPDTT) can chemically quantify the adverse health effects of atmospheric aerosols. Some chemical species are characterized with DTT activities, and the particle diameter and surface area control DTT oxidizability; however, the physical contribution to OPDTT by atmospheric aerosols is controversial. Therefore, we performed field observations and aerosol sampling at urban and rural sites in Japan to investigate the effect of both physical and chemical properties on the variation in OPDTT of atmospheric aerosols. The shifting degree of the representative diameter to the ultrafine range (i.e., the predominance degree of ultrafine particles) was retrieved from the ratio between the lung-deposited surface area and mass concentrations. The chemical components and OPDTT were also elucidated. We discerned strong positive correlations of K, Mn, Pb, NH4+, SO42−, and pyrolyzable organic carbon with OPDTT. Hence, anthropogenic combustion, the iron–steel industry, and secondary organic aerosols were the major emission sources governing OPDTT variations. The increased specific surface area did not lead to the increase in the OPDTT of atmospheric aerosols, despite the existing relevance of the surface area of water-insoluble particles to DTT oxidizability. Overall, the OPDTT of atmospheric aerosols can be estimated by the mass of chemical components related to OPDTT variation, owing to numerous factors controlling DTT oxidizability (e.g., strong contribution of water-soluble particles). Our findings can be used to estimate OPDTT via several physicochemical parameters without its direct measurement.

1. Introduction

Atmospheric aerosol particles cause various adverse effects on human health, especially by triggering respiratory diseases [1,2,3]. The potential effects of particulate matter (PM) on a human body are determined by a combination of particle properties such as number, size, surface area, mass, and chemical composition. To this end, numerous physicochemical parameters of aerosol particles have been extensively studied and monitored worldwide to evaluate their toxicity [4,5,6]. Among these parameters, many current controls for health protection have been formulated based on the mass concentration of PM2.5, regardless of their size distribution and chemical composition, associated with aerosol emission sources. Although the mass of PM typically exhibits a strong correlation with adverse health effects [7], it is necessary to assess its toxicity using indicators that are more intrinsically related to human health, due to the complexity of the actual mechanisms inducing the adverse effects.
In principle, PM is deposited in a respiratory tract after inhalation, while reactive oxygen species (ROS), including singlet oxygen, hydroxyl radicals, superoxide radicals, hydrogen peroxide, and organic radicals, are considered to be generated in situ by redox-active PM components [8,9,10]. An imbalance between ROS and antioxidants (i.e., oxidative stress) is recognized as one of the main mechanisms behind the adverse health effects of inhaled particles [11,12,13,14]. Hence, oxidative potential (OP), which represents the ability of PM to deplete antioxidants and to generate ROS, has been proposed as a useful indicator. Specifically, it can comprehensively and realistically reflect the properties related to PM-induced health effects [15,16,17]. The dithiothreitol (DTT) assay is an acellular technique that has been widely applied to quantify the OP of aerosol particles [18,19]. DTT consumption rate, which is also known as DTT activity (OPDTT), is associated with the expression of intracellular oxidative stress and inflammation markers, as well as with the cytotoxic responses, thereby proving the biological relevance of this assay [20,21,22].
Although the information on particle components that can oxidize DTT is somewhat scanty, the water-soluble transition metals, such as Cu and Mn, quinones, and humic-like substances (HULIS), have been reported as DTT-active components [19,23]. From the emission source perspective, some studies (at different locations) have reported that the OPDTT of atmospheric aerosol particles is strongly correlated with carbonaceous, polycyclic aromatic hydrocarbons (PAHs), secondary organic aerosols (SOAs), and metals, primarily originating from anthropogenic combustion, traffic emissions, and vehicle primary particles [24,25,26]. The emissions from biomass burning, such as firewood, are also arguably responsible for the majority of the contribution to OPDTT in rural sites [27]. Moreover, chemical aging during the transportation of particles, such as photochemical oxidation of diesel exhaust particles and SOAs, has been reported to significantly enhance DTT consumption by previous studies [28,29,30,31].
Meanwhile, the toxicity of PM can be also characterized by its physical properties, especially by particle size or surface area [32,33]. Several studies have indicated that water-soluble constituents account for the majority of the DTT consumption of atmospheric aerosols [23,25,28]. Meanwhile, other studies have concluded that insoluble particles, particularly, the traffic- and construction-associated particles (e.g., hydrophobic organic compounds, BC, and dust) contribute to around 40% of PM consumption [34,35,36]. It has been also previously suggested that these insoluble particles oxidize DTT because they transform their surface to a reaction field or act as catalysts. Moreover, it has been previously demonstrated that surface reactivity is also important for the redox activity of metal oxide nanoparticles, given the formation of stable oxidative bonds with their surfaces [37]. What is more, the insoluble particles can provide a reaction field for the formation of DTT-active species and more toxic ones, including environmentally persistent free radicals [38,39]. In particular, soot, which originates from the same emission sources as these species and provides a high surface reaction field, can act as an important carrier of these species [40,41]. Consequently, it has been deduced that the OPDTT of insoluble particles, especially ultrafine particles (UFPs) including soot, is potentially related to their active surface sites rather than their mass [14,18].
However, limited studies have investigated the physical contributions on the OPDTT of atmospheric aerosols, despite some indications regarding such possibility in previous laboratory studies, which used single-component particles [33,42]. Although a few studies have already characterized OPDTT by particle size, they merely demonstrated that the particle species that contribute to OPDTT are predominantly clustered in the fine range [34,43]. Thus, we argue that to elucidate the drivers in the OPDTT variation and estimate the OPDTT accurately, it is necessary to understand not only the chemical contributions but also the physical ones to the OPDTT of atmospheric aerosol particles.
For a better estimation of the OPDTT of complicated atmospheric aerosol particles, our study focused on investigating the importance of both physical and chemical properties for the OPDTT variation of atmospheric aerosols. We performed field observations of the mass and lung-deposited surface area (LDSA) concentrations alongside aerosol sampling at urban and rural sites in Japan, where the emission sources contributing to OPDTT can be remarkably different according to a previous simulation [44]. We retrieved the variation in the shifting degree of the representative diameter to the ultrafine range (i.e., the predominance degree of ultrafine particles) from the ratio of the LDSA concentration to the mass concentration (i.e., specific LDSA). Also, the concentration of the main chemical constituents in the collected samples were elucidated. Considering the relationships between these parameters and the OPDTT, our study investigates the physical and chemical contributions to the OPDTT of atmospheric aerosol particles at the two sites. In other words, we assessed how much the potential contribution of particle properties, especially of the physical properties, is reflected in the OPDTT of atmospheric aerosol particles by our field study. Our attempt provides valuable information for a better understanding of the OPDTT of complicated atmospheric aerosol particles and their estimation, which can pave the way toward the most effective means of PM control related to the health effects.

2. Materials and Methods

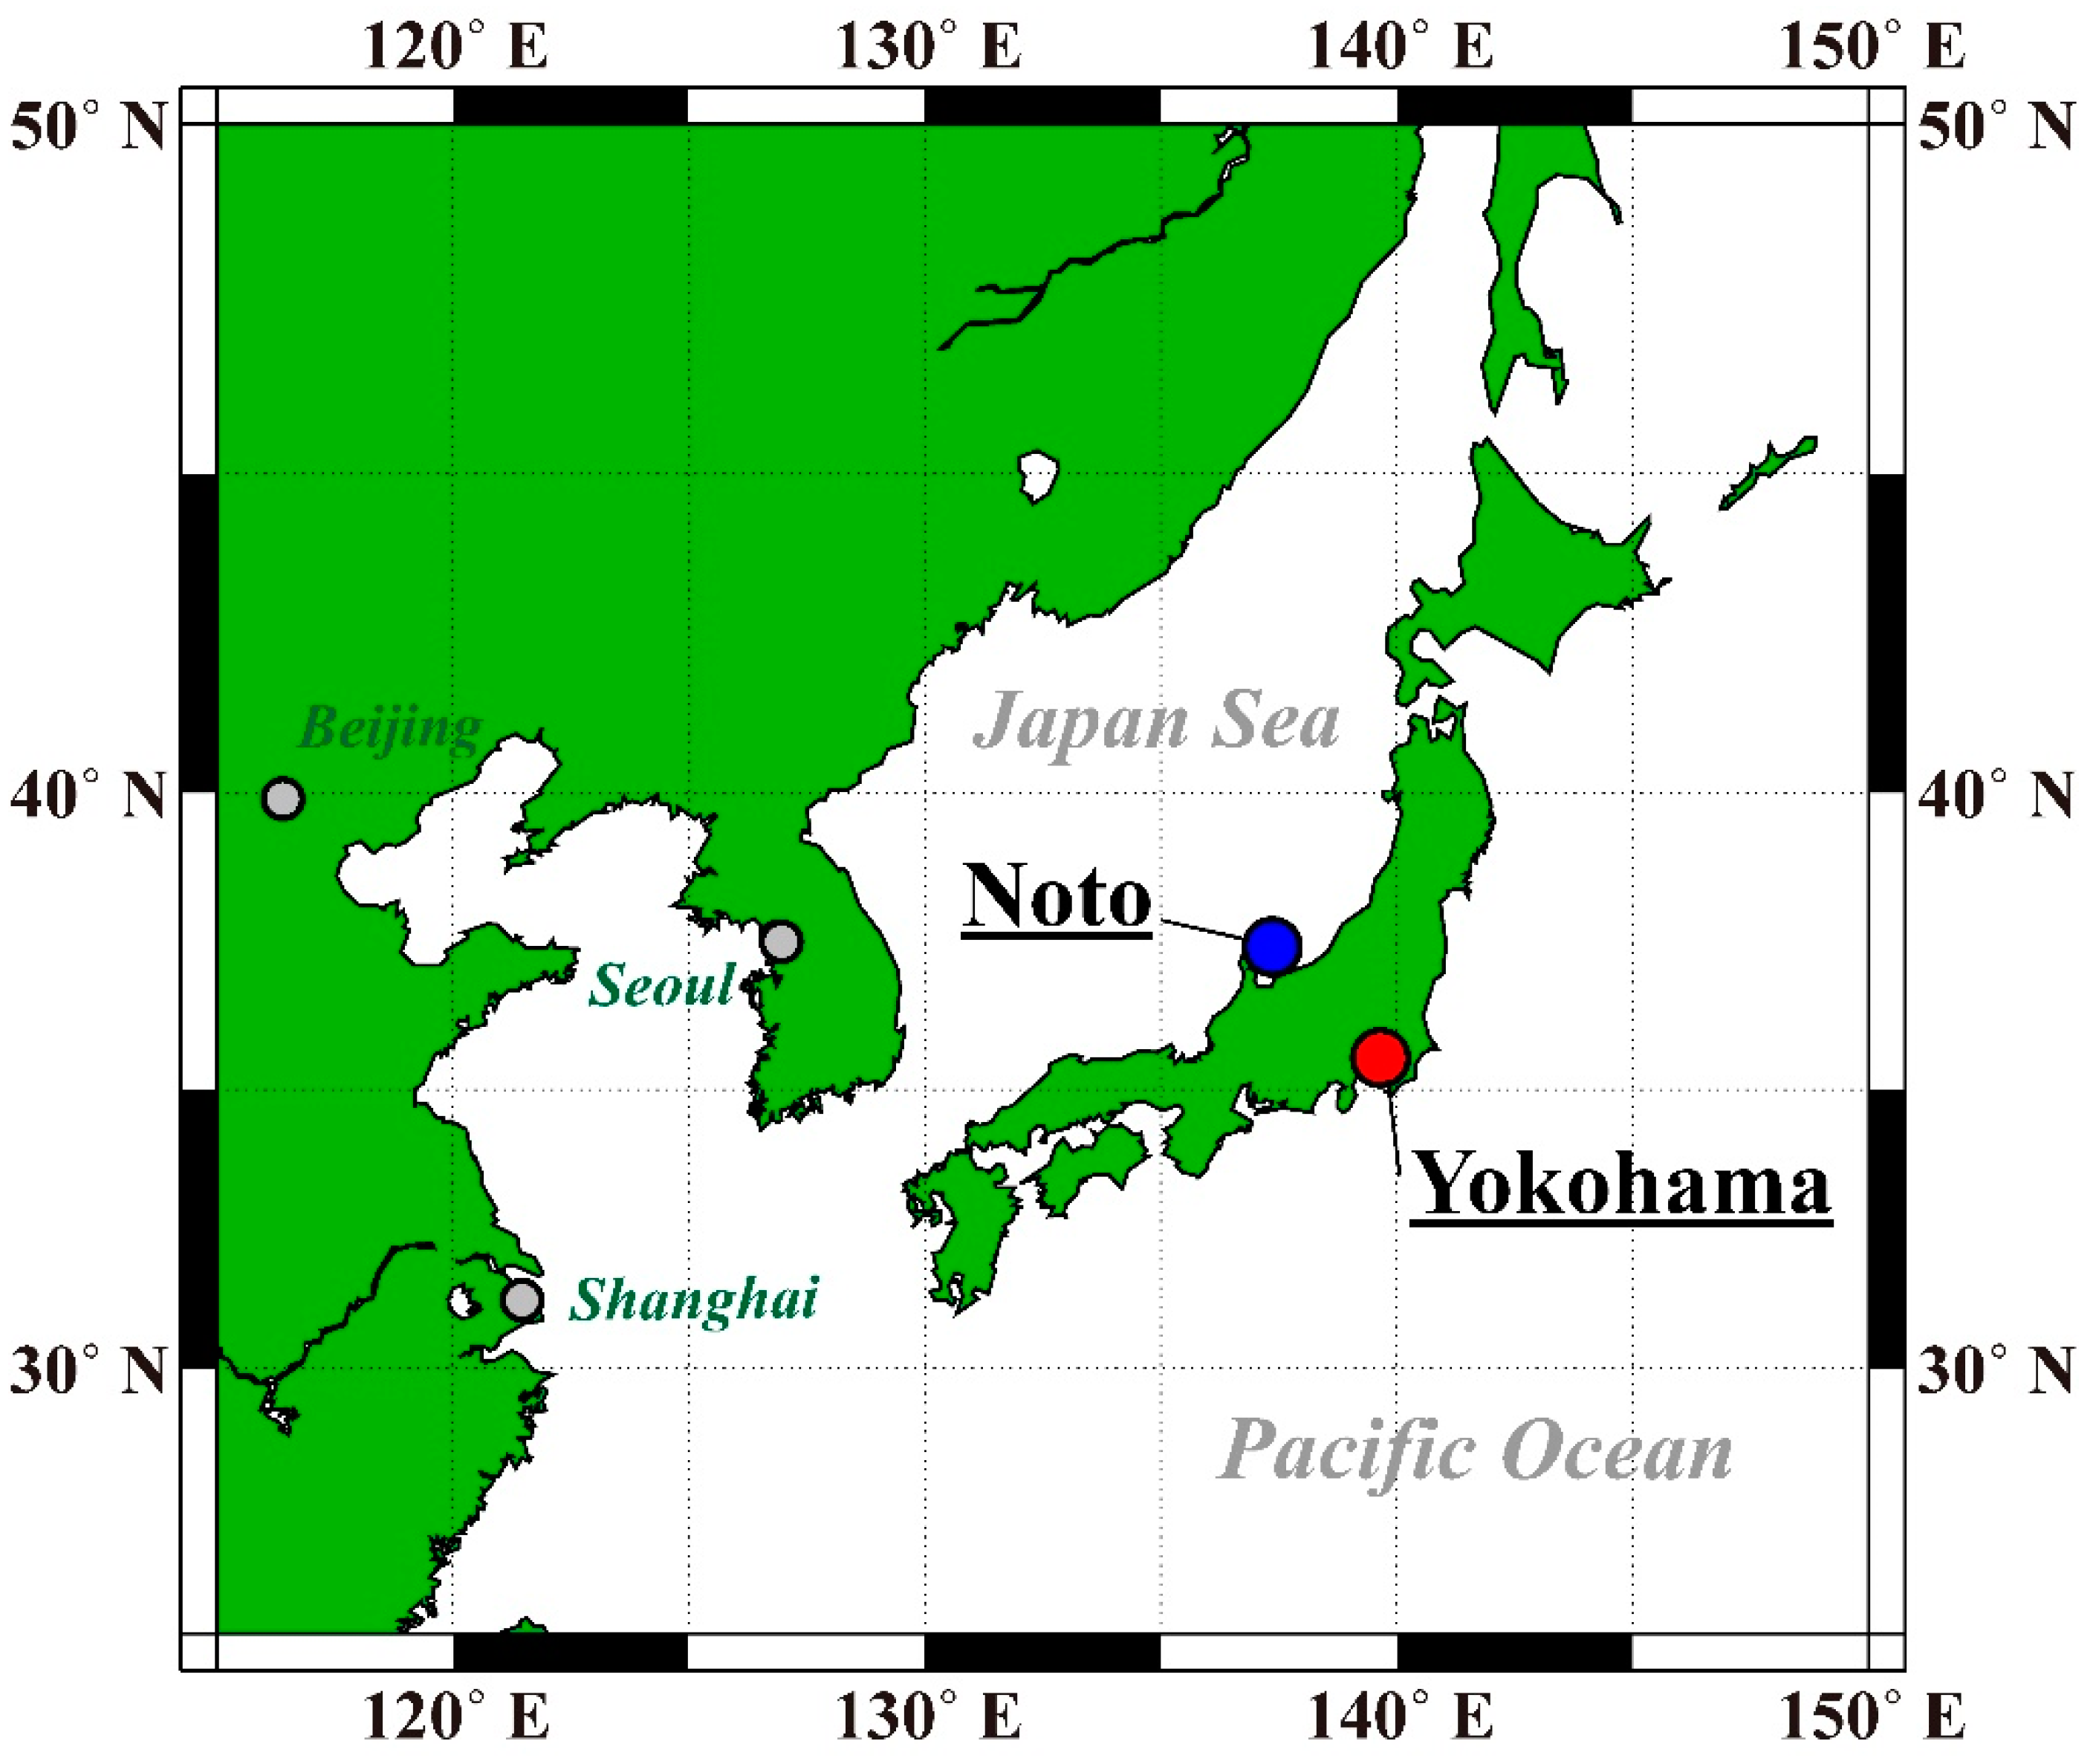
2.1. Sites and Periods of Field Observations and Sampling

Field observations and sampling were performed at the Yokohama (Yagami Campus, Keio University, 35.56° N, 139.66° E) and Noto (Noto Ground-Based Research Observatory: NOTOGRO, Kanazawa University, 36.45° N, 137.36° E) sites in Japan (Figure 1). We continuously measured the physical and chemical parameters of atmospheric particles, such as the LDSA, mass, and black carbon (BC) concentrations, at these sites. Moreover, we conducted aerosol sampling with filters. We further used the collected samples for OPDTT measurements and the chemical component analyses.
The Yokohama observatory is located in the Tokyo Metropolitan Area [45]. The Yokohama site represents one of the largest industrial areas in Japan and is, therefore, strongly affected by anthropogenic emission sources associated with the surrounding industry, commerce, and road traffic. The observations and sampling at the Yokohama site were carried out from 28 September 2020 to 12 June 2021. The Noto observatory is at the tip of the Noto Peninsula and is in a rural area with the minimized influence from anthropogenic activities, including traffic emissions [46,47]. Except in summer, the atmosphere over this rural site is remarkably affected by air mass inflow from around the Asian continent through seasonal monsoons spreading from the continent to the Pacific Ocean [48]. Notably, the observations at the Noto site lasted from 20 September 2020 to 11 June 2021.

2.2. Observations

In this study, two types of physical parameters, reflecting the aerosol load were measured to characterize the OPDTT of atmospheric aerosol particles: the LDSA and mass concentrations of aerosols.
The LDSA concentration was measured using a nanoparticle surface area monitor (NSAM, Model 3550, TSI Inc., Shoreview, MN, USA) through the diffusion-charging (DC) method, according to our previous method [49]. The instrument artificially attached positive ions to particles and retrieved the LDSA concentration from the electrical charge [50,51]. Before the electrical current detection, the excess ions, which were not attached to the particles were removed via an ion trap with an applied voltage of 100 V. Also, the instruments were regularly calibrated using a standard procedure to ensure the accuracy of the measurements. Both the charge and LDSA concentrations measured by the DC method are proportional to the product of 1.13 power of the particle diameter (Dp) and the number concentration (Dp1.13 × n), especially in a size range of 20–400 nm. Therefore, the measured electrical currents are converted to LDSA concentrations by multiplying with a constant [50]. Based on the typical particle size distribution in the atmosphere, the LDSA concentration is fundamentally more sensitive to fine particles than the mass concentration being proportional to Dp3 × n. Given their relationships, the LDSA concentration has received increased attention as a parameter to sensitively monitor the toxicity of nanoparticles.
The mass concentration of particles with the diameter of ≤2.5 μm (PM2.5) was retrieved from the atmospheric environmental regional observation system (AEROS), which is operated by the Ministry of Environment in Japan. In this study, we used the data from the Kohoku Ward Office, Kanagawa (Yokohama) and Suzu, Ishikawa (Noto) because these are the closest monitoring stations, which perform the required measurements for our study.
The specific LDSA, defined as the ratio of the LDSA concentration to the mass concentration, is approximately inversely proportional to the representative diameter squared. Hence, this metric can be used to continuously capture the variations in the representative diameter of the particle size distribution in the atmosphere. The specific LDSA exhibits high sensitivity to the predominance of fine particles because it strongly varies when the representative diameter is shifted to the fine size range. In this study, we defined the specific LDSA as the ratio of the LDSA concentration of PM1.0 to the mass concentration of PM2.5 due to the lack of PM1.0 mass data. We must note that the absolute values of the specific LDSA used in this study were different from those in our previous study [49] due to the differences in the measured particle size range. However, the contribution of particles in a size range of 1–2.5 μm to the PM2.5 mass concentration is small based on a general mass concentration distribution of the atmospheric aerosols [52,53]. In fact, some previous observations performed in Japan reported a strong correlation between the PM1.0 and PM2.5 mass concentrations (R > 0.9) and an almost constant ratio of the PM1.0 mass to the PM2.5 mass (0.7–0.8) [54,55]. Therefore, we argue that the specific LDSA elucidated in this study certainly reflected the relative variations in the size distribution of atmospheric aerosols.
The mass concentration of BC was continuously monitored by using a microAeth (Model AE51, AethLabs, San Francisco, CA, USA) at the Yokohama site, and a multiangle absorption photometer (MAAP, Model 5012, Thermo Fisher Scientific Inc., Waltham, MA, USA) at the Noto site. Additionally, the particle size distribution was intermittently measured by a scanning mobility particle analyzer (SMPS) as the auxiliary observation data at both sites. A NanoScan SMPS (Model 3910, TSI Inc., Shoreview, MN, USA) was utilized at the Yokohama site, while a differential mobility analyzer (DMA, Model 3080 + 3081, TSI Inc., Shoreview, MN, USA), connected to a condensation particle counter (CPC, Model 3776, TSI Inc., Shoreview, MN, USA) was used at the Noto site.
In addition to these observations, we analyzed hourly wind velocity and direction data acquired from the Automated Meteorological Data Acquisition System (AMeDAS) of the Japan Meteorological Agency (JMA). These public meteorological data were obtained from Yokohama and Suzu (Noto), which were the closest monitoring sites to our observation sites. The hourly wind data were averaged with daily resolution to capture the seasonal variations. Moreover, we analyzed backward trajectories for air mass arrivals at 500 m from each site during the measurement campaigns using the Hybrid Single-Particle Lagrangian Integrated Trajectory (HYSPLIT) model developed by the National Oceanic and Atmospheric Administration (NOAA) (redrawn from http://ready.arl.noaa.gov/HYSPLIT.php (accessed on 30 August 2021) [56,57]). The backward trajectories were obtained every 1 h during each sampling period. We determined the air mass locations with 1-h resolution and obtained 72 positions for each trajectory. The trajectories determined over 72 h were classified into three groups at both sites, based on the sectors to which most of the 72 positions in each trajectory belonged (Supplementary Materials Figure S1). Consequently, we obtained the proportions of the sectors, from which the trajectories inflowed, for each sampling campaign.

2.3. Aerosol Sampling

Atmospheric aerosol particles passing through an impactor with a 50% cut-off diameter of 1 μm were collected on two types of filters with 47 mmφ (polycarbonate and quartz fiber filters) at both sites. The ambient air was drawn at 16.7 L min−1, controlled by using calibrated critical orifices [58]. The collection period per sample ranged from three days to a week, depending on the amounts of collected particles. At the Yokohama site, the samples were collected from the fifth-floor balcony of a building at the Yagami Campus of Keio University. The sampling at this site was carried out 32 times during the observation period from September 2020 to June 2021. At the Noto site, we collected the samples by using a self-made auto sampler on the rooftop of NOTOGRO. The sampler included such functions as flow rate control and particle classification, similar to the sampling at the urban site. It was also capable of collecting samples for 10 periods by remote PC control of solenoid valves. At the site, the samples were collected 23 times during the observation period.
The samples collected on polycarbonate filter samples were used for OPDTT measurement and elemental analysis, whereas those on quartz fiber filters were used for the analyses of water-soluble inorganic ions and EC/OC. The detailed procedures for each measurement are described in the following sections.

2.4. Oxidative Potential Measurement (DTT Assay)

DTT-based oxidative potential (OPDTT) was measured on each third of the 47-mmφ samples, collected by using polycarbonate filters after the elemental analysis. In many previous studies, particles on filters are extracted in pure water, and the insoluble fraction in the suspension is removed by filtration in the DTT assay [59,60]. However, in this study, we measured the total oxidative potentials without the filtration of insoluble constituents to elucidate the physical contribution of particles, including insoluble components, to OPDTT. The filter portions were sonicated in 3.8 mL of potassium phosphate buffer (pH 7.4, Chelex-resin treated [23]) for 15 min at a temperature of <10 °C. Half of the 3.8-mL aerosol suspension was fractionated into a microtube. Then, DTT (1 mM, 100 µL) was added to the final concentration of 50 µM. The total of 2.0 mL of solution was incubated at 37 °C for 6 min in a thermo block (ND-M01, NISSIN, Tokyo, Japan). Then, the sufficient 5,5-dithiobis-(2-nitrobenzoic acid) (DTNB, 6.25 mM, 20 µL) was added until the solution became yellow. After the centrifugation, 200-µL samples of the solution were placed in the wells of a 96-well plate. Then, the absorbance was measured at 415 nm with a microplate reader (MPR-A100, AS ONE Corp., Osaka, Japan) to determine the amount of residual DTT in the solution. We simultaneously analyzed standard solutions at four DTT concentrations (5, 12.5, 25, and 50 μM) with measurement samples and also determined the calibration curve between the DTT concentration and absorbance. Operating blanks with a polycarbonate filter were also analyzed with the samples, while the DTT consumption of the filter blanks was subtracted from those of the measurement samples.
Besides the atmospheric aerosol samples collected at the two sites, the DTT oxidizability of several single-component particles and standard materials was investigated in this study. To this end, we utilized six typical and main components of atmospheric aerosols (quartz (SiO2), kaolinite (Al4Si4O10(OH)8), graphite (heat-treated at 450 °C for 6 h) as a substitute for BC, ammonium sulfate ((NH4)2SO4), ammonium nitrate (NH4NO3), and oxalic acid (COOH)2)), and nine other compounds (potassium chloride (KCl), potassium sulfate (K2SO4), manganese(II,III) oxide (Mn3O4), manganese(IV) oxide (MnO2), manganese(II) sulfate (MnSO4), zinc oxide (ZnO), zinc sulfate (ZnSO4), lead(IV) oxide (PbO2), and humic acid) as single-component particles. In addition, NIES CRM#28, NIES CRM#30, and Arizona test dust (ATD) were applied as standard materials. Note that CRM#28 consists of atmospheric PM, collected on the filters in a central ventilation system in a building in the city of Beijing (China). Meanwhile, CRM#30 is an Asian mineral dust from arid regions of the Gobi Desert, located in northeast Asia. ATD is a proxy for atmospheric mineral dust because it contains numerous metals, found in naturally occurring mineral dust aerosols [61]. The final measure of the OPDTT was corrected by using a blank measure without filters.
Furthermore, we investigated the potential contribution of physical properties to DTT oxidizability of insoluble particles, using three types of MnO2 particles with different representative diameters. MnO2 particles with different size distributions were prepared according to the following procedure. First, the particles were suspended in pure water (ρ = 1.00 g cm−3 and η = 0.01 g cm−1 s−1), which were then mechanically dispersed using an ultrasonic generator. Afterward, the particles in the suspensions were centrifugally classified via the high-speed centrifuge, called Microfuge 16 (Beckman Coulter Inc., Pasadena, CA, USA), with the maximum and minimum slewing radii of 6.6 and 3.0 cm. We classified the particles into three size ranges with Stokes diameters of <1 µm, >5 µm, and >10 µm based on the rotation speed and centrifugation time at which they theoretically settled. After desiccation and resuspension of the classified particles, the size distributions of the three types of MnO2 particles were measured using a laser diffraction/scattering particle size analyzer, Partica (LA-960V2, HORIBA, Kyoto, Japan) (Figure S2). The volume median diameters (VMDs) obtained from the size distributions were 1.51, 3.13, and 7.15 µm. The actual particle size distribution differed from the theoretically calculated results; however, three MnO2 particles obviously have different size distributions. Assuming ideal spherical particles, their specific surface areas calculated based on the density (ρ = 5.02 g cm−3) and size distributions were 0.846, 0.482, and 0.164 m2 g−1. We prepared the suspensions of 10, 20, 30, 40, and 50 μg mL−1 for each type of MnO2 particle to measure OPDTT.

2.5. Chemical Component Analysis

The samples, collected by polycarbonate filters were used for the elemental analysis before cutting for the DTT assay. Meanwhile, the samples on the quartz fiber filters were cut into three pieces during the measurement of their weight. Then, two pieces were used for the analyses of water-soluble inorganic ions and EC/OC. The detailed procedures for each chemical component analysis are provided below.
The elemental analysis of the samples was conducted without any pretreatment by using an energy-dispersive X-ray fluorescence spectrometer (EDXL300/NEX CG, Rigaku Inc., Tokyo, Japan) [62]. An X-ray tube (Imax = 2 mA, Vmax = 50 kV) with a 50 W Pd anode was used to emit primary radiation. EDXL300 was equipped with three-dimensional (Cartesian geometry) polarization optics and secondary targets, enabling the excitation source to be optimized for the desired analyses. We used three secondary targets (Mo, Cu, and RX9 [graphite crystal]), with durations of 400, 400, and 100 s, respectively. The quantification of each element in the filter samples was performed by using the fundamental parameter method, Rigaku Profile Fitting-Spectra Quant X (RPF-SQX). In total, 17 elements (Cl, Mg, Al, Si, P, S, K, Ca, Ti, V, Cr, Mn, Fe, Ni, Cu, Zn, and Pb) were measured in this study. To verify the instrument conditions, NIST SRM#2783 (air particulate on filter media) was analyzed for each measurement.
Water-soluble inorganic ions in the samples collected using quartz fiber filters were extracted by mechanical shaking (15 min × 2) with deionized water (6 mL, 18.2 MΩ cm). The ion components in the extracts were analyzed via ion chromatography (cation: ICS-1100, anion: ICS-1100, Thermo Fisher Scientific Inc., Waltham, MA, USA) using ion exchange columns (cation: Dionex IonPacTM CS12A and CG12A, anion: Dionex IonPacTM AS18 and AG18, Thermo Fisher Scientific Inc., MA, USA). In total, we analyzed eight ion components in this study: Na+, NH4+, K+, Ca2+, Mg2+, Cl, NO3, and SO42−.
EC/OC in the filter samples was measured according to the Interagency Monitoring of Protected Visual Environments thermal/optical reflectance (IMPROVE-TOR) protocol using an EC/OC analyzer (Sunset Laboratory Inc., Tigard, OR, USA). Four OC fractions (OC1, OC2, OC3, and OC4) were measured at 120, 250, 450, and 550 °C in an He atmosphere. The pyrolyzed organic carbon (OCpyro) fraction was defined as the carbon quantity before a split point when the laser light reflectance attained its initial intensity after O2 was added to the analysis atmosphere. Three EC fractions (EC1, EC2, and EC3) were determined at 550, 700, and 800 °C in a 98% He/2% O2 atmosphere. Then, the fraction of corrected EC1 (EC1corr) was calculated as EC1 − OCpyro. The analyzer was calibrated by measuring the known quantities of CH4. In all the procedures, blank filters were also analyzed with the measurement samples. At last, the concentrations of each EC/OC fraction were corrected by using corresponding blank measurements.

3. Results and Discussion

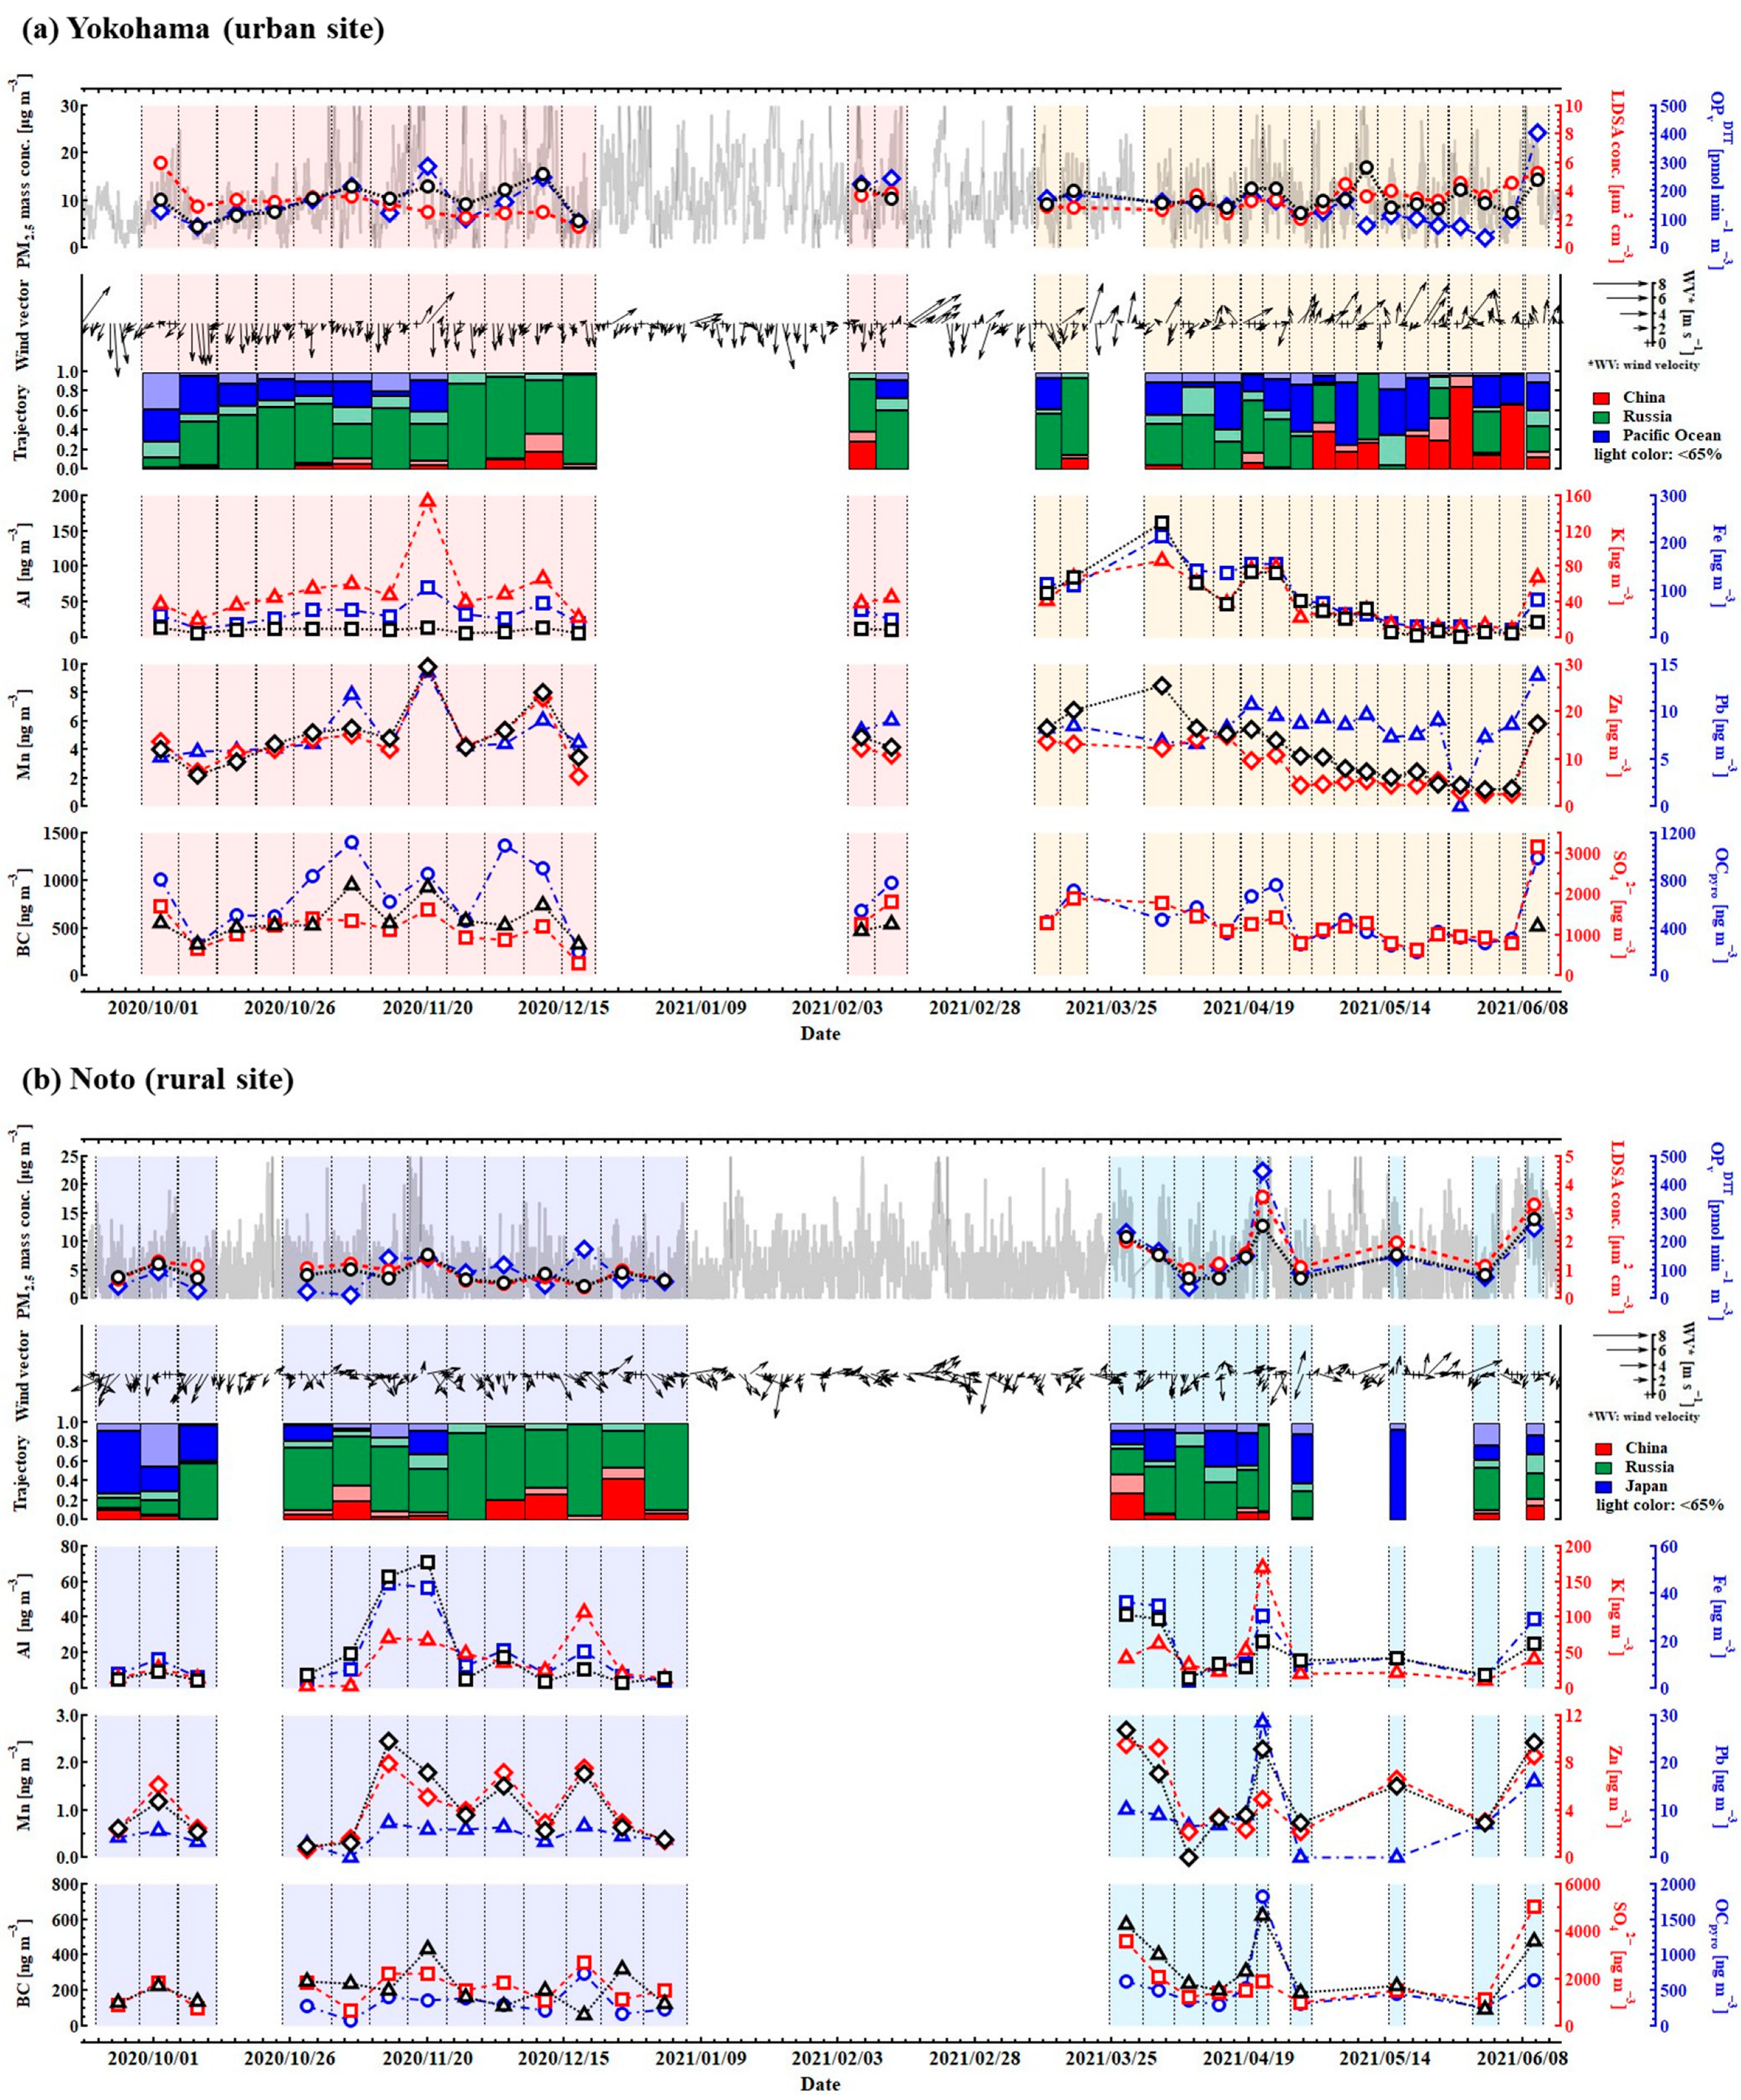
3.1. Regional Differences in Physicochemical Properties and OPDTT

First, we analyzed the temporal variations of the observed physical parameters, related to the particle amount at the two sites, as shown in Figure 2. The average PM2.5 mass and LDSA concentrations during the sampling period were 10.3 ± 2.8 µg m−3 and 3.36 ± 0.94 µm2 cm−3, respectively (for the Yokohama site). For the Noto site, they were 5.6 ± 3.2 µg m−3 and 1.31 ± 0.79 µm2 cm−3, respectively. Notably, both types of particle concentrations were higher at the urban site, suggesting exposure to neighboring local anthropogenic emissions. Focusing on the differences between the sampling periods, the PM2.5 mass concentration tended to slightly increase in winter at the urban site, and in spring at the rural site. The LDSA concentration declined in winter at the urban site. At the rural site, it increased in spring, while exhibiting an increase in the mass concentration. The average specific LDSAs, defined as the ratio of the LDSA concentration to the PM2.5 mass concentration, were 0.35 ± 0.12 and 0.23 ± 0.05 m2 g−1 at the urban and rural sites, respectively. Given the relationship between the specific LDSA and the representative diameter, the urban Yokohama site experienced frequent periods with the shifting of representative diameter to the ultrafine range, compared with the rural Noto site, which had few local anthropogenic emissions. This result and the difference between the sites resonate with previous findings, reported from many other urban and rural sites worldwide [63,64,65]. The seasonal variations in the specific LDSA at the rural site were minor during the observation period as indicated in its small standard deviation. This is because the site was dominated by particles aged and grown during transportation from the continent from autumn to spring, as indicated in our previous study [49]. In contrast, relatively high specific LDSAs were observed during autumn at the urban site. Unlike the rural Noto site, some size distribution data from the SMPS during these periods virtually supported the tendency of the specific LDSA at the urban Yokohama site.
Second, we analyzed the regional tendencies in the concentrations of chemical components. Temporal variations of the concentrations in several components (Al, K, Mn, Fe, Zn, Pb, SO42−, BC, and OCpyro) are shown in Figure 2. The concentrations of water-soluble sulfate ions were 1240 ± 510 and 1770 ± 980 ng m−3 at the urban and rural sites, respectively. The tendency that the sulfate concentration was higher at the rural site than the urban site is similar to the previously reported results from a municipality and previous studies [47,66,67]. At the Noto site, the oxidation and chemical reaction of SOx, emitted from urban areas in the continent, promote the formation of sulfate particles, especially from autumn to spring when the air mass is predominantly transported from the continent by westerlies, as with other Japanese sites, located on the Japan Sea [68]. Notably, the increase in particles transported from the continent (e.g., sulfate and BC) in spring can explain the above-mentioned increase in the PM2.5 mass and LDSA concentrations at the rural site in the same season. Meanwhile, at the urban site, the concentration of nitrate exhibited a typical increase in winter due to the progression of its formation with a drop in temperature [69] (Figure S3). In addition, the decline in the height of the planetary boundary layer may also explain a slight increase in the PM2.5 mass concentration in winter [70]. Surprisingly, on the other hand, the LDSA concentration decreased during this period. Therefore, nitrate particles may have been formed by the partitioning of nitrate gases into existing particles, thereby leading to low specific LDSAs in winter. This possibility is supported by the negative correlation between the nitrate proportion and specific LDSA (R = −0.37). The average concentrations of Al and Si, which are the indicators of mineral dust, were both higher at the urban site (e.g., Si: 68.8 ± 86.7 ng m−3 at the urban site and 52.9 ± 43.3 ng m−3 at the rural site), whereas their average proportions to the PM2.5 mass were slightly higher at the Noto site (e.g., Si: 0.67 ± 0.85% at the urban site and 1.06 ± 0.97% at the rural site). In particular, we identified a period in which there were remarkably high concentrations of Al and Si at both sites in response to the arrival of Asian dust from the continent. On 31 March 2021, when high concentrations were recorded, the arrival of Asian dust was announced by the JMA all over Japan, including Tokyo. At the Noto site, the concentrations of these elements were high in November. Although the JMA has not announced the Asian dust arrival, their high concentrations were suggested to be caused by the air mass arrivals from the continent. This conclusion was based on the results of wide-area simulations such as the Chemical Weather Forecasting System (CFORCE) and Visual Atmospheric Environment Utility System, which are operated by the Ministry of the Environment in Japan (VENUS). Therefore, the distinctive increases in Al and Si were suggested to be mainly caused by the mineral dust particles originating from the continent. The concentrations of heavy metals, such as Fe, Cu, Mn, Zn, and Pb, were high at the urban site, indicating the effect of anthropogenic emissions, although seasonal variations differed from each other (e.g., Mn: 4.20 ± 2.15 ng m−3 at the urban site and 1.19 ± 0.78 ng m−3 at the rural site). The average concentration of K, derived from combustion sources and mineral dust, was 43.9 ± 29.4 and 42.1 ± 37.3 ng m−3 at the urban and rural sites, respectively. Despite the small regional difference, the potassium concentration was relatively low at the urban site in spring. The EC/OC concentrations were high at the urban site, especially in autumn. In particular, the concentration and proportion of EC2 increased corresponding to the increase in the LDSA concentration and specific LDSA, respectively, during the autumn. Given that EC2 is a tracer for traffic emissions [71], the high contribution of vehicle exhaust particles was thought to be one of the reasons causing the abovementioned increase in the specific LDSA in autumn. At the rural site, despite the extremely high identified EC/OC concentrations (which correspond to the high PM2.5 concentration on 20 April 2021), their seasonal differences were not distinct on average. According to the detailed classification of the EC/OC fractions, the most distinctive difference was discerned in OCpyro. OCpyro is pyrolyzed (i.e., charred) organic carbon, and primarily consists of water-soluble organic compounds with a relatively high oxidation degree and low volatility, such as dicarboxylic acids [72]. The concentration of this fraction decreased at the urban site in autumn and spring. In contrast, the highest OCpyro concentration was found in spring at the rural site. At the Noto site, this OC fraction was thought to be increased in spring due to long-range transportation, given the previous observation results [73]. Overall, the differences in the chemical composition depending on the sampling periods at the two sites corresponded to the typical seasonal trends at urban and rural sites in Japan. Further studies over a long period are required to accurately understand the seasonal variation in these physicochemical parameters, although they are beyond the scope of our work. However, the particles collected in this study were different at least depending on the sampling sites and periods.
Furthermore, we found that OPvDTT (OPDTT per unit air volume) was 153 ± 74 and 119 ± 96 pmol min−1 m−3 at the Yokohama and Noto sites, respectively. From a seasonal perspective, it tended to increase in winter at the urban site, while the high OPvDTT periods were found in spring at the rural site. We compared the relationships between OPvDTT and two types of particle concentrations to elucidate the dependency of OPvDTT on the particle amount (Figure 3). The correlation coefficients of OPvDTT with the PM2.5 mass and LDSA concentration were 0.62 and 0.43, respectively. Thus, OPvDTT was better explained by the PM2.5 mass concentration than the LDSA concentration. However, there were several samples where OPvDTT was not simply explained by particle concentrations (e.g., samples during the periods with low particle concentrations at the rural site). The average values of OPvDTT divided by the PM2.5 mass concentration (i.e., OPmDTT) were 14.9 ± 5.0 pmol min−1 µg−1 at the urban site, and 22.6 ± 16.8 pmol min−1 µg−1 at the rural site. Moreover, OPmDTT at the rural Noto site exhibited a greater variation (variation coefficient is 34% at the urban site, and 74% at the rural site), and 1.5 times higher in average, compared with that at the urban site. In other words, although OPvDTT was higher at the urban site owing to the strong correlation with the particle amount, especially with the mass concentration of PM2.5, OPmDTT (OPDTT per unit mass) was relatively high at the rural site. Note that our study was limited because we could not immediately store the filter samples after each sampling due to the remote collection. Thus, we acknowledge the potential underestimation of OPDTT due to the loss of semivolatile DTT-active species. Despite this possibility, the OPmDTT, retrieved in this study (15–25 pmol min1 µg1), fell within the range of a typical DTT consumption rate in urban environments (20–80 pmol min−1 µg−1) [8]. In Japan, some studies have already quantified the OPmDTT of fine particles, collected at intersections and in residential areas and of particles during periods of Asian dust arrivals [74,75]. Compared to the results in these characteristic environments (40–55 pmol min1 µg1), the OPmDTT at the sampling sites was a little lower, although the size range of the collected particles was different.

3.2. Contribution of Chemical Properties to the Variation in OPDTT

As mentioned, OPvDTT roughly increased, along with the growth in the mass concentration of PM2.5, at each site. However, its relevance to the mass concentration of PM2.5, which contains various particles, could be merely an integrated result, derived from some factors of atmospheric aerosol particles, as OPDTT potentially depends on both the physical and chemical properties of particles. In fact, the OPvDTT of the samples at the urban site and those with low particle amounts at the rural site were not simply explained by these particle concentrations. It has been previously suggested that OPDTT is characterized by the particle species [8,19,23]. Therefore, we characterized the variation factors of OPvDTT at both sites according to the correlations between OPvDTT and the concentrations of the chemical components (Table 1 and Table S1). Notably, it is not possible to compare the correlation coefficients (R) between the two sites, since they have different numbers of samples and different variations in OPvDTT and in the concentrations of chemical components. As shown in Section 3.1, OPvDTT at the rural Noto site exhibited a wide range of variations. In contrast, the correlation coefficients at the urban Yokohama site were unlikely high, given the small variations. Although the tendency of chemical constituents of atmospheric aerosol particles differed depending on the site, the components correlated with the OPvDTT were roughly the same at both sites. Namely, at the urban site, chemical components showing high positive correlations with OPvDTT (R > 0.65) were S (R = 0.79), SO42− (R = 0.79), NH4+ (R = 0.78), OCpyro (R = 0.72), Zn (R = 0.71), Mn (R = 0.69), K (R = 0.66), and Pb (R = 0.65). In contrast, the high positive correlations (R > 0.75) were discerned in OCpyro (R = 0.93), OC4 (R = 0.91), Pb (R = 0.89), OC3 (R = 0.88), K (R = 0.84), Mn (R = 0.80), and non-sea salt (nss) K+ (R = 0.79) at the rural site. The stronger correlations of these chemical constituents than the PM2.5 and LDSA concentrations at each site suggest that it is difficult to characterize OPDTT merely by the total amount of particles containing various species. In other words, these results revealed the importance of certain chemical components. In particular, the contribution of these species was considered to be especially important for the samples at the urban site and those with low particle concentrations at the rural site. Note that the strong correlations of chemical components do not necessarily confirm the direct redox activity of these species. However, the importance of these limited components is a useful findings leading to a better estimation of OPDTT using some observable or analyzable parameters.
DTT oxidizability differs depending on the chemical species. In our verification experiment, manganese compounds exhibited high DTT activity, regardless of the chemical compositions (Figure S4). Previous studies have reported the high reactivity of water-soluble Cu and Mn, which confirm the robustness of our results. In contrast, lead and zinc compounds have not exhibited any remarkable DTT oxidizability. This finding is also in line with the results of previous studies, which reported on the low reactivities of these metals, although the chemical composition of the compounds used in such studies was different from ours [23]. Hence, manganese may have demonstrated a strong correlation with OPvDTT at both sites due to its direct redox activity.
Of the chemical components with strong correlations with OPvDTT, neither ammonium sulfate nor potassium salts (KCl and K2SO4) experimentally exhibited direct oxidation of DTT (Figure S4). These results are notably in line with some previous findings [75,76,77]. Also, not all compounds in OCpyro, which showed strong correlations with OPvDTT at both sites, are characterized with the DTT oxidizability, while limited components contained in this fraction such as quinones, HULIS, and some SOAs are known to be capable of oxidizing DTT [19,35,78]. Therefore, the correlations of these chemical components with OPvDTT do not necessarily explain the direct factors of variation in OPvDTT. However, chemical components, exhibiting high correlation with OPvDTT at both sites, were similar to each other (e.g., K, Mn, Pb, and OCpyro) despite regional differences in particle species and their concentrations, which is consistent with the previously reported results from various sites [26,36,74,79]. Hence, our results underline the importance of the limited chemical components to OPDTT, regardless of the region.
Although the chemical components strongly correlated with OPvDTT were similar at both sites, the sources governing the variation in OPvDTT were suggested to be different between the sites and seasons, according to the cross-correlations between the chemical components and geographic evidence.
At the urban site, strong correlations with OPvDTT were discerned in the representative components of secondary aerosols, such as S, SO42−, NH4+, and OCpyro. In particular, these components were remarkably strongly correlated with each other in spring (R > 0.85) (Table 1). OCpyro primarily consists of water-soluble organic compounds into which VOCs are transformed through a secondary formation process, such as dicarboxylic acids [80]. These highly oxidized organic compounds have been previously reported to contribute to DTT oxidation [81]. Therefore, some (or most) of the organic compounds derived from various sources could induce the strong correlation between OCpyro and OPvDTT. In contrast, our laboratory experiment and other previous studies have demonstrated that ammonium sulfate does not exhibit any DTT oxidizability [75,77] (Figure S4). However, hygroscopic ammonium sulfate aerosols have been previously suggested to enhance the gas-to-particle partitioning of organics by inducing interfacial attraction, thereby accelerating the SOA formation [82,83]. In particular, most particles and VOCs are accompanied by sulfate, which accounts for the majority of particles in urban areas. Therefore, the strong correlations of NH4+ and SO42 with OPDTT and the strong correlation between these ions and OCpyro likely resulted from the contribution of sulfate to the SOA formation. Furthermore, the increased acidity due to the increase in sulfate can enhance the OPDTT of particles because of the chemical alteration of metallic compounds [59]. Although the concentration of sulfate at the urban site was similar to that at the rural site, the particles collected at the urban site contained many metals, as discussed in Section 3.1. Despite the weak correlations between transition metals and OPvDTT at the urban site, the strong correlation between sulfate and OPvDTT suggests that the OPvDTT variation was driven by metal compounds bound to sulfate.
Table 1. Chemical components exhibiting high correlations with OPvDTT and cross-correlations of those components: (a) the Yokohama site; (b) the Noto site. The correlation coefficient, R, in a parenthesis represents the coefficient between each component and OPvDTT. The non-sea salt (nss) K+ was determined using Na+ as a reference element for a marine origin [84], and (K+/Na+) values for seawater were from Keene et al. [85].
(a) Yokohama
All SamplesAutumn/WinterSpring
Component Cross-Correlation
(R > 0.8)
Component Cross-Correlation
(R > 0.8)
Component Cross-Correlation
(R > 0.8)
SO42−
(R = 0.79)
SPb
(R = 0.83)
BC, KS
(R = 0.90)
SO42−, NH4+, OCpyro
S
(R = 0.79)
SO42−Ca
(R = 0.82)
TiSO42−
(R = 0.88)
NH4+, S, OCpyro
NH4+
(R = 0.78)
OCpyroTi
(R = 0.82)
CaNH4+
(R = 0.87)
SO42−, S, OCpyro
OCpyro
(R = 0.72)
NH4+Mn
(R = 0.80)
Zn, Fe, K, CuOCpyro
(R = 0.84)
NH4+, SO42−, S
Zn
(R = 0.72)
Mn, KFe
(R = 0.78)
Mn, Zn, K, BCZn
(R = 0.76)
Mn
Mn
(R = 0.69)
K, ZnZn
(R = 0.74)
Mn, K, Fe, Cu, BC
K
(R = 0.66)
Mn, Zn
Pb
(R = 0.65)
N/A
(b) Noto
All samplesAutumn/WinterSpring
(without the Extremely High OPvDTT Sample)
Component Cross-Correlation
(R > 0.85)
Component Cross-Correlation
(R > 0.85)
Component Cross-Correlation
(R > 0.85)
OCpyro
(R = 0.93)
OC3, OC4, nss-K+, Pb, KK
(R = 0.93)
OCpyro, EC1corrMn
(R = 0.96)
Zn, Fe, Al, SO42−
OC4
(R = 0.91)
OC3, OCpyroMn
(R = 0.91)
S, Zn, Fe, MgOCpyro
(R = 0.89)
BC
Pb
(R = 0.89)
OCpyroS
(R = 0.91)
Mn, Zn, Pb, MgSO42−
(R = 0.88)
NH4+, OC2, S, Mn
OC3
(R = 0.88)
OCpyro, OC4, nss-K+Zn
(R = 0.90)
Mn, S, NH4+NH4+
(R = 0.88)
SO42−, OC2, S
K
(R = 0.84)
nss-K+, EC1corr, OCpyroPb
(R = 0.89)
S
Mn
(R = 0.80)
Fe, Zn
nss-K+
(R = 0.79)
K, EC1corr, OCpyro, OC3
Lead and potassium, showing strong correlations with OPvDTT, were relatively strongly correlated (R > 0.5) with BC at the urban site. In particular, the cross-correlation between these three components was remarkably strong in autumn and winter (R > 0.8) (Table 1). Generally, lead in the atmosphere arguably originates from from industrial processes, road dust, coal combustion, waste incineration, and leaded gasoline [86,87]. At the same time, however, the strong cross-correlation between Pb, K, and BC suggests the contribution of coal combustion and waste incineration [87,88]. The urban sampling site has several neighboring waste incineration plants to the north. Additionally, in the Tokyo metropolitan area, most lead originates from waste incineration, as shown by studies based on the lead isotope ratios [89,90]. The correlation coefficient between Pb and OPvDTT increased (R = 0.83) during the autumn and winter when the northern winds clearly prevailed (Figure 2a).
The strong correlations of Mn and Zn with OPvDTT also suggest the relevance of waste incineration [90]. Meanwhile, manganese and zinc were correlated with Fe, especially during autumn and winter (R > 0.9) (Table 1). These three metals also highlight the relevance to the iron–steel industry, according to the site location in a large industrial area. In particular, steel mills have been reported as substantial fixed-emission sources of Fe, Mn, and Zn [91].
Meanwhile, at the rural site, the strong correlations of K, nss-K+, OCpyro, and Pb with OPvDTT and the strong cross-correlations of these chemical components indicate the relevance of the contribution of combustion sources [92]. However, the rural site does not have fixed combustion sources in the surrounding areas. Reportedly, the effects of biomass burning and residential coal combustion are predominant in the Asian continent in autumn and winter [88,93], while the rural sites facing the Japan Sea are significantly affected by these emissions [94]. With high OCpyro concentrations, the air mass typically arrived from the continent. Both biomass burning and coal combustion particles contain potassium, whereas lead is abundantly contained in coal combustion particles [95]. Therefore, the K/Pb ratio can be an indicator of the relative variation in the contribution of biomass burning and coal combustion for K [88]. While the K/Pb ratio was nearly constant at the urban site, we identified considerable variability at the rural site during the autumn and winter. During these seasons, the variation trend in the K/Pb ratio corresponded to that in OPmDTT (Figure 4), thereby exhibiting a strong positive correlation between the K/Pb ratio and OPmDTT (R = 0.78). In other words, OPmDTT during the autumn and winter was enhanced as the contribution of coal combustion for K decreased and that of biomass burning increased. A previous study has reported that brown carbon (BrC) derived from biomass burning exhibited higher OPmDTT, compared with that from coal combustion, depending on the DTT activity of contained water-insoluble organic compounds [96]. Therefore, the variation in OPmDTT was characterized by both coal combustion and biomass burning, and the increased contribution of biomass burning caused an increase in OPmDTT.
We identified a sample with extremely high OPvDTT among the samples, collected at the rural site in spring, as shown in Figure 2b (2.6 times higher than the average OPvDTT in spring). During the period when this sample was collected, the distinct increases were observed in the concentrations of K, nss-K+, Pb, OC3, OC4, and OCpyro (more than 2.5 times as high as each average concentration). Given the relatively low K/Pb ratio of the sample (Figure 4), the significant increase in OPvDTT likely stemmed from a sudden increase in the concentration of coal combustion particles. Conversely, during the regularly observed OPvDTT events except for the distinctive sample, OPvDTT was strongly correlated with OCpyro, SO42−, and NH4+ (Table 1). However, OCpyro was not strongly correlated with K and nss-K+, unlike the result in autumn and winter (Table 1). These tendencies indicate the effect from emission sources different from biomass burning and coal combustion. A study, conducted at the rural site facing the Japan Sea has previously reported that >50% of the organic aerosols in spring were low-volatile particles, likely transported from the continent [73]. Given our results and the previous study, the strong correlation of OCpyro with OPvDTT points to the contribution of the SOAs, which were highly oxidized during long transportation from the continent. Therefore, low-volatile organic compounds derived from secondary formation processes may have also contributed to the OPvDTT variation, especially during the ordinary periods in spring.
The strong correlation of Mn with OPvDTT was also discerned at the rural site. This element was strongly correlated with Fe and Zn (R = 0.89) (Table 1). As stated in the source estimation at the urban site, these metals are associated with the iron–steel industry.
To summarize, the particles emitted from anthropogenic combustion sources and the iron–steel industry, and SOA particles, are likely the species that govern the OPvDTT variation at both urban and rural sites. In particular, at the urban site, the OPvDTT varied due to the contribution of waste incineration in the surrounding areas. Meanwhile, at the rural site, OPvDTT increased in response to the enhanced effects of residential coal combustion and biomass burning in the Asian continent. The increase in inflows of biomass burning particles with prominently high DTT oxidizability yielded higher OPmDTT, compared with that at the urban site. As stated repeatedly, particles from these emission sources were not the only species related to DTT oxidation, due to its complicated mechanisms. Although quantitative determination of the contributions of the emission sources to OPDTT via statistical analysis is also our future work, at least our results suggest that these limited sources mainly contribute to the variation in the OPDTT at both sites. These regional and seasonal tendencies of the OPvDTT in Japan confirm the results of the domestic simulation of OPvDTT [44].

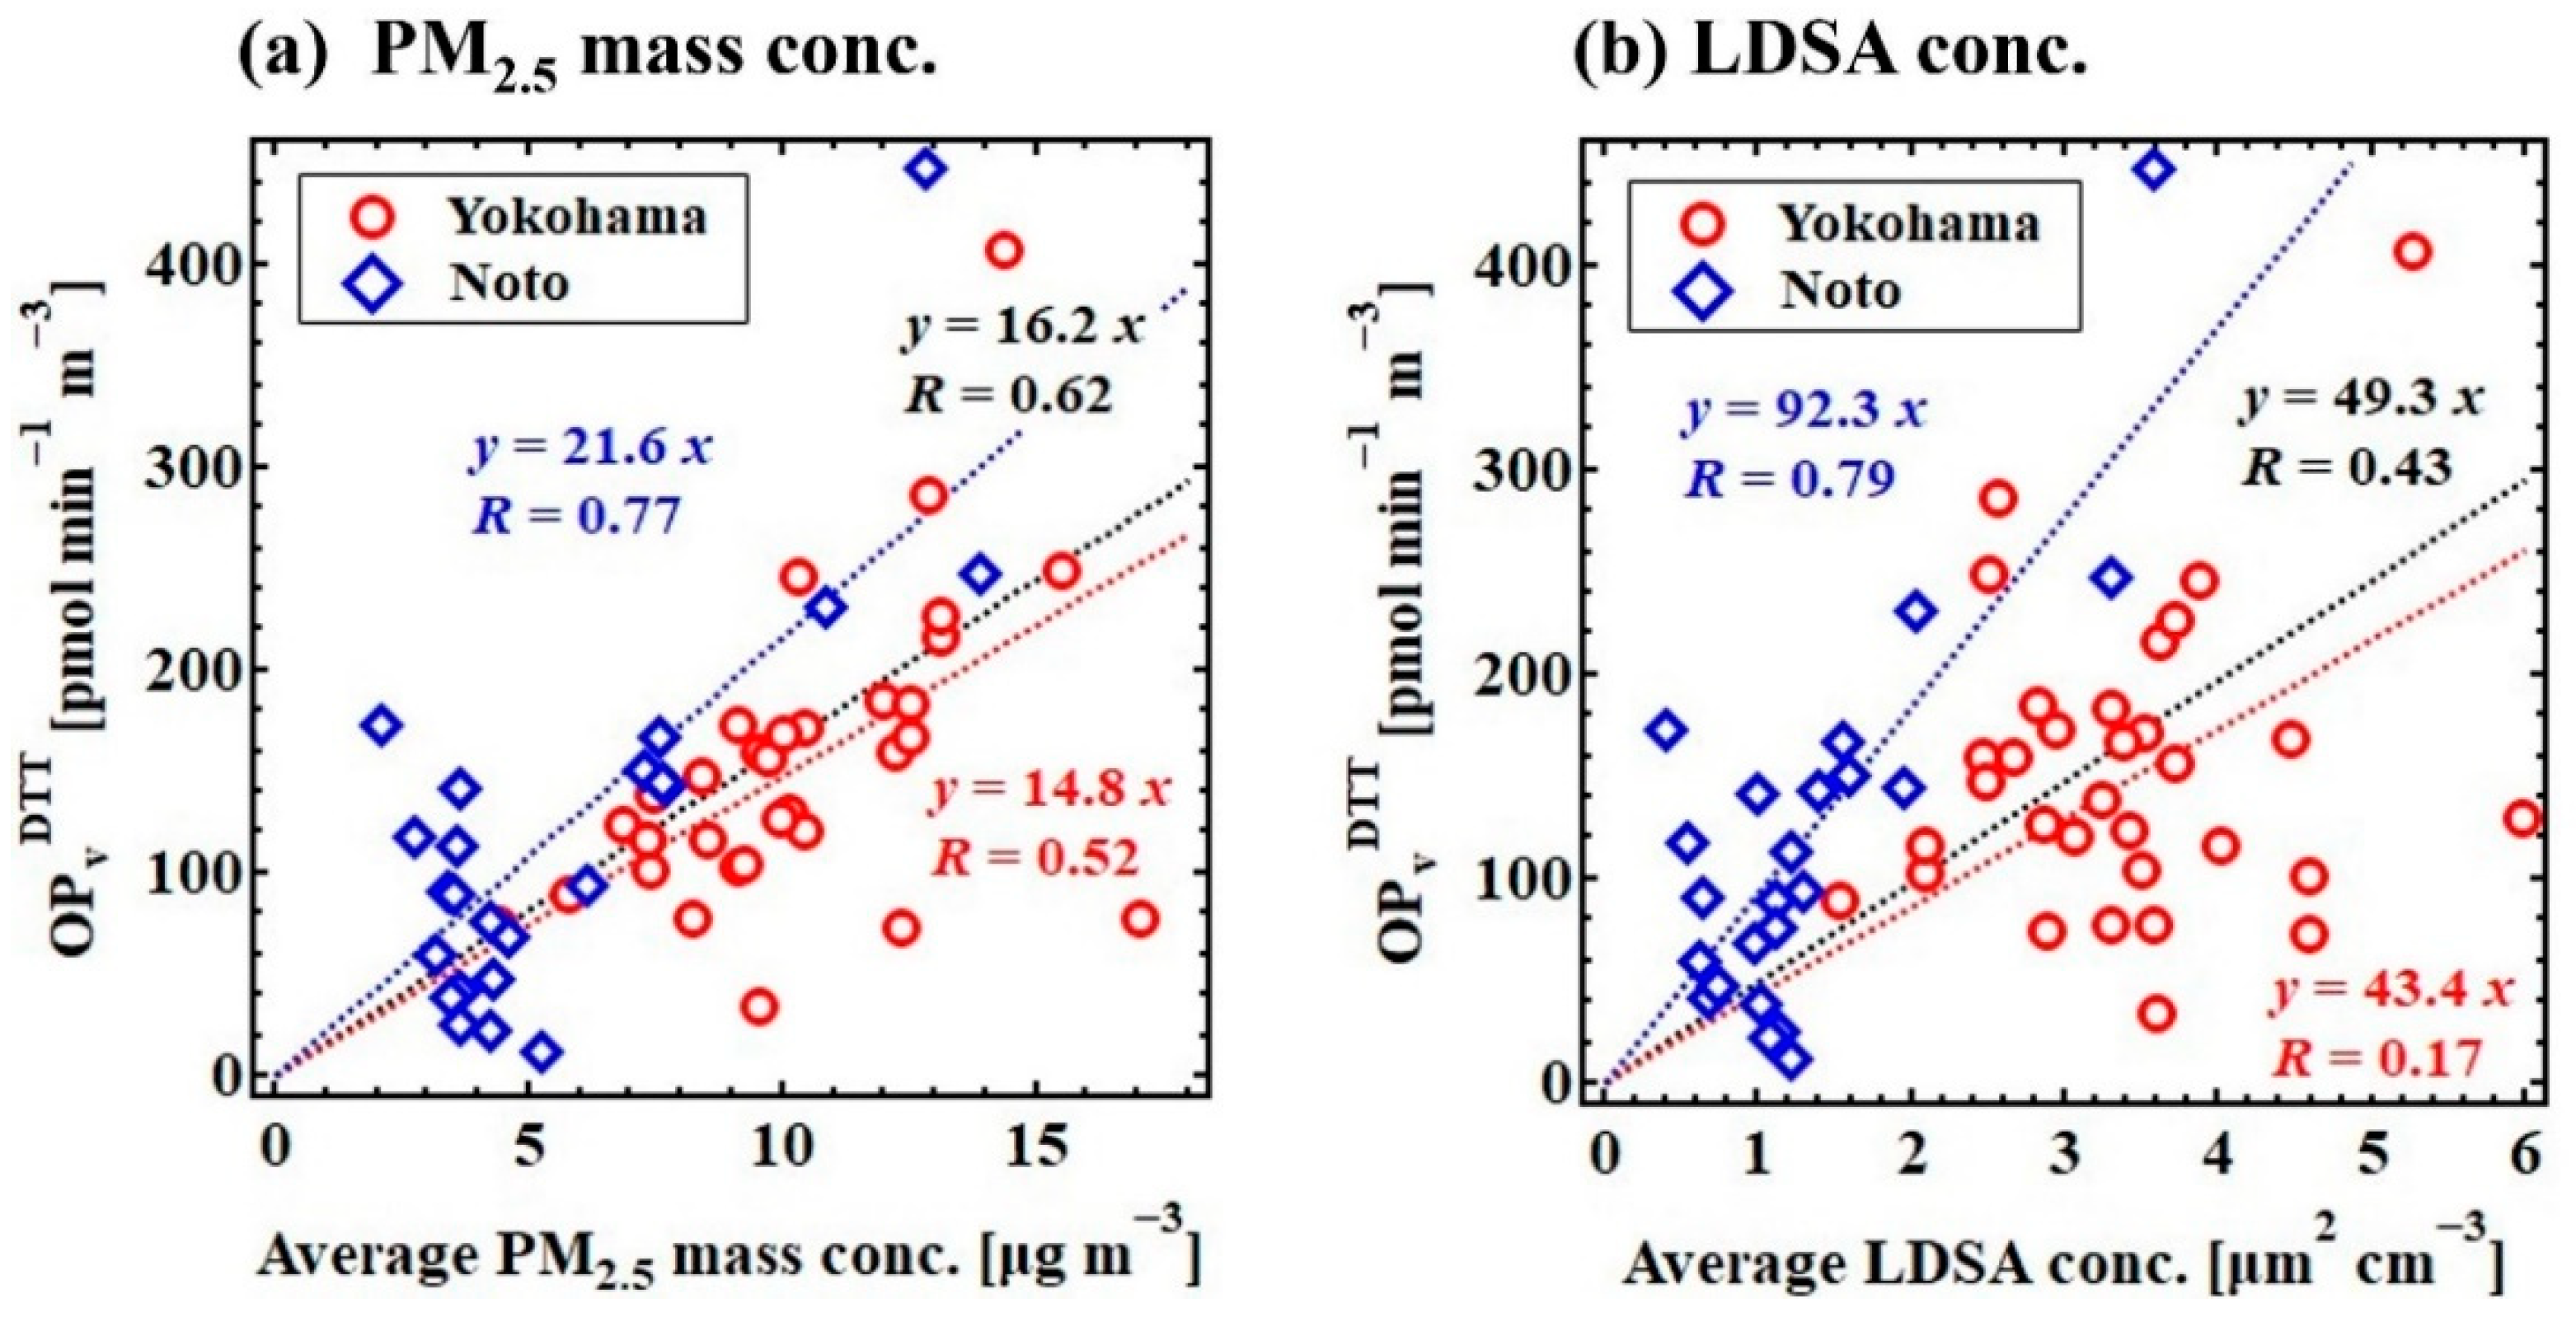
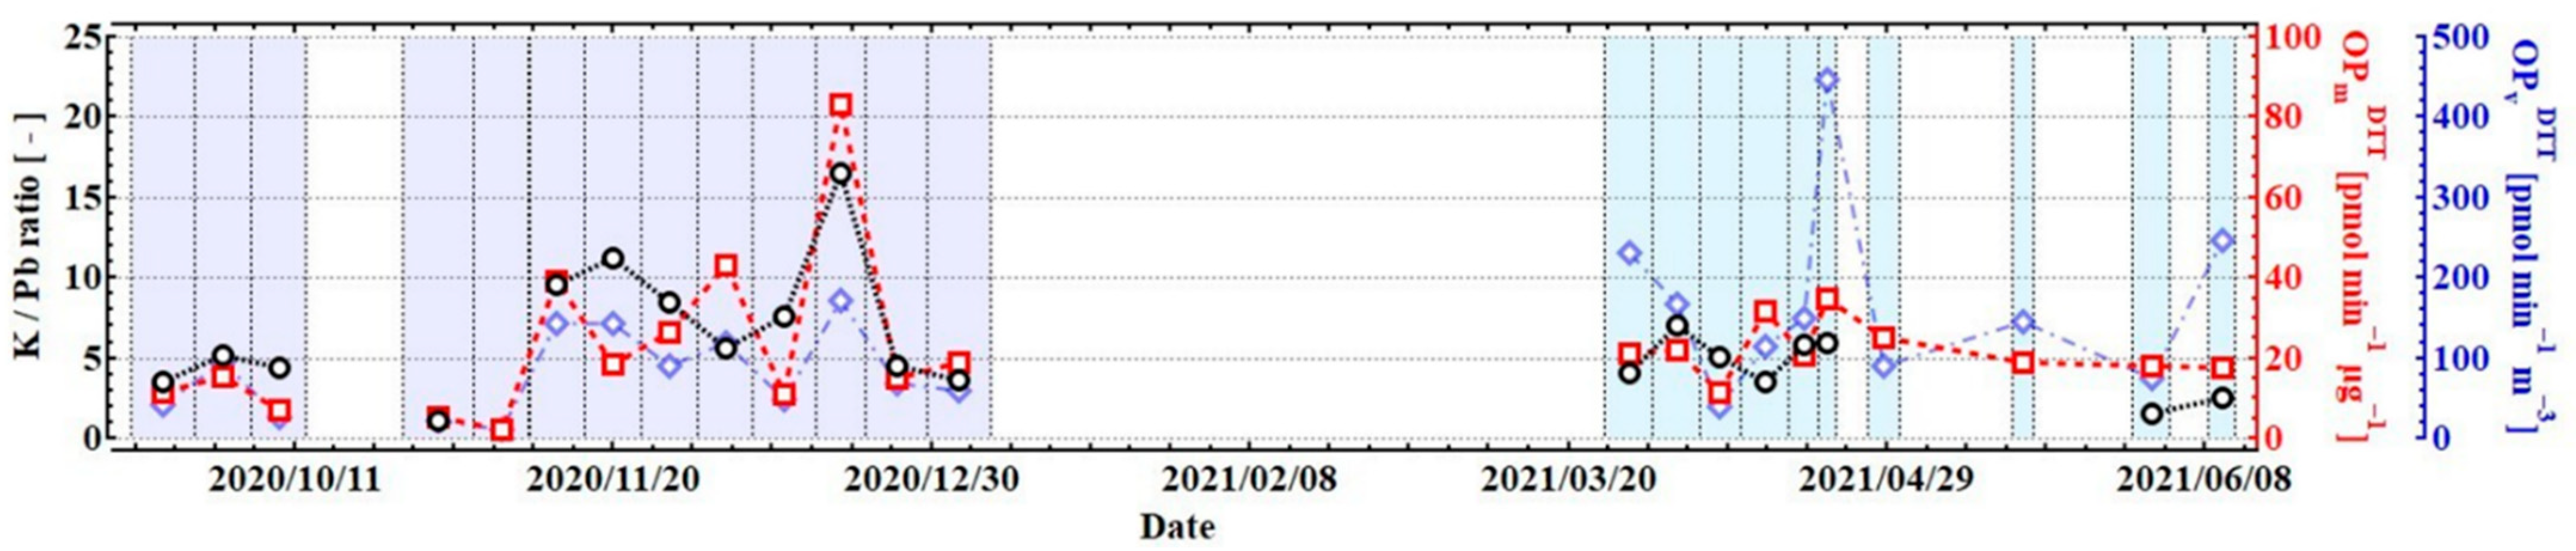
3.3. Contribution of Physical Properties to the Variations in OPDTT

We elucidated the relationship between OPmDTT and the specific LDSA (Figure 5) to determine the contribution of the physical properties to OPDTT. As mentioned, an increase in the specific LDSA reflects the shifting degree of representative diameter to the ultrafine range [49]. In other words, the representative diameter decreases, and the specific surface area (surface area per unit mass) increases as the specific LDSA increases. However, there was no tendency for OPmDTT to increase with an increase in the specific LDSA at the analyzed sites. Even the predominance of UFPs did not induce an increase in OPmDTT, and OPmDTT values were nearly constant at the urban site. Meanwhile, the periods of significantly higher OPmDTT were typically observed at the Noto site, which is dominated by relatively large particles, as seen from Figure 5a. These high OPmDTT periods were better characterized by chemical components than by physical properties. This pattern is explained, for instance, by the proportion of OCpyro, exhibiting a strong positive relationship with OPvDTT at both sites (Figure 5b). Therefore, we concluded that although the dominant species slightly differed depending on the regions and periods, the OPvDTT of atmospheric aerosols varied with the mass concentration of certain chemical constituents. When the proportion of chemical components controlling the variation in OPDTT does not change greatly, OPvDTT can be strongly correlated with the PM2.5 mass concentration. However, in fact, the proportions of these species easily vary depending on the sampling periods, thereby changing the relationship between OPvDTT and the PM2.5 mass concentration. This inadequate characterization of OPvDTT by atmospheric aerosol mass concentrations can be well-complemented by the proportion of limited chemical components (Figure S5).
Our laboratory verification experiments using single-component particles also confirmed that direct oxidation of DTT was caused by limited chemical species (Figure 6 and Figure S3). However, even the chemical components exhibiting the strong correlation with OPDTT of collected samples were not necessarily characterized with DTT activity (e.g., ammonium sulfate, KCl, ZnO, and PbO2). Therefore, it is possible that complicated factors such as synergistic effects on OPDTT by various components may contribute to OPvDTT of atmospheric aerosol particles.
In addition, previous studies have reported that an increase in the specific surface area of water-insoluble or ultrafine particles, including soot, contributes to the increase in DTT oxidizability by providing the reaction fields [40,41]. Our experiment using MnO2 particles with different size distributions also revealed the tendency of OPDTT to increase as the representative diameter decreased (Figure 6a). In particular, the increase in the measured OPDTT of the insoluble particles was clearly attributed to the increase in their surface area, as indicated by Figure 6b. Therefore, the physical properties, particularly the surface area, can surely contribute to the OPDTT of atmospheric aerosol particles by controlling DTT oxidizability.
However, our results suggest that the OPDTT dependency of atmospheric aerosols on physical properties governing DTT oxidizability was not clearly identified, owing to various factors affecting OPDTT, as follows. First, although the number of species governing the OPDTT variation is likely limited, OPDTT is affected by several DTT active species. Second, the contribution of water-soluble components can be important for the variation in OPDTT. The strong correlation of OPvDTT with the concentrations of some water-soluble components such as SO42− and K+ suggested that these ion components somehow contributed to the variation in OPDTT at both sites. Regarding these water-soluble species, their surface area cannot be related to DTT oxidation because they dissolve in suspension. Third, atmospheric aerosol particles do not exist as single-component particles in the atmosphere in most cases, complicating their existing state. Several previous studies have reported that the simple sum of OPDTT of water-soluble and water-insoluble fractions could not completely match the total OPDTT [97,98]. Therefore, the synergistic effect, such as the catalytic action of insoluble particle surfaces and of transition metals, can also be one of the reasons causing the difference in OPDTT behaviors between single-component particles and atmospheric aerosol particles. Moreover, in terms of internally mixed particles of water-soluble and insoluble components, their surface area and size observed in the atmosphere cannot be accurately reflected in OPDTT because a part of these particles dissolves in suspension. Lastly, it is possible that the size distributions of each chemical component are nearly fixed based on the emission sources and the distances from them. For these reasons, OPDTT variations can be more affected by the difference in the mass of chemical components than by physical properties. Regardless of the reason, the small contribution of physical properties, such as particle surface area, emphasize the importance of the chemical properties for the variation in OPDTT. Our results also indicate that it is possible to roughly estimate the OPDTT of atmospheric aerosol particles using the mass of chemical components, which control the variations in OPvDTT at each site.

4. Conclusions

This study investigated the contributions of both particle size and chemical compositions (i.e., both physical and chemical properties) to the variation in OPDTT of atmospheric aerosol particles. We carried out field observations and aerosol sampling at urban and rural sites in Japan. The mass and LDSA concentrations, which have different sensitivity to particle size, were measured at both sites. The main aerosol components, such as metal, water-soluble ions, and EC/OC were also analyzed using the collected samples, along with the OPDTT measurement.
First, we found that during the observation periods from September 2020 to June 2021 (autumn to spring), the average volume-normalized OPDTT (i.e., OPvDTT) was higher at the urban site, which was characterized by higher particle concentration (153 ± 74 pmol min−1 m−3 at the urban site and 119 ± 96 pmol min−1 m−3 at the rural site). Unlike the rural site, most these particles originated from local anthropogenic emissions at the urban site. In contrast, the mass-normalized OPDTT (i.e., OPmDTT) was 1.5 times higher at the rural site, compared with the urban site (14.9 ± 5.0 pmol min−1 µg−1 at the urban site and 22.6 ± 16.8 pmol min−1 µg−1 at the rural site). The variations in OPvDTT at both sites were roughly explained by mass concentration.
Second, the strong positive correlations between OPvDTT and the concentrations of some chemical components emphasized the relevance of limited components, including metals such as K, Mn, Pb, NH4+, SO42−, and some organic fractions such as OCpyro to OPDTT. This finding suggested that particles emitted from anthropogenic combustion and the iron–steel industry, sulfate, and SOAs were the main contributors to the variation in OPDTT at both sites. In particular, at the urban site, waste incineration and the iron–steel industry in the surrounding areas were found to be the generation sources of particles. At the rural site facing the Japan Sea, the particles transported from the Asian continent primarily induced an increase in OPvDTT, and it fluctuated especially by residential coal combustion and biomass burning particles from the continent. From the physical contribution perspective, previous studies and our verification experiment confirm that the decrease in the diameter (i.e., the increase in the specific surface area) induces the increase in OPDTT, at least for single-component insoluble particles. However, the contribution of the specific surface area was not reflected in the variation in OPmDTT of atmospheric aerosols at the analyzed sites. Thus, we concluded that the physical contribution to the variation in OPDTT of atmospheric aerosol particles dwindled because of (a) the contribution of a variety of DTT-active species, (b) the considerable contribution of water-soluble particles, (c) the complexity of their existing state, and (d) little variation in the size distributions of each species, despite the potential effects of physical properties. Most importantly, we proved that the OPDTT of atmospheric aerosol particles can be explained mostly by their chemical properties.
This is a valuable finding because understanding OPDTT is essential, given its usefulness as an indicator of health damage, caused by atmospheric aerosol particles. We argue that if the existing PM-control measures cannot effectively reduce OPDTT, the emission control measures for the diminution of the ground-level PM2.5 concentration would not mitigate health risks, imposed by aerosols correspondingly. Our results deepen the understanding of the OPDTT of atmospheric aerosol particles, thereby partly alleviating the incomplete information about them. Our study provides pivotal information to estimate OPDTT using several observable or analyzable physicochemical parameters without its direct measurement, which paves the way toward the most effective means of PM control.

Supplementary Materials

The following supporting information can be downloaded at: https://www.mdpi.com/article/10.3390/atmos13020319/s1, Figure S1: Classification maps of air mass backward trajectory at each observatory; Figure S2: Size distributions of MnO2 particles used in the laboratory experiment; Figure S3: Temporal variations in physicochemical parameters and oxidative potentials at the two sites; Figure S4: DTT activity of single component particles and standard materials; Figure S5: Relationship between the PM2.5 mass concentration and OPvDTT colored by the proportion of OCpyro; Table S1: Correlation matrix for OPvDTT, PM2.5 mass concentration, LDSA concentration, and chemical components.

Author Contributions

Conceptualization, A.I. and T.O.; methodology, K.K., K.O. and T.S.; validation, K.K.; formal analysis, K.K. and S.G.M.H.; investigation, K.K., A.I. and S.G.M.H.; resources, A.M.; data curation, K.K.; writing—original draft preparation, K.K. and A.I.; writing—review and editing, K.K. and A.I.; visualization, K.K.; supervision, T.O. and A.M.; project administration, T.O.; funding acquisition, A.I. and T.O. All authors have read and agreed to the published version of the manuscript.

Funding

This study was partly supported by JSPS/MEXT KAKENHI [Grant Numbers 17H01864, 17H04480, 18K19856, 20H00636 and 20K19959] and the cooperative research program of the Institute of Nature and Environmental Technology, Kanazawa University (19019, 20026).

Institutional Review Board Statement

Not applicable.

Informed Consent Statement

Not applicable.

Data Availability Statement

Publicly available datasets were analyzed in this study. Trajectory data is available at the NOAA Air Resource Laboratory (ARL) and the READY website (http://www.ready.noaa.gov (accessed on 30 August 2021)). The datasets of PM2.5 mass concentration is available at the website managed Ministry of Environment (https://soramame.env.go.jp/ (accessed on 6 September 2021)). Meteorological data can be found at website by the Japan Meteorological Agency (https://www.jma.go.jp/jma (accessed on 15 November 2021)).

Acknowledgments

The authors acknowledge the NOAA Air Resource Laboratory (ARL) and the READY website (http://www.ready.noaa.gov (accessed on 30 August 2021)) for providing the HYSPLIT transport and dispersion model utilized in this study.

Conflicts of Interest

The authors declare no conflict of interest.

References

  1. Gauderman, W.J.; Vora, H.; McConnell, R.; Berhane, K.; Gilliland, F.; Thomas, D.; Lurmann, F.; Avol, E.; Kunzli, N.; Jerrett, M.; et al. Effect of exposure to traffic on lung development from 10 to 18 years of age: A cohort study. Lancet 2007, 369, 571–577. [Google Scholar] [CrossRef]
  2. Pope, C.A.; Burnett, R.T.; Thurston, G.D.; Thun, M.J.; Calle, E.E.; Krewski, D.; Godleski, J.J. Cardiovascular Mortality and Long-Term Exposure to Particulate Air Pollution: Epidemiological Evidence of General Pathophysiological Pathways of Disease. Circulation 2004, 109, 71–77. [Google Scholar] [CrossRef] [PubMed] [Green Version]
  3. Hoek, G.; Brunekreef, B.; Goldbohm, S.; Fischer, P.; Van Den Brandt, P.A. Association between mortality and indicators of traffic-related air pollution in the Netherlands: A cohort study. Lancet 2002, 360, 1203–1209. [Google Scholar] [CrossRef] [Green Version]
  4. Pöschl, U. Atmospheric aerosols: Composition, transformation, climate and health effects. Angew. Chem. Int. Ed. 2005, 44, 7520–7540. [Google Scholar] [CrossRef]
  5. Rissler, J.; Nordin, E.Z.; Eriksson, A.C.; Nilsson, P.T.; Frosch, M.; Sporre, M.K.; Wierzbicka, A.; Svenningsson, B.; Löndahl, J.; Messing, M.E.; et al. Effective density and mixing state of aerosol particles in a near-traffic urban environment. Environ. Sci. Technol. 2014, 48, 6300–6308. [Google Scholar] [CrossRef]
  6. Silva, R.A.; West, J.J.; Zhang, Y.; Anenberg, S.C.; Lamarque, J.F.; Shindell, D.T.; Collins, W.J.; Dalsoren, S.; Faluvegi, G.; Folberth, G.; et al. Global premature mortality due to anthropogenic outdoor air pollution and the contribution of past climate change. Environ. Res. Lett. 2013, 8, 034005. [Google Scholar] [CrossRef]
  7. Brunekreef, B.; Holgate, S.T. Air pollution and health. Lancet 2002, 360, 1233–1242. [Google Scholar] [CrossRef]
  8. Shiraiwa, M.; Ueda, K.; Pozzer, A.; Lammel, G.; Kampf, C.J.; Fushimi, A.; Enami, S.; Arangio, A.M.; Fröhlich-Nowoisky, J.; Fujitani, Y.; et al. Aerosol Health Effects from Molecular to Global Scales. Environ. Sci. Technol. 2017, 51, 13545–13567. [Google Scholar] [CrossRef]
  9. Squadrito, G.L.; Cueto, R.; Dellinger, B.; Pryor, W.A. Quinoid redox cycling as a mechanism for sustained free radical generation by inhaled airborne particulate matter. Free Radic. Biol. Med. 2001, 31, 1132–1138. [Google Scholar] [CrossRef]
  10. Venkatachari, P.; Hopke, P.K. Development and laboratory testing of an automated monitor for the measurement of atmospheric particle-bound reactive oxygen species (ROS). Aerosol Sci. Technol. 2008, 42, 629–635. [Google Scholar] [CrossRef]
  11. Michael, S.; Montag, M.; Dott, W. Pro-inflammatory effects and oxidative stress in lung macrophages and epithelial cells induced by ambient particulate matter. Environ. Pollut. 2013, 183, 19–29. [Google Scholar] [CrossRef] [PubMed]
  12. Nel, A. Air Pollution—Related Illness: Effects of Particles. Science 2005, 308, 804–806. [Google Scholar] [CrossRef] [PubMed]
  13. Xia, T.; Kovochich, M.; Brant, J.; Hotze, M.; Sempf, J.; Oberley, T.; Sioutas, C.; Yeh, J.I.; Wiesner, M.R.; Nel, A.E. Comparison of the abilities of ambient and manufactured nanoparticles to induce cellular toxicity according to an oxidative stress paradigm. Nano Lett. 2006, 6, 1794–1807. [Google Scholar] [CrossRef] [PubMed]
  14. Li, N.; Sioutas, C.; Cho, A.; Schmitz, D.; Misra, C.; Sempf, J.; Wang, M.; Oberley, T.; Froines, J.; Nel, A. Ultrafine particulate pollutants induce oxidative stress and mitochondrial damage. Environ. Health Perspect. 2003, 111, 455–460. [Google Scholar] [CrossRef] [PubMed]
  15. Strak, M.; Janssen, N.; Beelen, R.; Schmitz, O.; Vaartjes, I.; Karssenberg, D.; van den Brink, C.; Bots, M.L.; Dijst, M.; Brunekreef, B.; et al. Long-term exposure to particulate matter, NO2 and the oxidative potential of particulates and diabetes prevalence in a large national health survey. Environ. Int. 2017, 108, 228–236. [Google Scholar] [CrossRef] [PubMed]
  16. Yang, A.; Janssen, N.A.H.; Brunekreef, B.; Cassee, F.R.; Hoek, G.; Gehring, U. Children’s respiratory health and oxidative potential of PM2.5: The PIAMA birth cohort study. Occup. Environ. Med. 2016, 73, 154–160. [Google Scholar] [CrossRef]
  17. Zhang, X.; Staimer, N.; Tjoa, T.; Gillen, D.L.; Schauer, J.J.; Shafer, M.M.; Hasheminassab, S.; Pakbin, P.; Longhurst, J.; Sioutas, C.; et al. Associations between microvascular function and short-term exposure to traffic-related air pollution and particulate matter oxidative potential. Environ. Health 2016, 15, 1–16. [Google Scholar] [CrossRef] [Green Version]
  18. Cho, A.K.; Sioutas, C.; Miguel, A.H.; Kumagai, Y.; Schmitz, D.A.; Singh, M.; Eiguren-Fernandez, A.; Froines, J.R. Redox activity of airborne particulate matter at different sites in the Los Angeles Basin. Environ. Res. 2005, 99, 40–47. [Google Scholar] [CrossRef]
  19. Kumagai, Y.; Koide, S.; Taguchi, K.; Endo, A.; Nakai, Y.; Yoshikawa, T.; Shimojo, N. Oxidation of proximal protein sulfhydryls by phenanthraquinone, a component of diesel exhaust particles. Chem. Res. Toxicol. 2002, 15, 483–489. [Google Scholar] [CrossRef]
  20. Delfino, R.J.; Staimer, N.; Tjoa, T.; Gillen, D.L.; Schauer, J.J.; Shafer, M.M. Airway inflammation and oxidative potential of air pollutant particles in a pediatric asthma panel. J. Expo. Sci. Environ. Epidemiol. 2013, 23, 466–473. [Google Scholar] [CrossRef]
  21. Steenhof, M.; Gosens, I.; Strak, M.; Godri, K.J.; Hoek, G.; Cassee, F.R.; Mudway, I.S.; Kelly, F.J.; Harrison, R.M.; Lebret, E.; et al. In vitro toxicity of particulate matter (PM) collected at different sites in the Netherlands is associated with PM composition, size fraction and oxidative potential—The RAPTES project. Part Fibre Toxicol. 2011, 8, 26. [Google Scholar] [CrossRef] [PubMed] [Green Version]
  22. Janssen, N.A.H.; Strak, M.; Yang, A.; Hellack, B.; Kelly, F.J.; Kuhlbusch, T.A.J.; Harrison, R.M.; Brunekreef, B.; Cassee, F.R.; Steenhof, M.; et al. Associations between three specific a-cellular measures of the oxidative potential of particulate matter and markers of acute airway and nasal inflammation in healthy volunteers. Occup. Environ. Med. 2015, 72, 49–56. [Google Scholar] [CrossRef] [PubMed]
  23. Charrier, J.G.; Anastasio, C. On dithiothreitol (DTT) as a measure of oxidative potential for ambient particles: Evidence for the importance of soluble\newline transition metals. Atmos. Chem. Phys. 2012, 12, 9321–9333. [Google Scholar] [CrossRef] [Green Version]
  24. Dou, J.; Lin, P.; Kuang, B.Y.; Yu, J.Z. Reactive oxygen species production mediated by humic-like substances in atmospheric aerosols: Enhancement effects by pyridine, imidazole, and their derivatives. Environ. Sci. Technol. 2015, 49, 6457–6465. [Google Scholar] [CrossRef] [PubMed] [Green Version]
  25. Verma, V.; Ning, Z.; Cho, A.K.; Schauer, J.J.; Shafer, M.M.; Sioutas, C. Redox activity of urban quasi-ultrafine particles from primary and secondary sources. Atmos. Environ. 2009, 43, 6360–6368. [Google Scholar] [CrossRef]
  26. Daellenbach, K.R.; Uzu, G.; Jiang, J.; Cassagnes, L.E.; Leni, Z.; Vlachou, A.; Stefenelli, G.; Canonaco, F.; Weber, S.; Segers, A.; et al. Sources of particulate-matter air pollution and its oxidative potential in Europe. Nature 2020, 587, 414–419. [Google Scholar] [CrossRef] [PubMed]
  27. Pietrogrande, M.C.; Bertoli, I.; Clauser, G.; Dalpiaz, C.; Dell’Anna, R.; Lazzeri, P.; Lenzi, W.; Russo, M. Chemical composition and oxidative potential of atmospheric particles heavily impacted by residential wood burning in the alpine region of northern Italy. Atmos. Environ. 2021, 253, 118360. [Google Scholar] [CrossRef]
  28. Li, Q.; Wyatt, A.; Kamens, R.M. Oxidant generation and toxicity enhancement of aged-diesel exhaust. Atmos. Environ. 2009, 43, 1037–1042. [Google Scholar] [CrossRef]
  29. Kramer, A.J.; Rattanavaraha, W.; Zhang, Z.; Gold, A.; Surratt, J.D.; Lin, Y.H. Assessing the oxidative potential of isoprene-derived epoxides and secondary organic aerosol. Atmos. Environ. 2016, 130, 211–218. [Google Scholar] [CrossRef]
  30. Biswas, S.; Verma, V.; Schauer, J.J.; Cassee, F.R.; Cho, A.K.; Sioutas, C. Oxidative potential of semi-volatile and non volatile particulate matter (PM) from heavy-duty vehicles retrofitted with emission control technologies. Environ. Sci. Technol. 2009, 43, 3905–3912. [Google Scholar] [CrossRef]
  31. Gerlofs-Nijland, M.E.; Totlandsdal, A.I.; Tzamkiozis, T.; Leseman, D.L.A.C.; Samaras, Z.; Låg, M.; Schwarze, P.; Ntziachristos, L.; Cassee, F.R. Cell toxicity and oxidative potential of engine exhaust particles: Impact of using particulate filter or biodiesel fuel blend. Environ. Sci. Technol. 2013, 47, 5931–5938. [Google Scholar] [CrossRef] [PubMed]
  32. Donaldson, K.; Li, X.Y.; MacNee, W. Ultrafine (nanometre) particle mediated lung injury. J. Aerosol Sci. 1998, 29, 553–560. [Google Scholar] [CrossRef]
  33. Duffin, R.; Tran, L.; Brown, D.; Stone, V.; Donaldson, K. Proinflammogenic effects of low-toxicity and metal nanoparticles in vivo and in vitro: Highlighting the role of particle surface area and surface reactivity. Inhal. Toxicol. 2007, 19, 849–856. [Google Scholar] [CrossRef] [PubMed]
  34. Fang, T.; Zeng, L.; Gao, D.; Verma, V.; Stefaniak, A.B.; Weber, R.J. Ambient Size Distributions and Lung Deposition of Aerosol Dithiothreitol-Measured Oxidative Potential: Contrast between Soluble and Insoluble Particles. Environ. Sci. Technol. 2017, 51, 6802–6811. [Google Scholar] [CrossRef]
  35. McWhinney, R.D.; Badali, K.; Liggio, J.; Li, S.M.; Abbatt, J.P.D. Filterable redox cycling activity: A comparison between diesel exhaust particles and secondary organic aerosol constituents. Environ. Sci. Technol. 2013, 47, 3362–3369. [Google Scholar] [CrossRef]
  36. Saffari, A.; Daher, N.; Shafer, M.M.; Schauer, J.J.; Sioutas, C. Global perspective on the oxidative potential of airborne particulate matter: A synthesis of research findings. Environ. Sci. Technol. 2014, 48, 7576–7583. [Google Scholar] [CrossRef]
  37. Sauvain, J.J.; Rossi, M.J.; Riediker, M. Comparison of three acellular tests for assessing the oxidation potential of nanomaterials. Aerosol Sci. Technol. 2013, 47, 218–227. [Google Scholar] [CrossRef] [Green Version]
  38. Dellinger, B.; Lomnicki, S.; Khachatryan, L.; Maskos, Z.; Hall, R.W.; Adounkpe, J.; McFerrin, C.; Truong, H. Formation and stabilization of persistent free radicals. Proc. Combust. Inst. 2007, 31, 521–528. [Google Scholar] [CrossRef] [Green Version]
  39. Arangio, A.M.; Tong, H.; Socorro, J.; Pöschl, U.; Shiraiwa, M. Quantification of environmentally persistent free radicals and reactive oxygen species in atmospheric aerosol particles. Atmos. Chem. Phys. 2016, 16, 13105–13119. [Google Scholar] [CrossRef] [Green Version]
  40. Pan, C.J.G.; Schmitz, D.A.; Cho, A.K.; Froines, J.; Fukuto, J.M. Inherent redox properties of diesel exhaust particles: Catalysis of the generation of reactive oxygen species by biological reductants. Toxicol. Sci. 2004, 81, 225–232. [Google Scholar] [CrossRef]
  41. Sauvain, J.J.; Rossi, M.J. Quantitative Aspects of the Interfacial Catalytic Oxidation of Dithiothreitol by Dissolved Oxygen in the Presence of Carbon Nanoparticles. Environ. Sci. Technol. 2016, 50, 996–1004. [Google Scholar] [CrossRef] [PubMed] [Green Version]
  42. Koike, E.; Kobayashi, T. Chemical and biological oxidative effects of carbon black nanoparticles. Chemosphere 2006, 65, 946–951. [Google Scholar] [CrossRef] [PubMed]
  43. Hu, S.; Polidori, A.; Arhami, M.; Shafer, M.M.; Schauer, J.J.; Cho, A.; Sioutas, C. Redox activity and chemical speciation of size fractioned PM in the communities of the Los Angeles-Long Beach harbor. Atmos. Chem. Phys. 2008, 8, 6439–6451. [Google Scholar] [CrossRef] [Green Version]
  44. Kajino, M.; Hagino, H.; Fujitani, Y.; Morikawa, T.; Fukui, T.; Onishi, K.; Okuda, T.; Igarashi, Y. Simulation of the transition metal-based cumulative oxidative potential in East Asia and its emission sources in Japan. Sci. Rep. 2021, 11, 1–12. [Google Scholar] [CrossRef]
  45. Iwata, A.; Fujioka, K.; Yonemichi, T.; Fukagata, K.; Kurosawa, K.; Tabata, R.; Kitagawa, M.; Takashima, T.; Okuda, T. Seasonal variation in atmospheric particle electrostatic charging states determined using a parallel electrode plate device. Atmos. Environ. 2019, 203, 62–69. [Google Scholar] [CrossRef]
  46. Ueda, S.; Nakayama, T.; Taketani, F.; Adachi, K.; Matsuki, A.; Iwamoto, Y.; Sadanaga, Y.; Matsumi, Y. Light absorption and morphological properties of soot-containing aerosols observed at an East Asian outflow site, Noto Peninsula, Japan. Atmos. Chem. Phys. 2016, 16, 2525–2541. [Google Scholar] [CrossRef] [Green Version]
  47. Iwamoto, Y.; Kinouchi, K.; Watanabe, K.; Yamazaki, N.; Matsuki, A. Simultaneous measurement of CCN activity and chemical composition of fine-mode aerosols at noto Peninsula, Japan, in autumn 2012. Aerosol Air Qual. Res. 2016, 16, 2107–2118. [Google Scholar] [CrossRef] [Green Version]
  48. Iwata, A.; Matsuki, A. Characterization of individual ice residual particles by the single droplet freezing method: A case study in the Asian dust outflow region. Atmos. Chem. Phys. 2018, 18, 1785–1804. [Google Scholar] [CrossRef] [Green Version]
  49. Kurihara, K.; Iwata, A.; Kiriya, M.; Yoshino, A.; Takami, A.; Matsuki, A.; Nishita-Hara, C.; Hara, K.; Hayashi, M.; Kaneyasu, N.; et al. Lung deposited surface area of atmospheric aerosol particles at three observatories in Japan. Atmos. Environ. 2021, 262, 118597. [Google Scholar] [CrossRef]
  50. Asbach, C.; Fissan, H.; Stahlmecke, B.; Kuhlbusch, T.A.J.; Pui, D.Y.H. Conceptual limitations and extensions of lung-deposited Nanoparticle Surface Area Monitor (NSAM). J. Nanopart. Res. 2009, 11, 101–109. [Google Scholar] [CrossRef]
  51. Fissan, H.; Neumann, S.; Trampe, A.; Pui, D.Y.H.; Shin, W.G. Rationale and principle of an instrument measuring lung deposited nanoparticle surface area. J. Nanopart. Res. 2007, 9, 53–59. [Google Scholar] [CrossRef]
  52. Gong, W.; Zhang, T.; Zhu, Z.; Ma, Y.; Ma, X.; Wang, W. Characteristics of PM1.0, PM2.5, and PM10, and their relation to black carbon in Wuhan, central China. Atmosphere 2015, 6, 1377–1387. [Google Scholar] [CrossRef] [Green Version]
  53. Seinfeld, J.H.; Pandis, S.N. Atmospheric Chemistry and Physics: From Air Pollution to Climate Change, 2nd ed.; Wiley: Hoboken, NJ, USA, 2006. [Google Scholar]
  54. Yonemochi, S.; Umezawa, N. Parallel continuous observation of submicron particle (PM1) and PM2.5, and characterization of PM1 in a suburban of Tokyo. J. Jpn. Soc. Atmos. Environ. 2010, 45, 271–278. [Google Scholar]
  55. Konishi, T.; Yonemochi, S.; Murata, M. Chemical composition and sources estimation of PM2.5 and submicron particles (PM1) in urban atmosphere based on chemical components. Bunseki Kagaku 2018, 67, 363–368. [Google Scholar] [CrossRef] [Green Version]
  56. Rolph, G.; Stein, A.; Stunder, B. Real-time Environmental Applications and Display sYstem: READY. Environ. Model. Softw. 2017, 95, 210–228. [Google Scholar] [CrossRef]
  57. Stein, A.F.; Draxler, R.R.; Rolph, G.D.; Stunder, B.J.B.; Cohen, M.D.; Ngan, F. Noaa’s hysplit atmospheric transport and dispersion modeling system. Bull. Am. Meteorol. Soc. 2015, 96, 2059–2077. [Google Scholar] [CrossRef]
  58. Alimov, Z.B.; Kusakari, H.; Okuda, T. Development of A Low-cost Simultaneous Low Volume Air Sampler Controlled with Sonic Venturi. Asian J. Atmos. Environ. 2021, 15, 1–16. [Google Scholar] [CrossRef]
  59. Fang, T.; Guo, H.; Zeng, L.; Verma, V.; Nenes, A.; Weber, R.J. Highly Acidic Ambient Particles, Soluble Metals, and Oxidative Potential: A Link between Sulfate and Aerosol Toxicity. Environ. Sci. Technol. 2017, 51, 2611–2620. [Google Scholar] [CrossRef]
  60. Gao, D.; Mulholland, J.A.; Russell, A.G.; Weber, R.J. Characterization of water-insoluble oxidative potential of PM2.5 using the dithiothreitol assay. Atmos. Environ. 2020, 224, 117327. [Google Scholar] [CrossRef]
  61. Matthews, P.S.J.; Baeza-Romero, M.T.; Whalley, L.K.; Heard, D.E. Uptake of HO2 radicals onto Arizona test dust particles using an aerosol flow tube. Atmos. Chem. Phys. 2014, 14, 7397–7408. [Google Scholar] [CrossRef] [Green Version]
  62. Okuda, T.; Schauer, J.J.; Shafer, M.M. Improved methods for elemental analysis of atmospheric aerosols for evaluating human health impacts of aerosols in East Asia. Atmos. Environ. 2014, 97, 552–555. [Google Scholar] [CrossRef]
  63. Bukowiecki, N.; Dommen, J.; Prévôt, A.S.H.; Richter, R.; Weingartner, E.; Baltensperger, U. A mobile pollutant measurement laboratory—Measuring gas phase and aerosol ambient concentrations with high spatial and temporal resolution. Atmos. Environ. 2002, 36, 5569–5579. [Google Scholar] [CrossRef]
  64. Ketzel, M.; Wåhlin, P.; Kristensson, A.; Swietlicki, E.; Berkowicz, R.; Nielsen, O.J.; Palmgren, F. Particle size distribution and particle mass measurements at urban, near city and rural level in the Copenhagen area and Southern Sweden. Atmos. Chem. Phys. 2004, 4, 281–292. [Google Scholar] [CrossRef] [Green Version]
  65. Albuquerque, P.C.; Gomes, J.F.; Bordado, J.C. Assessment of exposure to airborne ultrafine particles in the urban environment of Lisbon, Portugal. J. Air Waste Manag. Assoc. 2012, 62, 373–380. [Google Scholar] [CrossRef] [PubMed] [Green Version]
  66. Takegawa, N.; Miyakawa, T.; Kondo, Y.; Jimenez, J.L.; Zhang, Q.; Worsnop, D.R.; Fukuda, M. Seasonal and diurnal variations of submicron organic aerosol in Tokyo observed using the Aerodyne aerosol mass spectrometer. J. Geophys. Res. Atmos. 2006, 111, 1–17. [Google Scholar] [CrossRef] [Green Version]
  67. Matsuo, K.; Kikuchi, M.; Iwabuchi, M.; Hara, M.; Takahashi, A.; Kidokoro, Y. Study of Suspended Particulate Matter in Kawasaki City (1991–1998). Annu. Rep. Kawasaki Munic. Res. Inst. Environ. Prot. 2000, 27, 12–25. [Google Scholar]
  68. Jimenez, J.L.; Canagaratna, M.R.; Donahue, N.M.; Prevot, A.S.H.; Zhang, Q.; Kroll, J.H.; DeCarlo, P.F.; Allan, J.D.; Coe, H.; Ng, N.L.; et al. Evolution of organic aerosols in the atmosphere. Science 2009, 326, 1525–1529. [Google Scholar] [CrossRef]
  69. McMurry, P.H. Chapter 17 A review of atmospheric aerosol measurements. Dev. Environ. Sci. 2002, 1, 443–517. [Google Scholar] [CrossRef]
  70. Garratt, J.R. Review: The atmospheric boundary layer. Earth-Sci. Rev. 1994, 37, 89–134. [Google Scholar] [CrossRef]
  71. Turpin, B.J.; Lim, H.J. Species contributions to pm2.5 mass concentrations: Revisiting common assumptions for estimating organic mass. Aerosol Sci. Technol. 2001, 35, 602–610. [Google Scholar] [CrossRef]
  72. Yoshino, A.; Takami, A.; Sato, K.; Shimizu, A.; Kaneyasu, N.; Hatakeyama, S.; Hara, K.; Hayashi, M. Influence of trans-boundary air pollution on the urban atmosphere in Fukuoka, Japan. Atmosphere 2016, 7, 51. [Google Scholar] [CrossRef] [Green Version]
  73. Takami, A.; Miyoshi, T.; Irei, S.; Yoshino, A.; Sato, K.; Shimizu, A.; Hayashi, M.; Hara, K.; Kaneyasu, N.; Hatakeyama, S. Analysis of organic aerosol in Fukuoka, Japan using a PMF method. Aerosol Air Qual. Res. 2016, 16, 314–322. [Google Scholar] [CrossRef] [Green Version]
  74. Nishita-Hara, C.; Hirabayashi, M.; Hara, K.; Yamazaki, A.; Hayashi, M. Dithiothreitol-Measured Oxidative Potential of Size-Segregated Particulate Matter in Fukuoka, Japan: Effects of Asian Dust Events. GeoHealth 2019, 3, 160–173. [Google Scholar] [CrossRef] [PubMed] [Green Version]
  75. Fujitani, Y.; Furuyama, A.; Tanabe, K.; Hirano, S. Comparison of oxidative abilities of PM2.5 collected at traffic and residential sites in Japan. contribution of transition metals and primary and secondary aerosols. Aerosol Air Qual. Res. 2017, 17, 574–587. [Google Scholar] [CrossRef] [Green Version]
  76. Brehmer, C.; Lai, A.; Clark, S.; Shan, M.; Ni, K.; Ezzati, M.; Yang, X.; Baumgartner, J.; Schauer, J.J.; Carter, E. The Oxidative Potential of Personal and Household PM2.5 in a Rural Setting in Southwestern China. Environ. Sci. Technol. 2019, 53, 2788–2798. [Google Scholar] [CrossRef]
  77. Park, M.; Joo, H.S.; Lee, K.; Jang, M.; Kim, S.D.; Kim, I.; Borlaza, L.J.S.; Lim, H.; Shin, H.; Chung, K.H.; et al. Differential toxicities of fine particulate matters from various sources. Sci. Rep. 2018, 8, 1–11. [Google Scholar] [CrossRef]
  78. Fushimi, A.; Saitoh, K.; Hayashi, K.; Ono, K.; Fujitani, Y.; Villalobos, A.M.; Shelton, B.R.; Takami, A.; Tanabe, K.; Schauer, J.J. Chemical characterization and oxidative potential of particles emitted from open burning of cereal straws and rice husk under flaming and smoldering conditions. Atmos. Environ. 2017, 163, 118–127. [Google Scholar] [CrossRef]
  79. Shafer, M.M.; Perkins, D.A.; Antkiewicz, D.S.; Stone, E.A.; Quraishi, T.A.; Schauer, J.J. Reactive oxygen species activity and chemical speciation of size-fractionated atmospheric particulate matter from Lahore, Pakistan: An important role for transition metals. J. Environ. Monit. 2010, 12, 704–715. [Google Scholar] [CrossRef]
  80. Yu, J.Z.; Xu, J.; Yang, H. Charring characteristics of atmospheric organic particulate matter in thermal analysis. Environ. Sci. Technol. 2002, 36, 754–761. [Google Scholar] [CrossRef]
  81. Verma, V.; Wang, Y.; El-Afifi, R.; Fang, T.; Rowland, J.; Russell, A.G.; Weber, R.J. Fractionating ambient humic-like substances (HULIS) for their reactive oxygen species activity—Assessing the importance of quinones and atmospheric aging. Atmos. Environ. 2015, 120, 351–359. [Google Scholar] [CrossRef]
  82. Li, Y.; Ji, Y.; Zhao, J.; Wang, Y.; Shi, Q.; Peng, J.; Wang, Y.; Wang, C.; Zhang, F.; Wang, Y.; et al. Unexpected Oligomerization of Small α-Dicarbonyls for Secondary Organic Aerosol and Brown Carbon Formation. Environ. Sci. Technol. 2021, 55, 4430–4439. [Google Scholar] [CrossRef] [PubMed]
  83. Sartelet, K.; Couvidat, F.; Wang, Z.; Flageul, C.; Kim, Y. SSH-aerosol v1.1: A modular box model to simulate the evolution of primary and secondary aerosols. Atmosphere 2020, 11, 525. [Google Scholar] [CrossRef]
  84. Xiao, H.W.; Xiao, H.Y.; Shen, C.Y.; Zhang, Z.Y.; Long, A.M. Chemical composition and sources of marine aerosol over the western north Pacific ocean in winter. Atmosphere 2018, 9, 298. [Google Scholar] [CrossRef] [Green Version]
  85. Keene, W.C.; Pszenny, A.A.P.; Galloway, J.N.; Hawley, M.E. Sea-salt corrections and interpretation of constituent ratios in marine precipitation. J. Geophys. Res. 1986, 91, 6647. [Google Scholar] [CrossRef]
  86. Duan, J.; Tan, J. Atmospheric heavy metals and Arsenic in China: Situation, sources and control policies. Atmos. Environ. 2013, 74, 93–101. [Google Scholar] [CrossRef]
  87. Calvo, A.I.; Alves, C.; Castro, A.; Pont, V.; Vicente, A.M.; Fraile, R. Research on aerosol sources and chemical composition: Past, current and emerging issues. Atmos. Res. 2013, 120–121, 1–28. [Google Scholar] [CrossRef]
  88. Yu, J.; Yan, C.; Liu, Y.; Li, X.; Zhou, T.; Zheng, M. Potassium: A tracer for biomass burning in Beijing? Aerosol Air Qual. Res. 2018, 18, 2447–2459. [Google Scholar] [CrossRef] [Green Version]
  89. Sakata, M.; Kurata, M.; Tanaka, N. Estimating contribution from municipal solid waste incineration to trace metal concentrations in Japanese urban atmosphere using lead as a marker element. Geochem. J. 2000, 34, 23–32. [Google Scholar] [CrossRef]
  90. Sakata, M.; Marumoto, K. Formation of atmospheric particulate mercury in the Tokyo metropolitan area. Atmos. Environ. 2002, 36, 239–246. [Google Scholar] [CrossRef]
  91. Choël, M.; Deboudt, K.; Flament, P. Development of time-resolved description of aerosol properties at the particle scale during an episode of industrial pollution plume. Water Air Soil Pollut. 2010, 209, 93–107. [Google Scholar] [CrossRef]
  92. Yang, H.; Yu, J.Z. Uncertainties in charring correction in the analysis of elemental and organic carbon in atmospheric particles by thermal/optical methods. Environ. Sci. Technol. 2002, 36, 5199–5204. [Google Scholar] [CrossRef] [PubMed]
  93. Li, P.H.; Han, B.; Huo, J.; Lu, B.; Ding, X.; Chen, L.; Kong, S.F.; Bai, Z.P.; Wang, B. Characterization, meteorological influences and source identification of carbonaceous aerosols during the autumn-winter period in Tianjin, China. Aerosol Air Qual. Res. 2012, 12, 283–294. [Google Scholar] [CrossRef]
  94. Hidemori, T.; Nakayama, T.; Matsumi, Y.; Kinugawa, T.; Yabushita, A.; Ohashi, M.; Miyoshi, T.; Irei, S.; Takami, A.; Kaneyasu, N.; et al. Characteristics of atmospheric aerosols containing heavy metals measured on Fukue Island, Japan. Atmos. Environ. 2014, 97, 447–455. [Google Scholar] [CrossRef]
  95. Tian, H.Z.; Wang, Y.; Xue, Z.G.; Cheng, K.; Qu, Y.P.; Chai, F.H.; Hao, J.M. Trend and characteristics of atmospheric emissions of Hg, As, and Se from coal combustion in China, 1980–2007. Atmos. Chem. Phys. 2010, 10, 11905–11919. [Google Scholar] [CrossRef] [Green Version]
  96. Cao, T.; Li, M.; Zou, C.; Fan, X.; Song, J.; Jia, W.; Yu, C.; Yu, Z.; Peng, P. Chemical composition, optical properties, and oxidative potential of water- and methanol-soluble organic compounds emitted from the combustion of biomass materials and coal. Atmos. Chem. Phys. Discuss. 2021, 21, 13187–13205. [Google Scholar] [CrossRef]
  97. Verma, V.; Rico-Martinez, R.; Kotra, N.; King, L.; Liu, J.; Snell, T.W.; Weber, R.J. Contribution of water-soluble and insoluble components and their hydrophobic/hydrophilic subfractions to the reactive oxygen species-generating potential of fine ambient aerosols. Environ. Sci. Technol. 2012, 46, 11384–11392. [Google Scholar] [CrossRef]
  98. Yu, H.; Wei, J.; Cheng, Y.; Subedi, K.; Verma, V. Synergistic and Antagonistic Interactions among the Particulate Matter Components in Generating Reactive Oxygen Species Based on the Dithiothreitol Assay. Environ. Sci. Technol. 2018, 52, 2261–2270. [Google Scholar] [CrossRef]
Figure 1. Map of Japan showing the locations of the urban Yokohama (red circle) and rural Noto (blue circle) observation sites.
Atmosphere 13 00319 g001
Figure 2. Temporal variations in physicochemical parameters, oxidative potentials, and meteorological data at the two sites: (a) the urban Yokohama site; (b) the rural Noto site. Average PM2.5 mass concentration (black), LDSA concentration (red), and OPvDTT (blue) are shown in the first layer. Hourly PM2.5 mass concentrations (gray) are also described in the same layer. In the second layer, the wind vector and proportion of the sectors from which the trajectories inflowed (China: red; Russia: green; Pacific Ocean/Japan: blue) are shown. Light colors in the bar graphs are used when <65% of the positions in air mass trajectory belong to a certain sector. The detailed definition of the sectors is given in Figure S1. Atmospheric concentrations of Al, K, Fe, Mn, Zn, Pb, black carbon (BC), SO42−, and OCpyro are shown between the third and fifth layers.
Atmosphere 13 00319 g002
Figure 3. Comparison of the relationships between two particle concentrations and OPvDTT: (a) versus the PM2.5 mass concentration, (b) versus the LDSA concentration. Red and blue colors represent the results of the urban Yokohama and rural Noto sites, respectively. OPvDTT represents the OPDTT per unit mass.
Atmosphere 13 00319 g003
Figure 4. Temporal variations of the K/Pb ratio and OPmDTT at the Noto site.
Atmosphere 13 00319 g004
Figure 5. Plots of mass-normalized OPDTT (OPmDTT) against the specific LDSA at the two sites. (a) Red and orange colors correspond to those of the urban Yokohama site in autumn/winter and in spring, while blue and light blue colors correspond to those of the rural Noto site in autumn/winter and in spring. (b) Plots were colored by the ratio of OCpyro to the PM2.5.
Atmosphere 13 00319 g005
Figure 6. DTT activity of single-component particles: (a) plots of mass concentration versus OPDTT of MnO2, ZnO, PbO2, and KCl; (b) plots of surface area concentration versus OPDTT of MnO2 with different size distributions. The size distributions of MnO2 particles are shown in Figure S2.
Atmosphere 13 00319 g006
Publisher’s Note: MDPI stays neutral with regard to jurisdictional claims in published maps and institutional affiliations.

