Article

Experimental and Theoretical Studies of Trans-2-Pentenal Atmospheric Ozonolysis

1
Groupe de Spectrométrie Moléculaire et Atmosphérique (GSMA), UMR CNRS 7331, Université de Reims, 51687 Reims, France
2
IMT Nord Europe, Center for Energy and Environment, Institut Mines-Télécom, University Lille, 59000 Lille, France
3
Institut de Physique de Rennes (IPR), University Rennes, UMR CNRS 6251, 35000 Rennes, France
4
Institute for Atmospheric and Environmental Research, University of Wuppertal, 42119 Wuppertal, Germany
5
Department of Physics, Bharathiar University, Coimbatore 641046, India
*
Authors to whom correspondence should be addressed.
Atmosphere 2022, 13(2), 291; https://doi.org/10.3390/atmos13020291
Submission received: 27 December 2021 / Revised: 4 February 2022 / Accepted: 5 February 2022 / Published: 9 February 2022

Abstract

:
We investigated the kinetics, mechanism and secondary organic aerosols formation of the ozonolysis of trans-2-pentenal (T2P) using four different reactors with Fourier Transform InfraRed (FTIR) spectroscopy and Gas Chromatography (GC) techniques at T = 298 ± 2 K and 760 Torr in dry conditions. The rate coefficients and branching ratios were also evaluated using the canonical variational transition (CVT) state theory coupled with small curvature tunneling (CVT/SCT) in the range 278–350 K. The experimental rate coefficient at 298 K was (1.46 ± 0.17) × 10−18 cm3 molecule−1 s−1, in good agreement with the theoretical rate. The two primary carbonyls formation yields, glyoxal and propanal, were 57 ± 10% and 42 ± 12%, respectively, with OH scavenger compared to 38 ± 8% for glyoxal and 26 ± 5% for propanal without OH scavenger. Acetaldehyde and 2-hydroxypropanal were also identified and quantified with yields of 9 ± 3% and 5 ± 2%, respectively, in the presence of OH scavenger. For the OH production, an upper limit of 24% was estimated using mesitylene as OH tracer. Combining experimental and theoretical findings enabled the establishment of a chemical mechanism. Finally, the SOA formation was observed with mass yields of about 1.5%. This work provides additional information on the effect of the aldehyde functional group on the fragmentation of the primary ozonide.

1. Introduction

Biogenic volatile organic compounds (BVOCs) account for 90% of global VOC emissions in the atmosphere [1]. BVOCs are important precursors of secondary pollutants such as tropospheric ozone and Secondary Organic Aerosols (SOA). However, the mechanisms by which BVOCs are oxidized are often not well understood. Therefore, kinetic and mechanistic studies concerning the atmospheric reactivity of BVOC compounds are still needed.
Damaged plants have been shown to emit oxygenated compounds with a double bond such as unsaturated aldehydes in response to stress [2]. The atmospheric fate of these compounds is largely correlated with the presence of the olefinic bond which facilitates their oxidation by the main atmospheric oxidants (OH, NO3 and O3). In addition, the aldehyde function can promote their photolysis under solar radiation but this oxidation pathway is still under debate [3]. Among the unsaturated aldehydes detected in the atmosphere is trans-2-pentenal (T2P), a green leaf volatile (GLV) identified with concentrations of a few ppb [1,4]. It has been detected during soybean preparation after anaerobic incubation [5]. Nevertheless, few studies exist regarding the reactivity and the atmospheric fate of unsaturated aldehydes with a chain length higher than four carbon atoms particularly towards ozone [6,7,8,9,10].
Two studies in the literature deal with gas-phase kinetics of trans 2-pentenal with ozone. The first one carried out by Sato et al. [11] at room temperature and 1 atm of air used the relative rate method, while the second one by Kalalian et al. [12] determined the temperature dependence of the rate coefficients over the range of 273–353 K using the absolute method. The room temperature rate coefficients obtained by both studies, (1.59 ± 0.22) × 10−18 and (1.24 ± 0.06) × 10−18 cm3 molecule−1 s−1, respectively, were in good agreement. To the best of our knowledge, no product and mechanistic studies were performed for this reaction.
To complete our understanding of the ozonolysis of T2P, we conducted laboratory experiments using various complementary setups under atmospheric conditions of temperature (T = 298 ± 2 K) and pressure (760 Torr). Absolute rate coefficients were determined in batch and flow reactors and reaction products were identified using two analytical techniques: Fourier Transform Infrared (FTIR) spectroscopy and Gas Chromatography–Mass Spectrometry (GC-MS). SOA formation was also investigated in two different chambers. In addition, the reaction of T2P with O3 was studied theoretically using the canonical variational transition (CVT) state theory coupled with small curvature tunneling (CVT/SCT) over the temperature range 278–350 K.

2. Experimental Section

Experiments were performed at room temperature and atmospheric pressure in three different laboratories: IMT Nord Europe (France), IAE Wuppertal University (Germany) and GSMA/Reims University (France) using complementary analytical devices.

2.1. Kinetic Study (IMT Nord Europe)

The rate coefficients were determined using the absolute method in two complementary setups:
a Pyrex laminar flow reactor (LFR) coupled to a GC with a double detection by Mass Spectrometry and Flame Ionization Detection (GC-MS/FID).
a 300 L Teflon atmospheric simulation chamber (ASC) coupled to a FTIR spectrometer.
Ozone was produced using a high-voltage discharge generator (C-Lasky Ozone Generator). An O3 UV-absorption analyzer (Model 42 M, Environnement SA) was used in both ASC and LFR experiments. T2P concentrations were quantified by GC-MS/FID (Agilent 6890N with 5975B inert MSD, LFR, Santa Clara, CA, USA) and FTIR spectroscopy (Thermo Scientific, Nicolet 6700 with DTGS detector, ASC, Waltham, MA, USA). The LFR and ASC setups and their associated working methodologies were described in detail in previous studies [13,14].
Preliminary tests were performed to determine wall losses for both T2P and O3. Ozone wall losses (kwall loss) in ASC and LFR were measured as 2.9 × 10⁻⁵ and 9.3 × 10⁻⁵ s−1, respectively. Wall losses of T2P were found to be negligible in both reactors. Possible bias in O3 concentration measurements due to T2P UV-absorption were checked through separate experiments and allowed us to conclude a negligible contribution of T2P to the O3 signal (about 1%).
A typical experiment started by introducing T2P in the reactor for a stabilization time of at least 30 min. Ozone was then introduced and its concentration was monitored continuously. Experiments were performed under pseudo-first-order conditions where the initial aldehyde concentration was at least 10 times greater than that of ozone. Thus, the T2P + O3 rate coefficient k was determined by plotting the consumption of ozone as a function of time as follows:
l n O 3   0 O 3   = k × t
With k = k × T 2 P 0 + k wall   loss , [T2P]0 and [O3]0 are the initial concentrations of T2P and ozone, respectively, [O3] is the concentration of ozone at time t and k’ is the pseudo-first-order rate coefficient. The experimental conditions used in ASC and LFR are summarized in Table 1. No OH radical scavenger was used in the present study, since the O3 decay (Equation (1) does not depend on the presence of OH radicals in the reactor [15].

2.2. Mechanistic Study

2.2.1. Product Identification and Quantification in the Absence of an OH Scavenger (QUAREC)

The experimental setup was detailed in a previous study by Illmann et al. [17] and only a brief description will be given in this part. QUAREC is a cylindrical quartz reactor of ~1 m3 equipped with an in situ FTIR spectrometer (Thermo Nicolet Nexus with MCT detector). During the experiments the spectra were recorded in the spectral range 4000–700 cm−1 every 5 min by integrating 120 interferograms. The used spectral resolution was 1 cm−1.
The products were identified and quantified by FTIR spectroscopy, where recorded spectra were compared with references available in IR databases at the Wuppertal laboratory. The quantification of propanal was completed using tabulated IR absorption cross-sections determined in QUAREC. Glyoxal was quantified using absorption cross-sections determined by Volkamer et al. [18]. T2P, propanal and glyoxal concentrations were retrieved using the following IR absorption bands centered at 1150 and 2726 cm−1, 850 and 2992 cm−1, and 2835 cm−1, respectively, by iterative subtraction of calibrated reference spectra. A few gas samples taken on Carbotrap 202 cartridges were analyzed by GC-MS/FID at the IMT laboratory after thermal desorption [19]. No quantification was done for the products identified via GC-MS/FID.
The initial concentrations ranged from 1.6 to 2.1 ppm for T2P and from ~1 to 5 ppm for ozone. Product yields (YProd) were determined by plotting the amount of reaction product formed [Prod] to the amount of reactant consumed Δ[T2P]:
Y P r o d   % = 100 × P r o d T 2 P
Uncertainties on YProd were obtained by adding errors on Δ[T2P] (estimated at 14%) and errors on [Prod] arising from uncertainties on both absorption cross-sections (5%) and the subtraction procedure (10%). Overall uncertainties on YProd calculated by error propagation were of the order of 20%.
Two additional experiments were performed by adding mesitylene to the reaction mixture, as OH tracer, to determine the formation of OH radicals in this system. In these experiments, only FTIR was used to monitor the T2P and mesitylene decays.

2.2.2. Product Identification and Quantification in the Presence of an OH Scavenger (RASC)

The Rigid Atmospheric Simulation Chamber (RASC) has been described in previous studies [12,20]. Reaction products were identified and quantified by Solid-Phase Micro-Extraction (SPME) followed by GC-MS analysis (in [21,22], see also Supplementary Materials). The sampling was done every 15 min. In situ FTIR spectroscopy was also used for T2P and hydroxy-aldehyde analysis. IR spectra were recorded every 3 min. The IR bands of T2P at 1615–1674 cm−1 and those of 2-hydroxypropanal at 1043–1077 cm−1 were processed and integrated. Calibration curves were established for each of the products likely formed in the reactor. The concentrations of the products were then calculated using these calibration curves. More details about the product identification procedure can be found in our previous papers [6,21]. Experiments were carried out in the presence of an excess of cyclohexane as OH scavenger. The initial concentrations of the reactants were 16 ppm for T2P and 364 ppm for cyclohexane.
As for QUAREC, product yields were determined by plotting the amount of reaction products formed to the amount of the reactant consumed. The obtained yields correspond to the average of six experiments performed under atmospheric conditions. Reported uncertainties on these yields are twice the standard deviation (2σ).

2.3. SOA Formation (IMT Nord Europe)

Experiments were carried out in the ASC chamber without adding an OH scavenger due to its possible influence on the SOA formation [19,23]. The Scanning Mobility Particle Sizer (SMPS) technique was used for monitoring nanoparticle formation (10–400 nm) over the reaction time (TSI, DMA 3080 and CPC 3788). No particles were observed before starting the reaction between O3 and T2P. The ozonolysis reaction was investigated using initial mixing ratios of 2.1–4.5 ppm and 65–520 ppb for T2P and O3, respectively. FTIR spectroscopy and O3 analyzer were used to check the consumption of both reagents (T2P and O3).
Taking into account the relatively high surface-to-volume (S/V) ratio of the reactor (about 7 m−1), semi-volatile gas and aerosol losses on the walls cannot be avoided [24]. For each experiment, particle wall losses were determined after the maximum particle formation, where more than 90% of O3 (default reactant) was consumed. First-order decay rates of around 10% h−1 were obtained and used to correct for aerosol wall losses. SOA formation yields (YSOA) were calculated according to Odum et al. [25]:
Y S O A   % = M 0 T 2 P m × 100
where M0 is the maximum aerosol mass concentration corrected for wall losses and Δ[T2P]m is the consumed mass concentration of T2P at the same time. M0 was calculated from the measured number size distributions assuming a density of 1 g cm−3 and spherical particles.

3. Computational Methodology (Bharathiar University)

Initially, the ground state of T2P geometry was optimized at the M06-2X/6-311++G(d,p) level of theory. Geometry optimization of all the molecular entities such as reactant (R), reactant complex (RC), transition state (TS) and products (P) involved in the proposed reaction scheme was executed using Density Functional Theory (DFT) methods such as M06-2X [26] and BHandHLYP [27] with a 6-311++G(d,p) basis set. Besides DFT, a wave function based MP2/6-311++G(d,p) method is utilized to optimize the geometries of all stationary points. Moreover, the single point energy calculations were carried out at the CCSD(T)/6-311++G(d,p) level of theory. The nature of the stationary points was verified using harmonic vibrational frequencies calculation for all structures by employing both DFT and wave function methods. The transition states have only one imaginary frequency, thus confirming their location as maxima in one reaction coordinate. Further, the intrinsic reaction coordinate (IRC) calculations were performed to construct a minimum energy path (MEP), thereby, to predict whether the located transition state connects precisely with the designated local minima using the Gonzalez–Schlegel steepest descent path with mass-weighted internal coordinates [28,29].
In the succeeding steps of the study, we predict the accurate rate coefficients for the initial and secondary reactions. Based on earlier gas-phase kinetic studies, it is well known that M06-2X functional [26,30,31,32] can determine reliable barrier heights. Thus, the rate coefficients were evaluated using the canonical variational transition state theory (CVTST) coupled with small curvature tunneling (CVTST/SCT) over the temperature range 278–350 K at M06-2X functional with 6-311++G(d,p) basis set. The rate coefficient at temperature T using CVT state theory [33,34,35] is as follows:
k C V T T = m i n s k G T T , S
where k G T T , S = σ k B T h Q G T T , S   φ R T e ν M E P s k B T .
In Equation (4), mins signifies the location of the generalized transition state (GTS) at minimized dividing surface s and k G T T , s is the GTS theory rate coefficient at the dividing surface s. σ is the symmetry factor to illustrate the possibility of more than one symmetry-related reaction path, k B is Boltzmann’s constant and h is Planck’s constant. ϕ R(T) is the reactant classical partition function per unit volume, v M E P ( s ) is the classical potential energy at point s on the minimum energy path and Q G T T , s is the classical partition function of a GTS with a local zero of energy v M E P ( s ) and with all rotational symmetry numbers set to unity. Quantum tunneling effects were determined using the SCT method [36,37].
The equilibrium constant is calculated using the following formulae (Kc in concentration units):
K c = K p R T Δ n
R T   l n   K p = Δ G T °
where R (in J/mol/K) is the universal gas constant, Kp is the equilibrium constant in pressure units, Δn is the difference between the total moles of gas on the product side and the total moles of gas on the reactant side, and ΔG is the standard Gibbs energy at a pressure of 1 atm. The kinetics of all reaction pathways was calculated using GAUSSRATE 2009A [38] program, which is an interface between the GAUSSIAN09 [39] and POLYRATE 2010A (University of Minnesota, Minneapolis, USA) [40] program. All electronic structure calculations were performed using the GAUSSIAN09 (Gaussian.Inc, Wallingford, CT, USA) program package. The CCSD(T) single-point energy calculations were performed using the MOLPRO [41] package.

4. Results and Discussion

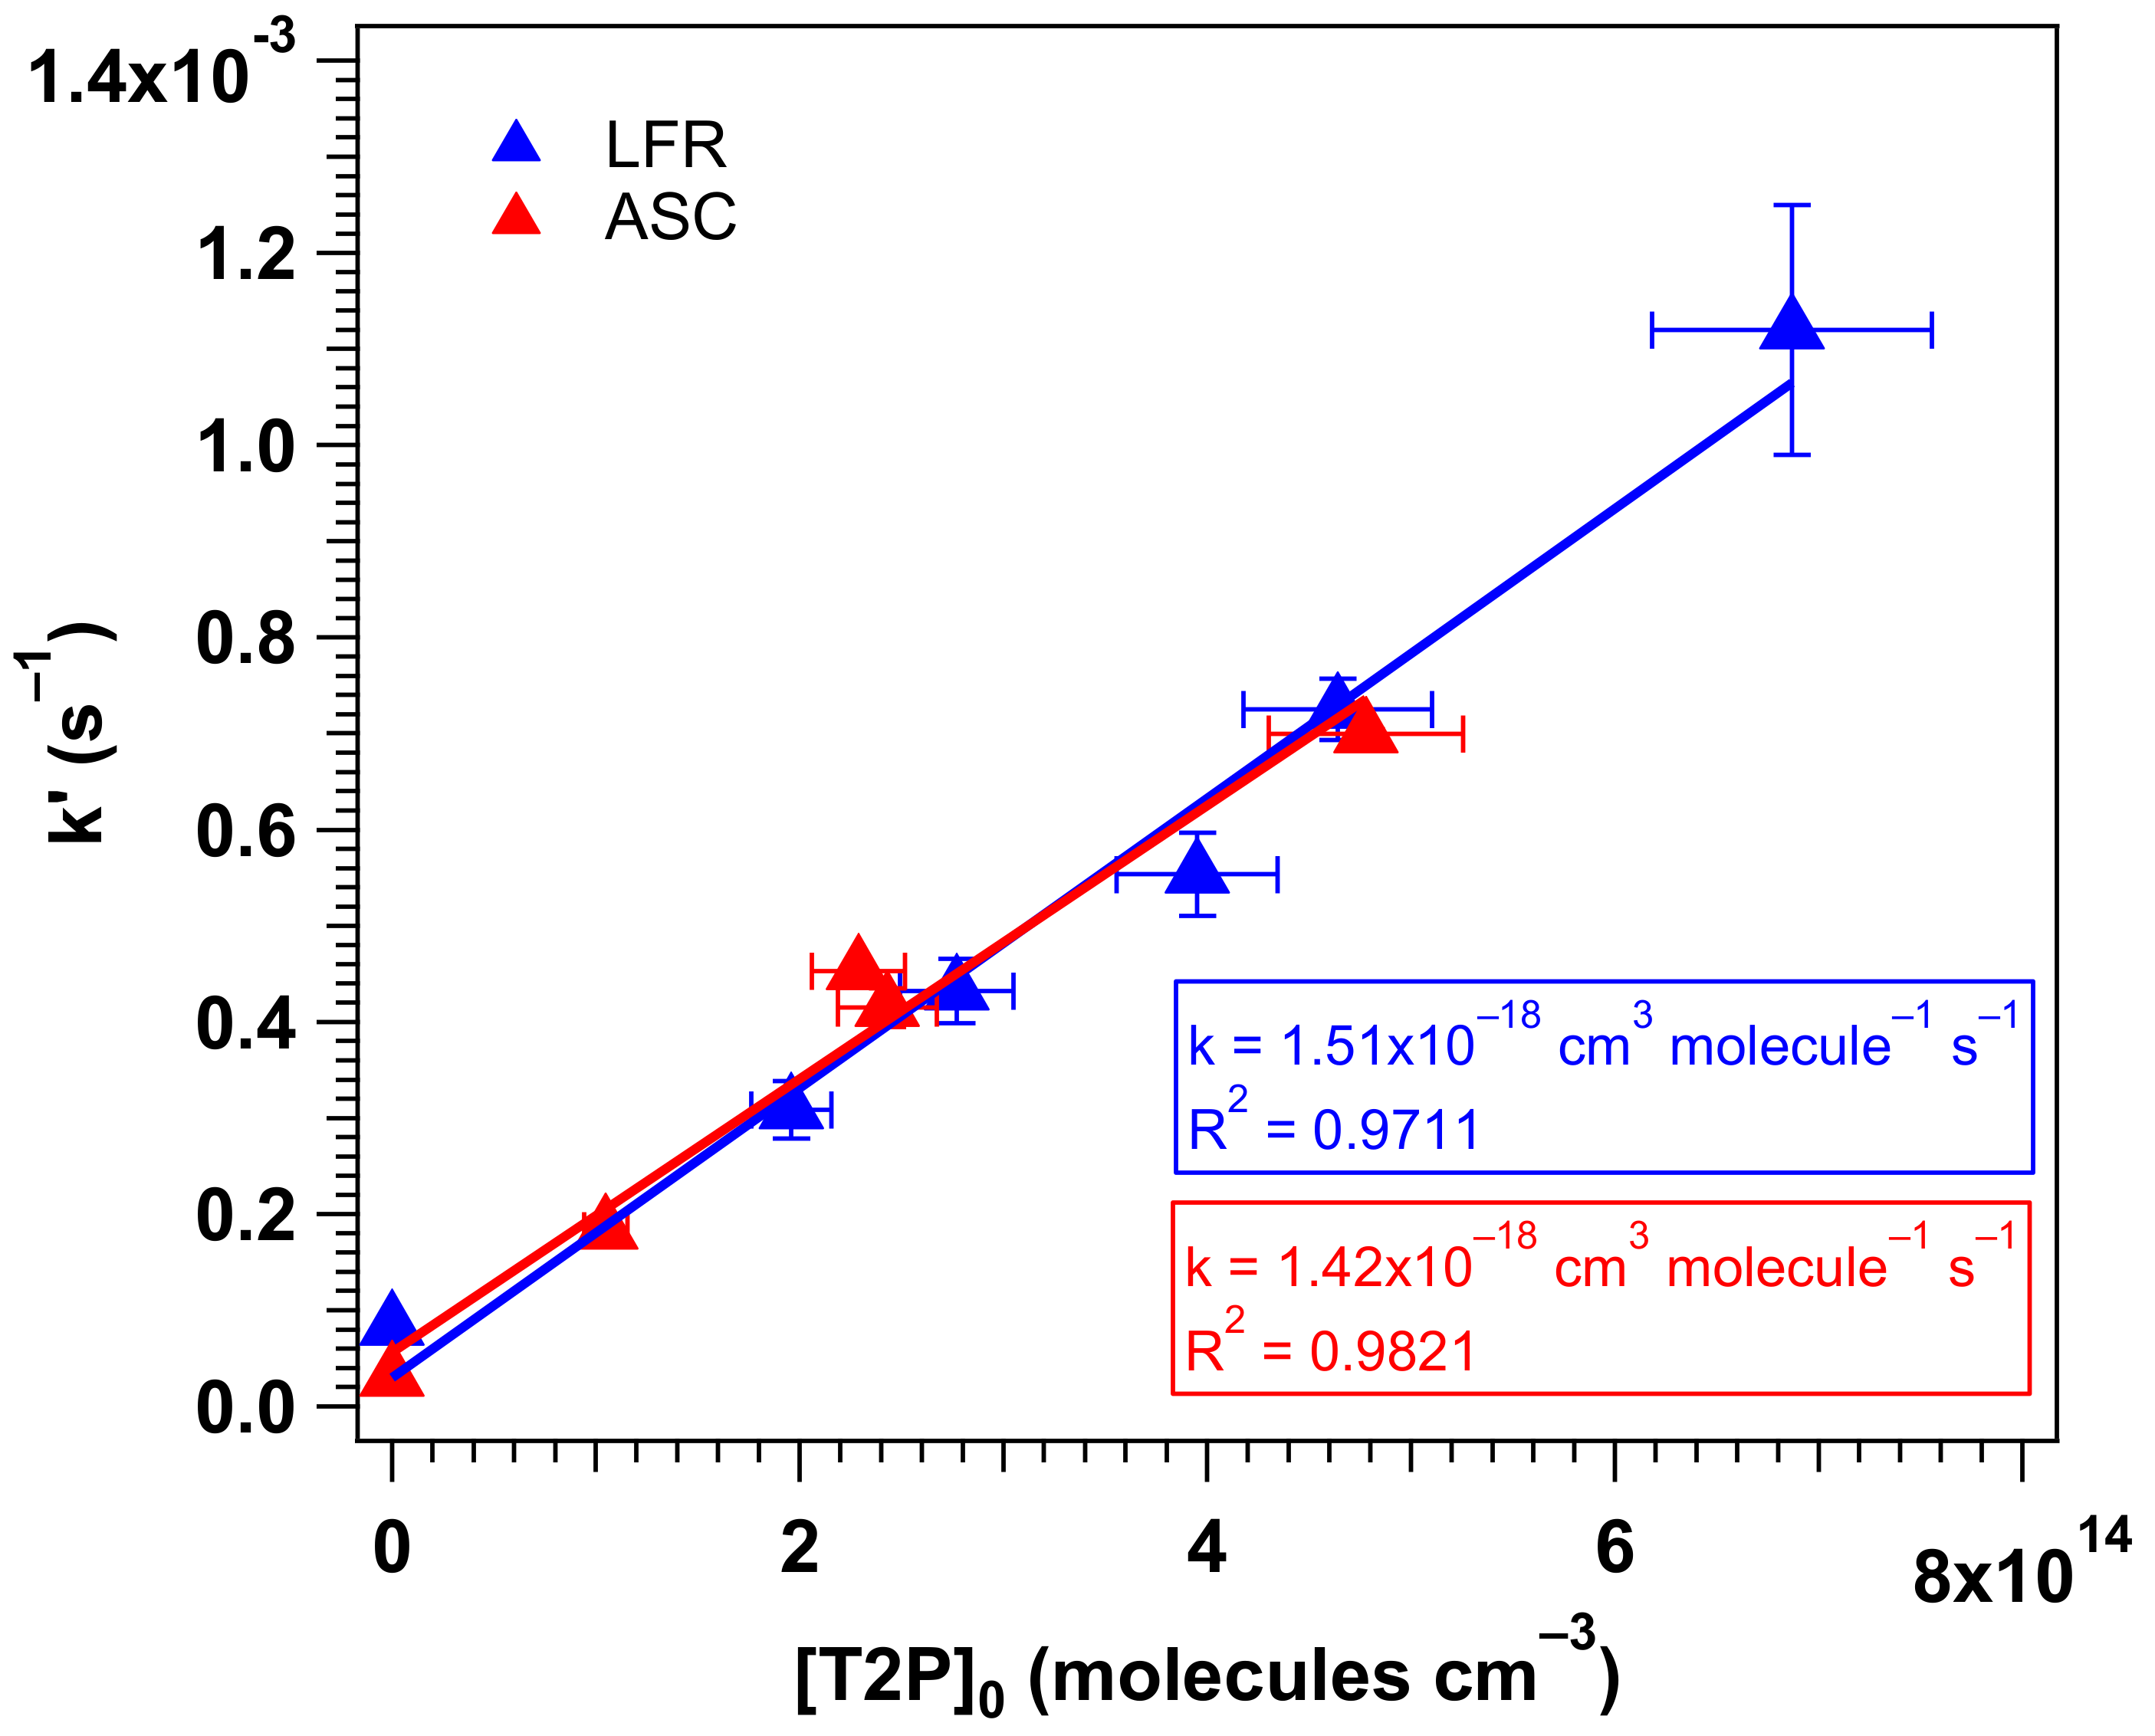
4.1. Experimental Kinetic Study

Representative plots of ln([O3]0/[O3]) as a function of time, for different initial concentrations of T2P are presented in Figure S1 (ASC) and Figure S2 (LFR), where a very good linearity is observed. The ozone decay in each experiment was fitted with a linear curve, according to Equation (1), and the pseudo first order rate coefficients k’ were retrieved from the respective slopes. A linear regression of k’ vs. [T2P]0 (Figure 1) gives the second-order rate coefficient k (cm3 molecule−1 s−1). The ozonolysis rate coefficients obtained in LFR: (1.51 ± 0.22) × 10−18 cm3 molecule−1 s−1 and in ASC: (1.42 ± 0.21) × 10−18 cm3 molecule−1 s−1 agree very well, enabling an average k = (1.46 ± 0.31) × 10−18 cm3 molecule−1 s−1 to be calculated. Table 1 summarizes the results together with literature data.
Statistical errors on k’ (2σ) result from the fitting procedure. These errors are reported in Figure 1 and represent 1–5% for chamber data and 4–12% for flow reactor data. An uncertainty of about 10% was determined for [T2P]0 from the calibration procedure. Propagating the errors results in a global uncertainty on k of about 15%.
As seen in Table 1, a very good agreement was found with the rate coefficients experimentally determined in previous studies [11,12] as well as with the predicted value according to a recently reported SAR [16] with discrepancies below 15%. To the best of our knowledge, our work includes the first determination of the rate coefficient of the T2P + O3 reaction obtained in a flow system.

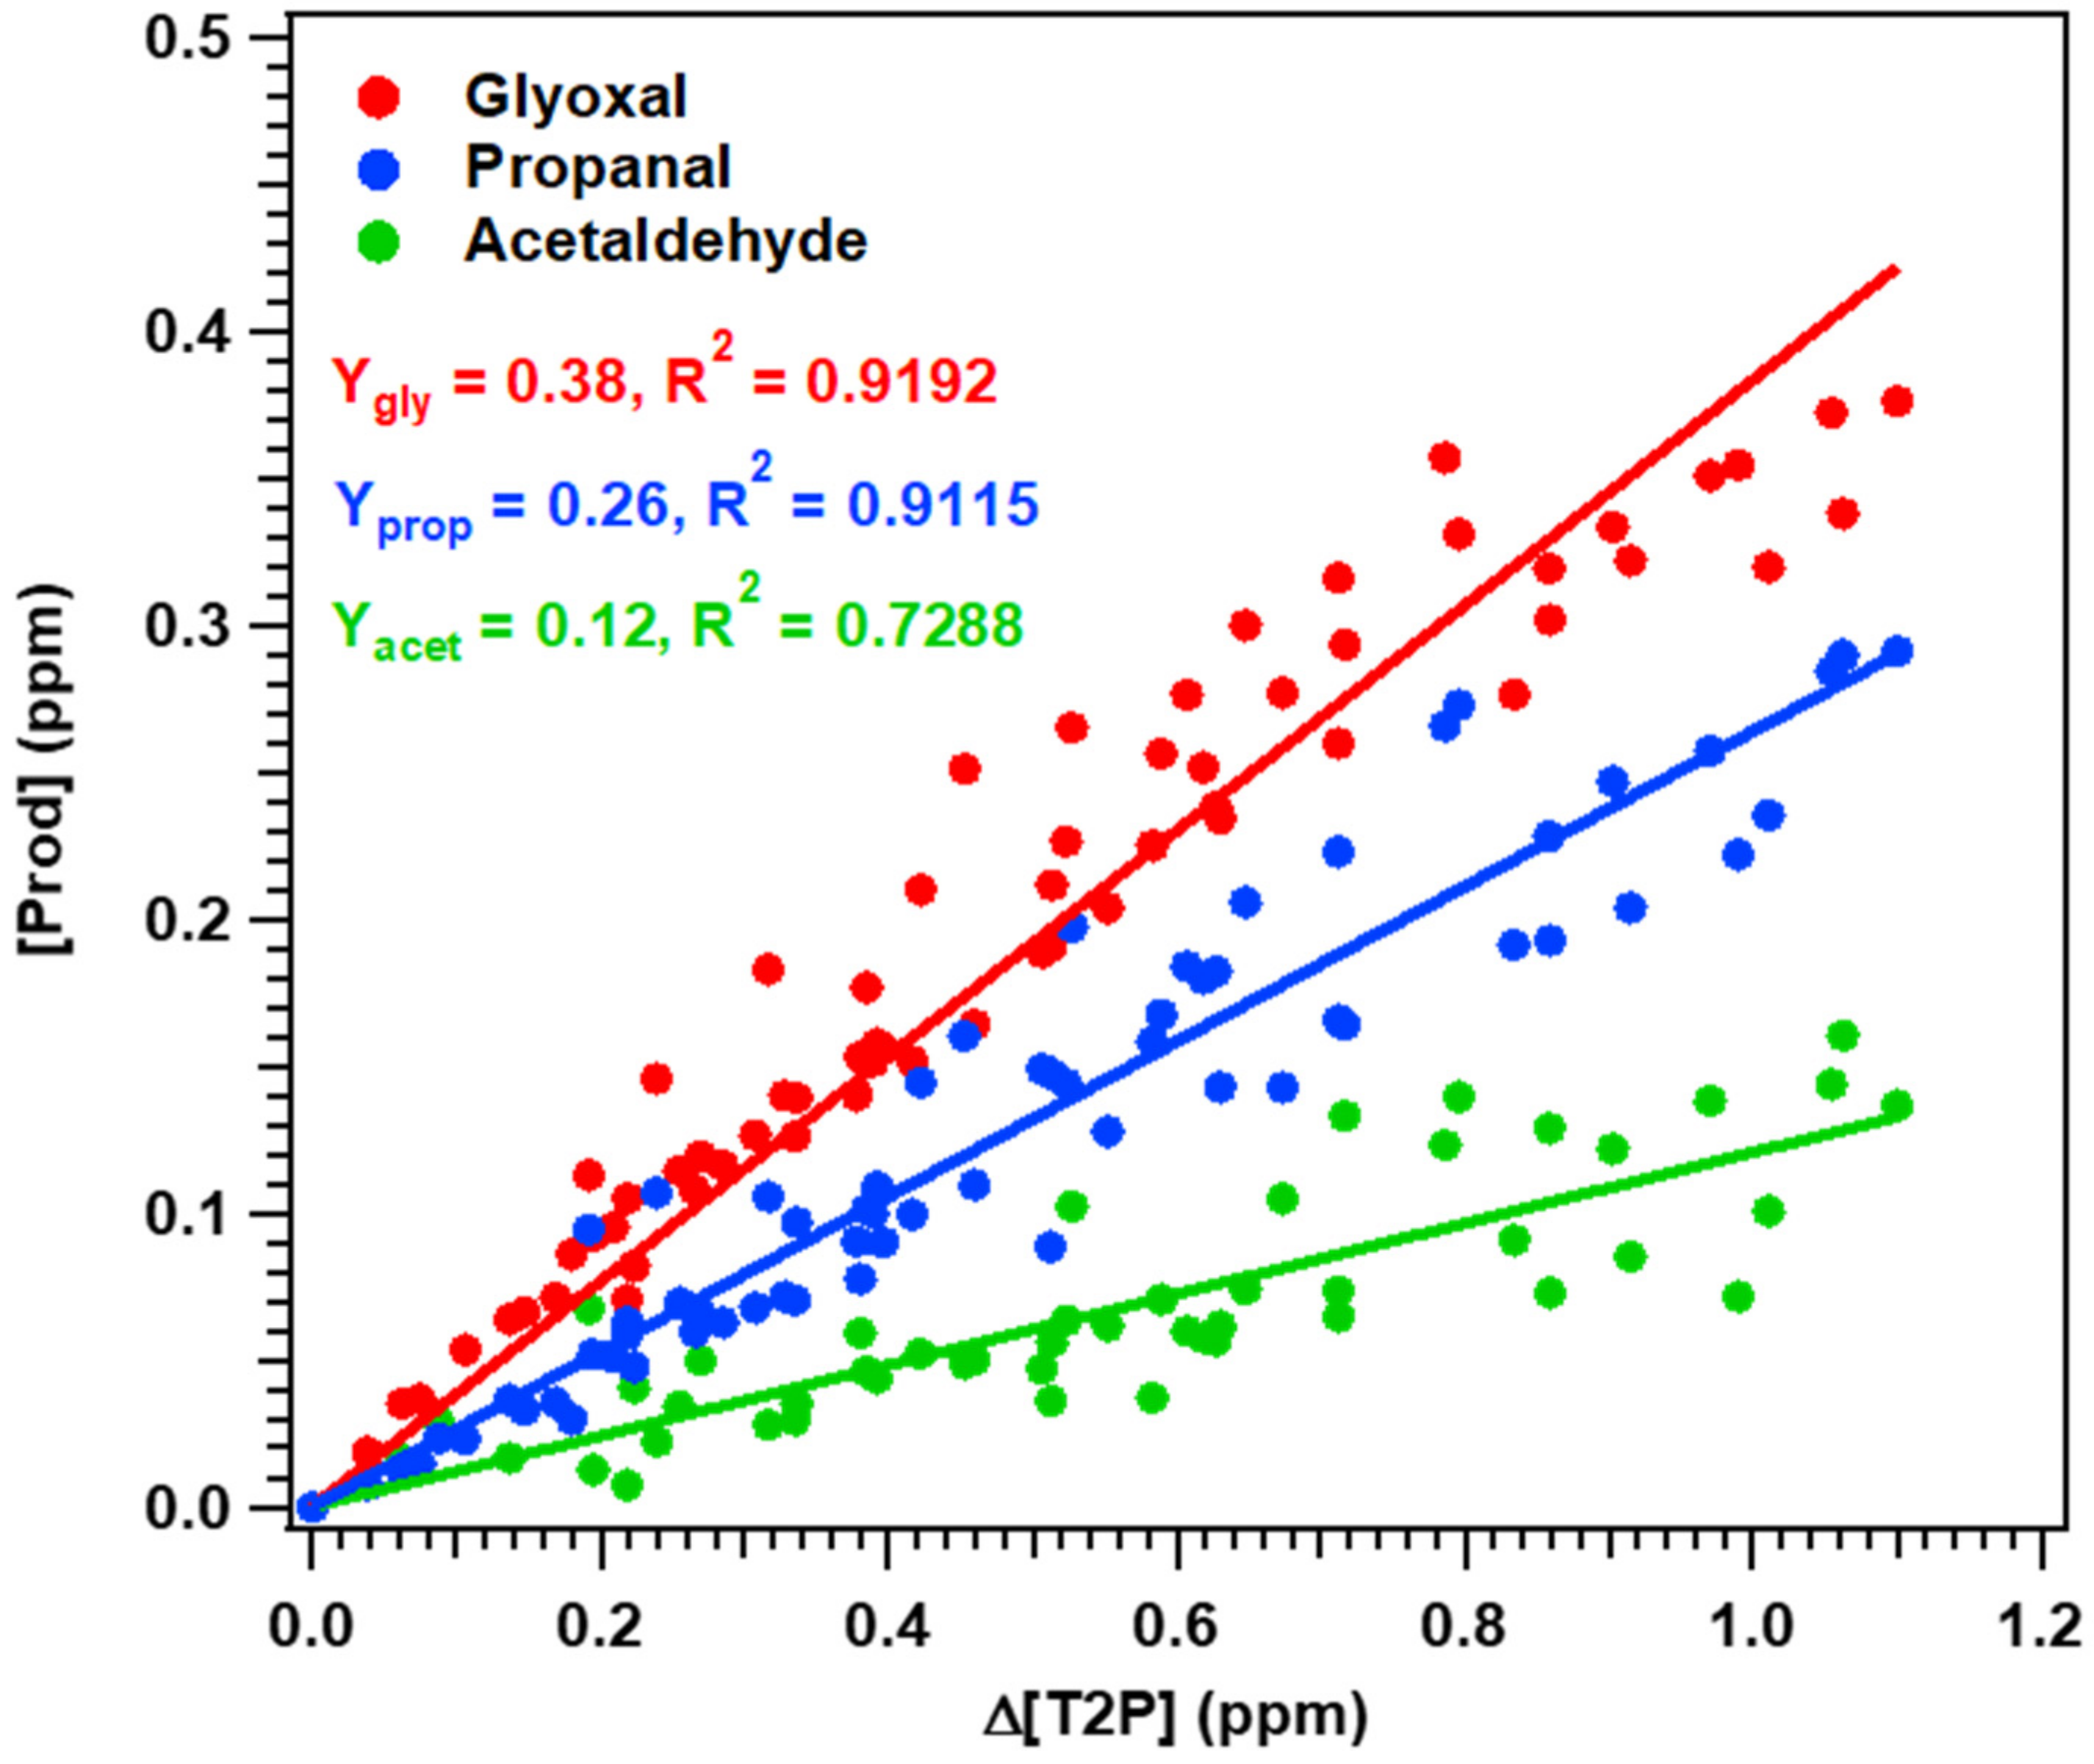
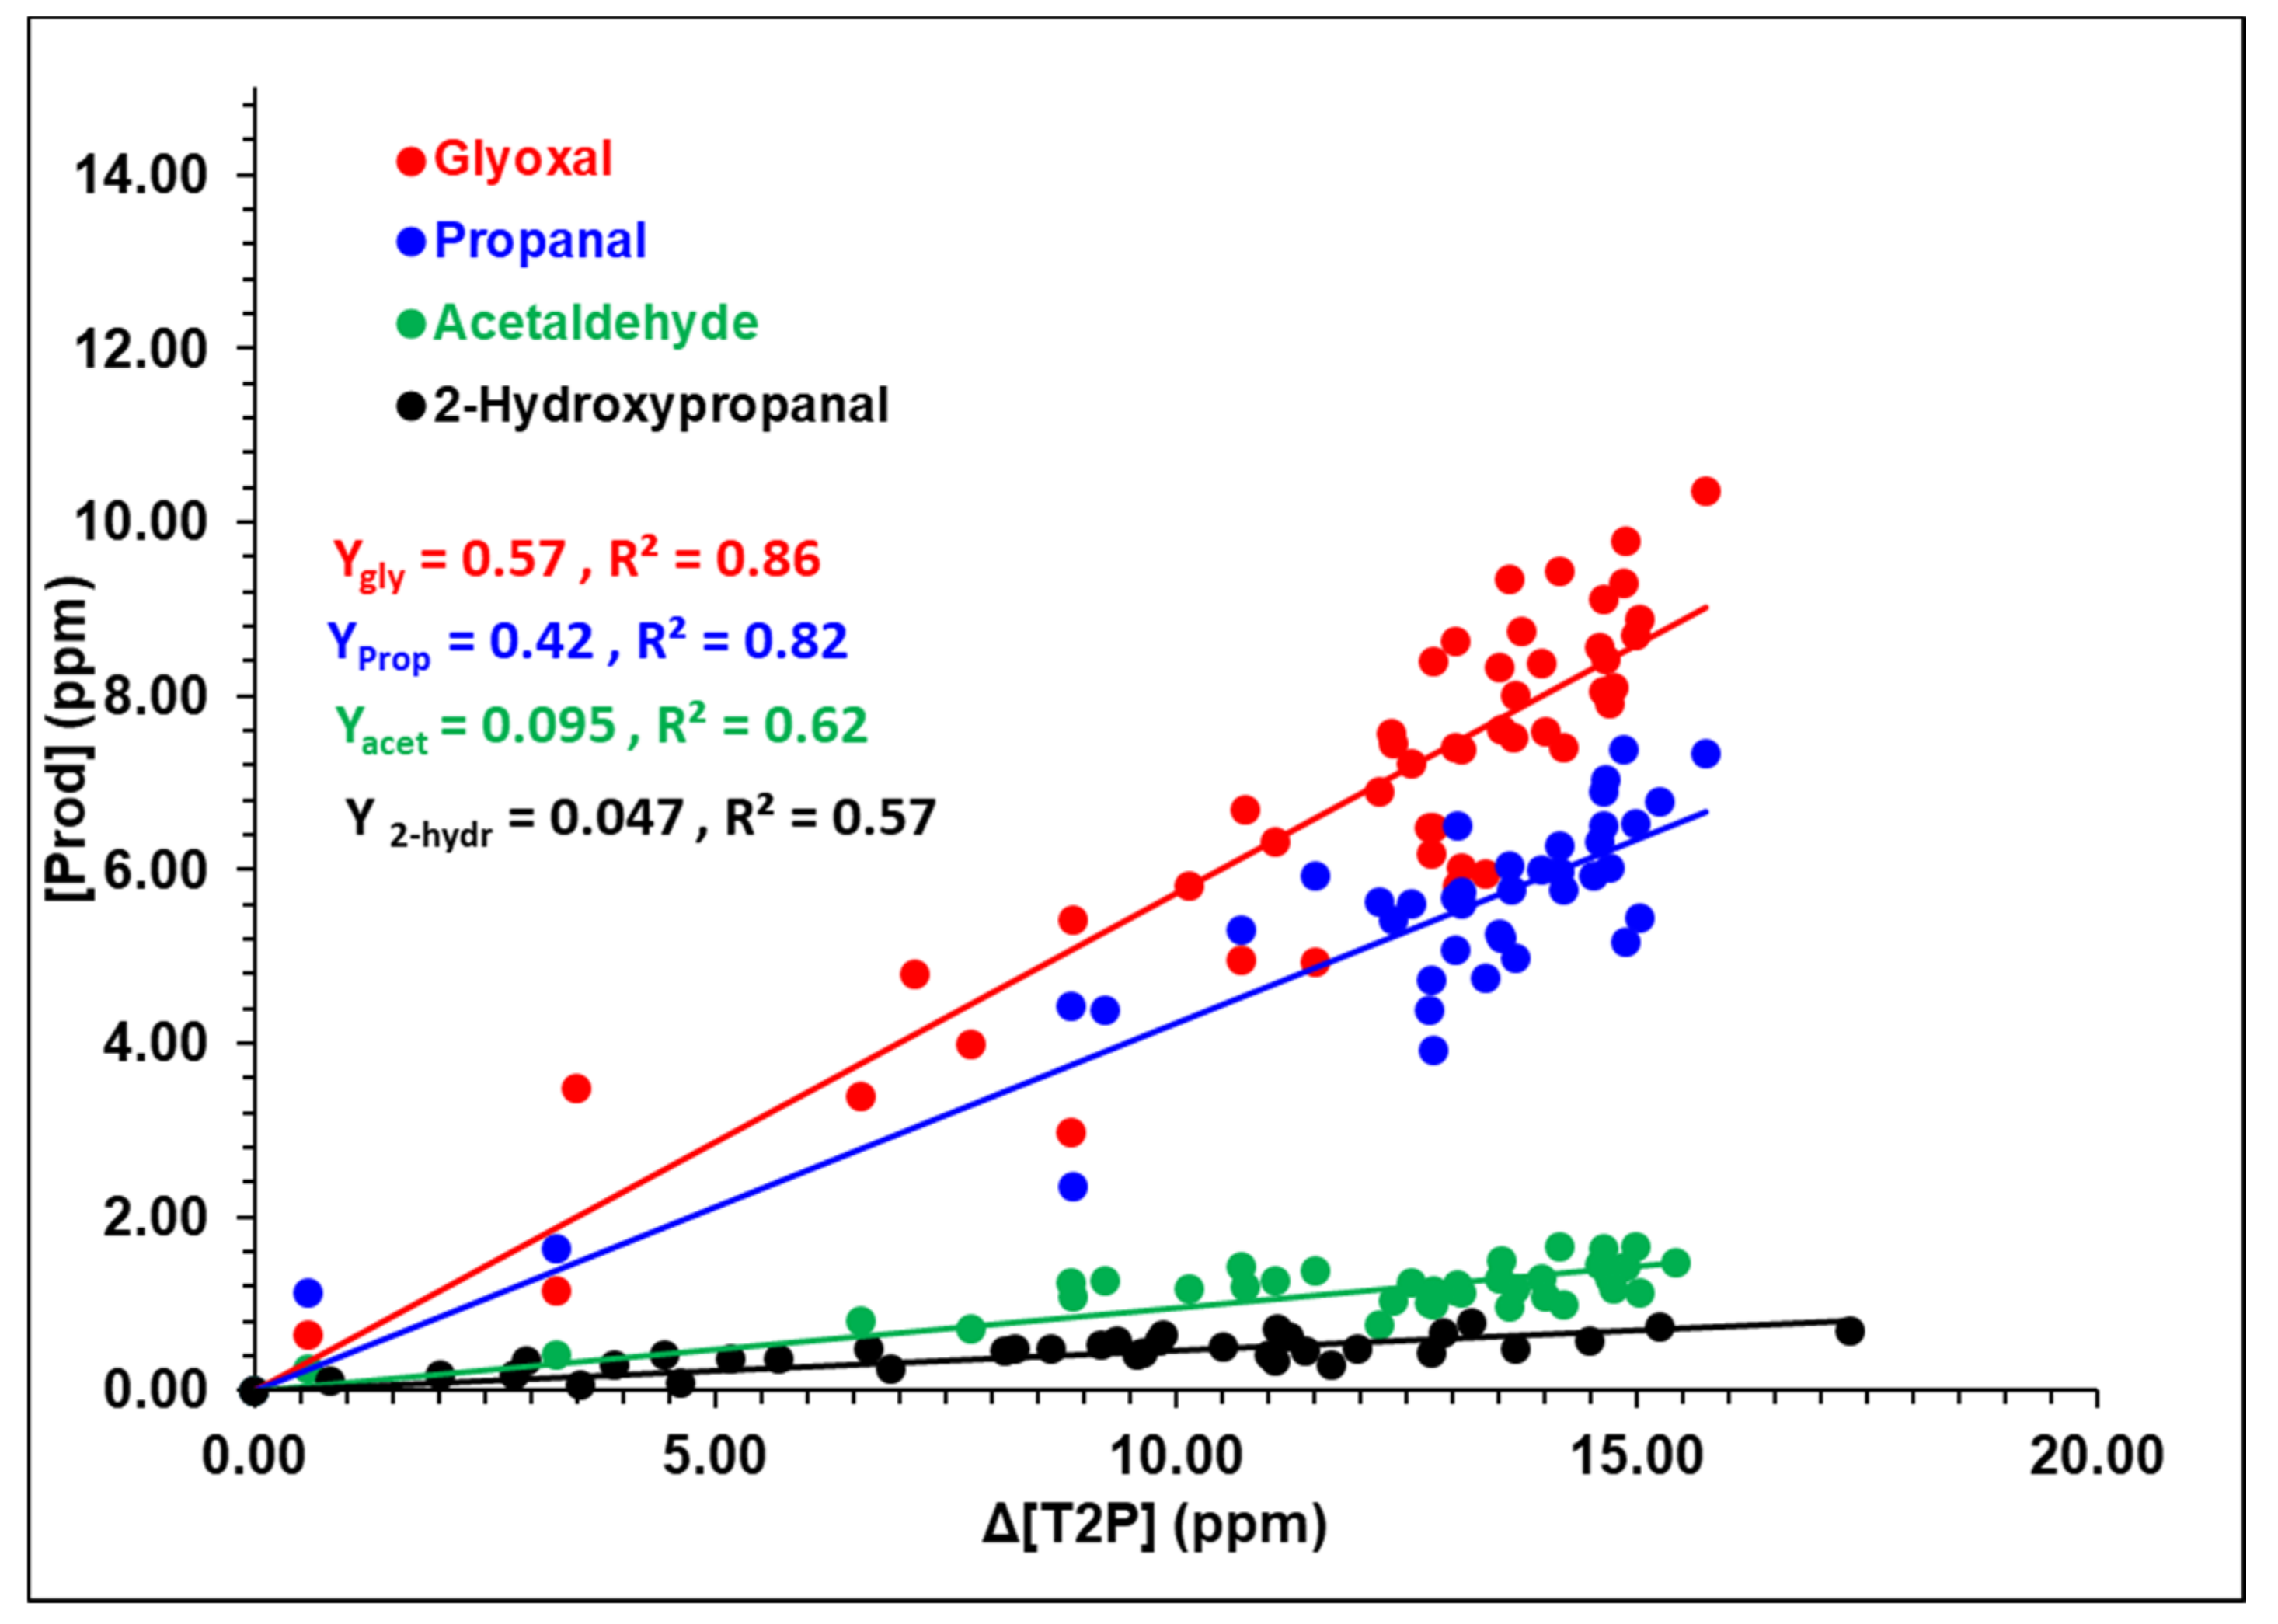
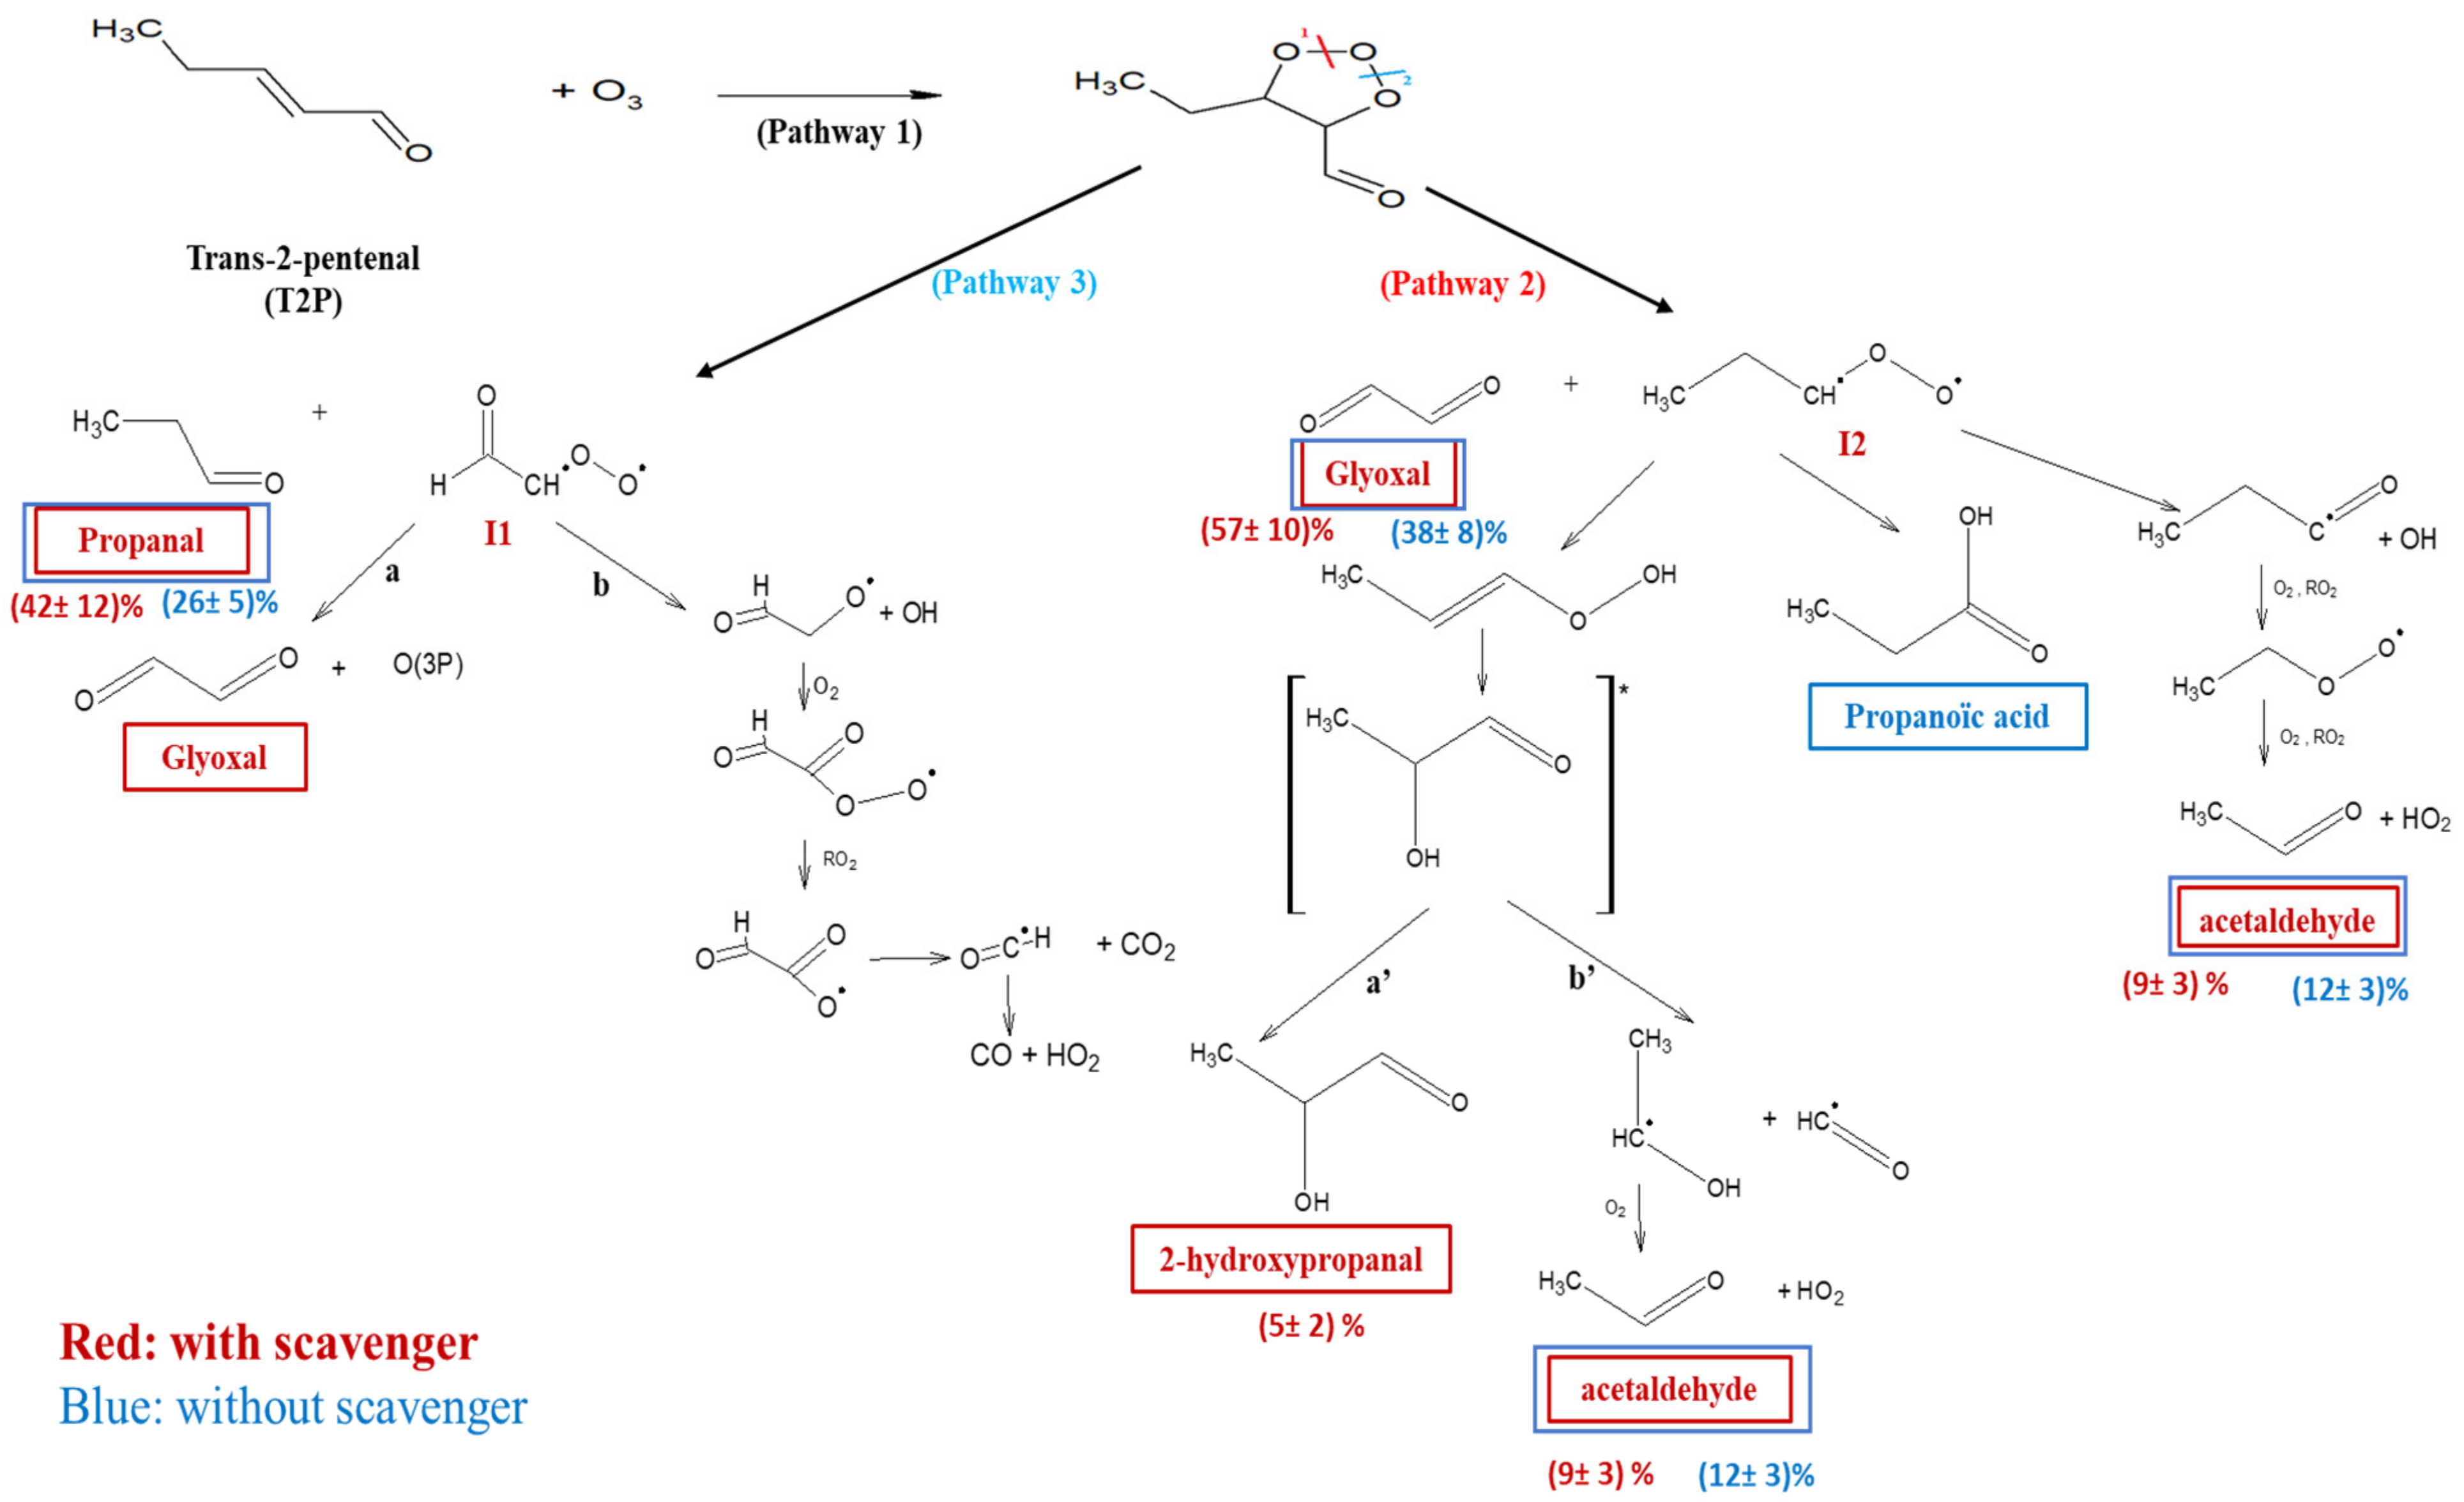
4.2. Experimental Mechanistic Study

Experiments were carried out in the absence (QUAREC) and presence (RASC) of an OH scavenger.
In QUAREC, glyoxal, propanal and acetaldehyde were identified and quantified as the major products. The IR spectra at the beginning and at the end of the reaction, in addition to the reference spectra of the identified aldehydes, are presented in Figure S3. Propanal and propanoic acid were also detected throughout GC-MS analysis of the adsorbent cartridges. Concentration–time profiles of the decay of T2P and the formation of the three major products are presented in Figure S4, together with the carbon balance. The formation yields of the products are given by the slopes (regression coefficient) of the plot of their concentrations (ppm) as a function of that of T2P reacted (Equation (2). Thus, glyoxal, propanal and acetaldehyde product yield plots are shown in Figure 2, displaying average molar yields of (38 ± 8)%, (26 ± 5)% and (12 ± 3)%, respectively. The uncertainties (2σ) correspond to statistical errors from the fitting procedure and the absorption cross-sections used for calibration.
In RASC, the molar fractions–time profiles of T2P and the products formed during the ozonolysis reaction are presented in Figure S5. The carbon balance was also determined at each time t of the experiment. This plot shows the formation of four compounds: glyoxal and propanal as major products, acetaldehyde and 2-hydroxypropanal as minor products. As can be seen, when the consumption of T2P exceeds 50%, the carbon budget is in default of 25%. This deficit is probably due to the formation of other products in the reactor that could not be identified by the analytical techniques due to limitation associated to the derivatization agent, lack of reference standards and the detection limit of the instruments. Moreover, the incomplete carbon balance might also result from an interaction between the gas and the aerosol phase.
FTIR analysis showed the formation of a band between 1043 and 1077 cm−1 probably due to the formation of an hydroxy-carbonyl (2-hydroxypropanal) by analogy with the standard spectrum of 2-hydroxybutanal [6]. Its formation was confirmed by SPME-GC/MS following the formation of its corresponding oxime. The product formation yields were then determined by plotting their concentrations (ppm) as a function of that of T2P reacted for increasing times (Figure 3). The average yields obtained by FTIR and SPME-GC/MS were (57 ± 10)% for glyoxal, (42 ± 12)% for propanal, (9 ± 3)% for acetaldehyde and (5 ± 2)% for 2-hydroxypropanal. Only the yield of 2-hydroxypropanal was determined using both FTIR and SPME-GC/MS, for which a good agreement was found and the difference between the two methods did not exceed 20%. However, for the other detected compounds, the yields were only determined by GC/MS. It is noteworthy that the obtained yield for 2-hydroxypropanal is an estimation since its corresponding standard was not commercialized. Uncertainties on the product formation yields are 2σ considering the repeatability of the measurements.
A summary of the products identified and quantified by FTIR and GC/MS, in both studies performed with and without a scavenger, is shown in Table 2.
For glyoxal and propanal, the yields obtained when using an OH scavenger (RASC) are 27–38% higher than those obtained without an OH scavenger (QUAREC). In contrast, for acetaldehyde, the yields obtained in both setups are in good agreement. In order to check if the discrepancy between these measurements is due to OH radical formation, experiments were performed in the Wuppertal laboratory, in the presence of an OH tracer, which allowed to determine an upper limit for the OH production of 24% (Figure S6). However, the calculated OH level in these systems was not higher than 2 × 10⁶ molecules cm−3, which suggests a rather low influence on the product distribution, assuming only a subsequent consumption of the products by OH radicals. Thus, the observed discrepancy between the measurements seems to be caused, at least partly, by the formation of OH during the ozonolysis reaction. A thorough analysis of the products formed in the reaction of T2P itself with OH is needed in order to describe this observation quantitatively.
As with olefinic compounds, the reaction between unsaturated aldehydes and ozone is initiated by the electrophilic addition of ozone to the C=C double bond to form a primary ozonide. This latter is not stable and can decompose resulting in the formation of two primary carbonyl compounds and two intermediates called Criegee Intermediates CI [42]. Based on the identified products in IR and GC/MS, a detailed mechanism of the gas phase reaction of ozone with T2P was drawn considering our observations and the available literature for other unsaturated VOCs [6,43,44] (Figure 4).
The intermediate CHOC°HOO° (I1), resulting from pathway 3, can evolve into two different pathways as shown in Figure 4. However, apart from glyoxal, none of the stable products from I1 were detected by the two analytical techniques used (FTIR and GC/MS). Formaldehyde was not observed in the FTIR spectra, neither in QUAREC nor in the RASC reactors. Noteworthy, for CO2, a slight increase in the 2289–2388 cm−1 characteristic band was observed. Nevertheless, since the housing around the transfer optics is flushed with purified dry air which contains CO2, it was impossible to estimate the concentration of CO2 in the reactor.
The intermediate CH3CH2C°HOO° (I2), resulting from pathway 2, could either be stabilized by collision or undergo fast unimolecular decomposition via 1,4-H shift and hydroperoxide formation CH3CH=CH(OOH) or form OH and an alkoxy radical that leads to acetaldehyde. The resulting hydroperoxide can evolve in two different pathways as presented in Figure 4. However, only 2-hydroxypropanal and acetaldehyde resulting from the stabilization of the β-hydroxycarbonyl (a’) and its decomposition into α-hydroxyalkyl + HCO (b’) were detected with formation yields of 5 ± 2% and 9 ± 3% (with OH scavenger), respectively.
In addition, the stabilized intermediate CH3CH2C°HOO° can isomerize into dioxy bi-radicals and form organic acids. In fact, propanoic acid was detected but not quantified (experiments without OH scavenger) suggesting the existence of this channel (Figure 4).

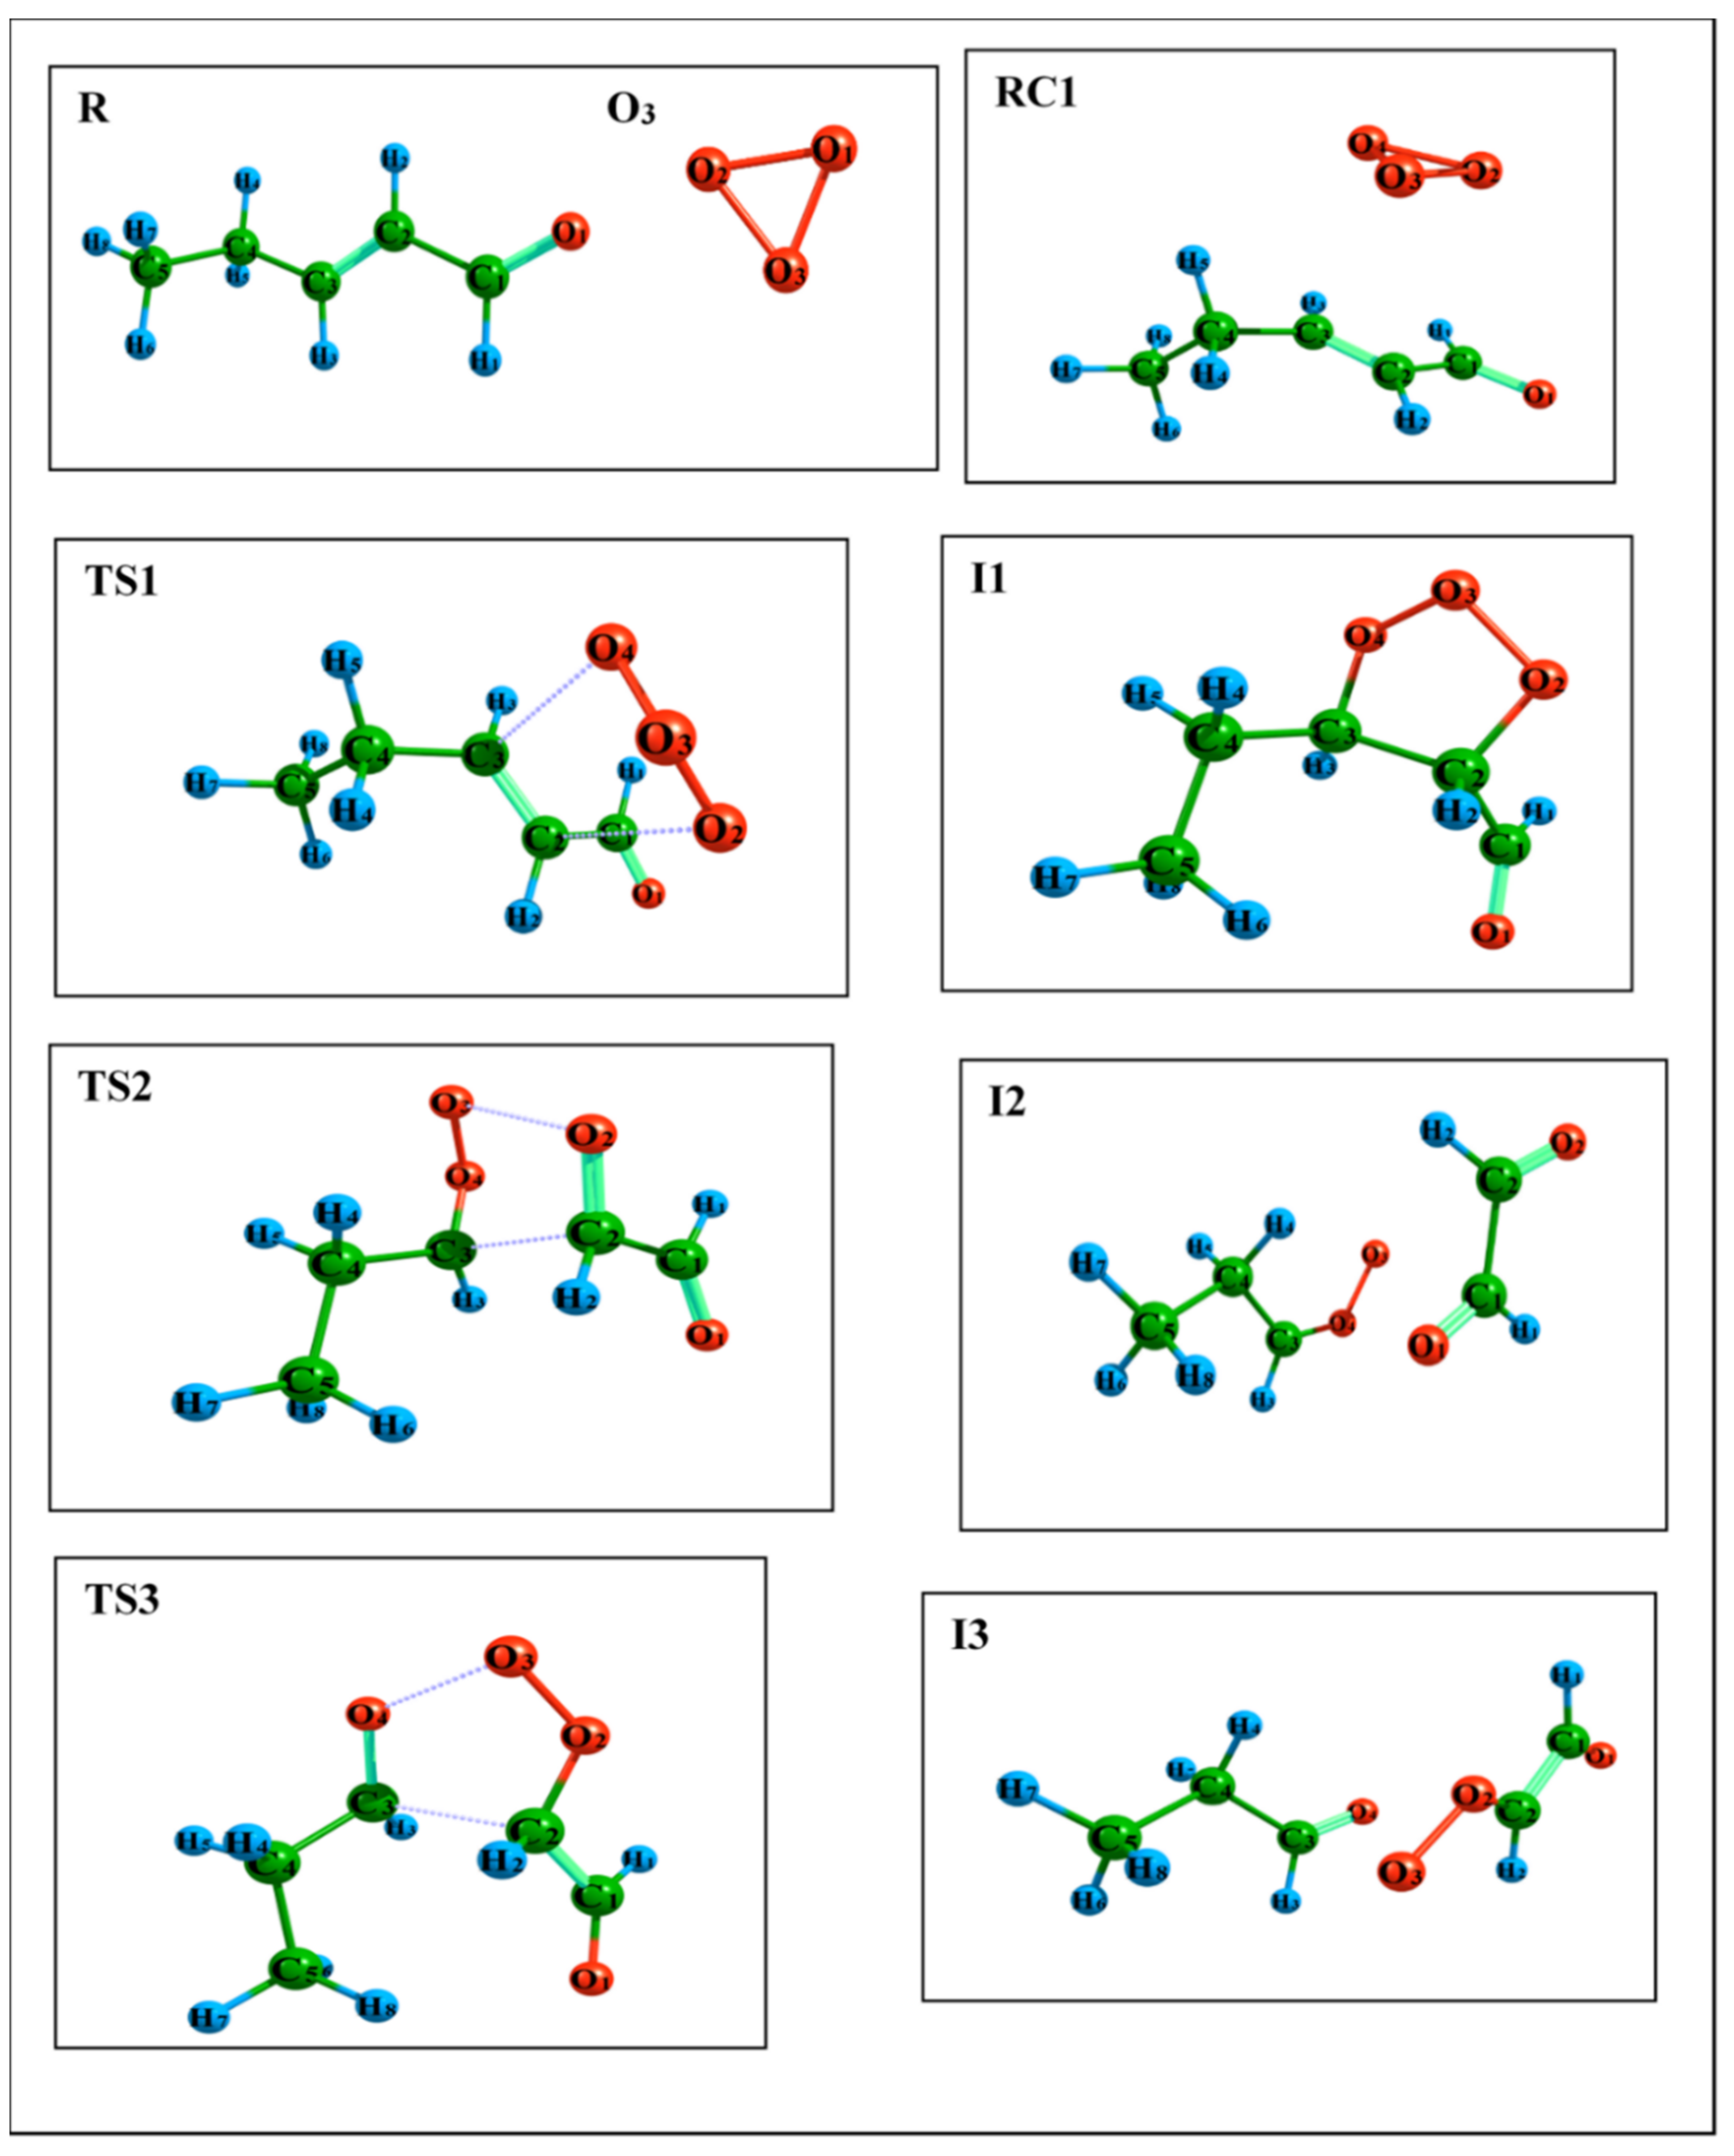
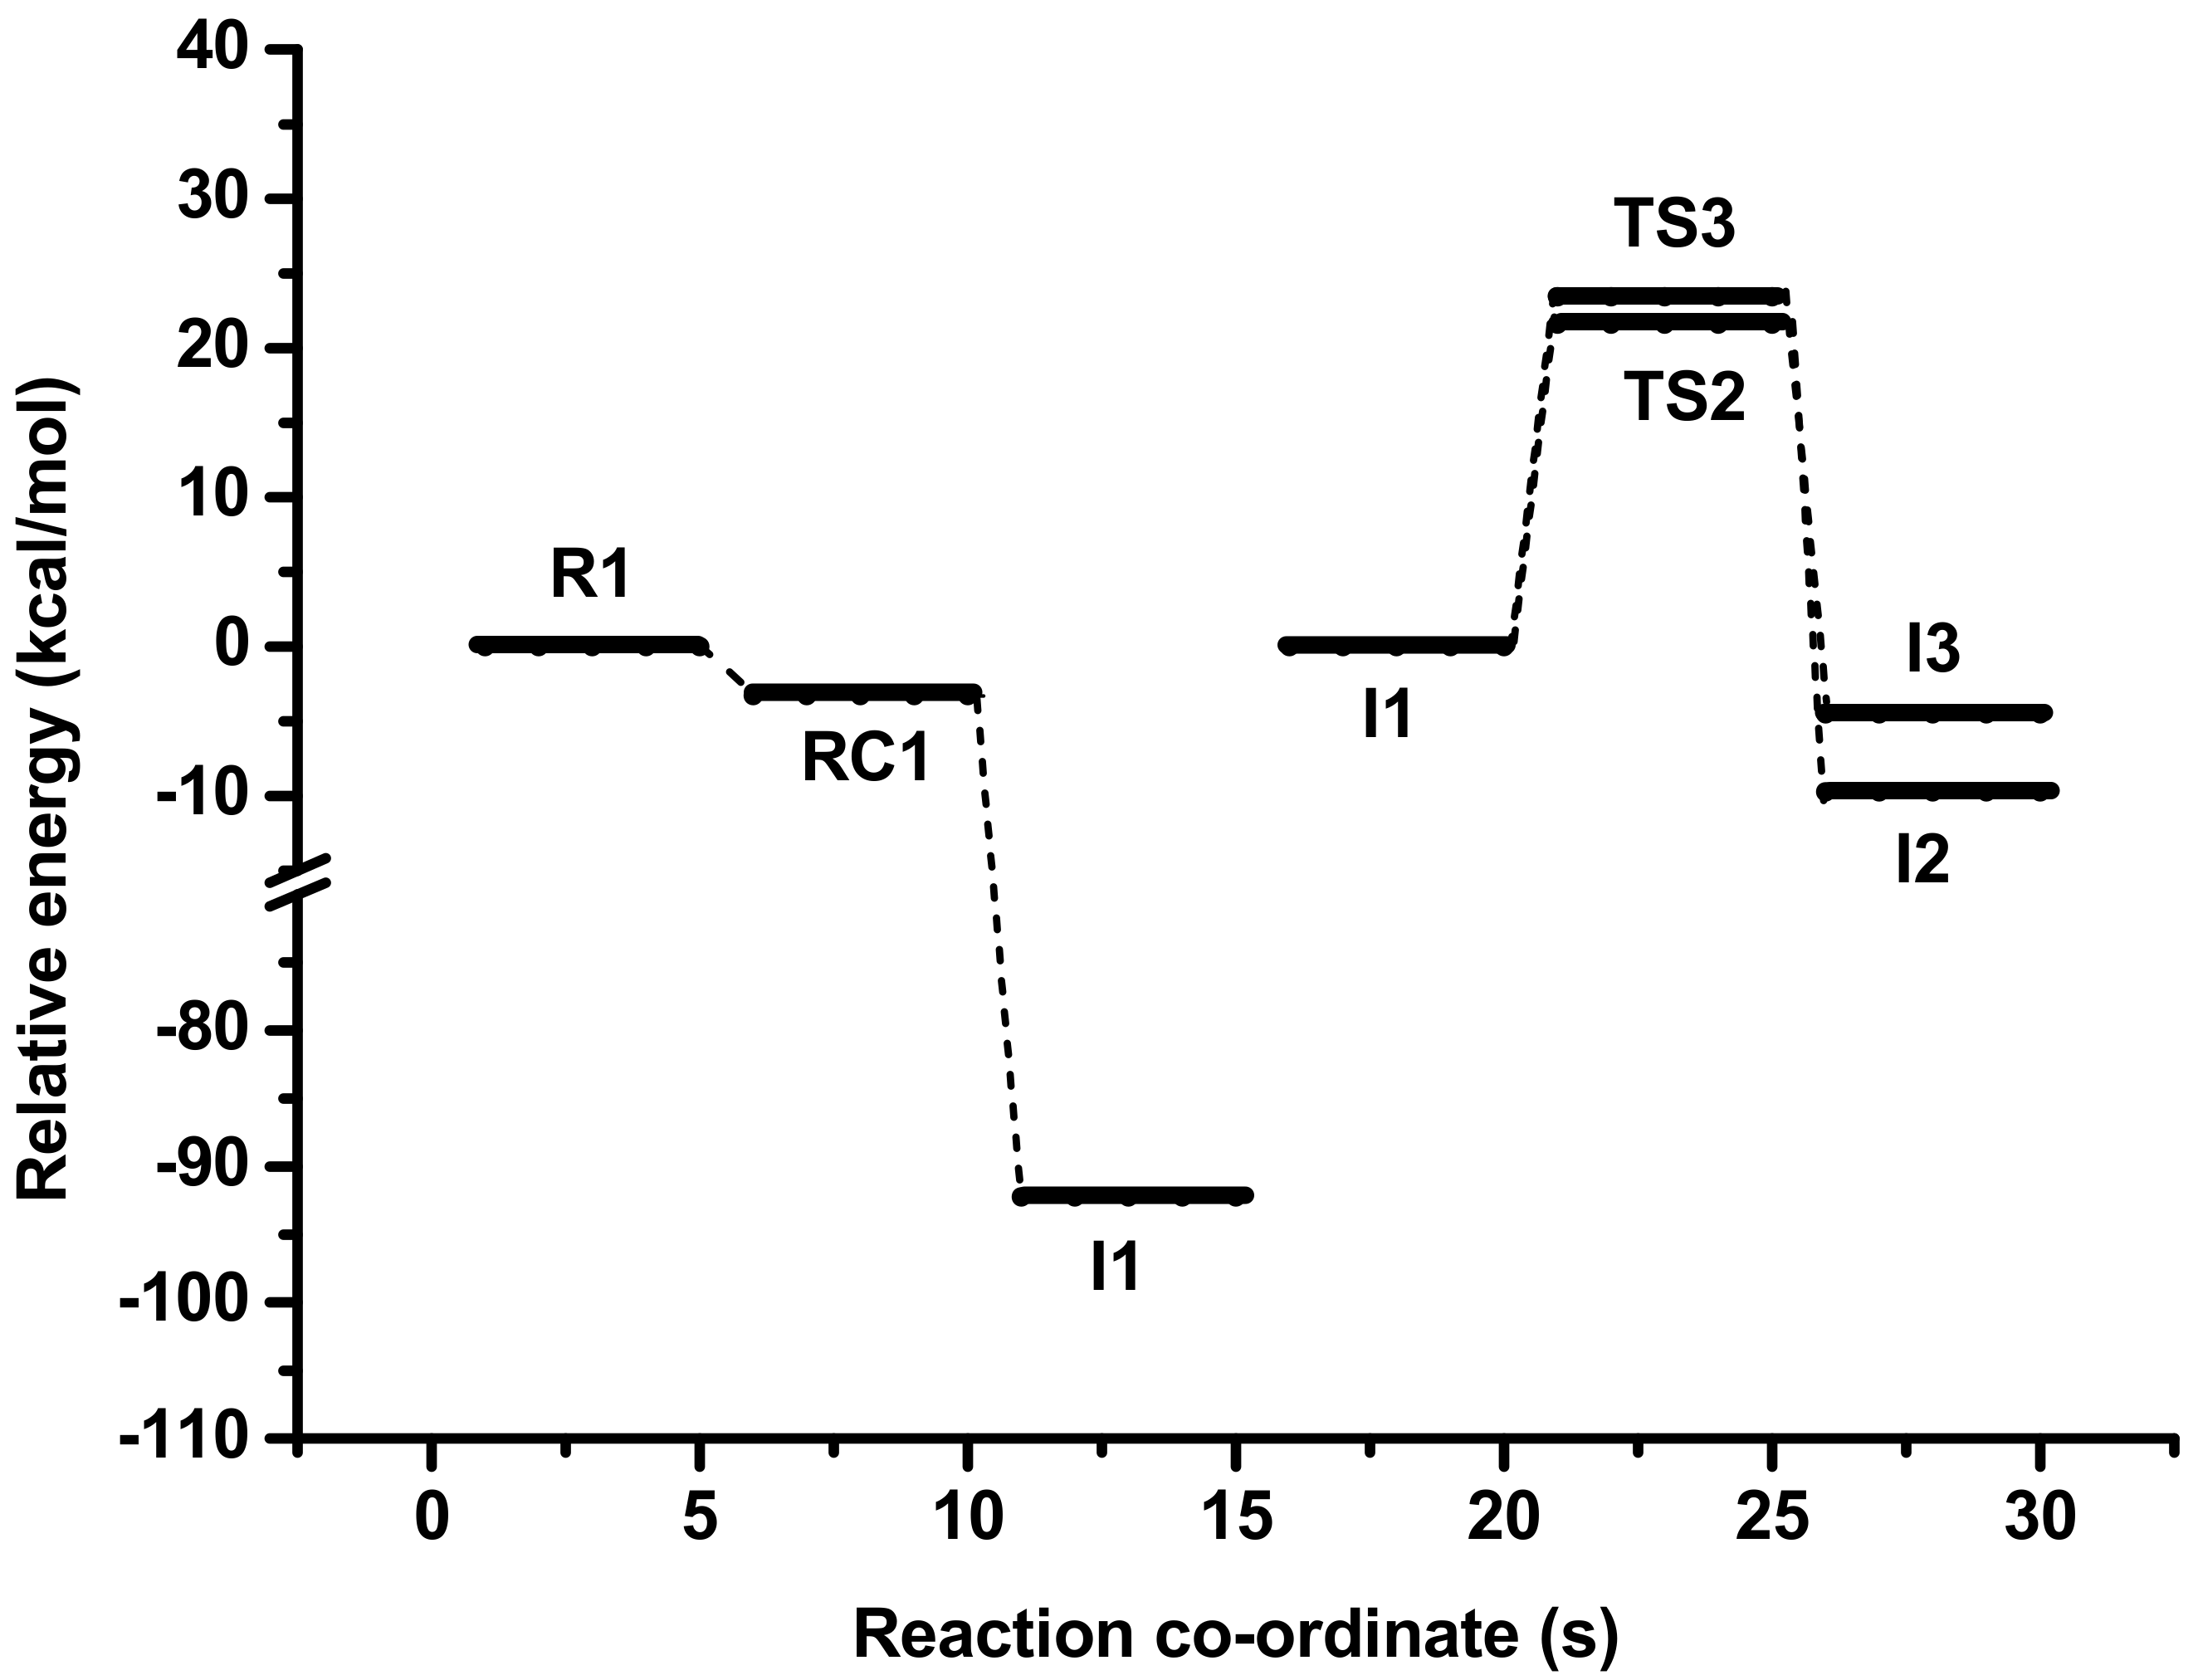
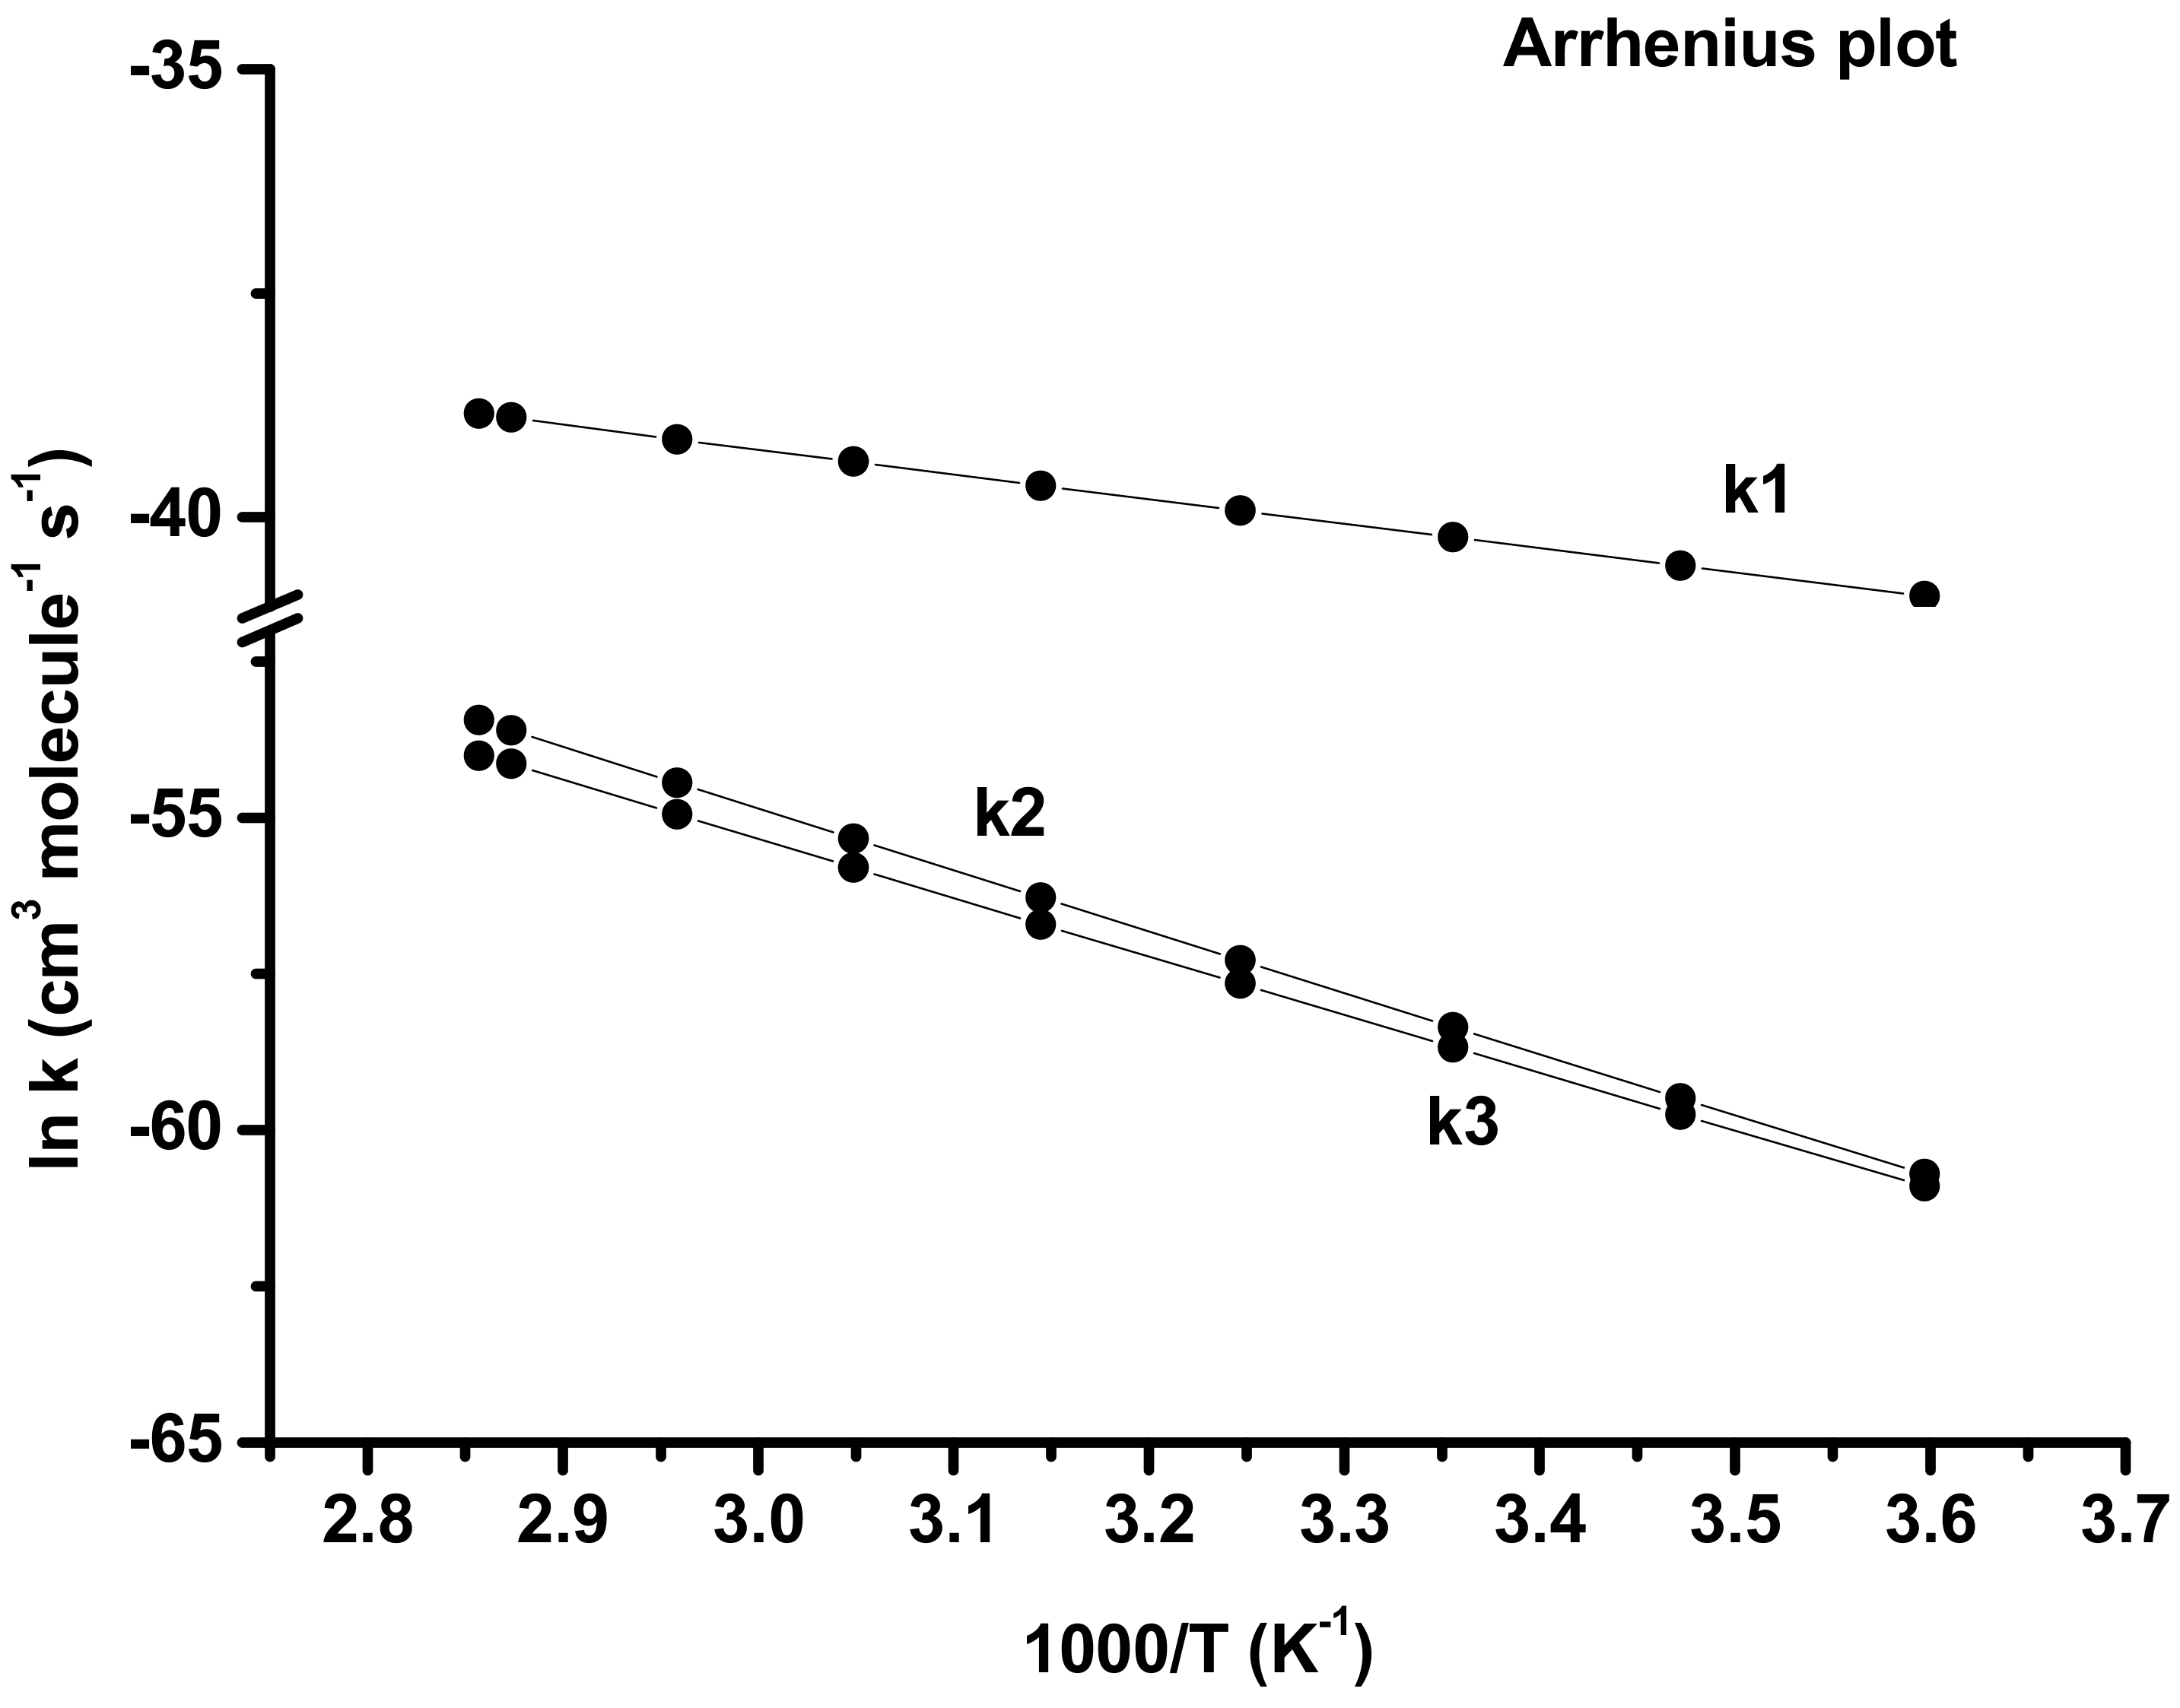
4.3. Theoretical Results

As already mentioned in the preceding section, due to the presence of unsaturated carbon-carbon double bond (-C=C-), this bond undergoes O3 addition reaction to C2 and C3 carbon atoms as shown in Figure 4. Figure 5 shows the molecular entities involved in the initial (pathway 1) and secondary reactions (pathways 2 and 3), optimized at M06-2X level of theory.
At the entrance channel, a reactant complex (RC1) without any barrier is formed. A transition state (TS1) is observed with a negative energy barrier in all four levels of theory (M06-2X, BHandHLYP, MP2 and CCSD(T)). The corresponding intermediate I1 (ozonide) with high exothermicity of −88.95 kcal/mol with respect to RC1 is located at M06-2X theory as shown in Table 3.
The intermediate I1 is found to undergo a decomposition reaction to give stable products glyoxal (CHO)2 and propanal (CH3CH2CHO) with a release of Criegee intermediates that are either CH3CH2CHOO or CHOCHOO. These intermediates further undergo several isomerization/decomposition reactions to produce stable end-products as shown in Figure 4. In pathway 2, the O2-O3 and C2-C3 bonds are broken to form glyoxal and a CI (CH3CH2CHOO). The corresponding transition state TS2 is found to have an energy barrier of 21.60 kcal/mol in M06-2X level, and the intermediate (I2) is predicted to be exothermic (−9.75 kcal/mol at M06-2X) in all four levels of theory. The literature survey shows that the by-product, i.e., Criegee intermediate (CH3CH2CHOO), undergoes unimolecular decay to produce OH radicals [45]. In pathway 3, the O3-O4 and C2-C3 bonds get cleaved to produce propanal and another CI (OHC-CHOO). A transition state TS3 with an energy barrier of 23.42 kcal/mol is located at the M06-2X level of theory. All four levels of theory predict a higher energy barrier than for pathway 2. The intermediate I3 is found to be exothermic (−4.52 kcal/mol at M06-2X) in all methods (Table 3, Figure 6). Based on the above thermochemical analysis, all three reaction pathways (1, 2 and 3) are found to be exothermic and exergonic.
The CVTST was utilized in this work to calculate the rate coefficients as a function of temperature. To include the tunneling effect, we used the CVTST with the small curvature tunneling (CVTST/SCT) method within an appropriate temperature range of 278–350 K. The initial rate coefficient for the O3 addition reaction is predicted to be 3.39 × 10⁻¹⁸ cm3 molecule−1 s−1 at 298 K. This value is relatively close to the experimental one (1.46 × 10⁻¹⁸ cm3 molecule−1 s−1 at 298 K). This is consistent with the energetics shown in Figure 6. When the ozonide is formed in the experiments, it has an excess energy as large as about 90 kcal with respect to the ozonide ground state I1. This is largely enough to overpass the 20–25 kcal barriers shown in Figure 6 (TS2 and TS3). Since it decomposes very fast, the collisional relaxation is not efficient and the kinetics is essentially driven by pathway 1 in the experiments. Further, the calculated rate coefficient was found to have a positive temperature dependence, i.e., as the temperature increases the rate coefficient increases, as shown in Table 4. Decomposition of the ozonide led to the formation of glyoxal (pathway 2) and propanal (pathway 3) for which the rate coefficients at 1013 mbar and for the ozonide at ground state, are calculated to be 4.55 × 10⁻²⁶ and 3.30 × 10⁻²⁶ cm3 molecule−1 s−1, respectively, which sums to 7.85 × 10⁻²⁶ cm3 molecule−1 s−1 at 298 K.
The above-calculated rate coefficients were utilized to predict the Arrhenius plot as shown in Figure 7, and the corresponding Arrhenius equations are given below for all three reactions:
k1 (T) = 3.50 × 10¹⁴ exp (2753.3/T)
k2 (T) = 1.39 × 10¹² exp (9345/T)
k3 (T) = 9.74 × 10¹² exp (9831/T)
The corresponding branching ratios for pathways 2 and 3 are 58% for the formation of glyoxal and 42% for propanal, respectively, as shown in Table 4. It is noteworthy to mention that the theoretical branching ratio values were calculated based on the one-step rate coefficient, i.e., omitting the further decomposition mechanisms of the CI as indicated in Figure 4. These values are in excellent agreement with the glyoxal and propanal yields obtained experimentally in RASC.

4.4. Comparison with Other Unsaturated Aldehydes
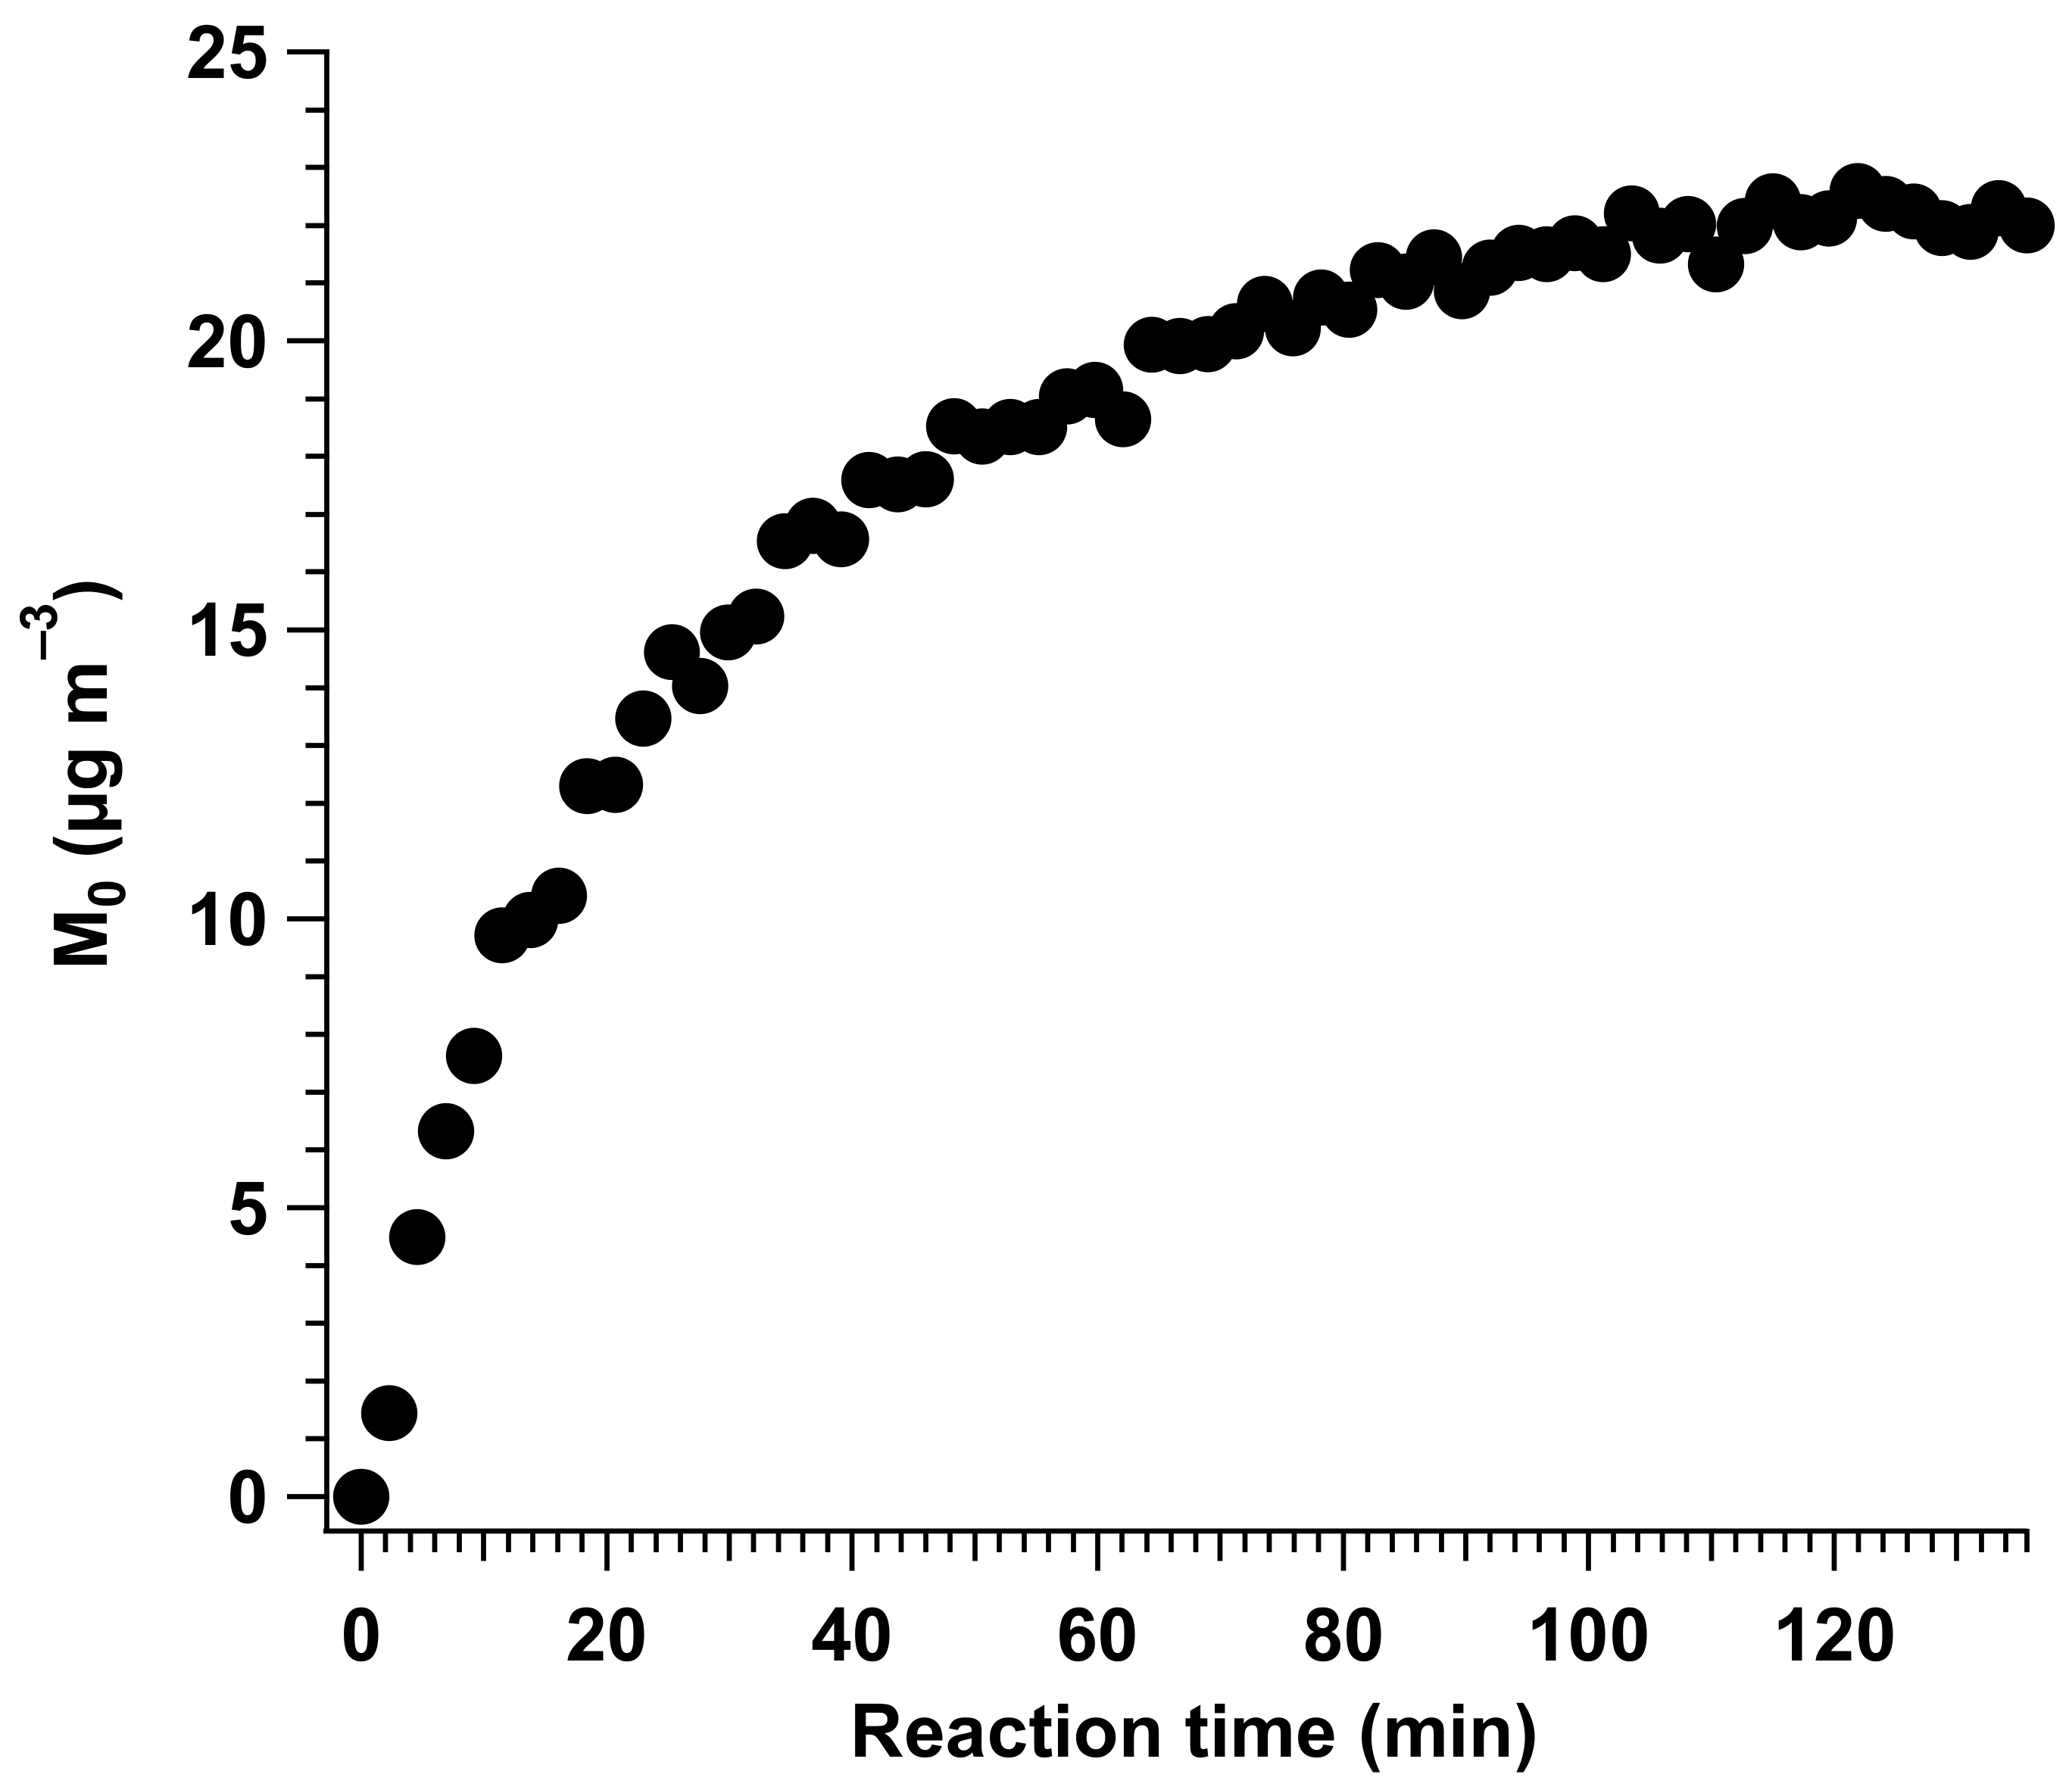
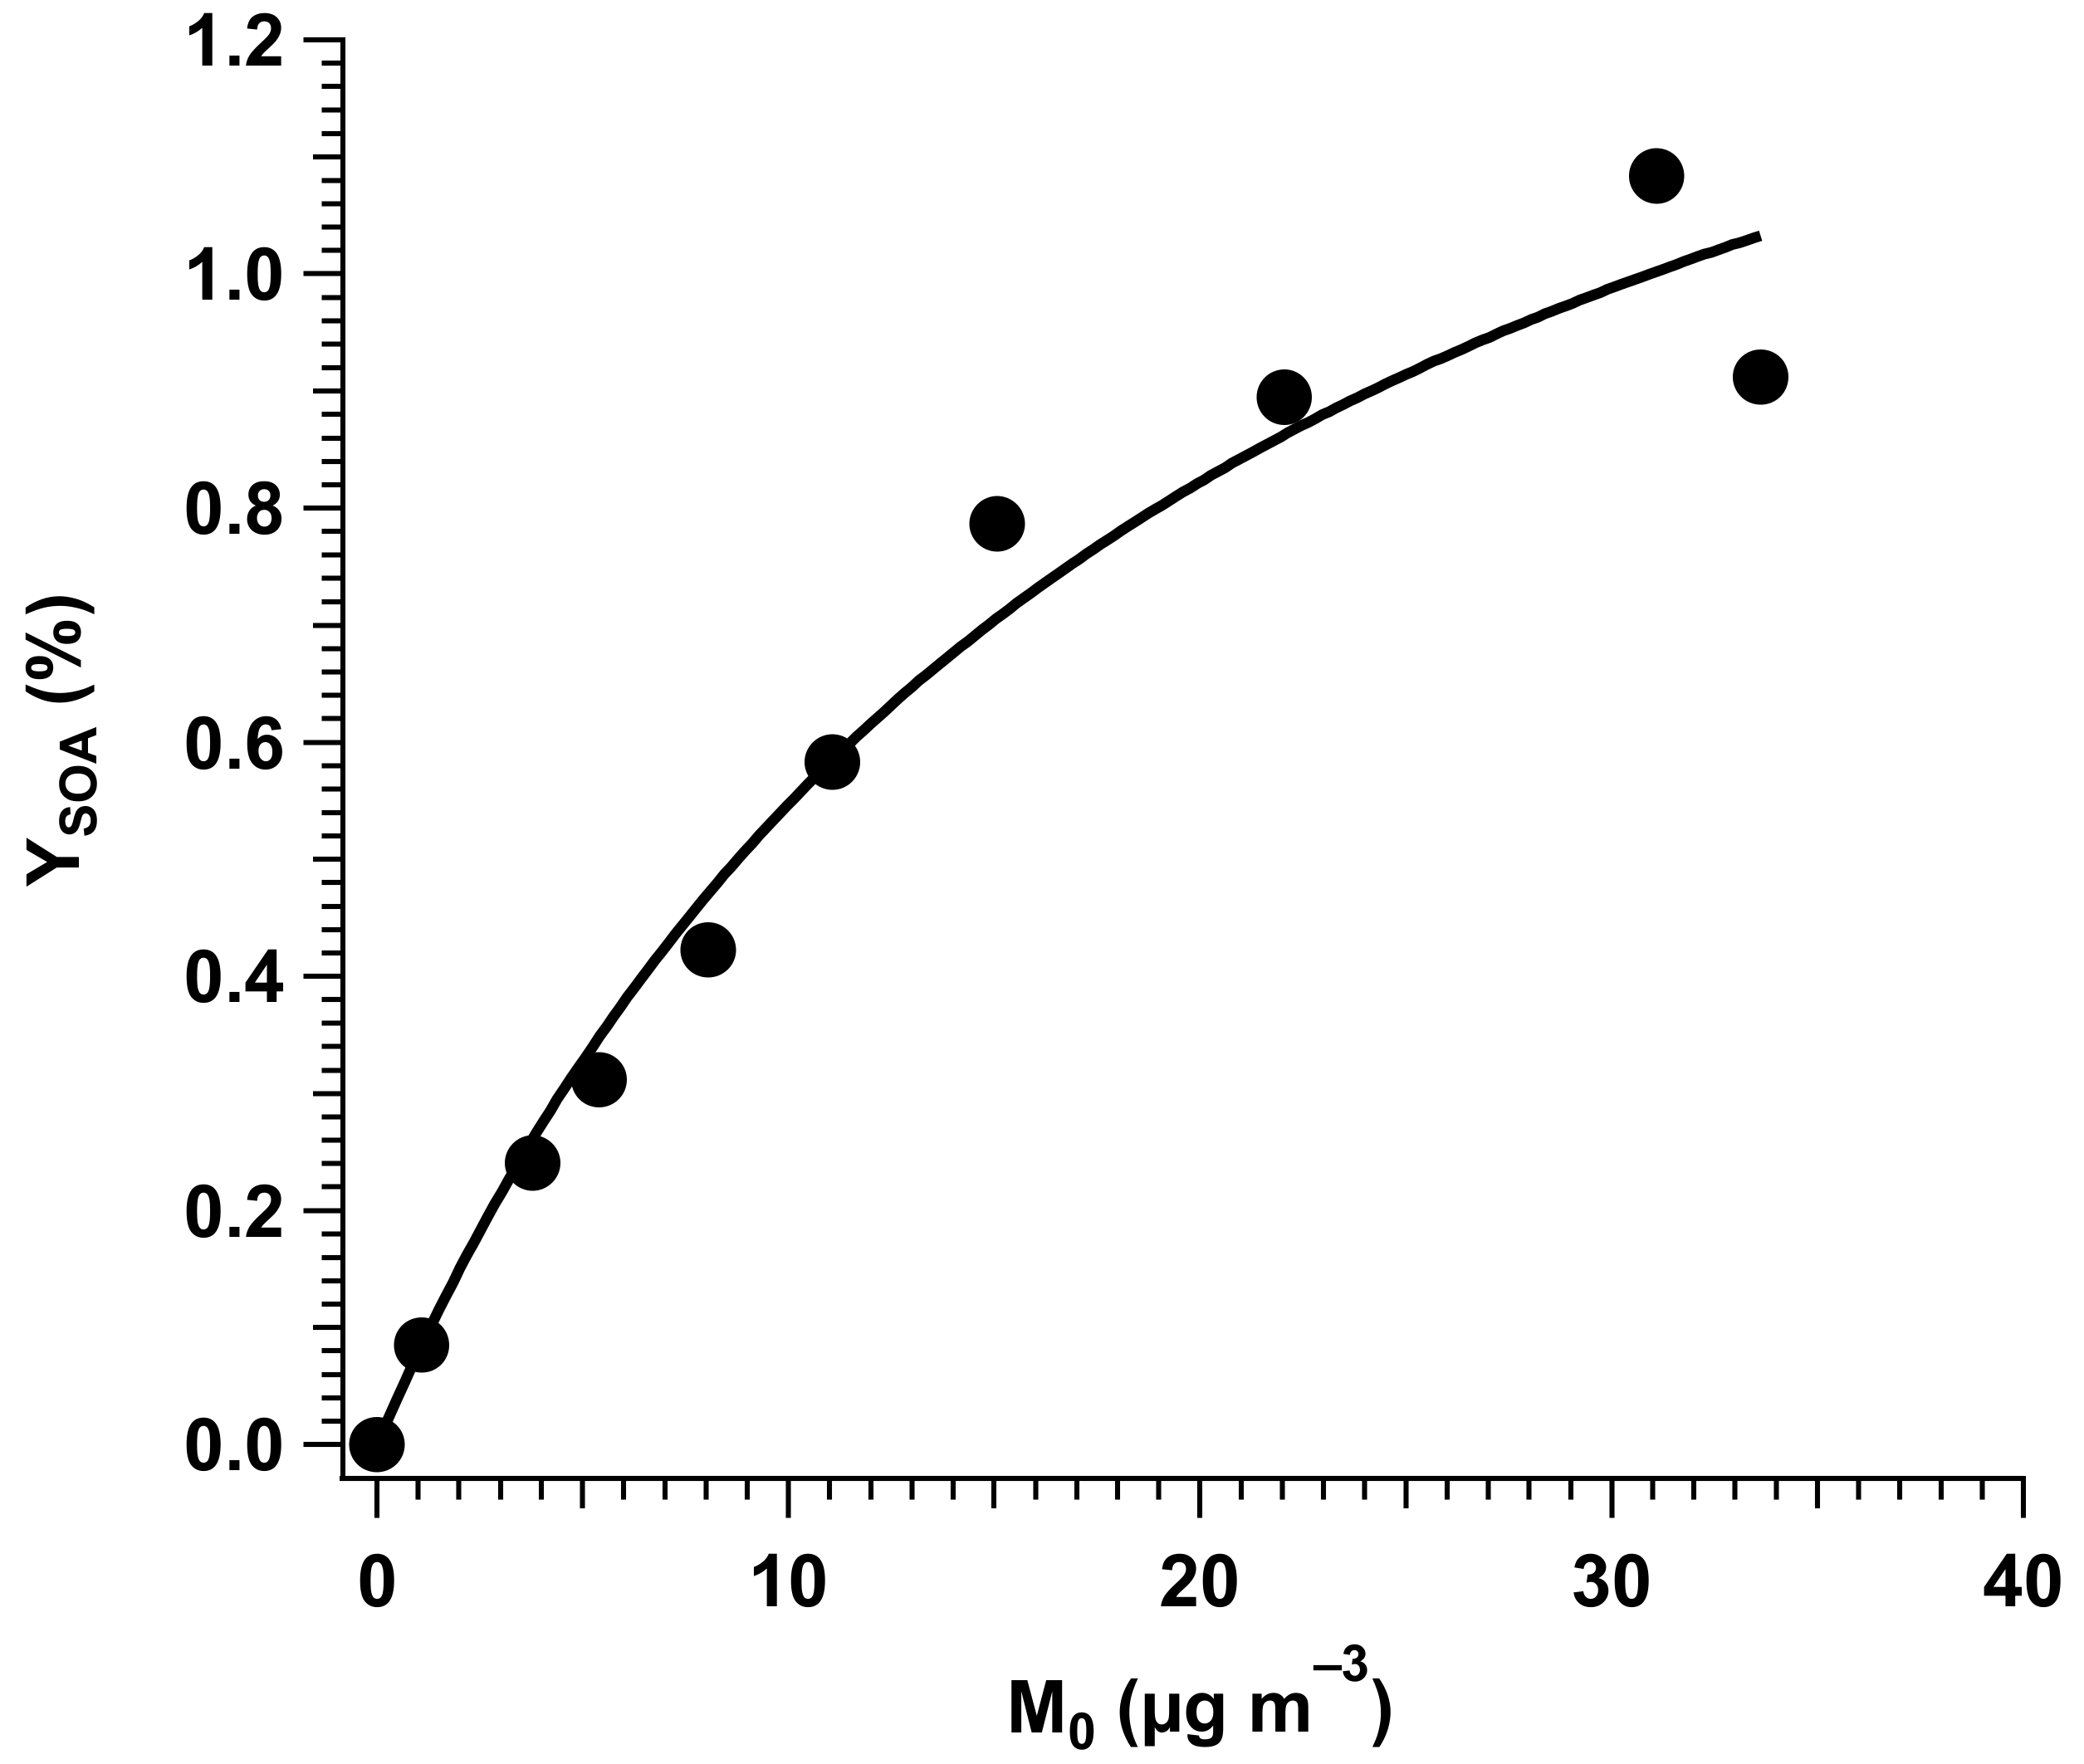
This work is the first mechanistic study for the gas-phase ozonolysis of T2P (C5). However, ozonolysis of a series of C3-C9 unsaturated aldehydes has been investigated in some previous studies.
Grosjean et al. [46] studied the products formed during the ozonolysis of 2-propenal (acrolein C3). Their experiments were carried out in a 3.5 m3 Teflon chamber in the temperature range 285–290 K in the presence of an OH scavenger. Primary carbonyl products were glyoxal (43%) and formaldehyde (7%); acetaldehyde was also detected in small amounts (0.8%).
Another study by Grosjean et al. [47] on the ozonolysis of methacrolein (C3) in the presence of OH scavenger showed the formation of methylglyoxal (58 ± 12)% and formaldehyde (12 ± 2)%.
Grosjean and Grosjean [48] determined the gas-phase ozonolysis of 2-butenal (crotonaldehyde) under atmospheric conditions, in the presence of cyclohexane. The product formation yields were: glyoxal (47 ± 2)%, acetaldehyde (42 ± 3)%, formaldehyde (8 ± 1)% and cyclohexanone (2.8 ± 0.2)%.
In another study by Grosjean et al. [49], the products formed during the ozonolysis of trans-2-hexenal, at a relative humidity of 55%, were identified and quantified. Glyoxal (52.7 ± 5.5)% and butanal (55.9 ± 3.7)% were the primary carbonyls and propanal (6.7 ± 0.8)%, 2-oxo-butanal (7.4 ± 0.6)%, acetaldehyde (10.9 ± 2.0)% and cyclohexanone (3.2 ± 0.3)% were the secondary products. The observation of cyclohexanone confirms OH radical formation in the reactor.
A recent study by Grira et al. [6] on the ozonolysis of trans 2-hexenal in dry conditions (RH < 1%) was performed in two different setups in the presence and absence of OH scavengers. Glyoxal and butanal have been identified as main products with respective yields of 48 ± 10% and 33 ± 7% without OH scavenger, and 59 ± 15% and 36 ± 9% with OH scavenger. Secondary products were detected and quantified in the presence of an OH scavenger such as acetaldehyde (10 ± 3%), propanal (19 ± 5%) and 2-hydroxybutanal (18 ± 6%).
A study by Gaona Colmán et al. [7] performed without OH scavenger, dealt with the mechanism of the ozonolysis of three unsaturated aldehydes: trans-2-heptenal (C7), trans-2-octenal (C8) and trans-2-nonenal (C9). The yields of the primary products were: glyoxal (49 ± 4)% and pentanal (34 ± 3)% for trans-2-heptenal ozonolysis, glyoxal (41 ± 3)% and hexanal (39 ± 3)% for trans-2-octenal ozonolysis and glyoxal (45 ± 3)% and heptanal (46 ± 3)% for trans-2-nonenal ozonolysis.
The results obtained in this work and in our previous paper by Grira et al. [6] for the ozonolysis of trans-2-pentenal and trans 2-hexenal under dry air show a slight preference for the channel giving the bicarbonyl compound (glyoxal). This behavior was observed both in the presence and the absence of OH scavenger. In fact, the ozonolysis of asymmetric alkyl-substituted alkenes can favor the formation of the most substituted bi-radical due to hyperconjugation [49,50]. Furthermore, previous studies carried out on the ozonolysis of oxygenated alkenes indicate that the decomposition of the primary ozonide shows a preference for the pathway producing an oxygenated carbonyl [46,48]. Moreover, Wegener et al. [51] indicate that after the decomposition of the primary ozonide, the electron donor substituents remain preferentially in the bi-radical while the electron acceptor substituents (CHO of unsaturated aldehydes) are found in the carbonyl compound. In fact, in our two studies on T2P (this work) and T2H [6], a slight preference is directed towards the formation of the alkyl-substituted bi-radical and the formation of glyoxal. This finding is also corroborated by the present theoretical calculations.
However, the amount of reported data for the ozonolysis of trans-2-alkenals (C3-C9) is still too limited to provide a basis of discussion for the trends observed for T2P and T2H.

4.5. SOA Formation

Experiments were carried out in the ASC chamber without an OH scavenger. Figure 8 illustrates the fast particle formation as soon as ozone was injected in ASC.
A plateau is observed around 2 h reaction time after correction for wall losses. Figure 9 reports the aerosol yield as a function of corrected SOA mass concentrations.
The oxidation of about 2.1–4.5 ppm of T2P by increasing amounts of ozone led to SOA masses from 1 to 35 µg m−3, corresponding to low aerosol yields of 0.1–1.1%. Odum et al. demonstrated that SOA yields could be related to M0 through the following equation [25]:
Y S O A = M 0 α K 1 + M 0 K
where α is the mass-based gas-phase stoichiometric coefficient of a one-product model and K represents its gas-particle partitioning equilibrium constant. A least-square regression on the data in Figure 9 gives the following parameters: α = 0.017 ± 0.002 and K = (4.9 ± 1.2) × 10−2 m3 µg−1. Uncertainties represent two standard deviations (2σ). Note that for SOA produced in trans-2-hexenal + O3 reaction, Grira et al. obtained aerosol yields of up to 14% for SOA masses of about 400 µg m−3, leading to a stoichiometric coefficient of 0.22 and a gas-particle partitioning equilibrium constant of 3.2 × 10⁻³ m3 µg−1 [6]. Thus, trans-2-hexenal ozonolysis produces higher amounts of condensable compounds with a lower volatility than for trans-2-pentenal.
The present study demonstrates for the first time that even C5 unsaturated aldehyde molecules can produce SOA through ozonolysis. Yet, the low SOA yields obtained support a negligible impact of T2P to the global organic atmospheric aerosol loadings.

5. Conclusions

The reactivity of T2P with O3 was investigated both experimentally and theoretically in terms of kinetics and reaction mechanisms. The experimental rate coefficient at T = 298 ± 2 K of the gas-phase ozonolysis of trans-2-pentenal was determined in a flow reactor and a simulation chamber using an absolute method. The obtained rate coefficient was in very good agreement with the previous studies available in the literature. In addition, calculations using CVTST lead to a consistent rate coefficient. According to the obtained kinetic values, the removal of T2P from the atmosphere relative to its reaction with ozone is of the order of a few days compared to a few minutes for the photolysis reaction and a few hours for OH and NO3 reactions. However, the contribution of the ozonolysis reaction should not be overlooked, mainly in polluted regions where the ozone concentrations can be relatively high.
The ozonolysis of T2P leads to the formation of multifunctional compounds such as bicarbonyls such as glyoxal, hydroxycarbonyls such as 2-hydroxypropanal and saturated aldehydes such as propanal and acetaldehyde. The obtained molar yields in the RASC reactor, in the presence of OH scavenger, were 33% on average higher than those obtained without OH scavenger in the QUAREC reactor. Although the present results indicate a contribution of the OH formation to the observed discrepancy between the yields measured in both reactors, in the presence and absence of OH scavenger, its extent remains to be deciphered in a future study. Moreover, the ratios calculated for the two ozonide decomposition pathways display good agreement with the yields of primary carbonyl products. A slight preference for the formation pathway of bicarbonyl (glyoxal) was observed in both experimental and theoretical works.
Aerosol formation from T2P ozonolysis was also investigated. Based on the results obtained in this work and previous studies for other alkenals [6,52], it seems that the SOA production potential from the ozonolysis process of 2-alkenals could be significant, at least for C6 and larger compounds. The present results provide new information concerning trans-2-alkenals ozonolysis and contribute to better understanding of their reactivity with respect to ozone.

Supplementary Materials

The following supporting information can be downloaded at: https://www.mdpi.com/article/10.3390/atmos13020291/s1. Figure S1. Ozone reaction profiles (Ln scale) as a function of reaction time for ([T2P]0 ≈ 4.3–19 ppm and [O3]0 ≈ 270–440 ppb) at room temperature (T = 298 K) obtained in the ASC chamber. Figure S2. Ozone reaction profiles (Ln scale) as a function of reaction time for ([T2P]0 ≈ 7.9–28 ppm and [O3]0 ≈ 550 ppb) without an OH scavenger at room temperature (T = 298 K) obtained in LFR. Error bars correspond to 1σ. Figure S3. IR spectra from QUAREC. From bottom to top: Panel A shows the IR spectrum of a mixture air/T2P. Panel B shows the IR spectrum at the end of the reaction, including the product. Panels C, D and E show the reference spectra of propanal, glyoxal, and acetaldehyde. Panel F shows the resulting IR spectrum after removing the residual T2P and O3. Figure S4. Temporal evolution of T2P and the products identified by FTIR during ozonolysis in QUAREC. Figure S5. Temporal evolution of T2P and the products identified by SPME-GC / MS and FTIR during ozonolysis in RASC. Figure S6. OH production in two T2P + O3/mesitylene experiments (BUW). The error bars represent the errors due to evaluation and calibration procedures, 15% and 10% for T2P and mesitylene, respectively. Table S1: Data for Figure 1. Table S2: Data for Figure 2. Table S3: Data for Figure 3. Table S4. The Z-matrices, energies (in Hartree), imaginary frequencies of TS structures and multiplicity of all the optimized structures at M06-2X/6-311++G(d,p) level of theory.

Author Contributions

In this study, experimentalists and theorists worked in synergy. Experiments and theoretical calculations were conducted in five laboratories using different complementary experimental techniques to obtain credible results. For this reason, more than 10 authors participated in this work and the contribution of each author was as follows: C.K.: Elaboration of the experiments, data analysis and writing the manuscript; A.G.: Elaboration of the experiments and data analysis; J.N.I.: Elaboration of the experiments and data analysis; I.P.-K.: Elaboration of the experiments and data analysis; G.E.D.: Elaboration of the experiments and data analysis; P.C.: Data analysis; A.C. (André Canosa): Data analysis; P.W.: Data analysis; B.A.: Theoretical calculations and analysis; L.S.: Theoretical calculations and analysis; E.R.: Data analysis; A.T.: Supervised the work and writing of the manuscript; A.C. (Abdelkhaleq Chakir): Supervised the work and writing of the manuscript. All authors discussed the results and commented on the manuscript. All authors have read and agreed to the published version of the manuscript.

Funding

IMT Nord Europe acknowledges funding by the French ANR agency under contract No. ANR-11-LabX-0005-01 CaPPA (Chemical and Physical Properties of the Atmosphere), the Région Hauts-de-France, the Ministère de l’Enseignement Supérieur et de la Recherche (CPER Climibio) and the European Fund for Regional Economic Development. Part of this work has received funding from the European Union’s Horizon 2020 research and innovation program through the EUROCHAMP-2020 Infrastructure Activity under grant agreement No 730997. A. Grira is grateful for a PhD grant from Brittany Region and IMT Nord Europe. GSMA laboratory, IPR and IMT Nord Europe acknowledge the INSU-LEFE-CHAT program for funding this research.

Conflicts of Interest

The authors declare no conflict of interest.

References

  1. Guenther, A.; Hewitt, C.N.; Erickson, D.; Fall, R.; Geron, C.; Graedel, T.; Harley, P.; Klinger, L.; Lerdau, M.; McKay, W.A.; et al. A global model of natural volatile organic compound emissions. J. Geophys. Res. 1995, 100, 8873. [Google Scholar] [CrossRef]
  2. Ameye, M.; Allmann, S.; Verwaeren, J.; Smagghe, G.; Haesaert, G.; Schuurink, R.C.; Audenaert, K. Green leaf volatile production by plants: A meta-analysis. New Phytol. 2018, 220, 666–683. [Google Scholar] [CrossRef] [PubMed]
  3. O’Connor, M.P.; Wenger, J.C.; Mellouki, A.; Wirtz, K.; Muñoz, A. The atmospheric photolysis of E-2-hexenal, Z-3-hexenal and E,E-2,4-hexadienal. Phys. Chem. Chem. Phys. 2006, 8, 5236–5246. [Google Scholar] [CrossRef] [PubMed]
  4. Kesselmeier, J.; Staudt, M. Biogenic Volatile Organic Compound (VOC): An Overview on Emissions, Physiology and Ecology. J. Atmos. Chem. 1999, 33, 23–88. [Google Scholar] [CrossRef]
  5. Gardner, H.W.; Grove, M.J.; Salch, Y.P. Enzymic pathway to ethyl vinyl ketone and 2-pentenal in soybean preparations. J. Agric. Food Chem. 1996, 44, 882–886. [Google Scholar] [CrossRef]
  6. Grira, A.; Kalalian, C.; Illmann, J.N.; Patroescu-Klotz, I.; El Dib, G.; Coddeville, P.; Canosa, A.; Coeur, C.; Wiesen, P.; Roth, E.; et al. Gas-phase ozonolysis of trans-2-hexenal: Kinetics, products, mechanism and SOA formation. Atmos. Environ. 2021, 253, 118344. [Google Scholar] [CrossRef]
  7. Gaona Colmán, E.; Blanco, M.B.; Barnes, I.; Wiesen, P.; Teruel, M.A. Mechanism and Product Distribution of the O 3 -Initiated Degradation of (E)-2-Heptenal, (E)-2-Octenal and (E)-2-Nonenal. J. Phys. Chem. A 2017, 121, 5147–5155. [Google Scholar] [CrossRef]
  8. Colmán, E.G.; Blanco, M.B.; Barnes, I.; Teruel, M.A. Ozonolysis of a series of C7–C9 unsaturated biogenic aldehydes: Reactivity study at atmospheric pressure. RSC Adv. 2015, 5, 30500–30506. [Google Scholar] [CrossRef] [Green Version]
  9. Gaona Colman, E.; Blanco, M.B.; Barnes, I.; Teruel, M.A. Kinetics of the gas-phase reaction between ozone and three unsaturated oxygenated compounds: Ethyl 3, 3-dimethyl acrylate, 2-methyl-2-pentenal and 6-methyl-5-hepten-2-one at atmospheric pressure. Atmos. Environ. 2015, 109, 272–278. [Google Scholar] [CrossRef]
  10. Albaladejo, J.; Ballesteros, B.; Jiménez, E.; Martín, P.; Martínez, E. A PLP-LIF kinetic study of the atmospheric reactivity of a series of C4-C7 saturated and unsaturated aliphatic aldehydes with OH. Atmos. Environ. 2002, 36, 3231–3239. [Google Scholar] [CrossRef]
  11. Sato, K.; Taketsugu, T.; Takayanagi, T.; Division, A.E.; Klotz, B.; Taketsugu, T.; Takayanagi, T.; Sato, K.; Division, A.E.; Klotz, B.; et al. Kinetic measurements for the reactions of ozone with crotonaldehyde and its methyl derivatives and calculations of transition-state theory. Phys. Chem. 2004, 6, 3969–3976. [Google Scholar] [CrossRef]
  12. Kalalian, C.; Roth, E.; Chakir, A. Rate Coefficients for the Gas-Phase Reaction of Ozone with C5 and C6 Unsaturated Aldehydes. Int. J. Chem. Kinet. 2017, 50, 47–56. [Google Scholar] [CrossRef]
  13. Duncianu, M.; Olariu, R.I.; Riffault, V.; Visez, N.; Tomas, A.; Coddeville, P. Development of a new flow reactor for kinetic studies. Application to the ozonolysis of a series of alkenes. J. Phys. Chem. A 2012, 116, 6169–6179. [Google Scholar] [CrossRef] [PubMed]
  14. Turpin, E.; Tomas, A.; Fittschen, C.; Devolder, P.; Galloo, J.C. Acetone-h6 or -d6 + OH reaction products: Evidence for heterogeneous formation of acetic acid in a simulation chamber. Environ. Sci. Technol. 2006, 40, 5956–5961. [Google Scholar] [CrossRef] [PubMed]
  15. Grosiean, E.; Grosjean, D. Rate Constants for the Gas-Phase Reaction of Ozone with 1, 1-Disubstituted Alkenes. Int. J. Chem. Kinet. 1996, 28, 911–918. [Google Scholar] [CrossRef]
  16. Illmann, J.N.; Patroescu-Klotz, I.; Wiesen, P. Gas-phase reactivity of acyclic α,β-unsaturated carbonyls towards ozone. Phys. Chem. Chem. Phys. 2021, 23, 3455–3466. [Google Scholar] [CrossRef] [PubMed]
  17. Illmann, N.; Gastón Gibilisco, R.; Bejan, I.G.; Patroescu-Klotz, I.; Wiesen, P. Atmospheric oxidation of α,β-unsaturated ketones: Kinetics and mechanism of the OH radical reaction. Atmos. Chem. Phys. Discuss. 2021, 1–34. [Google Scholar]
  18. Volkamer, R.; Spietz, P.; Burrows, J.; Platt, U. High-resolution absorption cross-section of glyoxal in the UV-vis and IR spectral ranges. J. Photochem. Photobiol. A Chem. 2005, 172, 35–46. [Google Scholar] [CrossRef]
  19. Ahmad, W.; Coeur, C.; Tomas, A.; Fagniez, T.; Brubach, J.-B.; Cuisset, A. Infrared spectroscopy of secondary organic aerosol precursors and investigation of the hygroscopicity of SOA formed from the OH reaction with guaiacol and syringol. Appl. Opt. 2017, 56, E116–E122. [Google Scholar] [CrossRef]
  20. Laversin, H.; Masri, A.E.; Rashidi, M.A.; Roth, E.; Chakir, A. Kinetic of the gas-phase reactions of OH radicals and Cl atoms with diethyl ethylphosphonate and triethyl phosphate. Atmos. Environ. 2016, 126, 250–257. [Google Scholar] [CrossRef] [Green Version]
  21. Kalalian, C.; Roth, E.; El Dib, G.; Singh, H.J.; Rao, P.K.; Chakir, A. Product investigation of the gas phase ozonolysis of 1-penten-3-ol, cis-2-penten-1-ol and trans-3-hexen-1-ol. Atmos. Environ. 2020, 238, 117732. [Google Scholar] [CrossRef]
  22. Reisen, F.; Aschmann, S.M.; Atkinson, R.; Arey, J. Hydroxyaldehyde products from hydroxyl radical reactions of Z-3-hexen-1-ol and 2-methyl-3-buten-2-ol quantified by SPME and API-MS. Environ. Sci. Technol. 2003, 37, 4664–4671. [Google Scholar] [CrossRef] [PubMed]
  23. Jonsson, Å.M.; Hallquist, M.; Ljungström, E. Influence of OH scavenger on the water effect on secondary organic aerosol formation from ozonolysis of limonene, Δ3-carene, and α-pinene. Environ. Sci. Technol. 2008, 42, 5938–5944. [Google Scholar] [CrossRef] [PubMed]
  24. Ye, P.; Ding, X.; Hakala, J.; Hofbauer, V.; Robinson, E.S.; Donahue, N.M. Vapor wall loss of semi-volatile organic compounds in a Teflon chamber. Aerosol Sci. Technol. 2016, 50, 822–834. [Google Scholar] [CrossRef] [Green Version]
  25. Odum, J.R.; Hoffmann, T.; Bowman, F.; Collins, D.; Flagan, R.C.; Seinfeld, J.H.; Odum Jay, R.; Hoffmann, T.; Bowman, F.; Collins, D.; et al. Gas/particle partitioning and secondary organic aerosol yields. Environ. Sci. Technol. 1996, 30, 2580–2585. [Google Scholar] [CrossRef]
  26. Zhao, Y.; Truhlar, D.G. The M06 suite of density functionals for main group thermochemistry, thermochemical kinetics, noncovalent interactions, excited states, and transition elements: Two new functionals and systematic testing of four M06-class functionals and 12 other function. Theor. Chem. Acc. 2008, 120, 215–241. [Google Scholar] [CrossRef] [Green Version]
  27. Becke, A.D. A new mixing of Hartree–Fock and local density-functional theories. J. Chem. Phys. 1993, 98, 1372–1377. [Google Scholar] [CrossRef]
  28. Gonzalez, C.; Bernhard Schlegel, H. An improved algorithm for reaction path following. J. Chem. Phys. 1989, 90, 2154–2161. [Google Scholar] [CrossRef]
  29. Gonzalez, C.; Schlegel, H.B. Reaction path following in mass-weighted internal coordinates. J. Phys. Chem. 1990, 94, 5523–5527. [Google Scholar] [CrossRef]
  30. Aazaad, B.; Lakshmipathi, S. OH initiated oxidation mechanism of monoterpene (linalool)—A first comprehensive theoretical study. Atmos. Environ. 2018, 189, 235–243. [Google Scholar] [CrossRef]
  31. Aazaad, B.; Lakshmipathi, S. Reaction of NO3 radical with benzyl alcohol—A DFT study. Comput. Theor. Chem. 2017, 1102, 51–59. [Google Scholar] [CrossRef]
  32. Priya, A.M.; Senthilkumar, L. Degradation of methyl salicylate through Cl initiated atmospheric oxidation-a theoretical study. RSC Adv. 2014, 4, 23464–23475. [Google Scholar] [CrossRef]
  33. Garrett, B.C.; Truhlar, D.G. Criterion of minimum state density in the transition state theory of bimolecular reactions. J. Chem. Phys. 1979, 70, 1593–1598. [Google Scholar] [CrossRef]
  34. Garrett, B.C.; Truhlar, D.G. Generalized Transition State Theory. Bond Energy-Bond Order Method for Canonical Variational Calculations with Application to Hydrogen Atom Transfer Reactions. J. Am. Chem. Soc. 1979, 101, 4534–4548. [Google Scholar] [CrossRef]
  35. Garrett, B.C.; Truhlar, D.G.; Grev, R.S.; Magnuson, A.W. Improved treatment of threshold contributions in variational transition-state theory. J. Phys. Chem. 1980, 84, 1730–1748. [Google Scholar] [CrossRef]
  36. Liu, Y.P.; Lynch, G.C.; Truong, T.N.; Lu, D.H.; Truhlar, D.G.; Garrett, B.C. Molecular Modeling of the Kinetic Isotope Effect for the [1,5] Sigmatropic Rearrangement of cis-1,3-Pentadiene. J. Am. Chem. Soc. 1993, 115, 2408–2415. [Google Scholar] [CrossRef]
  37. Lu, D.H.; Truong, T.N.; Melissas, V.S.; Lynch, G.C.; Liu, Y.P.; Garrett, B.C.; Steckler, R.; Isaacson, A.D.; Rai, S.N.; Hancock, G.C.; et al. POLYRATE 4: A new version of a computer program for the calculation of chemical reaction rates for polyatomics. Comput. Phys. Commun. 1992, 71, 235–262. [Google Scholar] [CrossRef]
  38. Zheng, J.; Zhang, S.; Corchado, J.C.; Chuang, Y.Y.; Coitino, E.L.; Ellingson, B.A.; Truhlar, D.G. Gaussrate, Version 2009-A. Univ. Minnesota Minneapolis, MN 2010. Available online: https://comp.chem.umn.edu/gaussrate/gaussrate_Manual_v2009A.2010.03.17.pdf (accessed on 4 February 2022).
  39. Frisch, M.J.; Trucks, G.W.; Schlegel, H.B.; Scuseria, G.E.; Robb, M.A.; Cheeseman, J.R.; Scalmani, G.; Barone, V.; Mennucci, B.; Petersson, G.A. Gaussian 09, Revision B. 01; Gaussian Inc.: Wallingford, CT, USA, 2010. [Google Scholar]
  40. Zheng, J.; Zhang, S.; Lynch, B.J.; Corchado, J.C.; Chuang, Y.; Fast, P.L.; Hu, W.; Liu, Y.; Lynch, G.C.; Nguyen, K.A.; et al. Manual POLYRATE—Version 2010-A. 2010. Available online: https://comp.chem.umn.edu/polyrate/polyrate_Manual_v2010A.2010.6.16.pdf (accessed on 4 February 2022).
  41. Werner, H.J.; Knowles, P.J.; Knizia, G.; Manby, F.R.; Schütz, M.; Celani, P.; Korona, T.; Lindh, R.; Mitrushenkov, A.; Rauhut, G. MOLPRO, Version 2010.1, a Package of Ab Initio Programs. 2010. Available online: http//www.molpro.net (accessed on 4 February 2022).
  42. Atkinson, R.; Arey, J. Atmospheric Degradation of Volatile Organic Compounds. Chem. Rev. 2003, 103, 4605–4638. [Google Scholar] [CrossRef]
  43. Johnson, D.; Marston, G. The gas-phase ozonolysis of unsaturated volatile organic compounds in the troposphere. Chem. Soc. Rev. 2008, 37, 699–716. [Google Scholar] [CrossRef]
  44. Grosjean, E.; Grosjean, D. Carbonyl products of the gas phase reaction of ozone with symmetrical alkenes. Environ. Sci. Technol. 1996, 30, 2036–2044. [Google Scholar] [CrossRef]
  45. Fang, Y.; Liu, F.; Klippenstein, S.J.; Lester, M.I. Direct observation of unimolecular decay of CH3CH2CHOO Criegee intermediates to OH radical products. J. Chem. Phys. 2016, 145. [Google Scholar] [CrossRef]
  46. Grosjean, E.; Williams, E.L., II; Grosjean, D. Atmospheric chemistry of acrolein. Sci. Total Environ. 1994, 153, 195–202. [Google Scholar] [CrossRef]
  47. Grosjean, D.; Williams II, E.L.; Grosjean, E. Atmospheric Chemistry of Isoprene and of Its Carbonyl Products. Environ. Sci. Technol 1993, 27, 830–840. [Google Scholar] [CrossRef]
  48. Grosjean, E.; Grosjean, D. The gas phase reaction of unsaturated oxygenates with ozone: Carbonyl products and comparison with the alkene-ozone reaction. J. Atmos. Chem. 1997, 27, 271–289. [Google Scholar] [CrossRef]
  49. Grosjean, E.; Grosiean, D.; Selnfeldt, J.H. Gas-Phase Reaction of Ozone with Trans-2-Hexenal, Trans-2-Hexenyl Acetate, Ethylvinyl Ketone, and 6-Methyl-5-Hepten-2-One. Int. J. Chem. Kinet. 1996, 28, 373–382. [Google Scholar] [CrossRef]
  50. Tuazon, E.C.; Aschmann, S.M.; Arey, J.; Atkinson, R. Products of the gas-phase reactions of O3 with a series of methyl- substituted ethenes. Environ. Sci. Technol. 1997, 31, 3004–3009. [Google Scholar] [CrossRef]
  51. Wegener, R.; Brauers, T.; Koppmann, R.; Bares, S.R.; Rohrer, F.; Tillman, R.; Wahner, A.; Hansel, A.; Wisthaler, A. Simulation chamber investigation of the reactions of ozone with short-chained alkenes. J. Geophys. Res. Atmos. 2007, 112, 1–17. [Google Scholar] [CrossRef] [Green Version]
  52. Liu, T.; Wang, Z.; Huang, D.D.; Wang, X.; Chan, C.K. Significant Production of Secondary Organic Aerosol from Emissions of Heated Cooking Oils. Environ. Sci. Technol. Lett. 2018, 5, 32–37. [Google Scholar] [CrossRef]
Figure 1. Plots of k’ versus [T2P]0 for the experiments carried out in LFR (blue triangles) and in ASC (red triangles). Error bars represent two standard deviations.
Atmosphere 13 00291 g001
Figure 2. Product yield Yx plots obtained for the T2P ozonolysis without OH scavenger in QUAREC with x = glyoxal (red), propanal (blue) and acetaldehyde (green).
Atmosphere 13 00291 g002
Figure 3. Products yield Yx plots obtained for the T2P ozonolysis with cyclohexane as an OH scavenger in RASC-Reims with x = glyoxal (red), propanal (blue), acetaldehyde (green) and 2-hydroxypropanal (black).
Atmosphere 13 00291 g003
Figure 4. Proposed mechanistic scheme for the ozonolysis of T2P; framed products correspond to those identified in FTIR and GC/MS with and without scavenger.
Atmosphere 13 00291 g004
Figure 5. The optimized stationary points of the reaction of trans-2-pentenal with O3.
Atmosphere 13 00291 g005
Figure 6. The relative energy profile of the trans-2-pentenal reaction with O3. The first diagram allows to calculate pathway 1 whereas the second diagram allows calculating pathways 2 and 3. This latter calculation starts from the ozonide at ground state as explained in the main text. In the second diagram, I1 is therefore the energy reference.
Atmosphere 13 00291 g006
Figure 7. The Arrhenius plot of trans-2-pentenal reaction with O3.
Atmosphere 13 00291 g007
Figure 8. SOA formation as a function of time for T2P ozonolysis in the ASC chamber ([T2P]0 = 2.3 ppm and [O3]0 = 387 ppb).
Atmosphere 13 00291 g008
Figure 9. SOA formation yields YSOA vs. aerosol mass concentrations M0 for T2P ozonolysis in the ASC chamber ([T2P]0 = 2.1–4.5 ppm and [O3]0 = 65–516 ppb). The line corresponds to a fit using equation 8.
Atmosphere 13 00291 g009
Table 1. Experimental conditions and obtained rate coefficients for the ozonolysis of T2P in LFR and ASC reactors at 298 ± 2 K.
Reactor[T2P]0
(ppm)
[O3]0
(ppb)
k (10−18 cm3 molecule−1 s−1)
This WorkLiterature
LFR7.9−28~5501.42 ± 0.21 a1.59 ± 0.22 [11]
ASC4.3−19270−4401.51 ± 0.22 a1.24 ± 0.06 [12]
Average1.46 ± 0.31 b1.4 c [16]
a: uncertainties are 2σ; b: uncertainty is the quadratic mean of 2σ, c: SAR prediction.
Table 2. Product formation yields obtained during the ozonolysis of T2P in the presence and the absence of cyclohexane. Uncertainties represent 2σ.
OH ScavengerIdentified Products Yield (%)
YesGlyoxal57 ± 10
Propanal42 ± 12
2-hydroxypropanal5 ± 2
Acetaldehyde9 ± 3
NoGlyoxal38 ± 8
Propanal26 ± 5
Acetaldehyde12 ± 3
Propanoic acid-
Table 3. The relative energy, enthalpy and Gibb’s free energy (in kcal/mol) for the reaction of trans-2-pentenal with O3 calculated at 6-311++G(d,p) basis set level.
Reaction ChannelM06−2XBH and HLYPMP2CCSD(T)
ΔEΔHΔGΔEΔHΔGΔEΔHΔGΔE
Path 1R10000000000
RC1−3.30−2.63−6.16−1.75−1.27−5.18−3.38−2.99−3.72−2.27
TS1−22.47−20.70−20.44−19.69−17.74−15.46−38.27−35.76−29.72−31.10
I1−92.25−87.85−86.34−90.21−85.44−81.94−84.21−79.30−72.73−86.51
Path 2I10000000000
TS221.6019.8119.9825.6323.4123.323.852.472.4913.71
I2−9.75−12.33−15.14−13.08−16.60−20.50−8.42−11.34−14.68−11.07
Path 3TS323.4222.1622.3126.6724.1724.316.825.716.1815.74
I3−4.52−7.36−10.67−8.09−11.67−15.87−6.76−10.20−15.41−8.42
Table 4. The initial, secondary rate coefficients (cm3molecule−1s−1) and the corresponding branching ratios for reactions of trans-2-pentenal with O3 calculated at the M06-2X/6-311++G(d,p) level of theory.
Temp (K)Initial (k)
Path 1
Secondary Rate (k)Branching Ratio %
Path 2Path 3TotalPath 2Path 3Total
2781.76 × 10−184.33 × 10−273.57 × 10−277.90 × 10−2754.8345.17100
2882.47 × 10−181.46 × 10−261.12 × 10−262.58 × 10−2656.5343.47100
2983.39 × 10−184.55 × 10−263.30 × 10−267.85 × 10−2657.9242.08100
3084.57 × 10−181.32 × 10−259.20 × 10−262.24 × 10−2558.9941.01100
3186.04 × 10−183.62 × 10−252.34 × 10−255.96 × 10−2560.7239.28100
3287.89 × 10−189.30 × 10−255.83 × 10−251.51 × 10−2461.4738.53100
3381.01 × 10−172.27 × 10−241.37 × 10−243.65 × 10−2462.3537.65100
3481.29 × 10−175.28 × 10−243.09 × 10−248.37 × 10−2463.0936.91100
3501.35 × 10−176.23 × 10−243.52 × 10−249.75 × 10−2463.8836.12100
Publisher’s Note: MDPI stays neutral with regard to jurisdictional claims in published maps and institutional affiliations.

