Article

The Behavior of Moist Potential Vorticity in the Interactions of Binary Typhoons Lekima and Krosa (2019) in with Different High-Resolution Simulations

1
Key Laboratory of Physical Oceanography, The College of Oceanic and Atmospheric Sciences & Institute for Advanced Ocean Study/Frontiers Science Center for Deep Ocean Multispheres and Earth System (DOMES), Ocean University of China, Qingdao 266100, China
2
Qingdao Pilot National Laboratory for Marine Science and Technology (QNLM), Qingdao 266273, China
3
International Laboratory for High-Resolution Earth System Model and Prediction (iHESP), Qingdao 266273, China
4
The Institute of Atmospheric Physics, Chinese Academy of Sciences, Beijing 100029, China
5
The College of Oceanography, Hohai University, Nanjing 210098, China
6
Key Laboratory of Marine Environmental Science and Ecology, Ministry of Education, Ocean University of China, Qingdao 266100, China
*
Author to whom correspondence should be addressed.
Jianlin Yong and Simin Ren are co-first authors contributed equally to this work.
Atmosphere 2022, 13(2), 281; https://doi.org/10.3390/atmos13020281
Submission received: 16 January 2022 / Revised: 5 February 2022 / Accepted: 5 February 2022 / Published: 8 February 2022
(This article belongs to the Section Meteorology)

Abstract

:
The binary typhoon systems of Lekima and Krosa (2019) have been simulated using the Weather Research and Forecast (WRF) model with 27 km, 9 km, and 3 km resolutions and their behaviors of moist potential vorticity (MPV) in these simulations have been analyzed. All the simulations clearly show that the main sources of instability energy include two parts of MPV—the convective energy from the environmental field (MPV1) and the internal transferring energy between the binary typhoons (MPV2). While typhoons absorb the convective energy from the upper ocean through vortex effects on their periphery as the main external MPV sources, there is an MPV conveying belt at the middle-low layer of the atmosphere in the binary typhoon system, transferring energy between binary typhoons and causing atmospheric baroclinicity changes. While all three-resolution simulations show the fundamental features of MPV and its transferring in the binary typhoon system, the 3 km resolution cloud-resolving simulation yield more detailed and accurate MPV structures inside the individual typhoon, which may have non-negligible feedbacks on the background. Based on the comprehensive characteristics of MPV in binary typhoon interactions, further understanding of the interactions of internal detailed structures inside typhoons and their feedbacks on the background may provide a theoretical basis for improving the forecast of typhoon intensity and track.

1. Introduction

The typhoon is a strong convective system. The atmospheric disturbance on the sea surface disturbance can rapidly develop and become stronger by absorbing energy from the ocean and latent heat release during water vapor condensation (e.g., [1,2]). Due to the complex mechanism of formation and development, it is difficult to use a single physical variable to fully represent a typhoon and understand the evolution process of its lifecycle, such as vertical velocity, vorticity, or water vapor flux, etc. The moist potential vorticity (MPV) combines the characteristics of dynamics and thermodynamics including water vapor phase change [3], thus being a comprehensive physical variable to analyze convective weather processes such as typhoons, which is widely used in real typhoons and heavy rain diagnosis and forecasting (e.g., [4]). Based on the slantwise vorticity development theory [3], analyzing the explosive growth of vorticity on the slantwise isentropic surface within the MPV theory in weather forecasts were further developed [4,5,6,7]. Based on the classical theory, the generalized MPV theory was further proposed by introducing the condensation rate of water vapor [8,9,10], and latent heat release, as well as mass forcing in the process of water vapor condensation [11,12]. The MPV theory has been continuously improved and applied to different practical situations.
The MPV can characterize different physical properties, according to its barotropic and baroclinic parts [13]. It can be used to locate the falling area of heavy rain [11,14] and predict the moving path of the system [15,16], showing the evolution of intensity and the influence of the environmental flow field [17,18,19,20]. The barotropic part of MPV represents the change of convective energy, which can be used to diagnose typhoon degradation caused by the propagation of disturbed vorticity at different levels of the atmosphere. In the typhoon circulation, areas with strong instability energy and high baroclinicity (the baroclinic part of MPV) may produce heavy rainstorms. In addition, MPV can represent air masses with different cold and warm properties to describe the convections caused by the convergence and exchange of air masses with different properties [17].
It could be of great importance to apply the MPV theory to a binary typhoon system to study the interaction of typhoons. A binary typhoon system refers to a system composed of two typhoons on the ocean at the same time, and their strength and paths could be affected by mutual interactions. In such a system, different members generate mass and energy exchanges through cyclonic vortices on the periphery [21,22]. Numerical experiments and observational analyses show the existence of the interaction within a binary system (e.g., [23]). The interactions are usually affected by the structure and strength of individual and binary typhoons, as well as the environmental flow [24,25], and the relatively stronger typhoon in the binary typhoon system dominates the pathway of weaker one [14,25]. Such complexity makes the forecast of binary typhoons challenging [22].
With the advancement of modern geoscience and information technology, the representation of model resolution and physics is continuously improving. Using high-resolution models, it becomes more applicable to simulate and predict the evolution of strength and path of typhoons in operations. However, many important issues remain unclarified. For example, given that a typhoon is a thermodynamical system in which moisture is deeply involved, the internal interactions within a binary typhoon system in a view of moist thermodynamics need to be further studied. How the detailed internal structures inside typhoons interact with the environment is unclear. In addition, given that the typhoon genesis is a result of air-sea interactions, developing a new comprehensive MPV-like quantity as the precursor of typhoon genesis is both interesting and promising. Such a quantity includes the composite properties of low atmosphere and upper ocean cross the air-sea interface.
As the first step, based on a few high-resolution simulations, this study applies the MPV theory to investigate the structure of the Lekima and Krosa (2019) binary typhoon system and tries to gain insights into the moist thermodynamics of binary typhoon systems. A deep understanding of the interaction between the binary typhoons can improve the predictability of the binary or even multiple typhoon system. After the introduction, the three-resolution model configurations and experiment settings are given in Section 2. We briefly summarize the MPV theory in Section 3 and describe the associated circulations and weather processes of Lekima and Krosa in Section 4. The MPV diagnosis of the Lekima and Krosa binary typhoon system is analyzed and discussed in Section 5. Finally, summaries and discussions are given in Section 6.

2. The Brief Description of the WRF Model and Experiment Setting

In this study, we take advantage of the Asia-Pacific (38° E–180°, 20° S–60° N) high-resolution coupled prediction (AP-RCP) systems [26] using the mesoscale numerical Weather Research and Forecasting (WRF, v3.7.1) model, at three resolutions of 27 km, 9 km, and 3 km, for the MPV studies of Lekima and Krosa in 2019. The model configuration has been detailed in Li et al. [26] and we only comment some relevant aspects to this study. In brief, the physics options selected in this study include a Kain-Fritsch convection scheme [27], the Rapid Radiative Transfer Model for GCMs (RRTMG) longwave and shortwave radiation scheme [28], the Yonsei University (YSU) scheme [29] for the planetary boundary layer, a thermal diffusion land surface scheme and a WRF single moment (WSM) 3-class simple ice scheme [30] for microphysics, which provides a reasonable jet stream and storm track pattern [26]. Particularly, for the simulations at grid spacings of 3 km, the cumulus convection parameterization scheme is turned off. The detailed model settings are listed in Table 1.
The simulations span from the 5 to 15 August 2019, with the initial conditions at 00:00 on the 5 August 2019 from the atmosphere initial conditions of the AP-RCP system produced by dynamically-downscaled weakly coupled data assimilation described in Li et al. [26]. The WRF models are integrated from 00:00 on the 5 August to 18:00 on the 15 August.

3. The MPV Theory

The variables used in the analysis of MPV include wind vector, gravity acceleration, vertical velocity, Coriolis parameters, relative humidity, geopotential height and wet potential temperature. The definition of potential vorticity implies the conservation in adiabatic, frictionless dry air. The convection processes, particularly in the strong cases such as heavy rain and typhoon, are often accompanied with complex water vapor phase transition and a large amount of water vapor condensation, as well as the latent heat release. In this case, the system no longer satisfies the condition of the potential vorticity conservation of dry air. When the diabatic heating (excluding condensation, sublimation, and friction effects) is not considered, the moist potential vorticity is conserved, and therefore the wet potential temperature and moist potential vorticity are introduced to replace the potential temperature and potential vorticity. In the actual calculation of moist potential vorticity, the horizontal variation of atmospheric vertical velocity is ignored. According to the classical MPV theory, the expression of moist potential vorticity in the isobaric surface (P) coordinate system can be expressed as (also see [3]):
MPV g ( ζ + f ) θ e p + g ( v p θ e x u p θ e y )
and
θ e = θ ( P , T ) exp ( Lq C p T c )
where g is gravity acceleration, ζ vertical vorticity, f Coriolis parameters, while u and v are the zonal and meridional velocity, respectively.   θ and θ e are potential temperature and wet potential temperature, respectively, while p is pressure, T and Tc are temperature and dew-point temperature. L is the latent heat rate of water vapor condensation, q is specific humidity, and Cp is the specific heat at constant pressure. Then, MPV can be decomposed into two parts as MPV1 and MPV2:
MPV 1 = g ( ζ + f ) θ e p
MPV 2 = g ( v p θ e x u p θ e y )
In Equation (3), MPV 1 represents the barotropic part of MPV , which is composed of inertial stability term ( ζ + f ) and convective stability term ( g θ e p ) . As pointed by Wu et al. (1995), under normal conditions ( ζ + f ) is positive when the atmosphere is convective unstable ( θ e p > 0 ) , MPV1 is negative and represents convective instability energy, conducive to the occurrence and development of convective events. If MPV 1 < 0 , and ( ζ + f ) < 0, it is inertially unstable, which is not conducive to convective motion. As shown in Equation (4), MPV 2 is the baroclinic part of MPV , consisting of contributions from both atmospheric moist baroclinicity and vertical shear of the horizontal wind. Thus, MPV2 is referred to as atmospheric wet baroclinicity. A negative value of MPV2 represents atmospheric baroclinicity instability, while the negative amount of MPV2 can be referred to as baroclinicity instability energy [3].

4. The Synoptic Background Associated with Lekima and Krosa

4.1. The Weather Conditions

The typhoon Lekima (2019) was the strongest Pacific typhoon that made landfall in China and caused severe economic losses to most of the coastal provinces in the year. The Lekima was born on the Philippine Ocean on 29 July 2019 as a low-pressure center and developed into a typhoon on 7 August. It landed on the coast of Chengnan Town, Wenling City, Zhejiang Province at 1:45 on the 10 August, where the lowest central pressure was 930 hPa and the maximum wind speed was 16 grades (52 m/s) [31]. The subsequent northward movement of Lekima caused heavy precipitation to the passing provinces and made a second landing in Qingdao, Shandong on the 11th, and eventually dissipated in the Bohai Sea on the 15th. On 6 August, another typhoon, Krosa, on the tropical western Pacific Ocean was upgraded from a tropical depression, indicating there was a binary typhoon system generated, composed of double typhoons on the tropical western Pacific Ocean at the same time. The strong intensity of the typhoon Lekima, a super typhoon, was implicative of a complex mutual exchange of air mass and energy between these binary typhoons. Thus, this study aims to examine the MPV of the binary typhoons, and elucidate the characteristics in the binary typhoon system, as well as the possible interconnections between the two typhoons in the system.

4.2. The Background Circulations and the Intensity of Typhoons Lekima and Krosa (2019)

The intensity and tracks of typhoons are affected by the movement and changes of the subtropical high in the tropical North Pacific in the middle and upper atmosphere. To better delineate the evolution of the moist potential vorticity in the binary typhoon system and the interactions of binary typhoons, it is useful to first examine the environmental flow at 500 hPa.
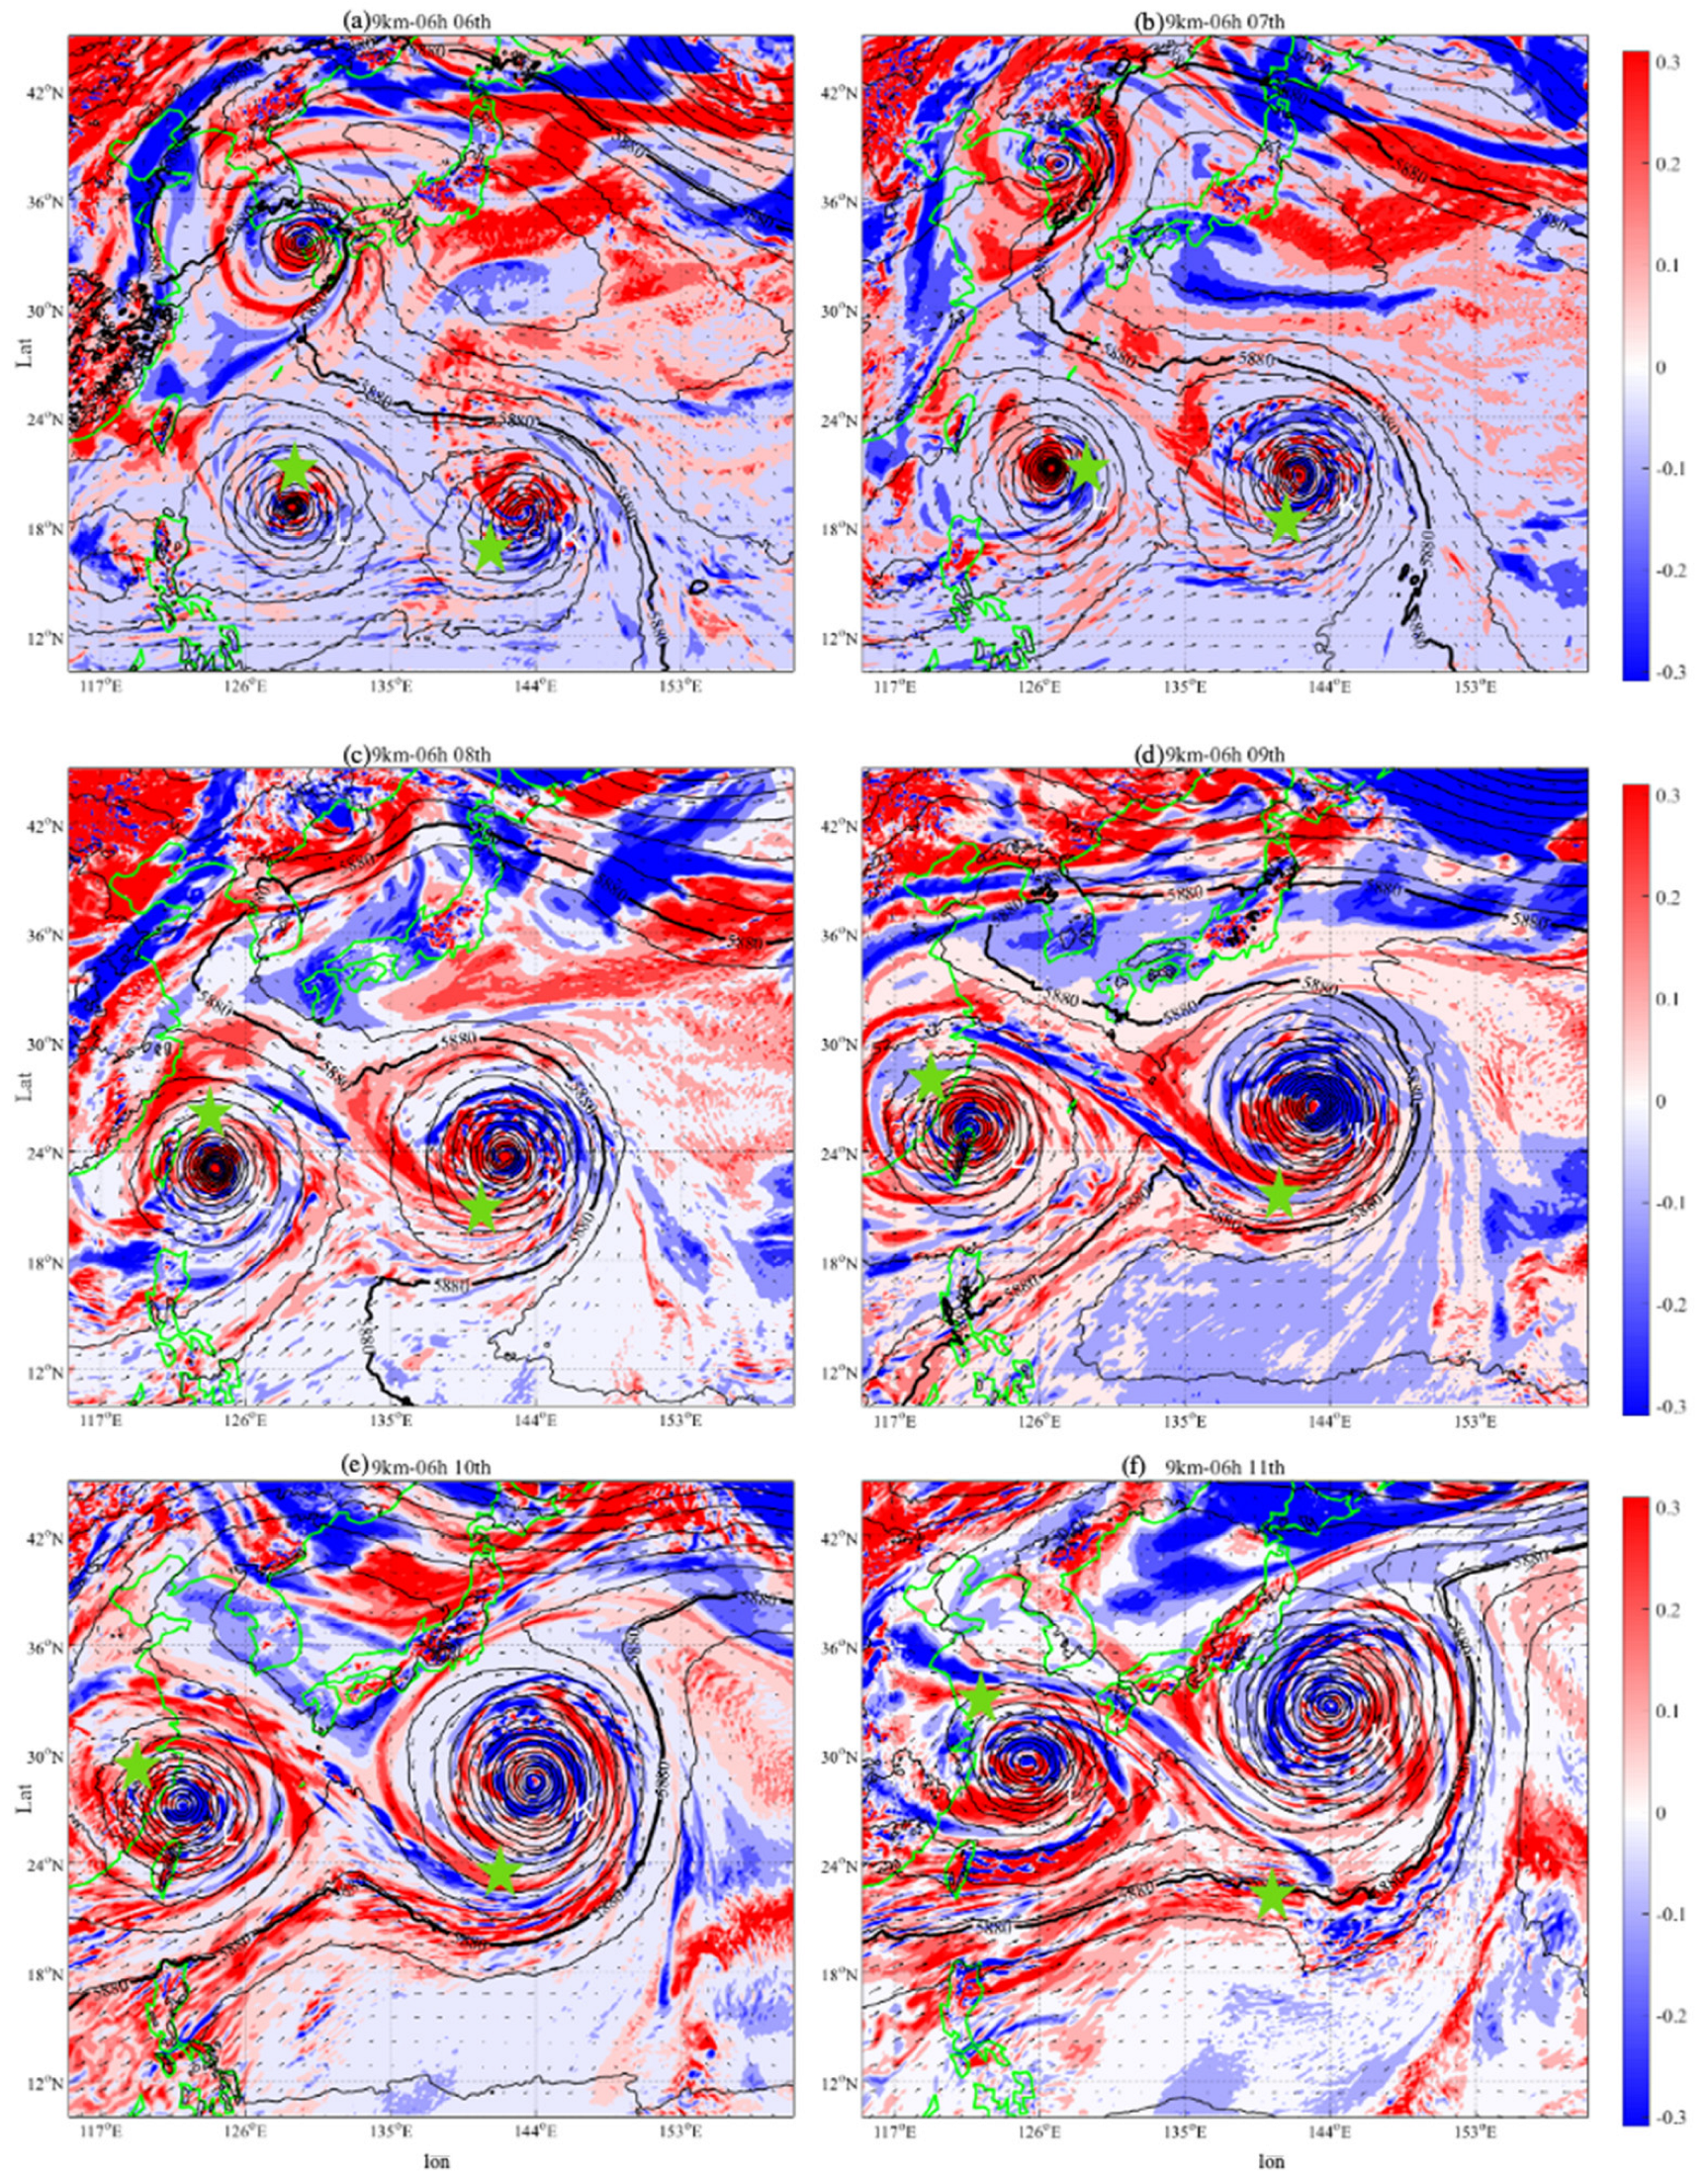
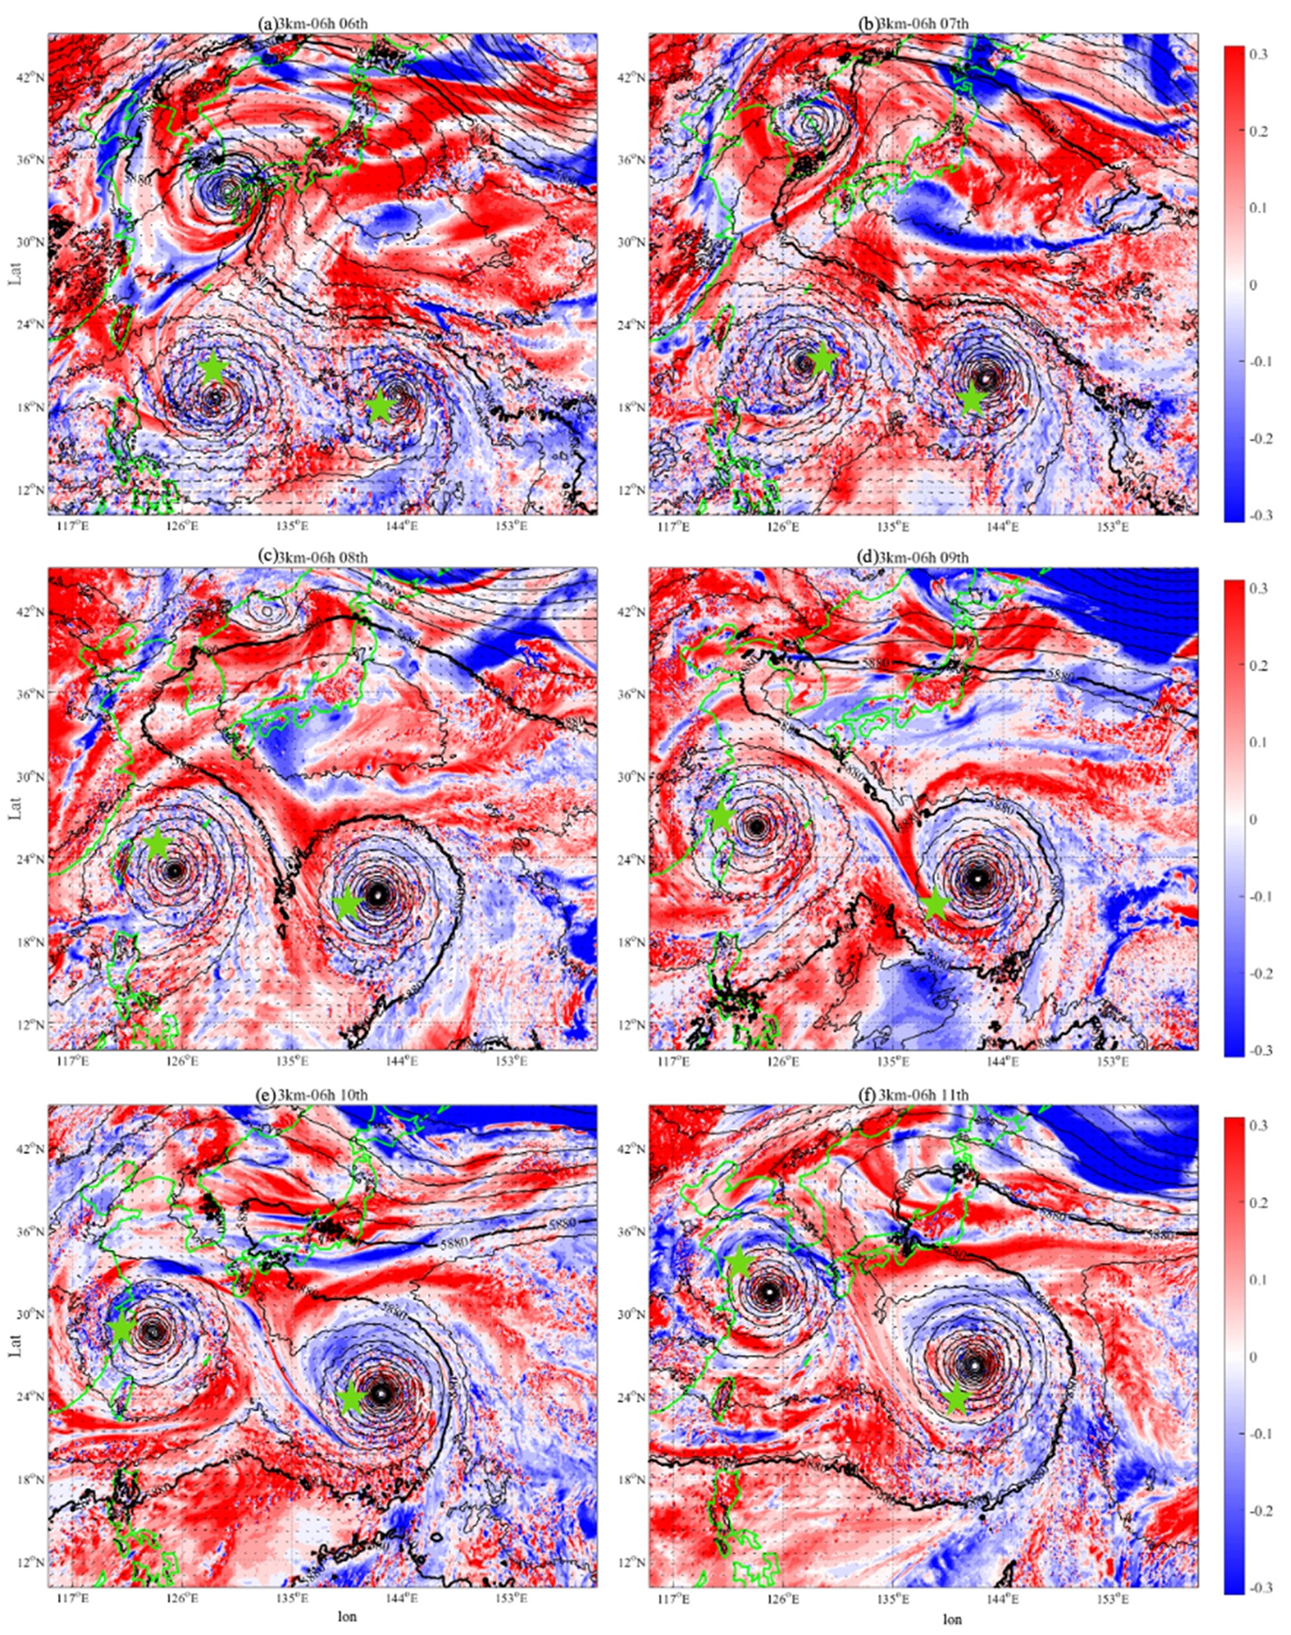
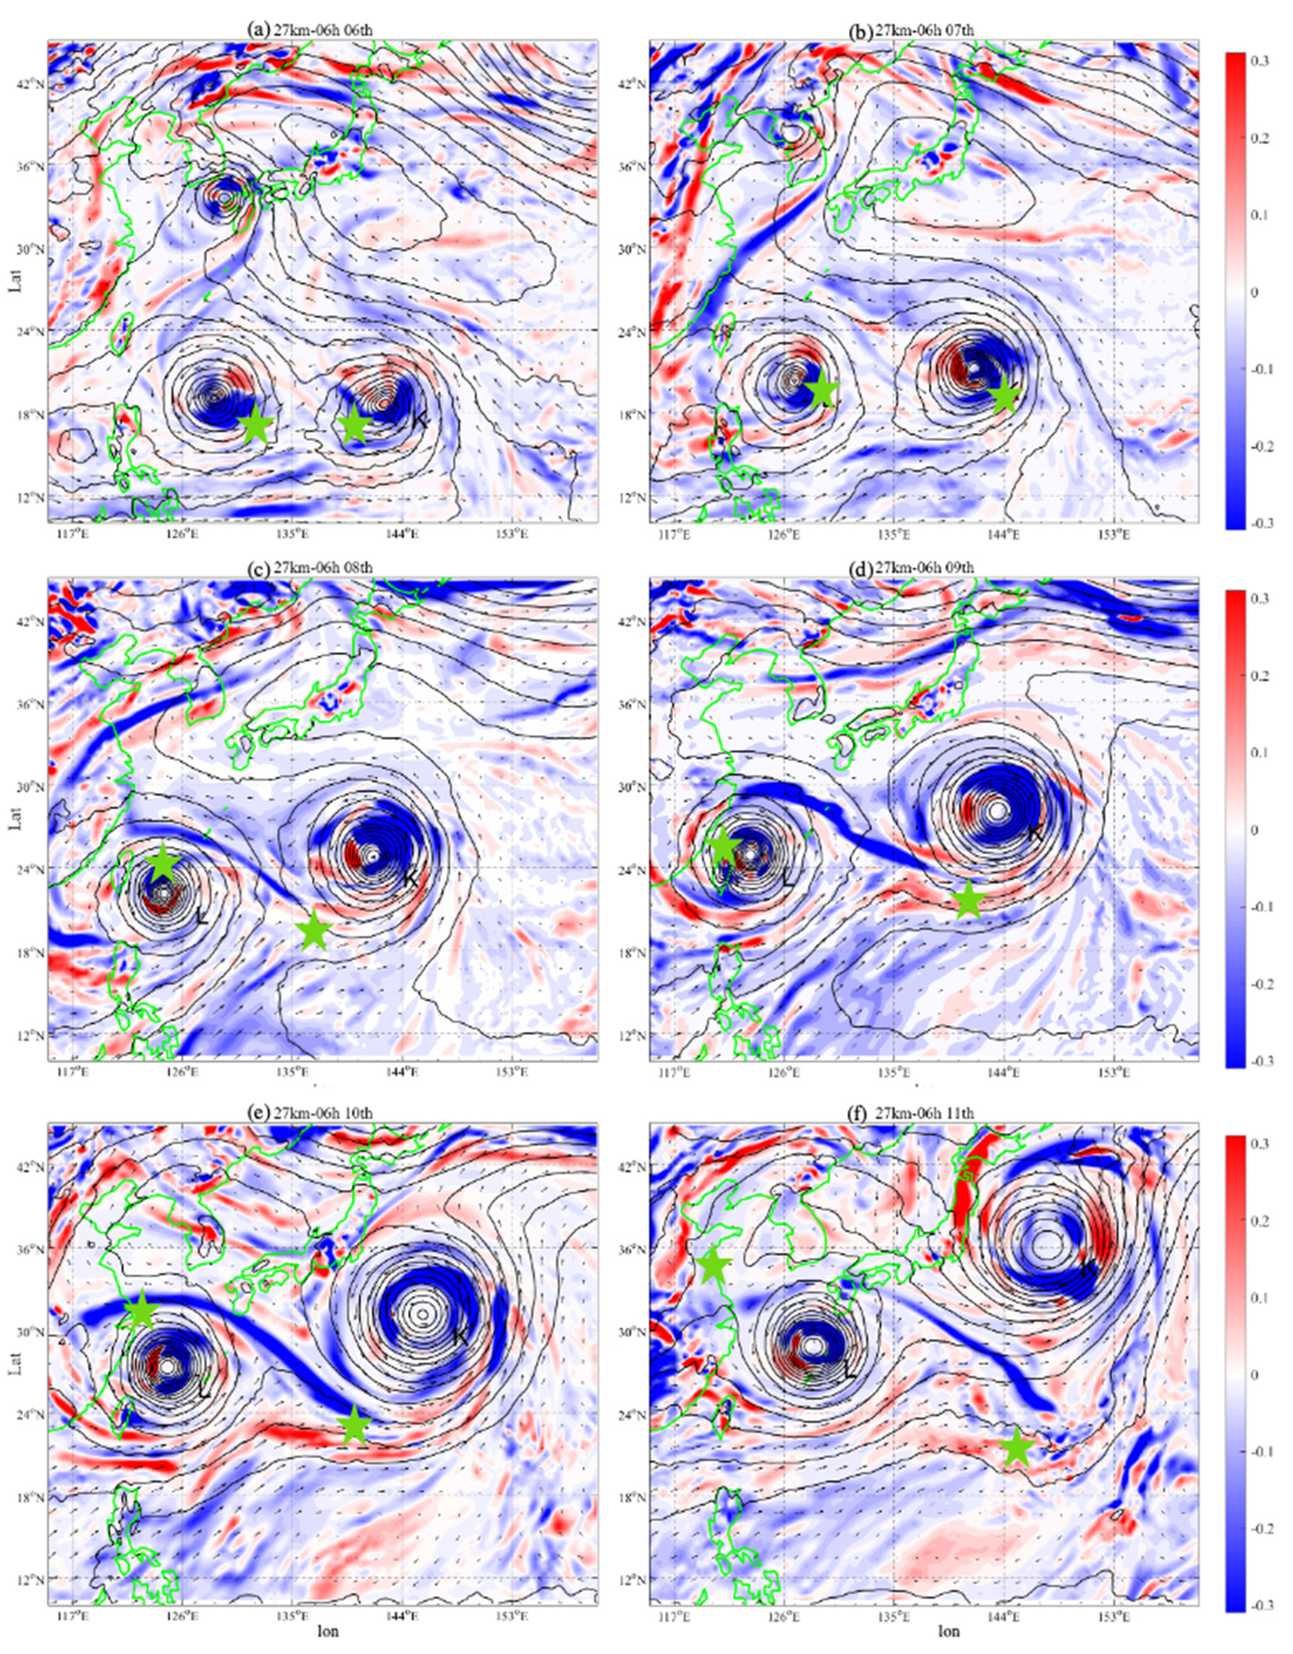
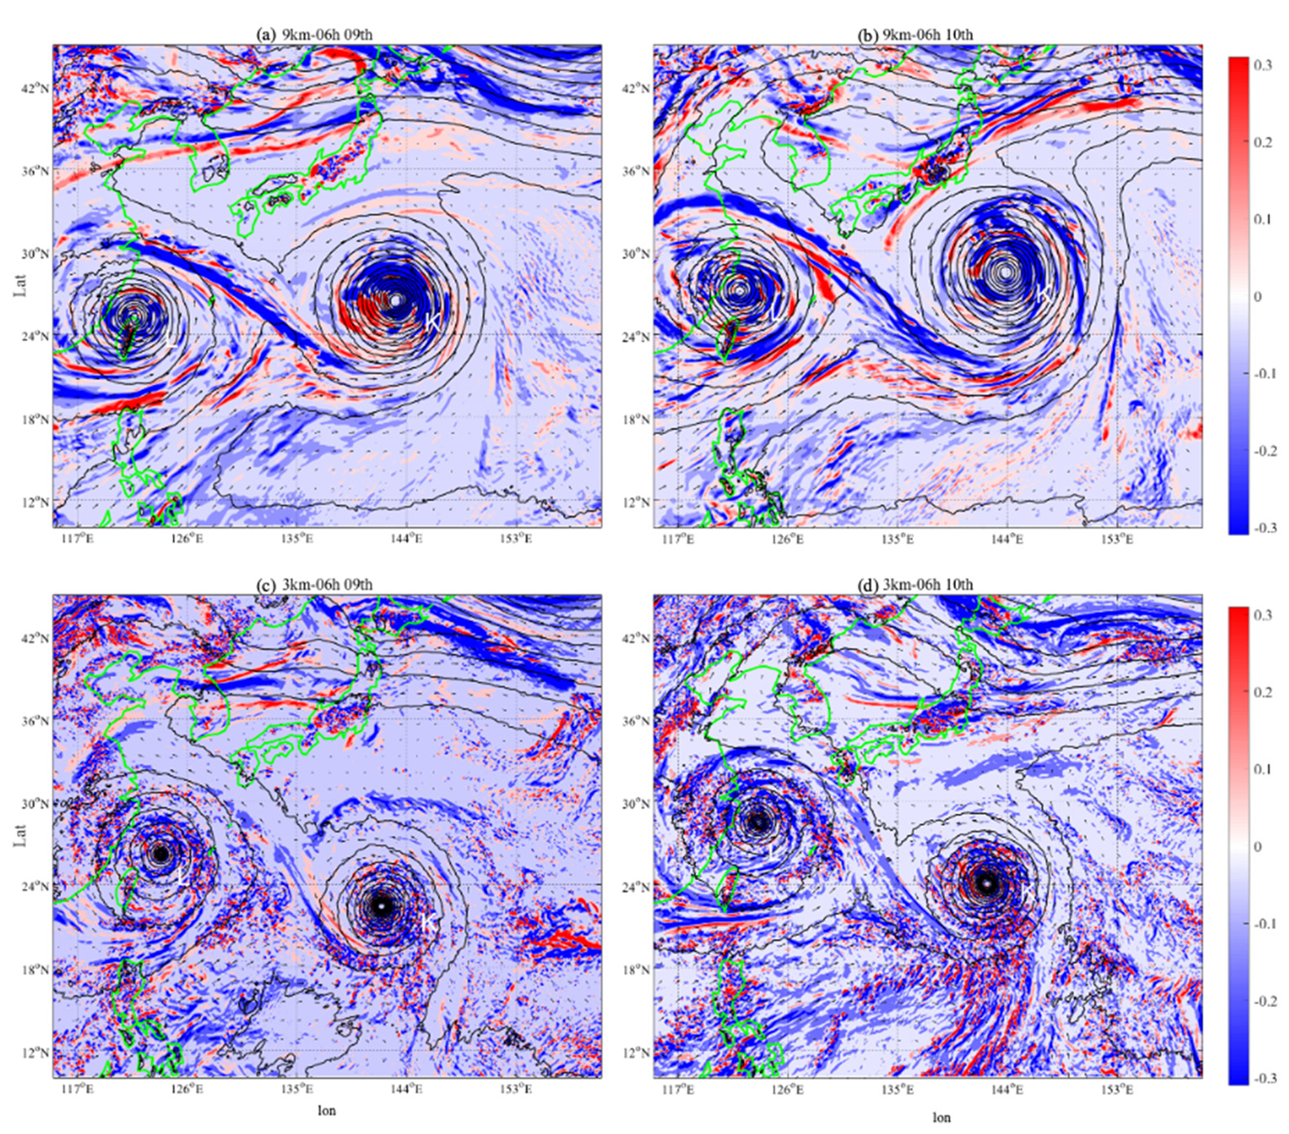
The 500 hPa geopotential height during the period simulated at three different resolution models are shown by contours in Figure 1, Figure 2 and Figure 3. There are differences in the middle and upper atmosphere among the three resolutions, i.e., the intensity and the associated evolution of the 500 hPa subtropical high. Both the Lekima and Krosa are located in the south of the tropical western Pacific subtropical high, where the Lekima is located southwestward of the Krosa. The model flow shows that a low-pressure cyclone enters the Bohai Sea of China from the 6th of August, causing the deformation of the west edge of the subtropical high, with the west ridgeline gradually retreating eastward. The changes in the shape of the subtropical high vary by spatial resolution. The intensity and position of Krosa is modulated by the intensities of subtropical high, which may play a role in the relative strength of the binary typhoons. As the spatial resolution increases, the simulated intensity of the subtropical high decreases more slowly, causing the relative position of the Krosa towards further south. The strength of Krosa is the strongest in the 3 km resolution simulation (Figure 3).
The subtropical high is a planetary-scale circulation system, determining the balance of the planetary-scale circulation systems and even impacting on the structure of climate. However, the large-scale circulation is not entirely independent from the smaller-scale activities in the background circulation, due to the interactions of different scales. Compared to the simulations at coarser spatial resolutions with the cumulus convection parameterization turning on, the cloud-resolving simulations with 3 km resolution generate a more stable subtropical high, especially at its far west part, further affecting the position and moving speed of Krosa. Further, the typhoon path simulation of 3 km resolution is close to the observation (Figure 4).
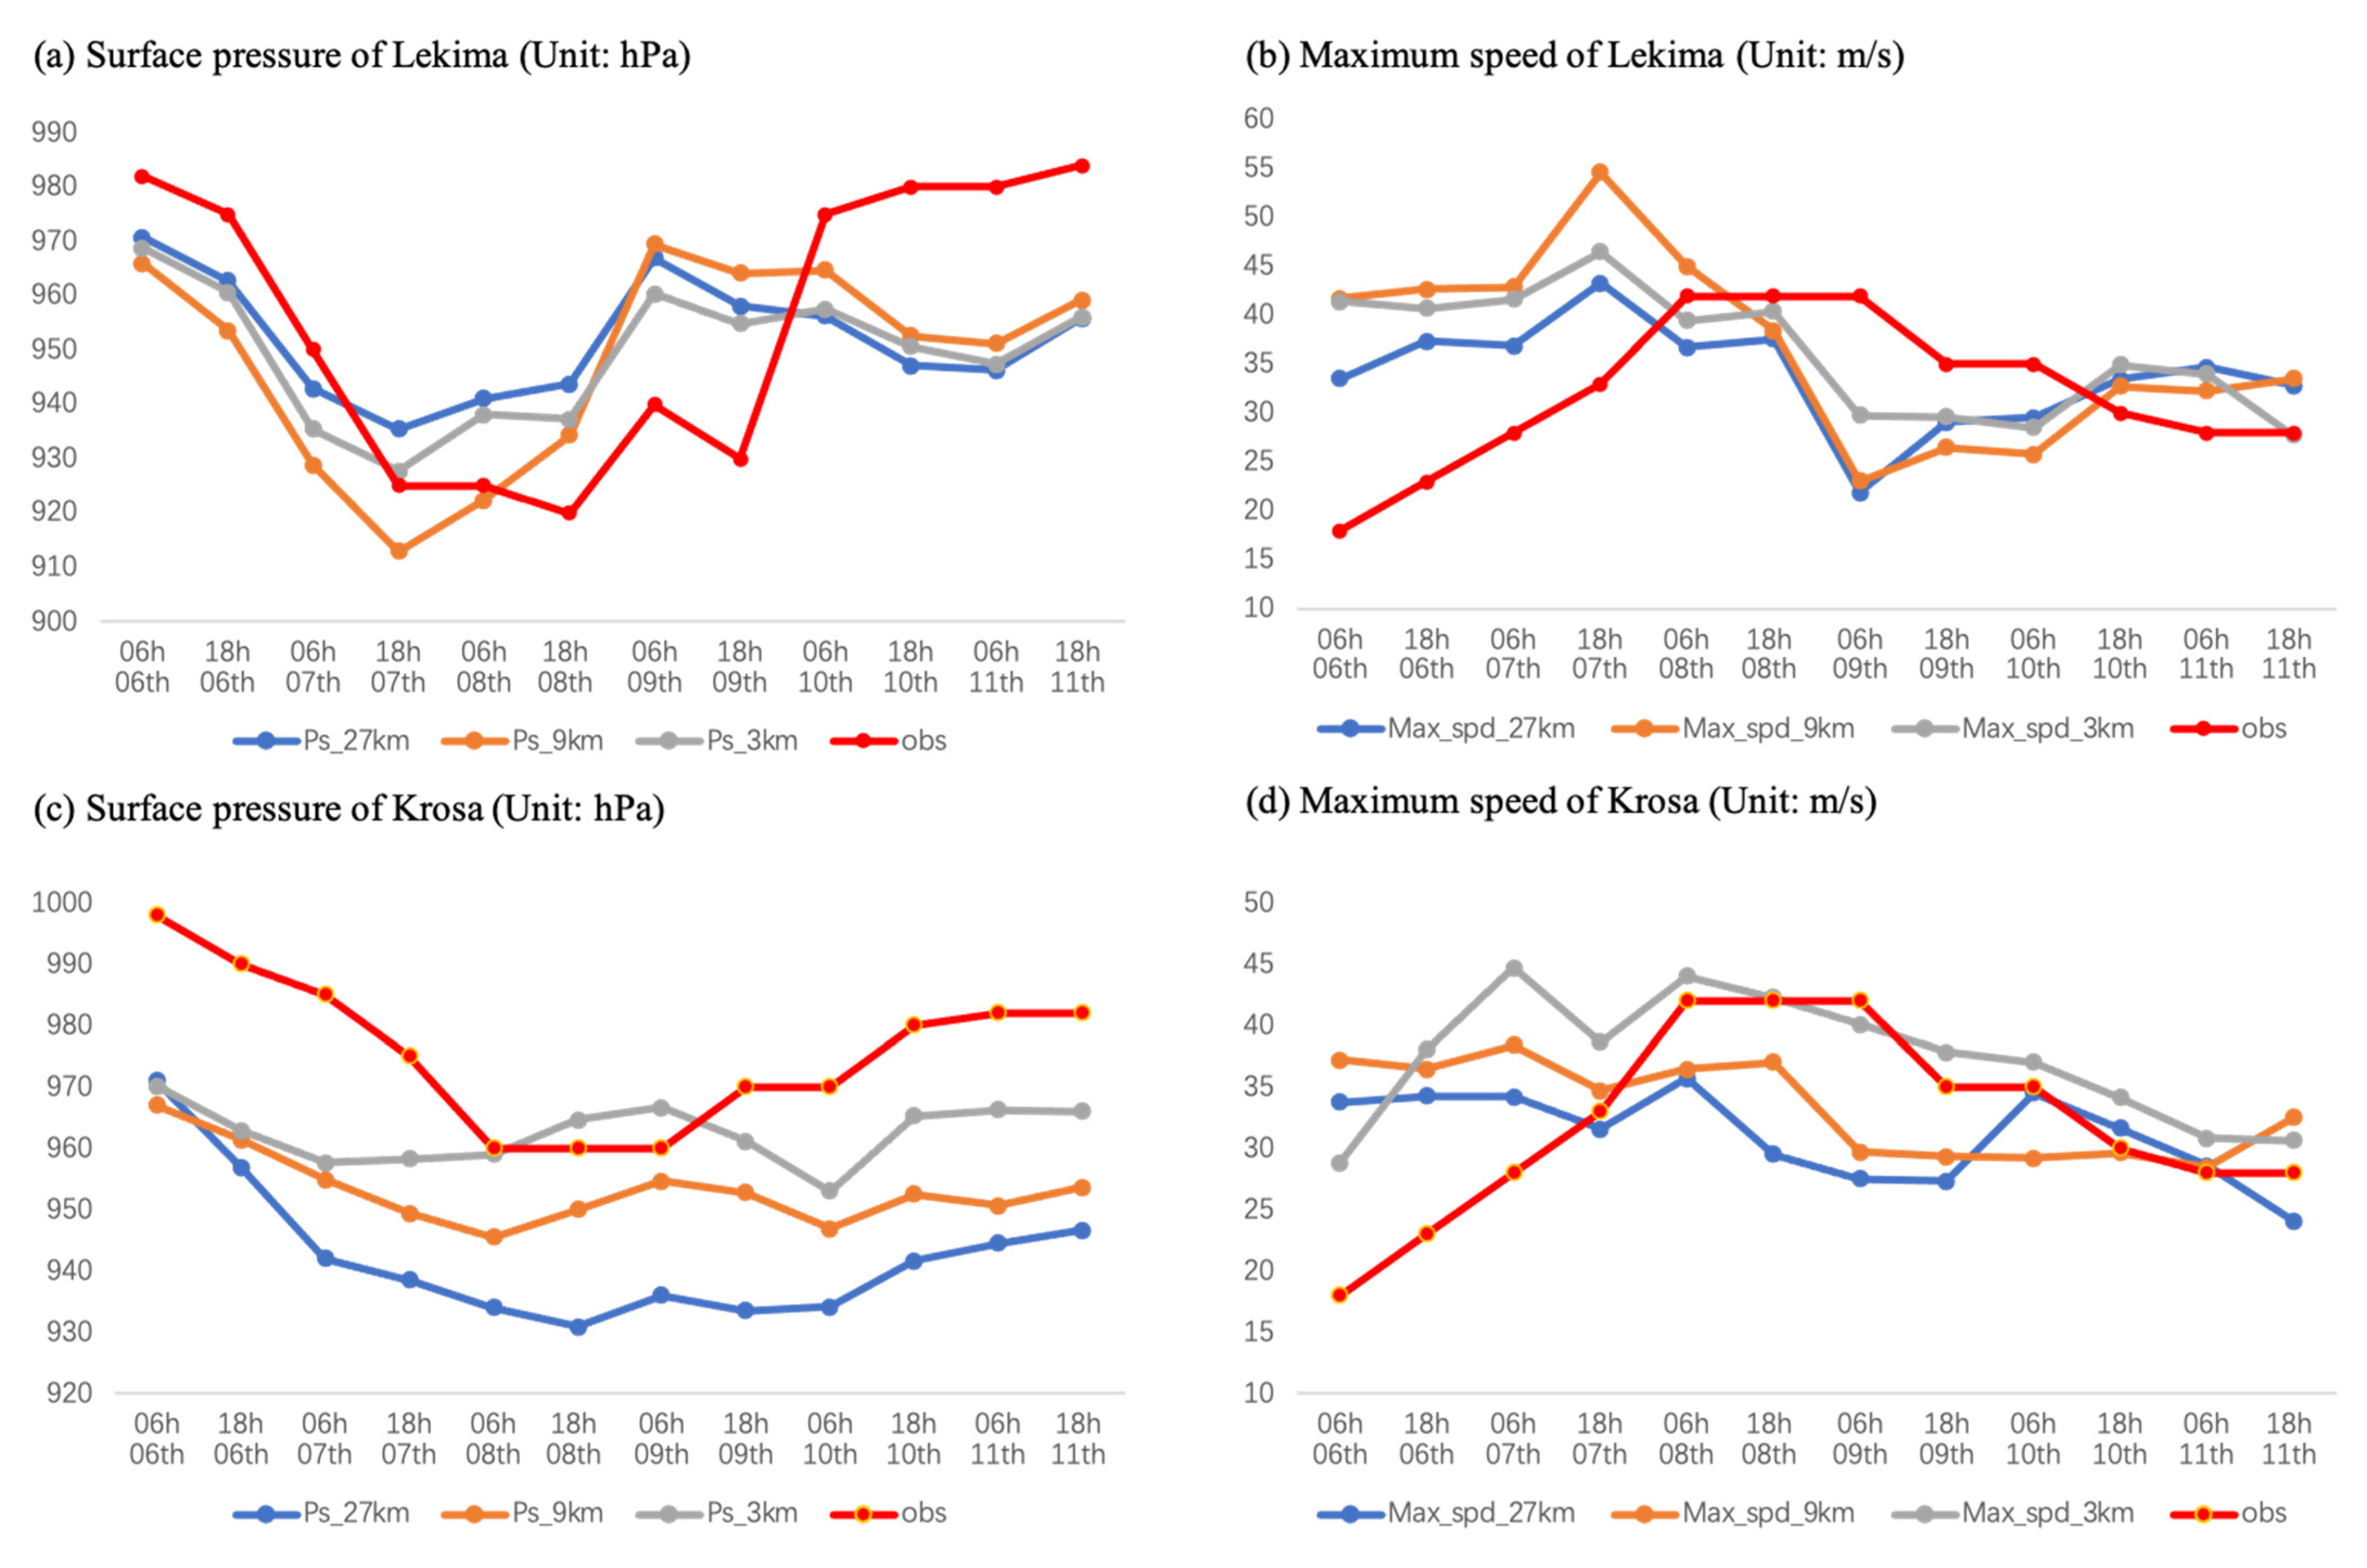
The intensity of the typhoons Lekima and Krosa simulated in three-resolution models and corresponding observations are shown in Figure 5. From the change of surface pressure at the typhoon center (Figure 5a,c) and maximum wind speed (Figure 5b,d), we can see that the higher the spatial resolution is, the closer to the observations the simulation results are. At the grid spacing of 3 km, the Lekima is stronger than the Krosa. When the grid spacing is 9 km, the relative strength of the Krosa becomes stronger than Lekima in the early stage, and weaker in the latter stage, whereas the opposite is true when the resolution is set as 27 km (Figure 5a,c). In the early days, the maximum wind speeds simulated by the models were larger than the observations, but the results of 3 km resolution model are closer to observation relatively. Although the simulation results are still not accurate compared to the observed data, we can see that all three-resolution models accurately simulate typhoon generation, and the higher resolution models simulate more accurate intensity and typhoon tracks (Figure 4 and Figure 5).

5. MPV Analysis

5.1. Analysis of MPV as Convective Instability Energy

To examine the behavior of the first type of moist potential vorticity (MPV1), representing the large scale environmental convective instability, the horizontal distributions of MPV1 over 700 hPa at 06:00 BJT during August 6th to 11th were displayed under three spatial resolutions of 27 km, 9 km, and 3 km in Figure 1, Figure 2 and Figure 3, respectively. The spatial distributions revealed that in the large-scale background, relatively stable conditions concomitant with positive MPV1 were in the northern flank of the binary typhoon systems, whereas the southern flank was towards the convective unstable conditions with warm and humid air, as well as negative MPV1. It implied that the transport of water vapor from the southern warm ocean was the important environmental source of external instability convective energy for the binary typhoon system. The south of Krosa was full of vast ocean surface areas where warm water vapor can continuously be pushed into the Krosa, thereby enhancing the convective instability energy. The simulations with all three resolutions imply a strikingly negative band over the peripheral MPV1 of Krosa. Along with the increase of spatial resolution, the eastward retreatment of the subtropical high became slower, inducing a slower movement of Krosa and more enhanced absorption of warm and humid air from the environment, making the Krosa stronger. Meanwhile, the Lekima was located further north relative to the Krosa in high-resolution modeling (Figure 4). From the perspective of topographical conditions, considering the southwest coastline of China, the west side of Lekima was over Taiwan, China, where the land topography inevitably affected the source of water vapor transported from the ocean to the interior of Lekima. In contrast, the Krosa was located southeastward, where rich warm and humid air conditions were prone to trigger larger energy absorption.
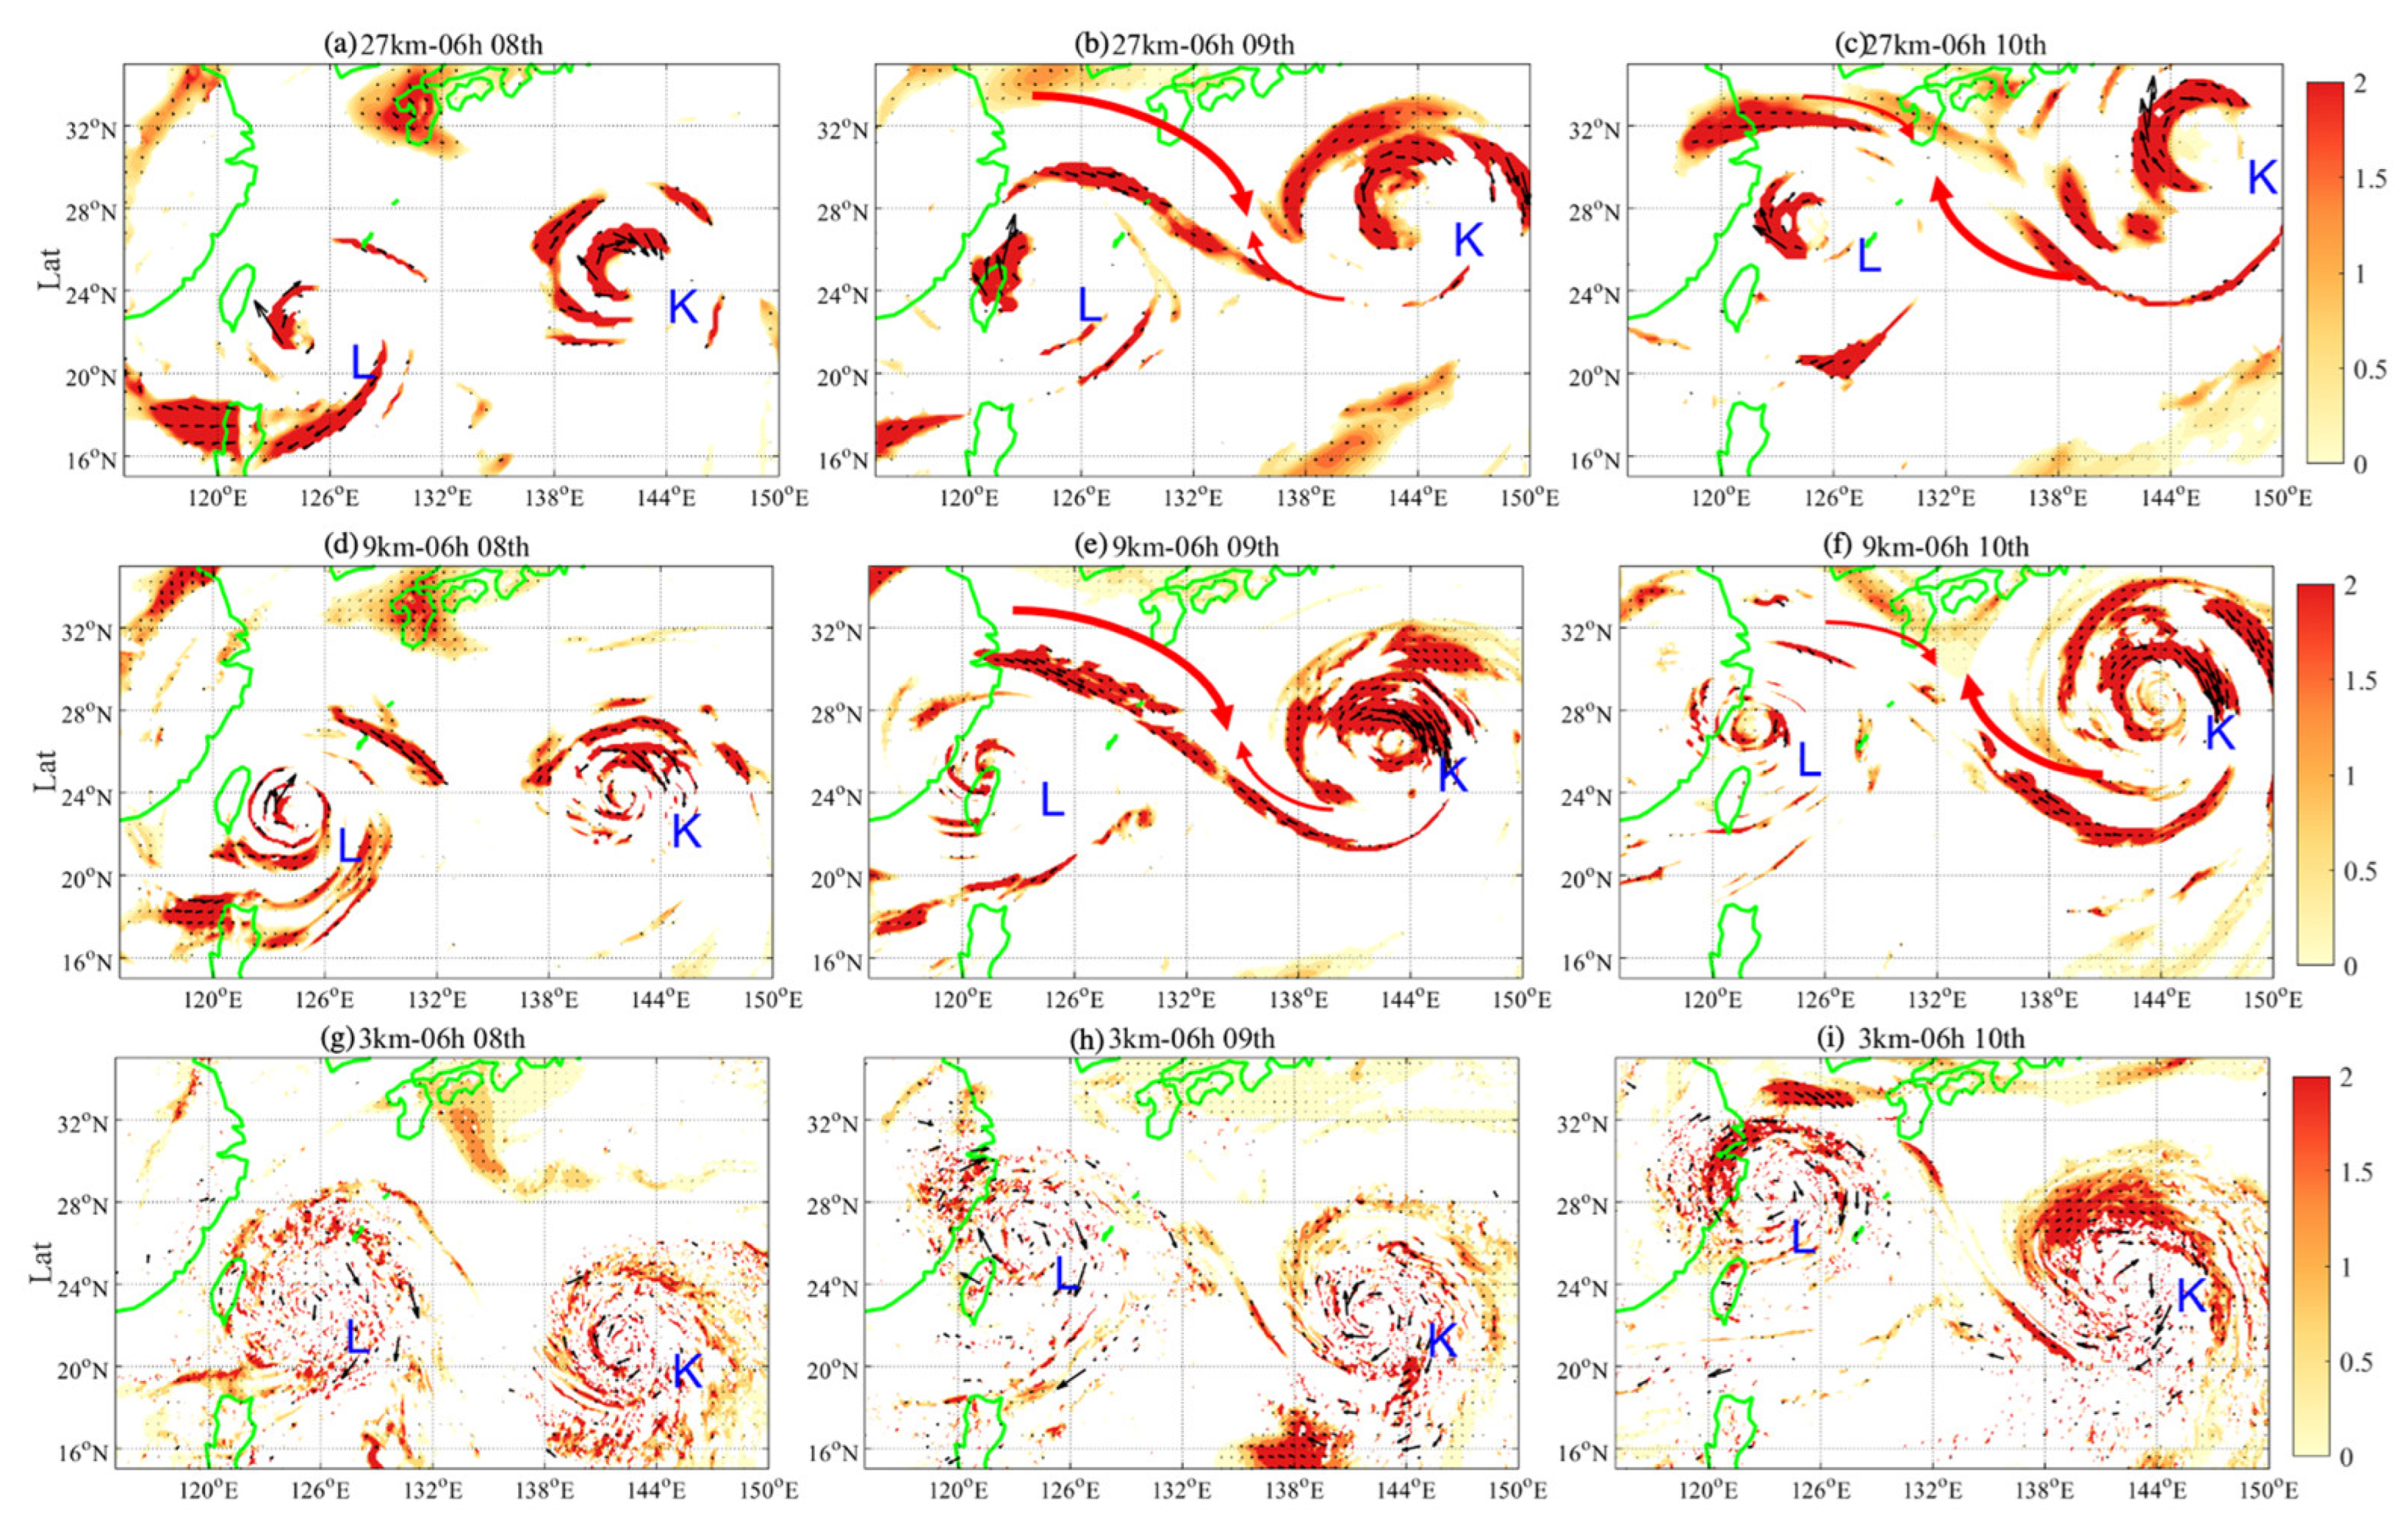
In the simulations with the resolutions of 27 km and 9 km, there were a lot of warm and humid water vapors being conveyed into the Krosa from the southern areas where the values of MPV1 were negative (relatively unstable). The convective instability energy distributed around individual typhoon systems appeared an asymmetric structure (see Figure 1 and Figure 2). The Krosa started to strengthen on the 9th, primarily caused by the injection of the convective instability energy in the south. The transferring belt between the Lekima and Krosa was then established. Figure 6 shows the flux of the negative MPV1 between Lekima and Krosa. The convective instability energy flow around an individual typhoon was clockwise. In the simulations of 27 km and 9 km resolution models on the 8 and 9 August, at the intersection between the MPV1 fluxes of the two typhoons (marked by red arrows in upper and middle panels of Figure 6), the instability energy moved from the strong Lekima to the weak Krosa. From the 10th on, the Krosa became stronger than the Lekima, and instability energy transferred inversely from Krosa to Lekima.
Unlike the 27 km and 9 km resolution cases, which showed a strong asymmetric structure around a typhoon, the finer (3 km) resolution simulation displayed a more “uniform” convective instability energy shaped as spiral clouds around individual typhoon systems (lower panels of Figure 6). Such the typhoon spiral cloud system is closer to typical satellite-observed typhoon cloud structure (see Figure 7). In the early period of the 6th–9th, the Lekima in the 3 km-resolution simulations exhibited a stronger capability of acquiring the convective instability energy from the environment than that from the other two coarser resolutions, though the energy transferring between two typhoons became weaker after the 9th in the 3 km (see color shaded in Figure 6).
The differences of MPV structures among simulations at the three resolutions may be attributable to the differences in convection schemes. For instance, the simulations at 27 km and 9 km grid spacings applied the cumulus convection parameterization scheme, which characterized the fluid flows with grid-scale information, while at 3 km resolved the cloud structure by directly computing the budget of cloud-associated quantities. Compared with the satellite-observed positions of typhoon centers (green asterisks in Figure 1, Figure 2 and Figure 3 and Figure 4), it was clear that the finer resolution simulation at 3 km yielded the closest track to the Lekima and Krosa, as well as the Radar, Echo image best fitting to the satellite-observed cloud structure (compare Figure 7a–f to Figure 7g,h). Moreover, although the simulations at all three resolutions capture well the spiral cloud structure of typhoons, only those at the 3 km resolution can reproduce the floccose structure at the tail of spiral clouds (compare Figure 7e,f to Figure 7g,h). It seemed that the feedback effect of such detailed structures of typhoon clouds to the background environment was helpful to simulate the background-typhoon system more realistically, although the detailed subsequent impact on the typhoon intensity and track still needs further studies.
In summary, in a binary typhoon system, except for main external sources of convective instability energy from the environment, there was energy conveying between the binary typhoons, i.e., one typhoon absorbing energy from the other through the spiral effect at their periphery (Figure 6). In this process, the convective instability energy could be transferred by the conveying belt. Our experiments showed that accurate simulation on such binary interaction could help capture the relative intensity and track of typhoons, although the driving force of such energy transferring is still unclear.

5.2. Baroclinic Diagnosis of MPV

The MPV2 represents the contribution of moist baroclinic instability of the atmosphere to the moist potential vorticity. A large negative value of MPV2 indicates a strong baroclinic instability of the atmosphere over the area. The time evolution of MPV2 distributions at 700 hPa at three-resolution simulations is displayed in Figure 8 and Figure 9. In the 27 km resolution simulation, the MPV2 horizontal structure is similar to that of MPV1. The baroclinic instability distribution within the binary typhoon system has an asymmetric spiral structure, and around the individual typhoon, the east side is stronger than the west side. During the developing of typhoons, the baroclinic instability is strong, and it becomes weaker during the weakening phase, and the asymmetric structure gradually vanishes. However, from the 8th to 9th, there exists strong baroclinic instability energy transferring from the Lekima to Krosa (see Figure 8), shared by the 9 km resolution simulation (Figure 9a,b). Similar to the characteristics of convective instability energy, the baroclinicity instability distribution in the 3 km resolution simulations appears more “uniform” around the individual typhoon. Generally, the cloud-resolving scheme enhances the capability of individual typhoons retrieving energy from the environment and weakens the continuous energy transferring between binary typhoons (compare Figure 9c,d to Figure 9a,b).
It is obvious that the MPV conveying belt not only transports convective instability energy between the binary typhoons but also modulates the relative strength of baroclinic instability of the two typhoons. Unlike the source of MPV1-represented convective instability energy mainly from the environment and transferrable between binary typhoons, our results showed that the changes of MPV2-represented baroclinicity only was completed through internal transferring processes between binary typhoons and occurred mainly in the lower atmosphere. When the results of 3 km resolution simulation were compared to the results of 9 km or 27 km resolutions (compare Figure 9c,d to Figure 9a,b and Figure 8), we can see the higher the model resolution was, the weaker the baroclinic instability energy transferring between the binary typhoons. Given that the 3 km resolution simulation exhibited the best fitting to the satellite-observed cloud distribution (see Figure 7), it was worth further investigating the overestimation of the parameterized cloud scheme on the interaction of binary typhoons and its influences on the typhoon structure and intensity in the future studies.

5.3. Analysis of Vertical Structures of Wet Potential Temperature

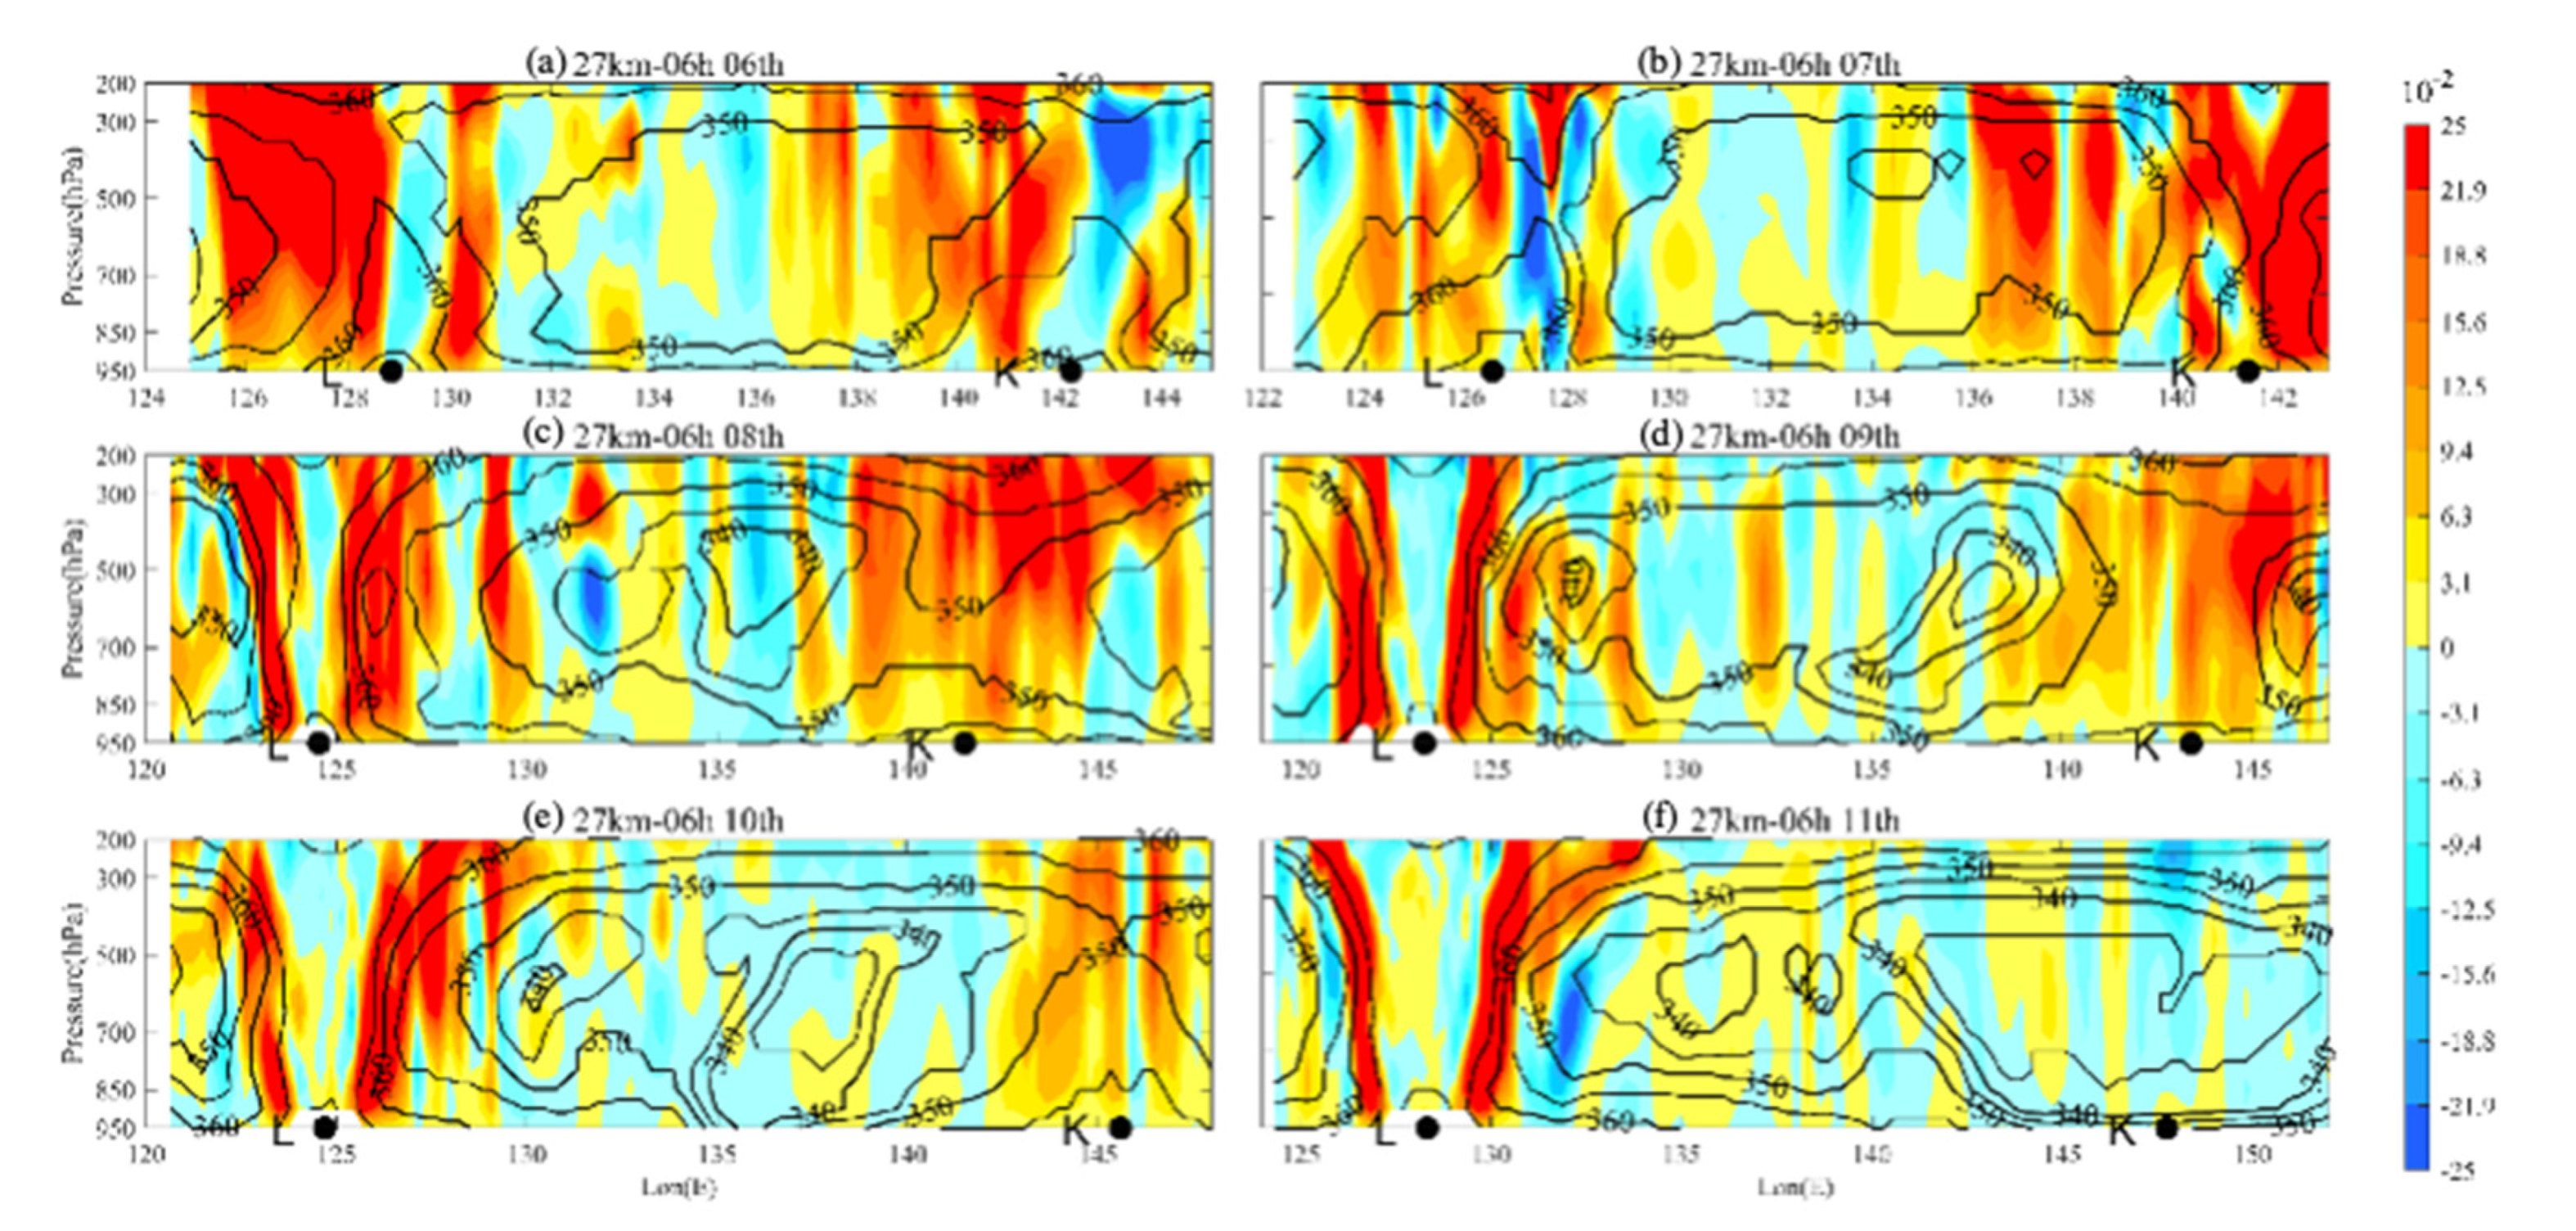
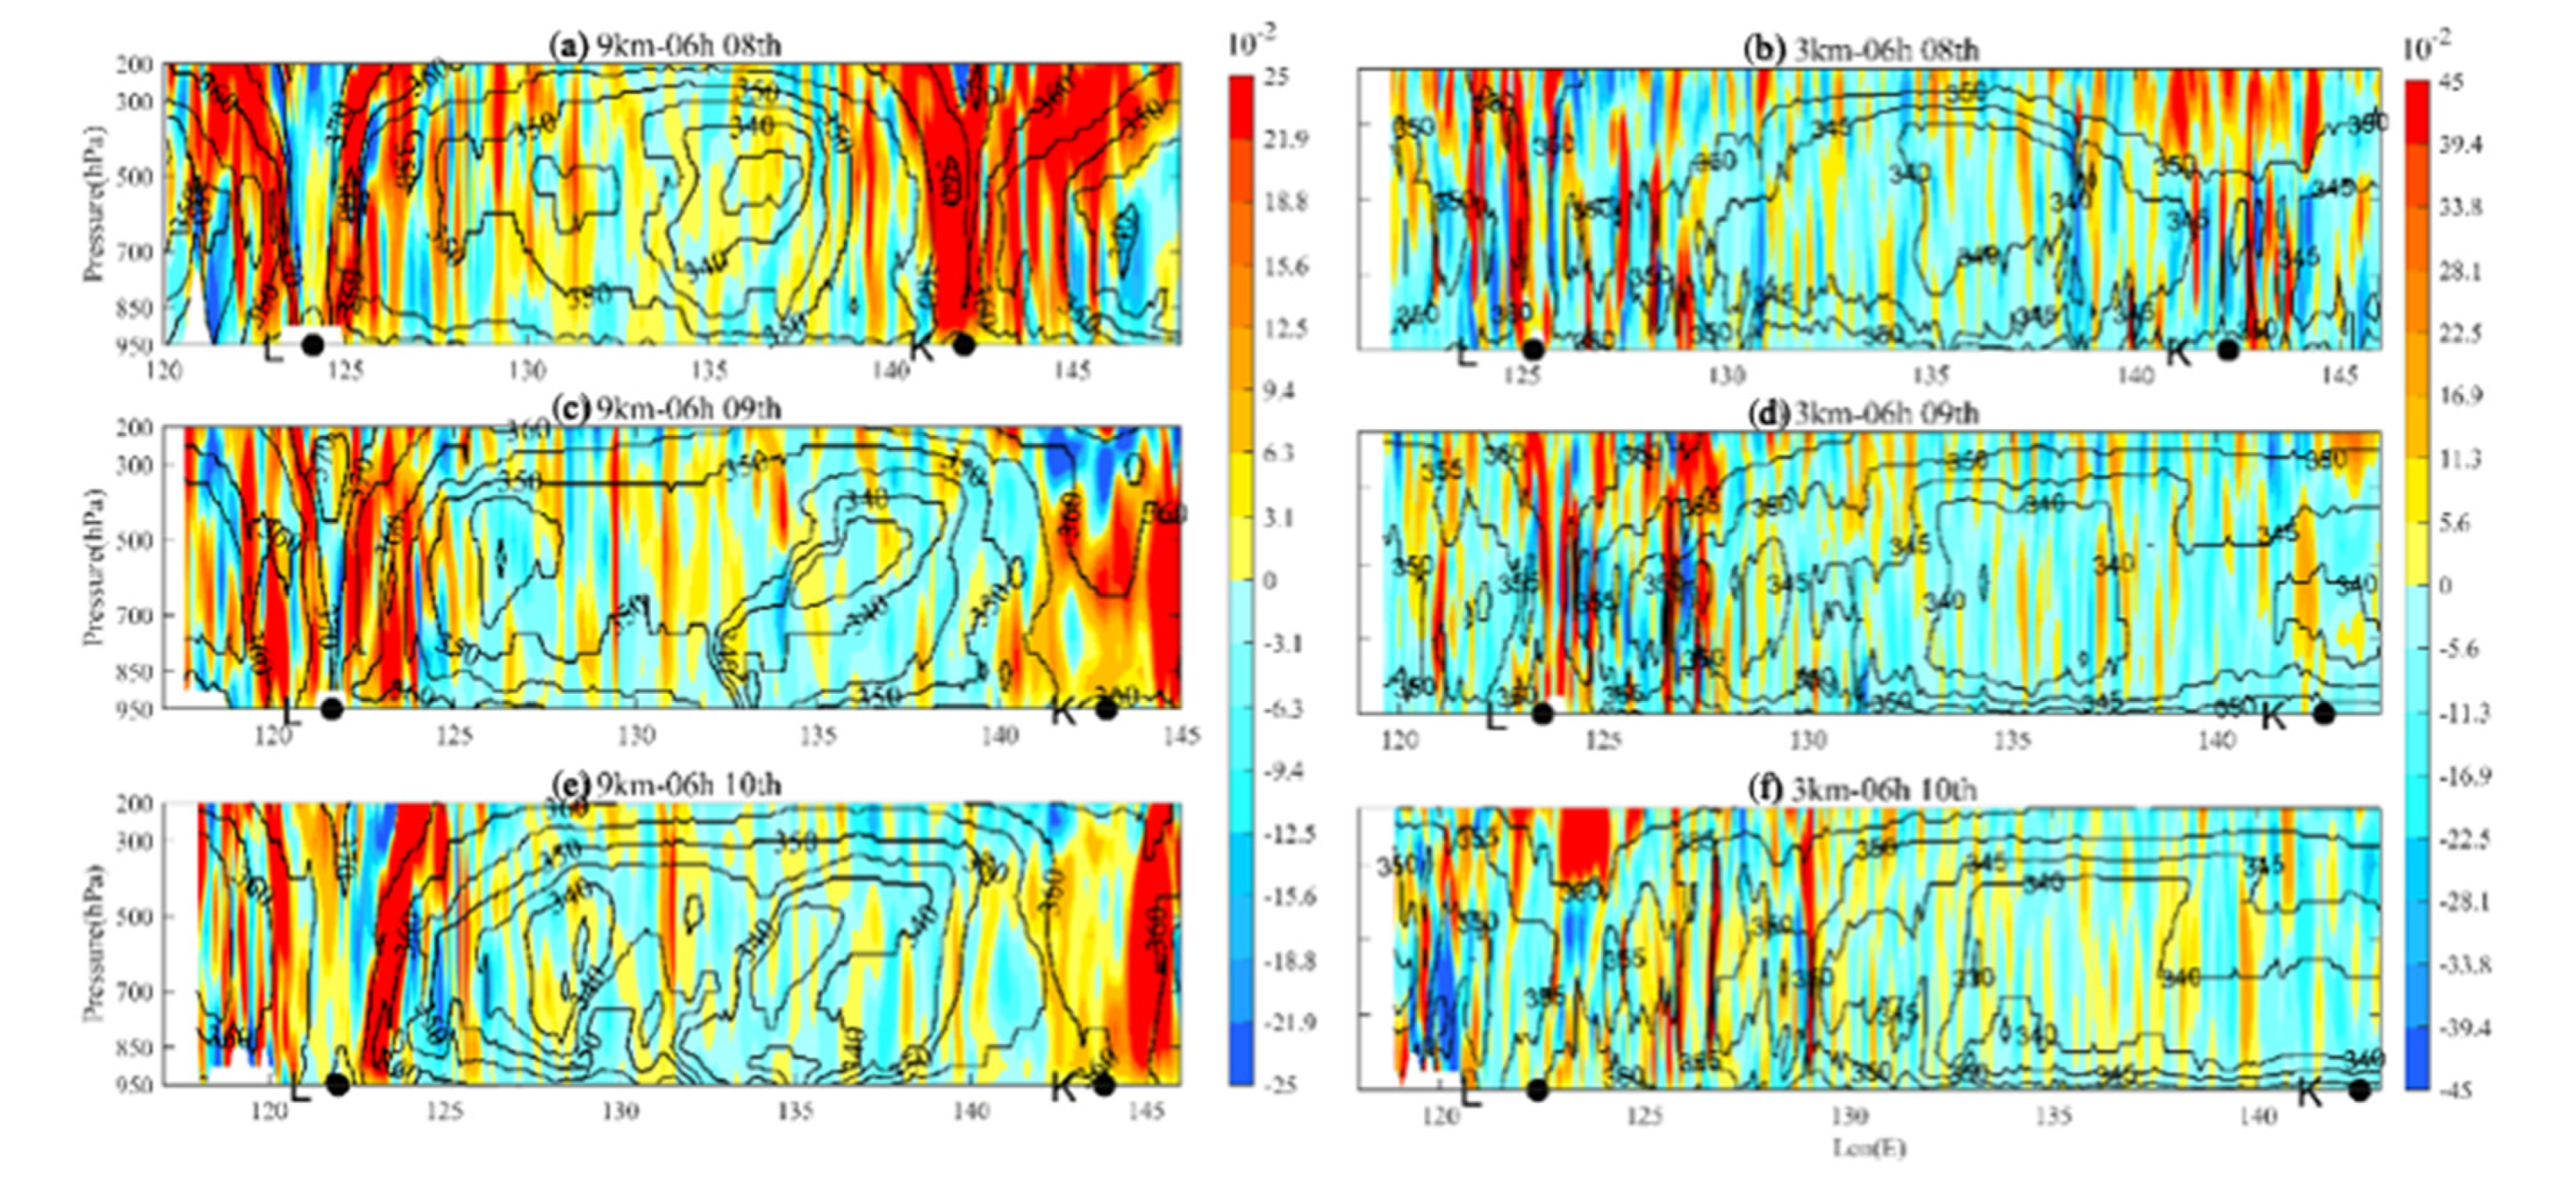
The distribution of wet potential temperature ( θ e ) may reflect the motions of moist air. In the discussions above, we analyzed the characteristics of MPV in the binary typhoon system at the low atmosphere. To display a three-dimensional picture, we further examine the vertical structure of wet potential temperature to examine the vertical energy transferring. Vertical structures of θ e and vertical velocities simulated by the three-resolution models from the 6th to 11th, 2019 are shown in Figure 10 and Figure 11. At each time, the vertical structure is shown in the p-longitude vertical section crossing the Lekima typhoon center.
The vertical structure of θ e   clearly shows the structure of the typhoon cloud wall at the typhoon center. The typhoon centers are always located in the middle of the steepest isentropic surfaces ( θ e curves), which appear nearly orthogonal to the surface, showing strong baroclinicity. The convective motions in the models with 27 km and 9 km resolutions show strong asymmetry at both sides of typhoon centers (see Figure 10 and Figure 11a,c,e), where the stronger ascending motions occurred at the left-hand side from the 6th to 8th. After the 9th, with the establishment of the MPV conveying belt in the binary typhoon system, instability energy started to transfer between the Krosa and Lekima, reducing the difference of instability energy on both sides of the typhoon center, and the convective activities and baroclinicity of atmosphere on the right-hand side gradually increased, forming dense θ e lines on the right-hand side of the typhoon center. The instability energy of Lekima originated mainly from the low atmosphere, where the main source of water vapor exhibited a strong release of latent heat condensation. As time forwarding, by absorbing the warm and humid air from the ocean, the gradient of θ e below 700 hPa increased, resulting in increased convective instability energy. With simulations at 3 km resolution without cumulus convection parameterization, the internal instability energy distribution around the typhoon center was more uniform (see Figure 11b,d,f). The cloud-resolving physics showed small horizontal scale convection activities characterized by strong vertical penetration.
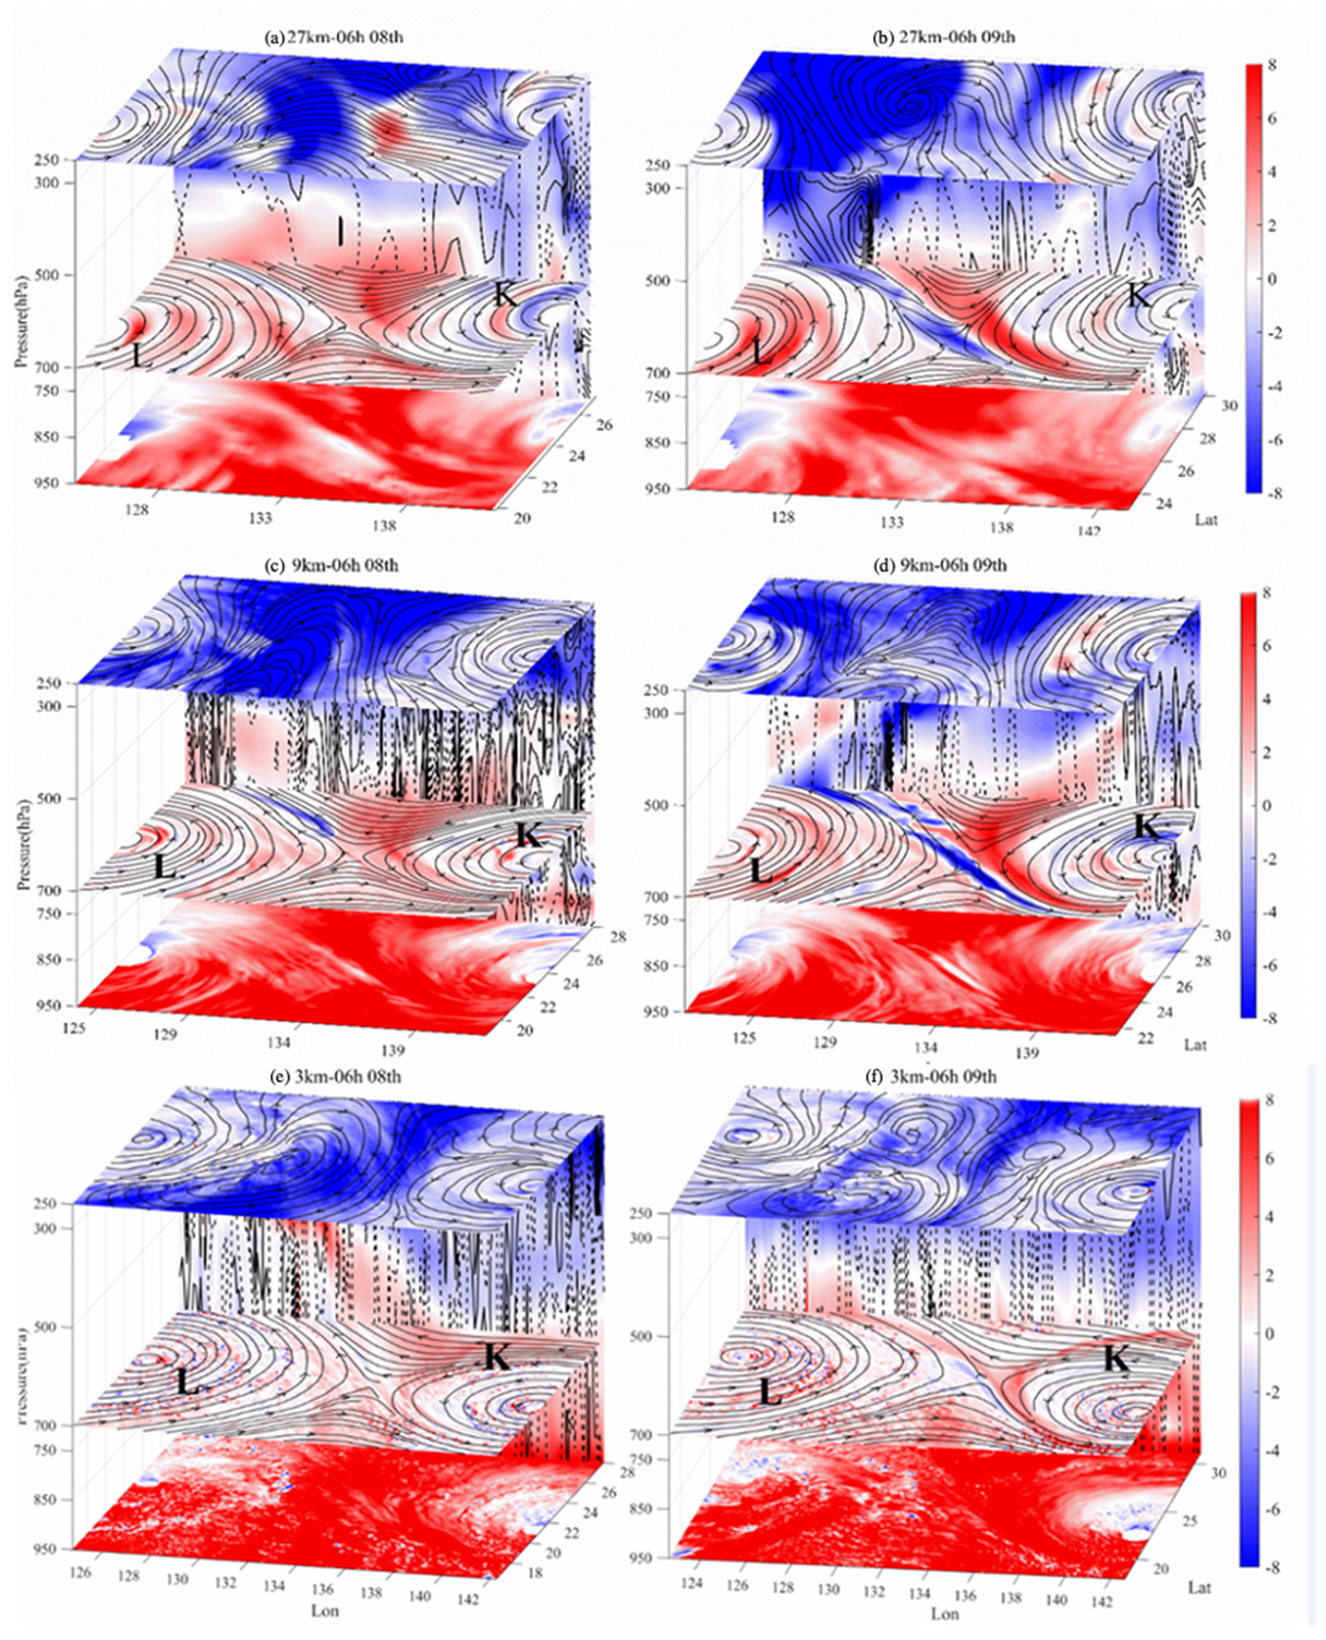
Figure 12 summarizes the three-dimensional (3D) structure of the MPV simulated at the three resolutions, with the corresponding vertical velocity distribution along the latitude of two degrees north of the Lekima typhoon center. Consistent with the horizontal distribution of MPV and the vertical distribution of θ e analyzed before, the 3D structure showed that there is a connection between the two typhoons of the binary system in the whole troposphere by an MPV conveying belt, particularly strong above 700 hPa. This can be comprehended as relatively large-scale convection instability associated with water vapor transport occurring at the lower troposphere, while the subsequent baroclinicity instability occurred commonly at the low-middle, even middle-high, troposphere, where the strongest typhoon wall typically was observed. The previous analysis on the vertical structure of the typhoon wet potential temperature showed that the convection of the Lekima was concomitant with strong penetrating, which may even extend to the upper troposphere. It absorbed water vapor from the surface ocean to obtain energy, causing the air masses in the middle and lower layers to be more moist with higher humidity, where the low-level MPV transported upward, through the internal transferring effect of the typhoon. The vertical distributions of vertical velocities showed that the transferring belt between the two typhoons is the combined effect of the upper and lower atmospheres, where convective energy can be transported among layers in different altitudes through vertical motions. The high-level flow field showed that the transport from the high-level to the low-level was affected by the high-level high-pressure system. The 3D MPV conveying was a combination of high-level flow field and low-level water vapor transport. When the spatial resolution was enhanced, the 3D MPV structure inside the typhoon was improved so that the description on the thermodynamical characteristics of the atmosphere associated with typhoon movement and intensity was more realistic.
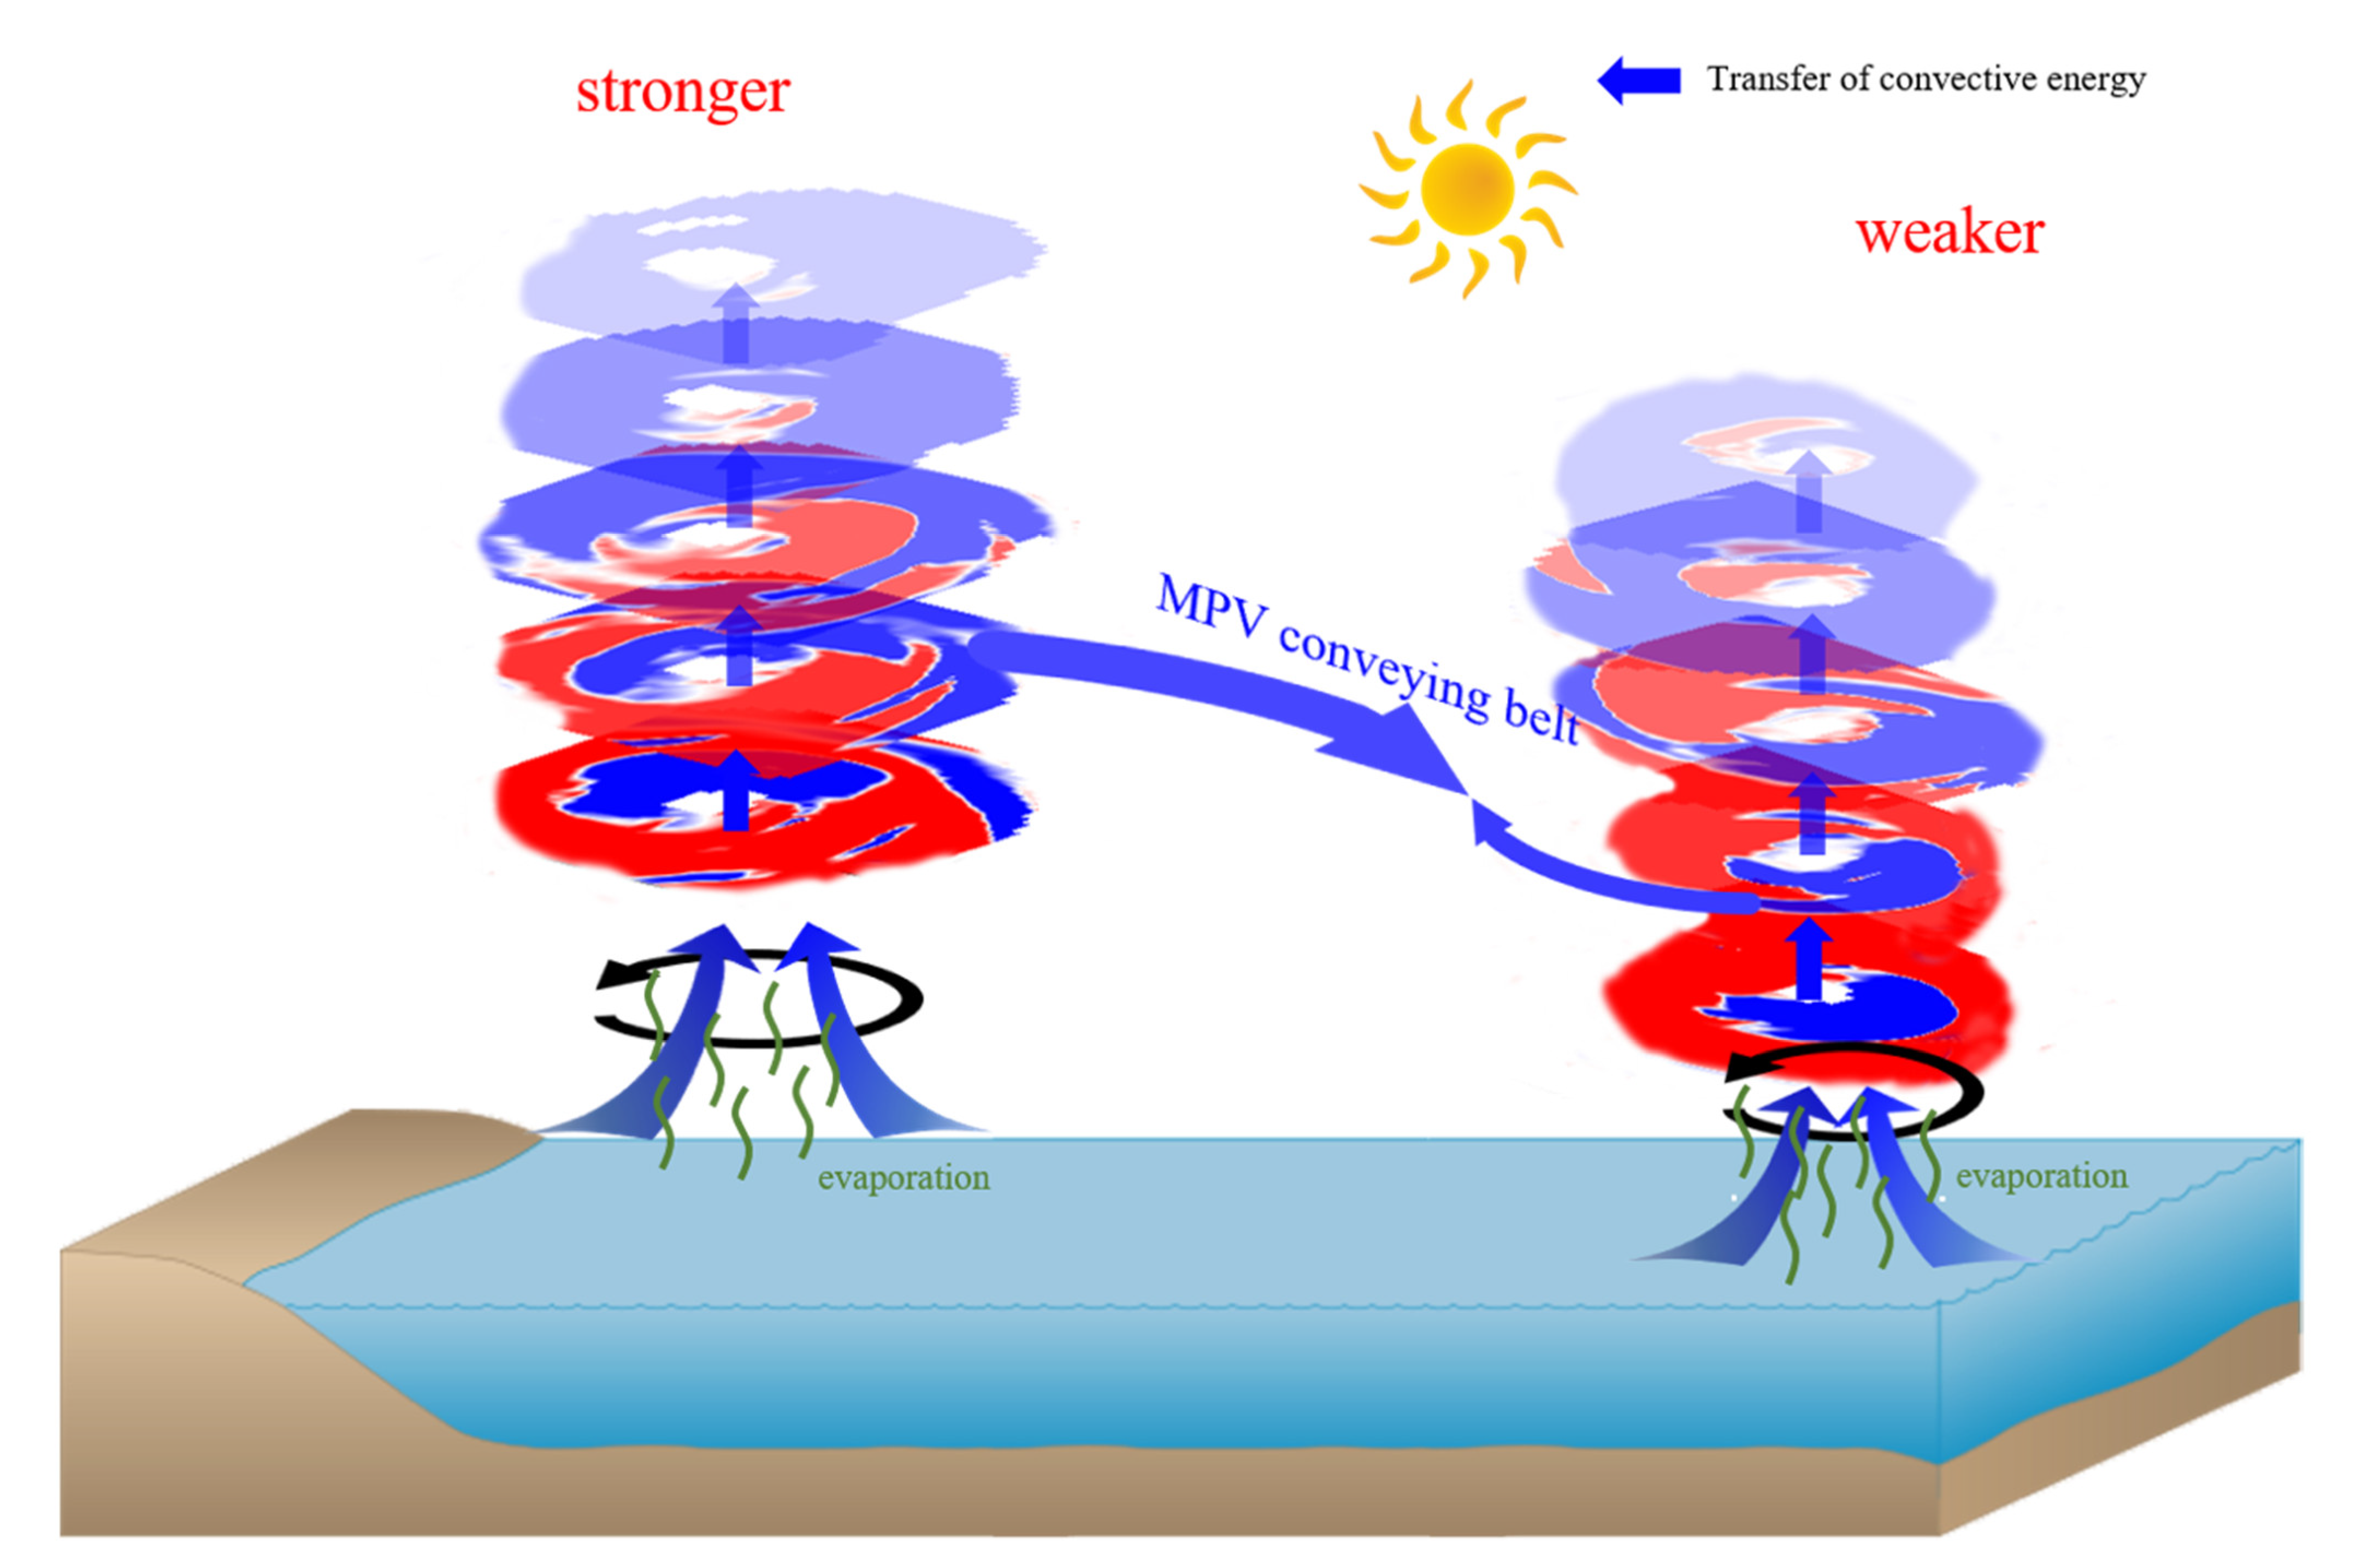
Finally, as a summary of analyses above, we plot a conceptual model in Figure 13. There exist two major external sources of convective instability energy for the binary typhoon system. One is the injection of water vapor from the warm ocean surface (lower part of Figure 13), the other is the instability energy transferred from the strong one to the weak one of the binary typhoons, exchanging the atmospheric baroclinicity between the two typhoons in the binary system (middle part of Figure 13).

6. Discussion

One of the limitations of this study is that only one case is applied. In this case, the distance between binary typhoons is very close, so the energy transferring belt between the binary typhoons can be identified. To apply this study to actual operational forecasts in the future, more cases need to be examined. In addition, the MPV studies in the binary typhoon system shall be extended to more general cases, including three or more typhoon systems. In this way, a better theoretical basis for advancing our understanding of the mechanisms of typhoon formation, movement, and intensification can be established to enhance the accuracy of typhoon forecasting.
Generally, typhoons are the result of air-sea interactions. MPV is a composite quantity that combines dynamics and thermodynamics properties of the atmosphere, both of which govern the behavior of the compressible fluid. Therefore, the diagnostic analysis of MPV could be an excellent tool to understand the formation, movement, and intensification of typhoons. Particularly, typhoon genesis involves a complex configuration of atmosphere and surface ocean conditions (e.g., [32]). It is difficult to identify the conditions of typhoon genesis from the single side of atmosphere or ocean-alone conditions. For monthly-scale extended-range predictions, developing a new comprehensive MPV-like quantity is very interesting and promising, which includes the composite properties of the atmosphere and upper ocean cross the air-sea interface as the precursor of typhoon genesis in a high-resolution coupled prediction system. In addition, in a view of coupled data assimilation, at the air-sea interface, due to different time scales between the atmosphere and ocean, it is very difficult to directly assimilate atmosphere (ocean) observations into the ocean (atmosphere) using cross-covariance between the atmosphere and ocean. Developing a new coupled data assimilation scheme in an MPV-like space may be a good idea to pursue more balanced and coherent incorporation of coupled models and measured data, and improve the initialization of high-resolution coupled models, which could be an important research topic in the future.

7. Summary

Based on the simulations of WRF model at three-resolutions (27 km, 9 km, and 3 km), this study analyzes the behavior of moist potential vorticity (MPV) of a binary typhoon system, consisting of typhoons Lekima and Krosa (2019). The results established the following findings:
(1)
The Krosa can greatly affect the west ridgeline of the West Pacific subtropical high and thus exert a great impact on the track of Lekima, critically determining its turning point toward the northeast. Since simulations at different spatial resolutions perform differently in the accuracy of reproducing the interaction between the Krosa and subtropical high, the finer resolution model has a much higher forecast skill on the track of Lekima.
(2)
The simulated instability energy appears as an asymmetric structure around a typhoon center at 27 km and 9 km resolution simulations, consisting of prominent parameterization characteristics, such as the entrainment of large-scale convective instability energy from the environment in the south. The 3 km resolution model simulates a more uniform and realistic instability energy distribution inside a typhoon system.
(3)
There exist an MPV conveying belt in the binary typhoon system at the middle-low atmosphere, which transfers the instability energy and exchanges the atmospheric baroclinicity between the binary typhoons.
The vertical structure of the typhoon wet potential temperature shows that the high-energy convective instability concentrates between two centers of high wet potential temperature, where the isentropic surfaces appear nearly orthogonal to isobaric surfaces, representing the strong baroclinic region. While the simulations with cumulus parameterization indicate large-scale vertical motions, the results with the cloud-resolving scale show small horizontal scale convection activities accompanied by strong vertical penetration. The three-dimensional spatial distributions of MPV simulated at three spatial resolutions show that results at the finer resolution yield more accurate structures of typhoon interior and improved track of typhoon. Particularly, the finer resolution at 3 km can reproduce the floccose structure at the tail of spiral clouds. Further studies are required to clarify the feedbacks of more accurate details of typhoon interior structure and the background field so that both typhoon track and intensity forecasts can be improved.

Author Contributions

Conceptualization, S.Z.; methodology, S.Z. and G.W.: software, J.Y and S.R.; validation, G.W. and C.S.; investigation, J.Y. and S.R.; writing-original draft preparation, J.Y. and S.R.; writing-review draft preparation, S.Z., G.W., C.S., H.Z., X.Y., M.L. and Y.G. All authors have read and agreed to the published version of the manuscript.

Funding

This research is supported by the National Natural Science Foundation of China (Grant No. 41830964, 41775100), as well as the Shandong Province’s “Taishan” Scientist Project (ts201712017) and Qingdao “Creative and Initiative” frontier Scientist Program (19-3-2-7-zhc). This research is also supported by the Center for High-Performance Computing and System Simulation, Pilot National Laboratory for Marine Science and Technology (Qingdao).

Institutional Review Board Statement

Not applicable.

Informed Consent Statement

Not applicable.

Data Availability Statement

Not applicable.

Acknowledgments

The authors are grateful to the three anonymous reviewers who provide insightful and constructive comments that helped to improve this manuscript.

Conflicts of Interest

The authors declare no conflict of interest.

References

  1. Riehl, H. On the formation of typhoons. J. Meteorol. 1948, 5, 247–264. [Google Scholar] [CrossRef] [Green Version]
  2. Bjerknes, J.; Holmboe, J. On the Theory of Cyclones. J. Atmos. Sci. 1944, 1, 1–22. [Google Scholar] [CrossRef] [Green Version]
  3. Wu, G.; Cai, Y.P.; Tang, X.J. Moist potential vorticity and slantwise vorticity development. Acta Meteorol. Sin. 1995, 53, 387–405. [Google Scholar]
  4. Liu, H.; Zhang, S. Moist potential vorticity and the three-dimensional structure of a cold front with heavy rainfall. J. Appl. Meteorol. Sci. 1996, 7, 275–284. [Google Scholar]
  5. Wu, G.; Cai, Y. Vertical Wind Shear and Down-sliding Slantwise Vorticity Development. Chin. J. Atmos. Sci. 1997, 21, 273–282. [Google Scholar]
  6. Yu, H.; Wu, G. Moist Baroclinity and Abrupt Intensity Change of Tropical Cyclone. Acta Meteorol. Sin. 2001, 59, 440–449. [Google Scholar]
  7. Schubert, W.; Hausman, S.; Garcia, M.; Ooyama, K.; Kuo, H. Potential Vorticity in a Moist Atmosphere. J. Atmos. Sci. 2001, 58, 3148–3157. [Google Scholar] [CrossRef]
  8. Wang, X.; Wu, K.; Shi, C. The Introduction of the Condensation Probability Function and the Dynamic Equations on Non-uniform Saturated Moist Air. J. Trop. Meteorol. 1999, 15, 64–70. [Google Scholar]
  9. Gao, S.; Cui, C. Generalized Moist Potential Vorticity Theory and Its Application Research. Torrential Rain Disasters 2007, 26, 3–8. [Google Scholar]
  10. Zhou, Y. Application of Generalized Moist Potential Vorticity to Analysis and Forecast of the Torrential Rain over the Changjiang-Huaihe River Basin. Chin. J. Atmos. Sci. 2009, 33, 1101–1110. [Google Scholar] [CrossRef]
  11. Gao, S.; Lei, T. Moist Potential Vorticity Anomaly with Heat and Mass Forcings in Torrential Rain Systems. Chin. Phys. Lett. 2002, 19, 878–880. [Google Scholar]
  12. Deng, G.; Gao, S. The Theory of Moist Potential Vorticity and Its Application in the Diagnosis of Typhoon Rainfall and Intensity. J. Trop. Meteorol. 2009, 15, 204–209. [Google Scholar]
  13. Cho, H.-R.U.; Cao, Z. Generation of Moist Potential Vorticity in Extratropical Cyclones. Part II: Sensitivity to Moisture Distribution. J. Atmos. Sci. 1998, 55, 595–610. [Google Scholar] [CrossRef]
  14. Han, F.; Chu, K.; Tan, Z.; Zhang, Y.; Liu, H. The Adoint-derived Sensitivity Analysis of the Motion and Intensity of the Binary Typhoons: Mawar (2005) and Guchol (2005). Chin. J. Geophys. 2019, 62, 3247–3258. [Google Scholar]
  15. Wang, H.; Ma, F.; Wang, W.; Peng, J. Application of Moist Potential Vorticity Analysis in Heavy Rain Forecast in Northeast Hebei Province. Arid Meteorol. 2008, 26, 86–90. [Google Scholar]
  16. Pan, Y.; Wang, T.; Tan, Y.; Peng, D.; Zhao, J. Application of Moist Potential Vorticity and Vertical Helicity in Numerical Forecast of Heavy Rain. Meteorological. Meteorol. Mar. Instrum. 2012, 29, 47–53. [Google Scholar]
  17. Shen, X. Analysis of Moist Potential Vorticity of Typhoon Haitang Rain Storm. Bull. Sci. Technol. 2007, 23, 180–186. [Google Scholar]
  18. Lai, S.; He, F.; Zhao, R.; Shen, T.; Wu, Q. The Diagnostic Analysis of “Longwang” Typhoon. Sci. Meteorol. Sin. 2007, 27, 266–271. [Google Scholar]
  19. Liu, F.; Ding, Z.; Liang, Y.; Zheng, H.; Huang, X. Evolution Characteristics of Moist Potential Vorticity in the Rainstorm Caused by “Morakot” Typhoon. Torrential Rain Disasters 2011, 30, 161–166. [Google Scholar]
  20. Cao, C.; Wang, Z.; Liu, F.; Liang, Y. Diagnostic Analysis of Moist Potential Vorticity for Heavy Rain Caused by “Fitow” (2013) Typhoon. Meteorol. Environ. Sci. 2016, 39, 86–92. [Google Scholar]
  21. Brand, S. Interaction of Binary Tropical Cyclones of the Western North Pacific Ocean. J. Appl. Meteorol. 1970, 9, 433–441. [Google Scholar] [CrossRef]
  22. Yang, S.; Cheng, Z.; Gong, Y. A Summary of the Research on Interactions of Twin Tropical Cyclones. Guangdong Meteorol. 2019, 41, 10–13. [Google Scholar]
  23. Yu, Z.; Ji, C.; Xu, J.; Bao, S.; Qiu, J. Numerical simulation and analysis of the Yangtze River Delta Rainstorm on 8 October 2013 caused by binary typhoons. Atmos. Res. 2015, 166, 33–48. [Google Scholar] [CrossRef]
  24. Yang, C.; Wu, C.; Chou, K.; Lee, C. Binary Interaction between Typhoons Fengshen (2002) and Fungwong (2002) Based on the Potential Vorticity Diagnosis. Mon. Weather Rev. 2008, 136, 4593–4611. [Google Scholar] [CrossRef] [Green Version]
  25. Zhu, Z.; Huang, N.; Wen, X. Diagnostic Analysis of Interaction between Binay Typhoons Tembin and Bolaven. Meteorol. Sci. Technol. 2015, 43, 506–511. [Google Scholar]
  26. Li, M.; Zhang, S.; Wu, L.; Lin, X.; Chang, P.; Danabasoglu, G.; Wei, Z.; Yu, X.; Hu, H.; Ma, X.; et al. A high-resolution Asia-Pacific regional coupled prediction system with dynamically downscaling coupled data assimilation. Sci. Bull. 2020, 65, 1849–1858. [Google Scholar] [CrossRef]
  27. Kain, J.; Fritsch, J. Convective Parameterization for Mesoscale Models: The Kain-Fritcsh Scheme. The Representation of Cumulus Convection in Numerical Models; American Meteorological Society: Boston, MA, USA, 1993; Volume 24. [Google Scholar]
  28. Clough, S.A.; Shephard, M.W.; Mlawer, E.J.; Delamere, J.S.; Iacono, M.J.; Cady-Pereira, K.; Boukabara, S.; Brown, P.D. Atmospheric radiative transfer modeling: A summary of the AER codes. J. Quant. Spectrosc. Radiat. Transf. 2005, 91, 233–244. [Google Scholar] [CrossRef]
  29. Hu, X.; Klein, P.; Xue, M. Evaluation of the updated YSU planetary boundary layer scheme within WRF for wind resource and air quality assessments. J. Geophys. Res. 2013, 118, 10–490. [Google Scholar] [CrossRef]
  30. Hong, S.; Dudhia, J.; Chen, S. A Revised Approach to Ice Microphysical Processes for the Bulk Parametrisation of Clouds and Precipitation. Mon. Weather Rev. 2004, 132, 103–120. [Google Scholar] [CrossRef]
  31. Tan, Z.; Liang, M.; Xue, Y.; Xu, J.; Xu, F. Diagnosis on the Heavy Precipitation of Typhoon Lekima. J. Nanjing Univ. Inf. Sci. Technol. (Nat. Sci. Ed.) 2020, 12, 450–459. [Google Scholar]
  32. Li, M.; Zhang, S.; Wu, L.; Lin, X.; Chang, P.P.; Danabasoglu, G.; Wei, Z.; Yu, X.; Hu, H.; Ma, X.; et al. An Examination of the Predictability of Tropical Cyclone Genesis in High-Resolution Coupled Models with Dynamically Downscaled Coupled Data Assimilation Initialization. Adv. Atmos. Sci. 2020, 37, 939–950. [Google Scholar] [CrossRef]
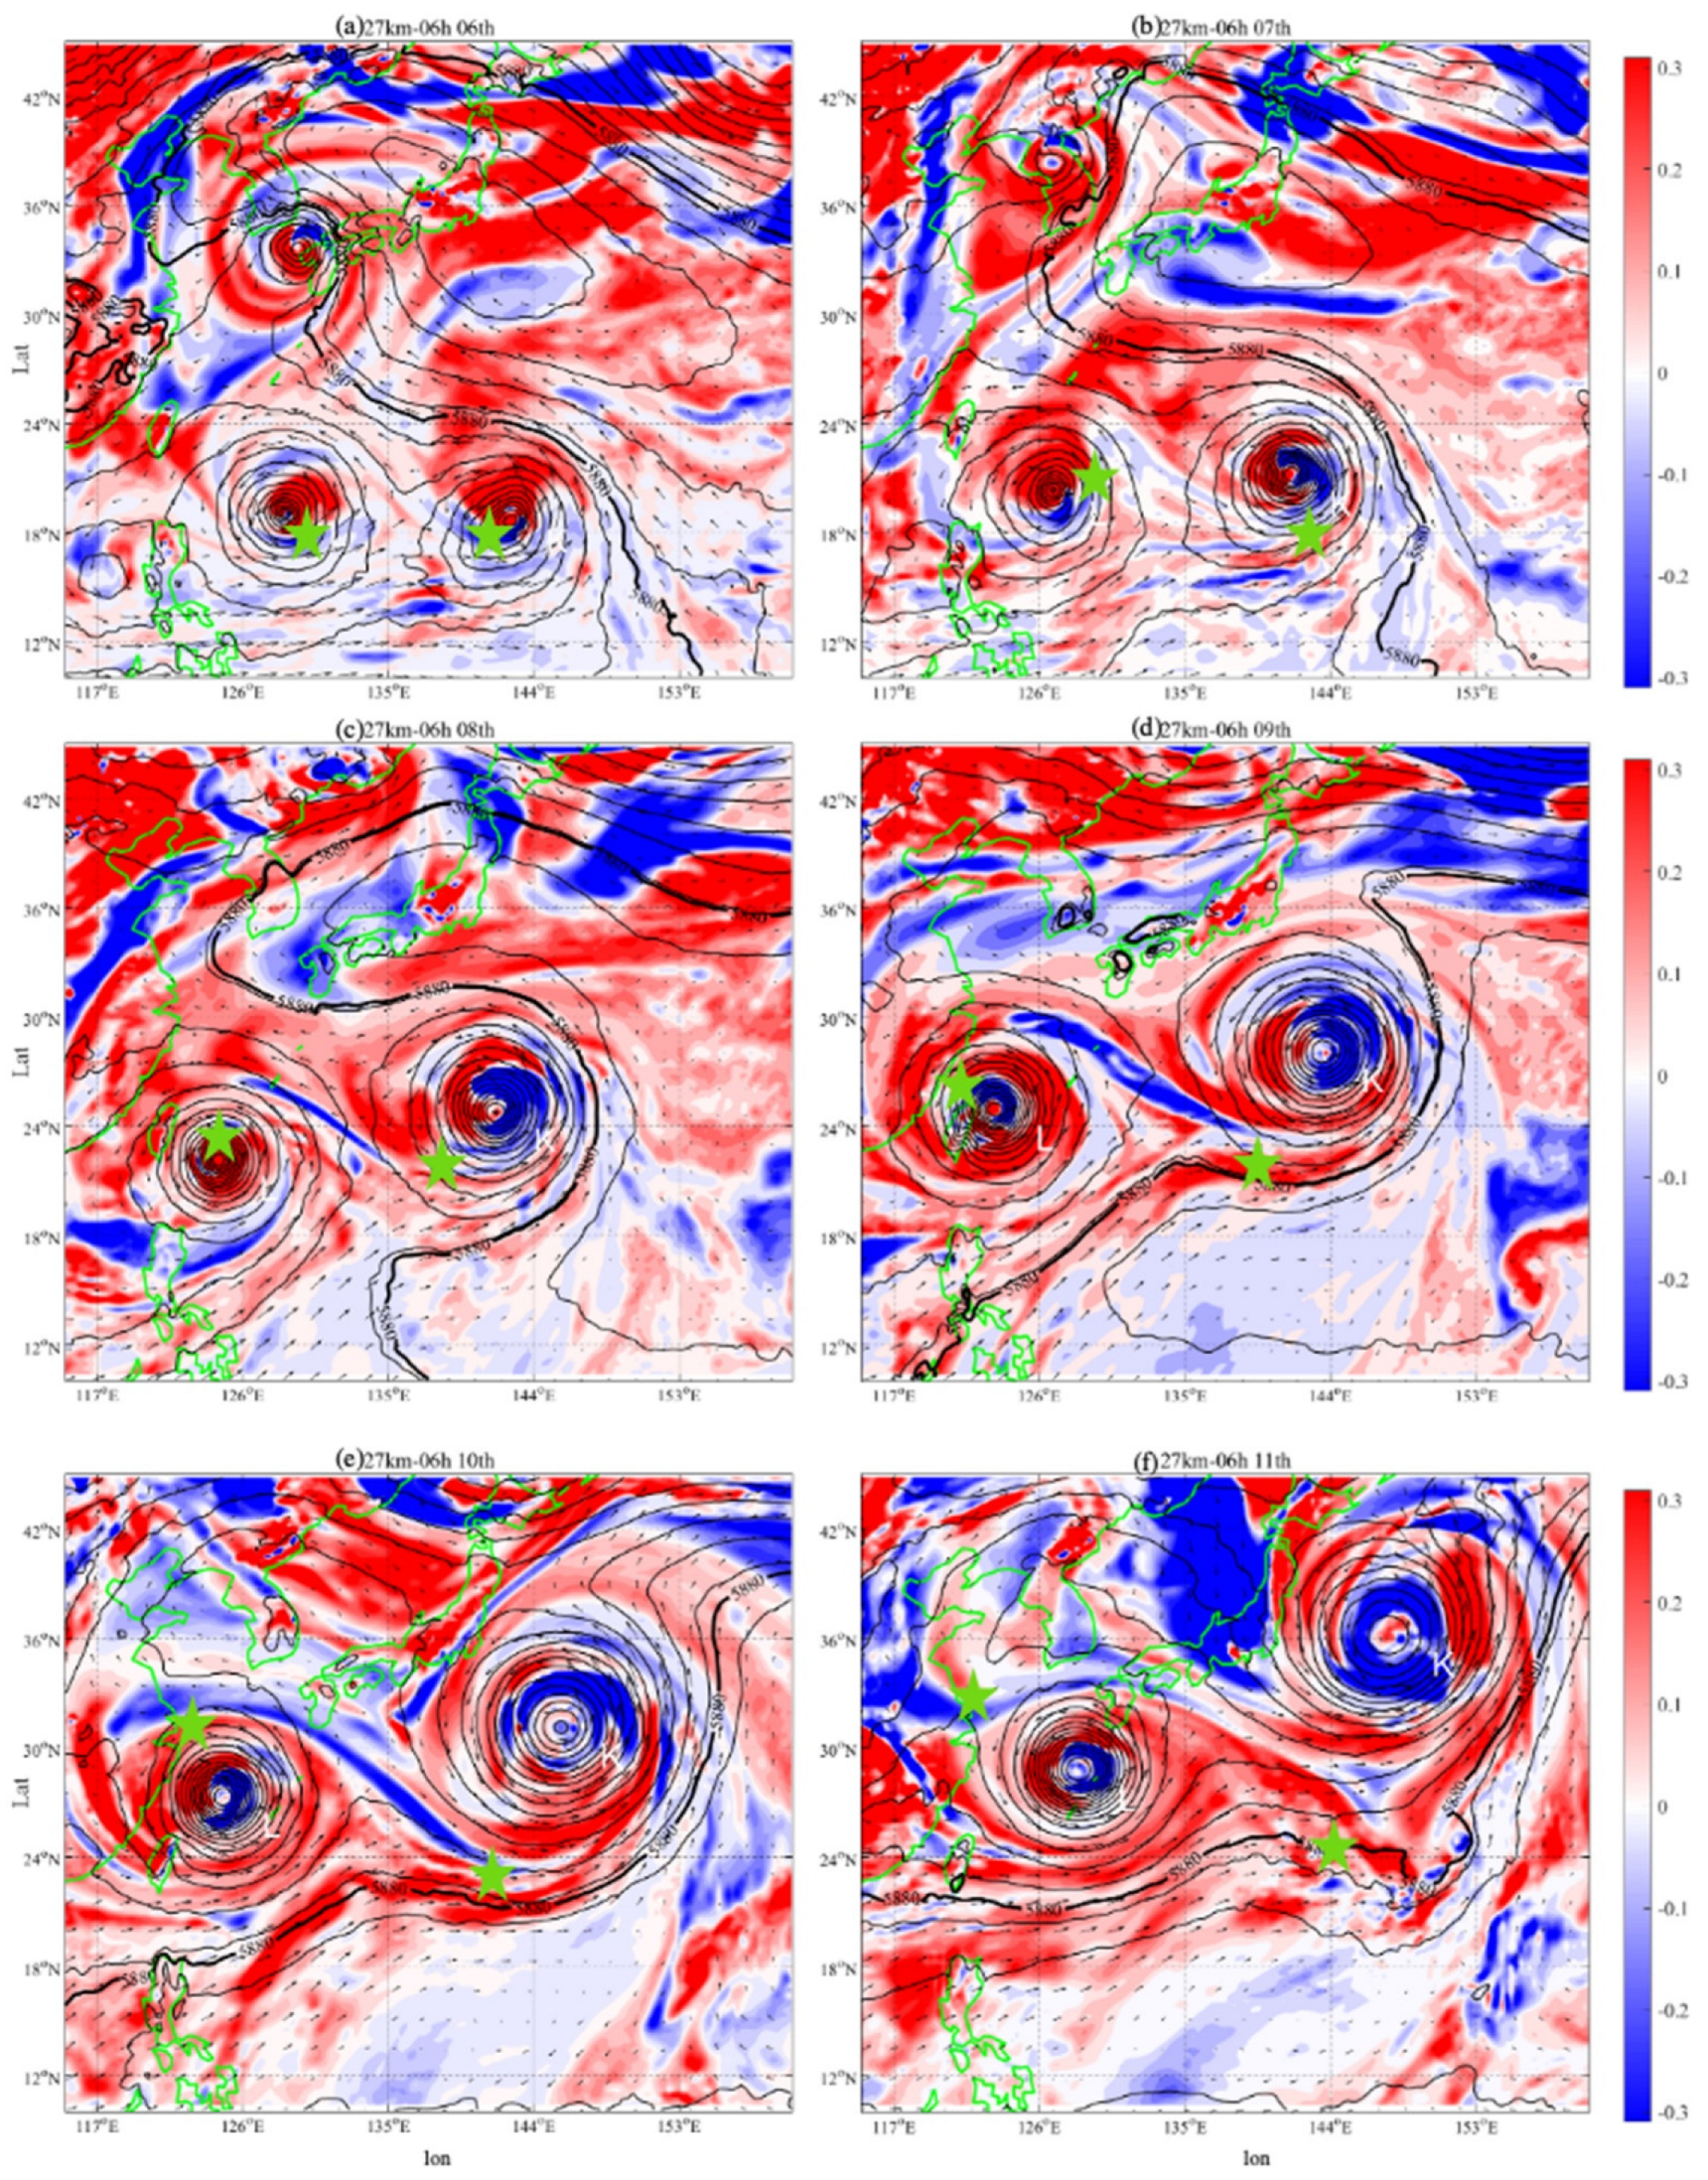
Figure 1. 700 hPa MPV1 (color shaded) (unit: PVU (10−6 m2.s−1.K.kg−1)) and wind vector (arrows) with the circulation background represented by 500 hPa geopotential height field (contours) (unit: meter) in the 27 km resolution model forecast at 06:00 BJT from 6 to 11 August (panels af). The green asterisks mark the satellite-observed positions of typhoon centers. The centers of Lekima and Krosa are marked as “L” and “K”.
Atmosphere 13 00281 g001
Figure 2. Same as Figure 1, but for the model with the 9 km resolution.
Atmosphere 13 00281 g002
Figure 3. Same as Figure 1, but for the model with the 3 km resolution.
Atmosphere 13 00281 g003
Figure 4. The actual typhoon path of Lekima (dot) and Krosa (five-pointed star) (red curve) and the simulated typhoon path of WRF model in 27 km (green curves), 9 km (purple curves), and 3 km (blue curves) resolution.
Atmosphere 13 00281 g004
Figure 5. The surface pressure at the typhoon center and maximum speed of typhoons (a,c) Lekima and (b,d) Krosa in the models with 27 km (blue), 9 km (yellow), and 3 km (grey) resolutions and observed (red). The observation was taken from the typhoon website of China Meteorological Administration (http://typhoon.nmc.www.cma.cn/web.html on 8 May 2021).
Atmosphere 13 00281 g005
Figure 6. The vector (black arrows) and the norm (color shaded) of -MPV1 × V (unit: 10−6 m3.s−2.K.kg−1) in the Lekima and Krosa binary typhoon system of three-resolution models at 06:00 BJT from 8 to 10 August(the negative values of MPV represent instability energy). The centers of Lekima and Krosa are marked as “L” and “K”.
Atmosphere 13 00281 g006
Figure 7. The simulated Radar Echo (unit: dBZ) images by (a,b) 27 km, (c,d) 9 km, and (e,f) 3 km resolution models for typhoonsLekima (left panels a,c,e) and Krosa (right panels b,d,f) on the10 August 2019, and the corresponding satellite-observed cloud images (bottom panels g,h).
Atmosphere 13 00281 g007
Figure 8. MPV2 (color shaded) (unit: 0.1PVU) and geopotential height field (dashed lines) (unit: meter) on the 700 hPa isobar under the 27 km resolution forecast model at 06:00 BJT from 6 to 11 August(panels ae). The green asterisks mark the satellite-observed positions of typhoon centers. The centers of Lekima and Krosa are marked as “L” and “K”.
Atmosphere 13 00281 g008
Figure 9. Same as Figure 8, but for the models with the 9 km (panels a,b) and 3 km (panels c,d) resolutions at 06:00 BJT of 8 and 9 August, respectively.
Atmosphere 13 00281 g009
Figure 10. Distributions of wet potential temperature (solid lines) (unit: K) and vertical velocities (shading) (unit: 10−2 m/s) in the vertical-latitude longitude section along the latitude of the Lekima center (marked by “L”) in the 27 km resolution model at 06:00 BJT from 6 to 11 August (panels ae). The centers of Lekima and Krosa are marked as “L” and “K”.
Atmosphere 13 00281 g010
Figure 11. Same as Figure 10, but for the models with the 9 km (a,c,e) and 3 km (b,d,f) resolutions, respectively.
Atmosphere 13 00281 g011
Figure 12. The three-dimensional horizontal cross-sections of total MPV (color-shaded) in the (a,b) 27 km, (c,d) 9 km, and (e,f) 3 km resolution models at 06:00 BJT of the 8 August (left panels a,c,e) and 9 August (right panels b,d,f). The contours (color-shaded) in the vertical section are the vertical velocities (total MPV). For the convenience of visualization, the vertical section was chosen to be located at the north of typhoon centers.
Atmosphere 13 00281 g012
Figure 13. Schematic diagram of the energy transfer in a binary typhoon system. The contours (color-shaded) in the vertical section is the MPV, where red represents positive values and blue represents negative values. The green curves represent the evaporation of water vapor on the surface of the warm ocean and the blue arrows represent the transfer of instability energy.
Atmosphere 13 00281 g013
Table 1. The settings for the three-resolution simulations.
Settings27 km (16S,63N) (38E,178E)9 km (16S,63N) (38E,178E)3 km (16S,63N) (38E,178E)
Grids560 × 4101676 × 12265026 × 3676
Longwave RadiationRapid Radiative Transfer Model (RRTMG)RRTMGRRTMG
Shortwave RadiationRRTMGRRTMGRRTMG
Cloud MicrophysicsWRF single moment 3-class simple ice scheme (WSM3)WSM3WSM3
Cumulus ConvectionKain-FritschKain-FritschNo
PBL SchemeYonsei University scheme (YSU)YSUYSU
Vertical Levels282828
Time Steps54s18s6s
Publisher’s Note: MDPI stays neutral with regard to jurisdictional claims in published maps and institutional affiliations.