Article

Variations of Black Carbon Concentrations in Two Sites in Mexico: A High-Altitude National Park and a Semi-Urban Site

1
Catedrático CONACYT Comisionado a Departamento de Sistemas Biológicos, División de Ciencias Biológicas y de la Salud, Universidad Autónoma Metropolitana-Xochimilco (UAM-X), Mexico City 04960, Mexico
2
Facultad de Ciencias, Universidad Nacional Autónoma de México, Mexico City 04510, Mexico
3
Unidad Multidisciplinaria de Docencia e Investigación-Juriquilla Facultad de Ciencias, Universidad Nacional Autónoma de México, Queretaro 76230, Mexico
4
Instituto de Ciencias de la Atmósfera y Cambio Climático, Universidad Nacional Autónoma de México, Mexico City 04510, Mexico
*
Author to whom correspondence should be addressed.
Atmosphere 2022, 13(2), 216; https://doi.org/10.3390/atmos13020216
Submission received: 31 December 2021 / Revised: 23 January 2022 / Accepted: 25 January 2022 / Published: 28 January 2022

Abstract

:
Black carbon (BC), a component of carbonaceous material, has an important role in the environment, and it is considered a short-lived climate forcer that plays a vital role in the global climate system. BC concentrations were analyzed during 2017 in two sites in Mexico, Juriquilla and Altzomoni, which have different emission sources and atmospheric dynamics. The annual average BC concentrations in 2017 were 0.84 ± 0.70 and 0.58 ± 0.37 µg m−3 for Juriquilla and Altzomoni, respectively. The principal contributors for the highest BC concentration in Juriquilla were anthropogenic sources, while pollutants transport from nearby cities was more important for Altzomoni. Comparison between this analysis and previous reports from 2015 for both sampling sites demonstrated an increase in BC concentration. Results of this study could contribute to a better understanding of BC effects under different emission conditions and provide a scientific reference for developing BC reduction strategies over Mexico.

1. Introduction

Black carbon (BC) is a component of carbonaceous material produced by emissions from anthropogenic combustion sources, including industrial emissions, road transport (fossil fuels such as gasoline and diesel), electricity generating units, other power production sources, domestic heating and biomass burning (wood and crop residues) [1,2,3,4]. It is distinguishable from other carbon materials contained in atmospheric aerosol because of the following physical properties: (a) it strongly absorbs visible light at all visible wavelengths (the ability to retain and transform solar radiation into heat); (b) it is refractory (vaporization temperature near 4000 K); (c) it is insoluble in water, organic solvents and other components of atmospheric aerosol; and (d) it exists as an aggregate of tiny carbon spherules [5,6,7].
It is considered a short-lived climate forcer (atmospheric lifetime of 4–12 days) that plays a vital role in the global climate system because it influences cloud processes (acts as cloud condensation nuclei), atmospheric heating and climate change and alters the melting of snow and ice cover [7,8,9,10]. Bond et al. [5], in an extensive study about the role of BC in climate change, concluded that this carbonaceous material is the second most important agent of global warming after CO2, contributing to global warming with 55 percent of carbon dioxide’s impact, more than any of the other greenhouse gases (GHG), including methane.
BC also causes negative effects on human health because it is a component of fine particles. BC can be inhaled into human bodies in long- or short-term exposure, leading to a significant increase in the development of cardiovascular and respiratory diseases and premature mortality. Nonetheless, the individual health effects of BC are not yet well understood, and the health impact has generally been associated with the health effects linked to particulate matter with a size less than 2.5 µm (PM2.5) [1,7,11]. The health effects associated with BC include sub-clinical effects (ventricular repolarization, heart rate variability, endothelial dysfunction, blood markers of inflammation and changes in blood pressure and total plasma homocysteine) and clinical effects (arrhythmia, respiratory symptoms, chronic and acute cases of asthma and other disorders), increasing in severity from lung cancer and cardiovascular problems to premature deaths [4,7].
The emissions of BC are increasing worldwide, probably as a result of industrialization as well as rapid and disorderly urban and economic growth in conjunction with the lack of programs to prevent environmental pollution, contributing to climate change and the accumulation of risks to health and well-being of the population [12,13]. According to the latest National Greenhouse Gas Inventory 1990–2015, Mexico emitted 131.56 Gg of BC in 2015 [14]. Emissions were generated mainly from the energy sector (burning fossil fuels, manufacturing and construction industries, transport, and fugitive emissions from the fuel manufacturing), which contributed 125.97 Gg of BC (95.75%) of the total. These potential effects led Mexico, in 2009, to adopt its first Special Program on Climate Change—Programa Especial de Cambio Climático (PECC)—which sets Mexico’s long-term climate change agenda, together with medium-term goals for adaptation and mitigation. Furthermore, in April 2012, the Mexican Congress unanimously approved the General Law on Climate Change (LGCC in Spanish), resulting in creating institutions and effective instruments for GHG and particle emissions. In addition, Mexico has pledged to unconditionally reduce 25% of its greenhouse gases and short-lived climate pollutants emissions by 2030. This commitment implies a reduction of 22% of GHG and a reduction of 51% of BC (COP21 Conference of the Parties, United Nations Framework Convention on Climate Change).
Several studies in Mexico have quantified BC concentrations, but most of them were carried out in Mexico City’s Metropolitan Area [15,16,17,18]. A limited number were conducted in other cities, such as Mezquital Valley, Hidalgo [2005 Campaign] [19]; Ciudad Juarez, Chihuahua [Campaign 2008] [20]; Guadalajara [2008 Campaign] [21]; Tijuana [Cal–Mex 2010 Campaign] [22,23]; Altzomoni, Estado de México; Juriquilla, Queretaro and Monterrey [2015 Campaign] [18]. All studies provided data for the assessment of BC impacts on air quality and contributed to the evaluation of emission inventories, policies, and public actions to reduce emissions. Nevertheless, these studies were focused on short periods. In contrast, the study carried out by Peralta et al. [18] allowed us to establish a baseline to determine the variability of BC through time in four sites in Mexico.
The present work aims at monitoring the BC concentrations in two sites of Mexico during 2017, Juriquilla (semi-urban site) and Altzomoni (high-altitude site), and compares the data with the results from Peralta et al. [18] from 2015 in order to assess the changes in BC concentration between these two years.

2. Materials and Methods

2.1. Sampling Site

BC data were obtained at Juriquilla (JQRO) and Altzomoni (ALTZ) from January 2017 to December 2017. Both sites are part of the University Network of Atmospheric Observatories (RUOA, Spanish acronym) of the Universidad Nacional Autónoma de México (UNAM). BC data were collected.
JQRO is in the northwest of Santiago de Queretaro within the UNAM campus on the roof of a two-story building (20°42′ N, 100°26′ W) and 1945 m above mean sea level (Figure 1). JQRO is a semi-urban site characterized by academic buildings interspersed with vegetation and surrounded by residential and commercial areas, and it is adjacent to a highway with mixed traffic [24]. Juriquilla is located north of the Metropolitan Area of Queretaro [25].
ALTZ is located approximately 60 km southeast of the center of Mexico City, 70 km northeast of Cuernavaca and 50 km west of Puebla with coordinates (19°07′ N, 98°39′ W) at 3985 m above mean sea level (Figure 1) [26]. The observatory is on the slopes of the Iztaccihuatl volcano, within the Izta-Popo Zoquiapan National Park. ALTZ is a site with vegetation mainly represented by coniferous and oak forests, pastures, and induced vegetation [27]. In addition, ALTZ is close to Popocatepetl, a volcano active since 1997 [28].
Both sites monitor meteorological parameters such as wind speed and direction, temperature, relative humidity, precipitation, and radiation (www.ruoa.unam.mx; accessed on 22 October 2021).

2.2. BC Measurements

BC concentrations were measured in real time using a photoacoustic extinctometer (PAX, Droplet Measurement Technologies, Longmont, CO, USA) with a flow rate of 1 L min−1. PAX uses a modulated diode laser (1500 Hz) to simultaneously measure in situ light absorption (Babs) and scattering (Bscat) of aerosol particles. The Babs was measured using a small microphone (photoacoustic sensor) to detect the perturbations induced by the heating of the light-absorbing particles to quantify the absorption coefficient, and the Bscat was measured with a nephelometer; both measurements were performed at 870 nm [17,18,29]. The PAX was calibrated before and after the campaign according to the method recommended by Droplet Measurement Technologies using ammonium sulfate particles and soot particles at high concentrations [30,31], following the procedure in the PAX Operator Manual. A value of the mass absorption efficiency (MAE) equal to 4.74 m2 g−1 was used to estimate BC concentrations, derived using the λ-1 correction to the 7.5 m2 g−1 value recommended by Bond et al. [31,32]. BC concentrations had a time resolution of 1 min, but 60 min averages were used for analysis.

3. Results and Discussion

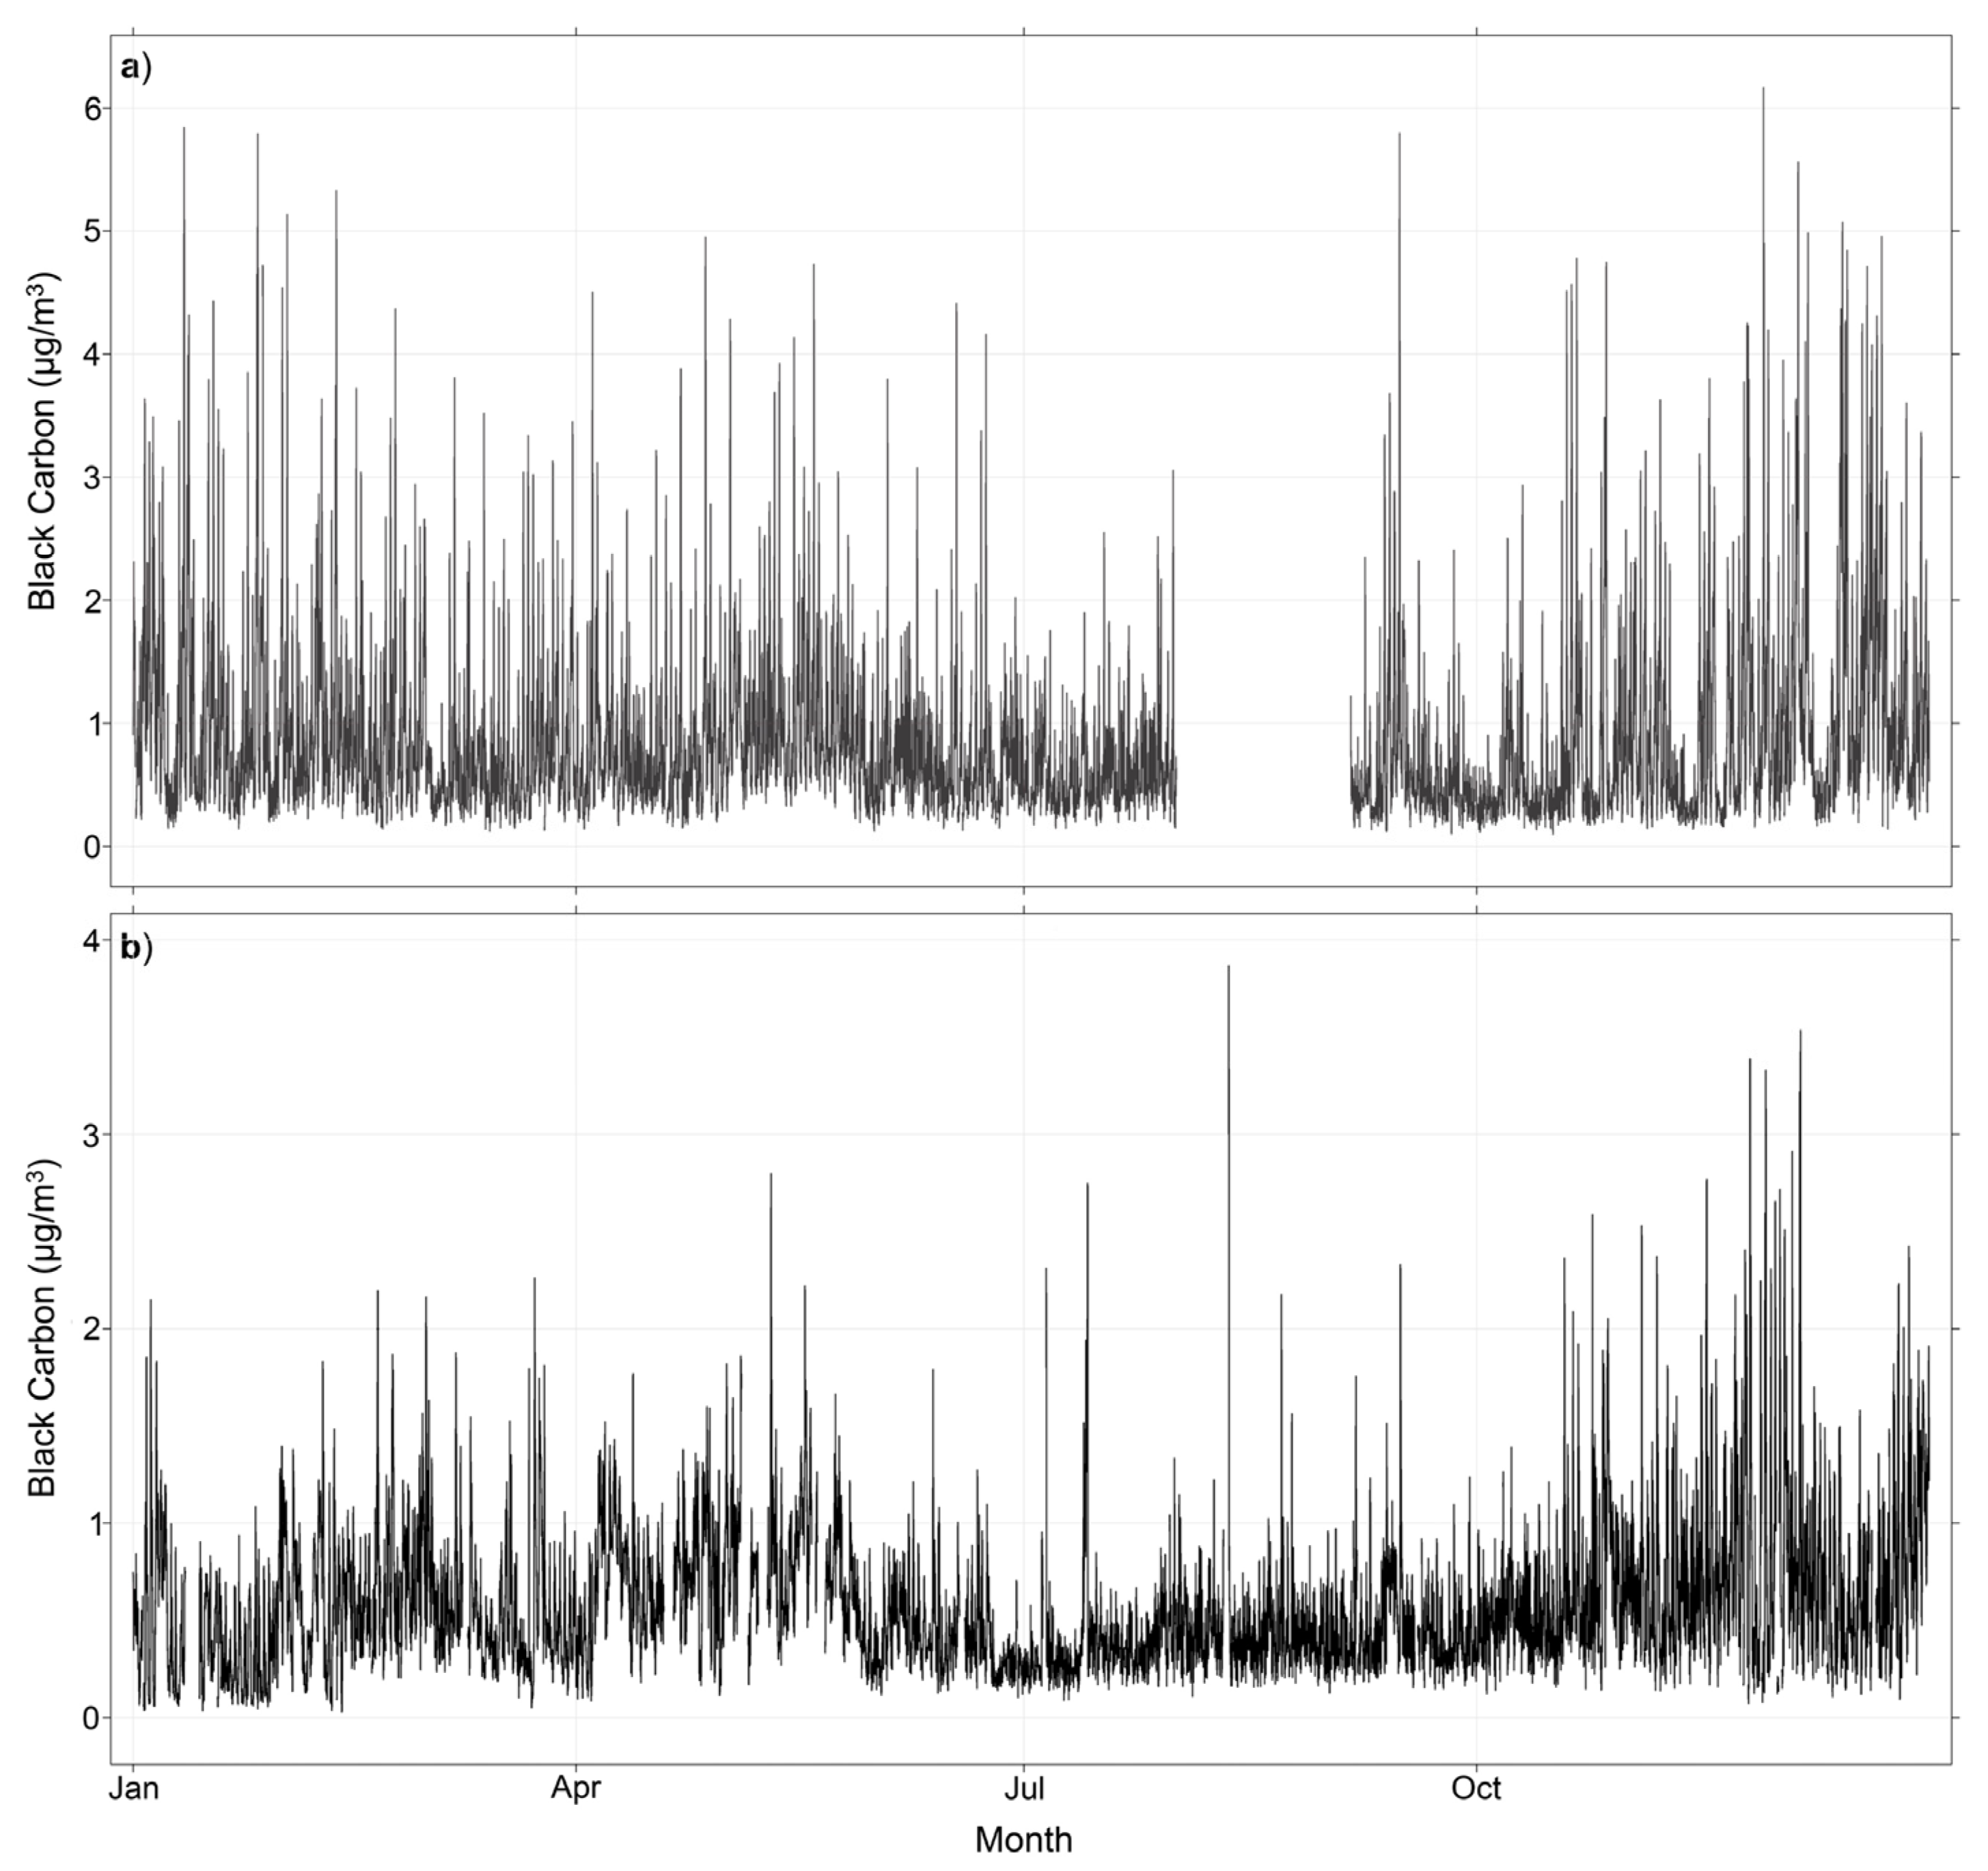
3.1. Seasonal Trends of BC

Black carbon concentrations obtained during 2017 at JQRO and ALTZ are presented in Figure 2. JQRO showed an annual average of 0.84 ± 0.70 µg m−3 with a concentration range of 0.10 to 6.16 µg m−3, while ALTZ presented an annual average of 0.58 ± 0.37 µg m−3 with a concentration range of 0.03 to 3.87 µg m−3 (See Table 1). Data from JQRO show a gap for August and September due to equipment maintenance. The comparison between the annual averages of both sites indicates a difference of 0.26 µg m−3. This difference might partially be due to the different emission sources of each site; JQRO is a semi-urban site inside a relatively large Metropolitan Area where the main emission sources are residential, vehicular, and industrial activities, whereas ALTZ is a high-altitude natural reserve without point emission sources nearby but with a regional influence from neighboring cities by pollutants transportation [26].
The sample period was divided into four seasons, considering the monthly temperature and precipitation values during 2017, for both sampling sites (Figures S2 and S3). July, August, and September were the months with high precipitation due to the low-pressure systems over the Pacific and Atlantic oceans that transport air masses laden with moisture which generate rain in the country. In addition, the months with the highest temperature were April, May, and June, with average temperatures above 20 °C and 6 °C for JQRO and ALTZ, respectively. Based on this analysis, we divided the sampling period into four seasons (similarly to Peralta et al. [18]): S1, from January to March (dry-cold season); S2, April to June (dry-hot season); S3, July to September (rainy season) and S4, October to December (dry-cold).
Table 1 shows the BC concentrations during the four seasons. During 2017, the maximum BC concentrations were observed during the cold seasons (S1 and S4) at JQRO and during S4 at ALTZ. Weak convective processes characterized the cold months, causing the accumulation of atmospheric particles in the boundary layer (i.e., a larger number of particles), resulting in high BC concentrations [33]. The lowest BC concentration was during the S3 season, which corresponds to the rainy season, where the pollutants are more efficiently removed from the boundary layer by wet deposition. Season S1 presented values of 0.91 ± 0.74 and 0.55 ± 0.34 µg m−3 for JQRO and ALTZ, respectively, and these values are because this season represents a transition from a cold to a hot season, that is, from season S4 to S2.
On the other hand, the month of May, included in season S2, showed high BC concentrations for JQRO and ALTZ (0.83 ± 0.57 µg m−3 and 0.63 ± 0.33 µg m−3, respectively). However, average values during season S2 at both sites were not the highest for 2017 because some rainy days were present during these months (Figure S3), which caused a lower BC concentration in season S2 than S4. The months of April, May and June corresponding to season 2 were characterized by high temperatures and radiation values, meteorological parameters that probably caused BC particles to undergo external coating, leading to increased quantification (Table 2). The external coating is when each particle is made up only of the material from which it was formed initially. The internal coating is when a BC particle and a non-BC particle (organic and inorganic compounds emitted and formed by photochemistry) exist together as a mixture [34,35,36]. The internal coating results in BC particles becoming more compact and spherical than when uncoated, with an elongated shape [35,37,38].
Moreover, the nucleus of BC particles with an internal coating is not necessarily located in the center of the new particle [35,38,39]. However, when the BC particle is covered with other components, it can increase its absorption due to the lensing effect. This effect occurs when the radiation reaches the external layer of the particle and part of it is diverted to the BC nucleus, where it is absorbed.

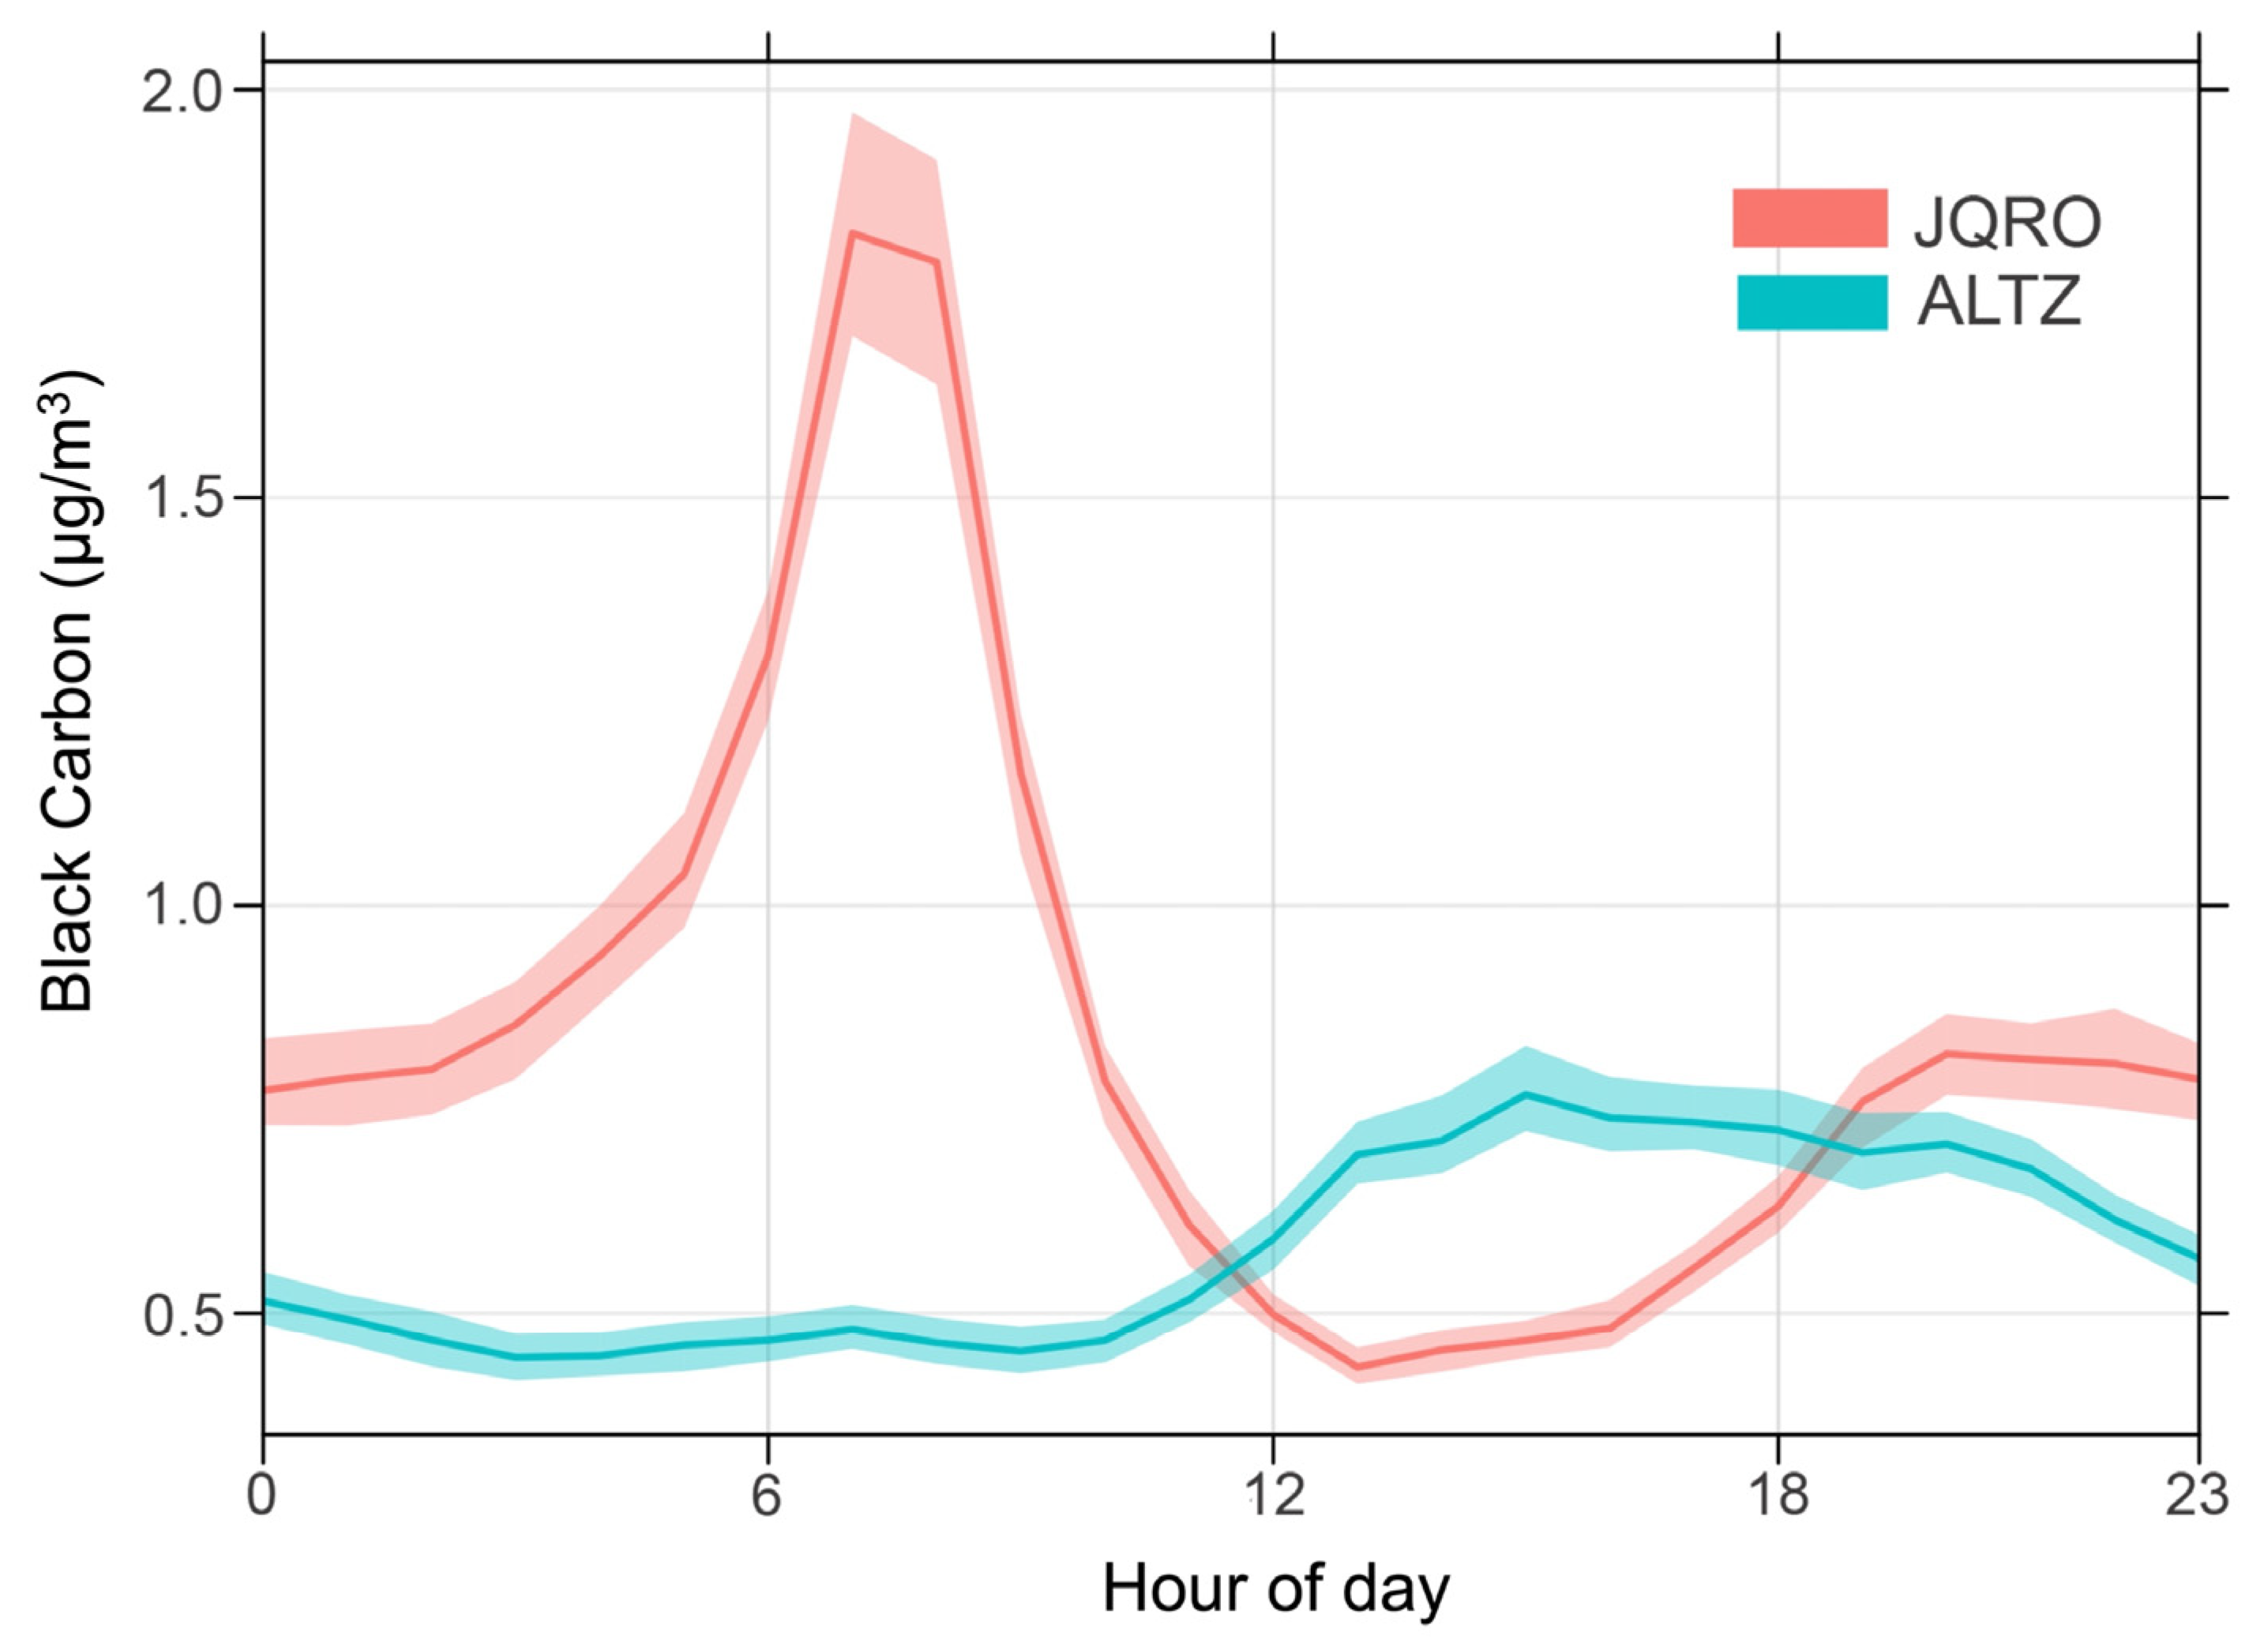
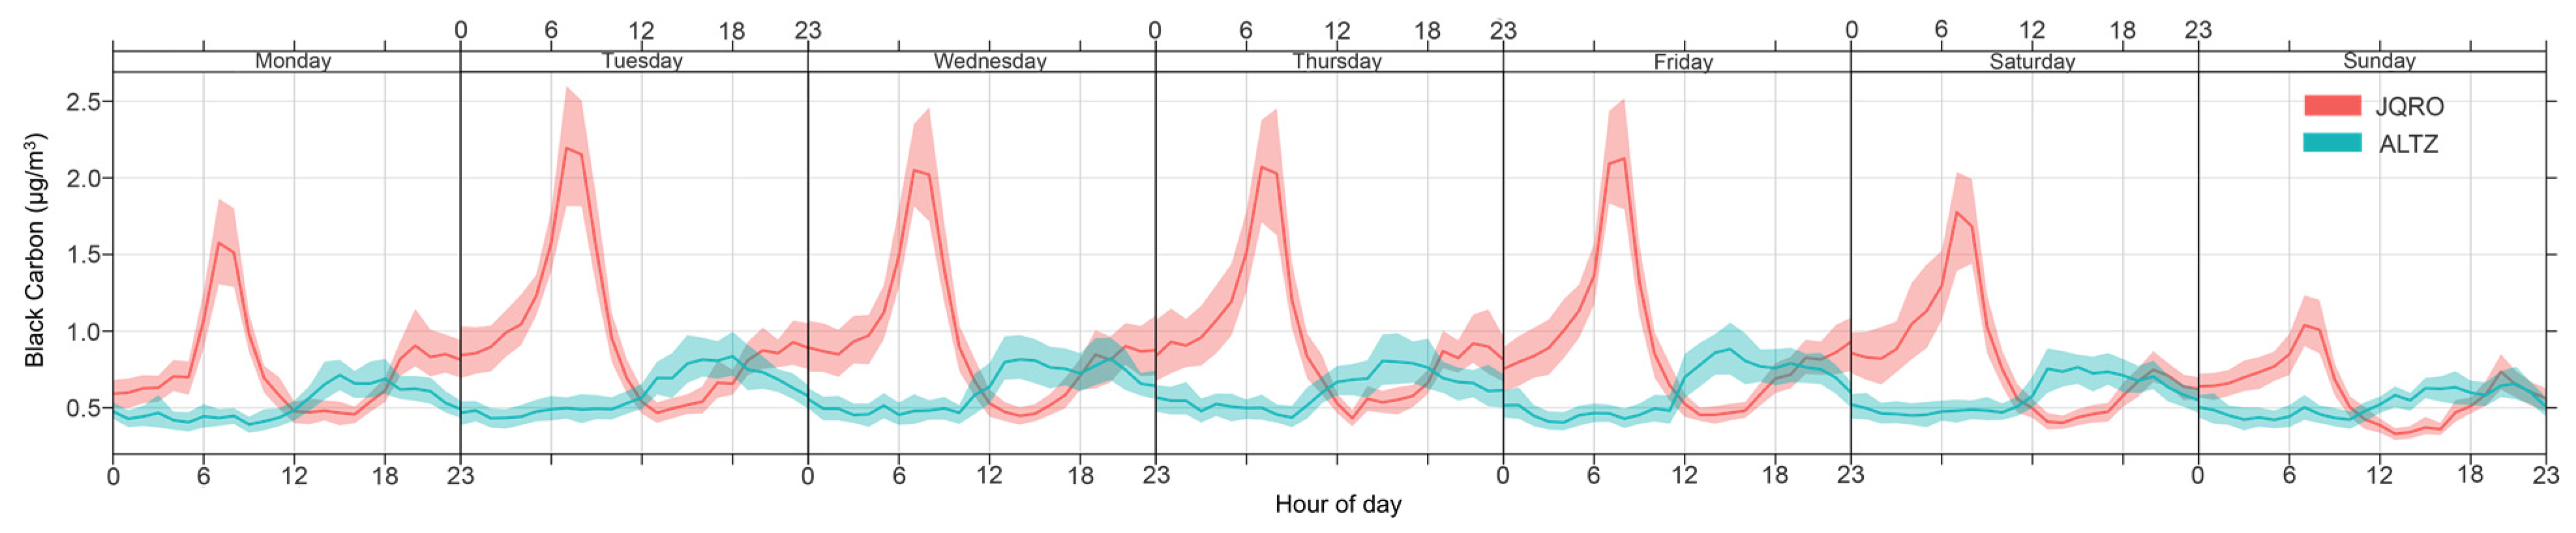
3.2. Average Diurnal and Weekly Cycles of BC

Analysis of the average daily profiles was performed in order to investigate sources of BC. The results show bimodal behavior for JQRO with two well-defined peaks (Figure 3); the first peak appeared in the morning hours, between 05:00 and 11:00, with a maximum at 07:00 (1.82 µg m−3), and the second around 19:00 h (0.81 µg m−3). Additionally, a minimum BC concentration at 12:00 h is present in the average daily profile; this minimum matches the value when the maximum height of the boundary layer is reached (Figure S4). The first peak could be associated with vehicular emissions due to routine activities, while the second peak was likely related to the evening commute. The difference between the BC concentrations of the two peaks could be attributed to the lengths and variability of the daily activities and to the height of the boundary layer, which is probably lower in the mornings. On the other hand, ALTZ showed a defined peak between 13:00 and 17:00 (Figure 3), with a maximum value at 15:00 (0.78 µg m−3), which is consistent with the previous report by Baumgardner et al. [26], who concluded that a large part of the pollutants emitted and formed in Mexico City are transported to this protected area, [26].
Figure 3 corresponds to the annual average cycle; however, the daily profiles are similar for each of the four seasons (Figures S5 and S6).
Figure 4 shows the weekly cycle of BC concentration in both sites. In ALTZ, the cycle is very similar every day of the week. In contrast, lower concentrations in JQRO are observed on Sundays, probably due to reduced vehicular activities. This condition reinforces the correlation between the burning of fossil fuels and BC levels widely documented elsewhere [17,18,40]. A significant result in the weekly cycle in JQRO is the evening peak, which showed a minimal decrease on weekends. This evening peak is probably related to the highway located approximately 1 km away with heavy-duty traffic. This night traffic is because trucks usually work at night all week to compensate for the restricted transit hours and take advantage of the low traffic on their routes.
Figure 5 shows the average BC concentration associated with wind speed and direction for JQRO of each season in a polar coordinate system. The color scale represents the average BC concentration. The polar coordinate system shows that the highest BC levels were captured when a low-speed wind was blowing from the north, where the Santa Rosa Jáuregui municipality and Queretaro Industrial Park are located. Otherwise, ALTZ showed high BC concentrations when the winds were strong and came from the west, northwest or southeast, i.e., when they came from Mexico City and Puebla (Figure 6). These results suggest that high BC concentrations at JQRO have a local origin, while those at Altzomoni result from the transport of pollutants at a regional scale.

3.3. Comparison of BC Concentrations between 2015 and 2017

Table 1 compares BC concentrations at JQRO and ALTZ in 2015 (Peralta et al. [18]) and 2017. An increase of 12% was observed in JQRO from 2015 to 2017. BC concentration at ALTZ increased almost 114%, indicating that natural parks are being more affected by the pollution of neighboring cities. The above is important, given that the BC in the atmosphere can strongly absorb solar radiation; Bond et al. [7] estimated that the total climate forcing of BC is +1.1 Wm−2, which may cause temperatures to increase considerably.
For the case of JQRO, the increase in BC concentration from 2015 to 2017 is probably due to an increase in pollutants emissions, including BC, due to the economic growth of Queretaro State (8.5% more in 2017 than 2016). Additionally, Santiago de Queretaro, the municipality of JQRO, presented population growth (7 mil inhabitants) and an increase in the number of vehicles (105 mil vehicles) from 2015 to 2017 [25,41]. On the other hand, the high BC concentration in ALTZ is probably because of Mexico City’s and Puebla’s influences. Both cities have suffered an increase in population and vehicles through time. Mexico City has 9 million inhabitants and 10 million vehicles, while Puebla has 6 and 3 million inhabitants and vehicles, respectively [25,41]. Furthermore, the 2015 report [18] indicated that the wind influence in ALTZ was mainly from Puebla, while in this study, ALTZ had a more significant influence from Mexico City (Figure 6).
Moreover, comparative analysis between the four seasons in 2015 and 2017 shows a higher concentration of BC for 2017 in seasons S1, S2 and S4. In season S3 (rainy season), BC levels decreased in JQRO and ALTZ in 2017 compared to 2015. The BC concentration decrease is associated with the intensity of the rain at the sampling sites; there was more precipitation in 2017 than in 2015. For S3-2015, the amount of rain was 151.7 and 302.3 mm, while in S3-2017 it was 243.9 and 424.1 mm, for JQRO and ALTZ, respectively.

4. Conclusions

The data analysis in this study shows an increase in annual BC concentrations in 2017 compared to 2015 in two sites in Mexico (JQRO and ALTZ). These observed increases are close to 12% in Juriquilla and 114% in Altzomoni. The results are troubling because BC concentrations increased regardless of the analyzed site. However, values are lower than those reported for other urban and semi-urban sites in Mexico.
Two peaks in the diurnal cycle for JQRO are associated with anthropogenic activities. On the other hand, only a single peak was observed for ALTZ, associated with pollutants transport of nearby cities. The cities’ influences on ALTZ is probably determined by the wind speed and direction, which are what allows the transport of pollutants from one place to another. Regarding different seasons, the highest BC concentration was observed during S4 (dry-cold) due to the accumulation of atmospheric particles in the boundary layer, and the season with the lowest concentration was S3, the rainy season.
ALTZ showed high BC concentrations when the winds were strong and came from the west, northwest or southeast, i.e., when they came from Mexico City and Puebla, while in JQRO, its increase was associated with local emissions from population growth rather than from transport.

Supplementary Materials

The following supporting information can be downloaded at: https://www.mdpi.com/article/10.3390/atmos13020216/s1, Figure S1: Average monthly profile of BC in (a) JQRO and (b) ALTZ for sampling period. The shading highlights the standard deviation, Figure S2: Average monthly profile of temperature in (a) JQRO and (b) ALTZ for sampling period. The shading highlights the standard deviation, Figure S3: Time series of hourly precipitation at (a) JQRO and (b) ALTZ during 2017, Figure S4: Average daily profiles of the boundary layer in (a) JQRO and (b) ALTZ for the sampling period. The shading highlights the standard deviation, Figure S5: Average daily profiles of BC in JQRO of the four-seasons: (a) S1; (b) S2; (c) S3; and (d) S4. The shading highlights the standard deviation, Figure S6: Average daily profiles of BC in ALTZ of the four-seasons: (a) S1; (b) S2; (c) S3; and (d) S4. The shading highlights the standard deviation.

Author Contributions

Data analysis and writing—first draft preparation, M.L.-L.; data collection and data analysis, B.S.; results analysis and interpretation and writing, D.S., O.P. and T.C.; writing—review and editing, supervision, project administration and funding, H.A.-O. All authors have read and agreed to the published version of the manuscript.

Funding

This study was financially supported by the program UNAM-DGAPA-PAPIIT (grant IA107717).

Institutional Review Board Statement

Not applicable.

Informed Consent Statement

Not applicable.

Data Availability Statement

Publicly available datasets were analyzed in this study. This data can be found here: [https://www.ruoa.unam.mx] (accessed on 30 December 2021).

Acknowledgments

The authors thank the University Network of Atmospheric Observatories (RUOA) for providing black carbon data and meteorological parameters.

Conflicts of Interest

The authors declare no conflict of interest.

References

  1. Sasser, E.; Hemb. Report to Congress on Black Carbon; United States Environmental Protection Agency (EPA): Washington, DC, USA, 2012.
  2. Zhang, X.; Ming, J.; Li, Z.; Wang, F.; Zhang, G. The online measured black carbon aerosol and source orientations in the Nam Co region, Tibet. Environ. Sci. Pollut. Res. 2017, 24, 25021–25033. [Google Scholar] [CrossRef] [PubMed] [Green Version]
  3. Barman, N.; Gokhale, S. Urban black carbon-source apportionment, emissions and long-range transport over the Brahmaputra River Valley. Sci. Total Environ. 2019, 693, 1–14. [Google Scholar] [CrossRef] [PubMed]
  4. Brewer, T.L. Black carbon emissions and regulatory policies in transportation. Energy Policy 2019, 129, 1047–1055. [Google Scholar] [CrossRef]
  5. Smith, K.R.; Jerrett, M.; Anderson, H.R.; Burnett, R.T.; Stone, V.; Derwent, R.; Atkinson, R.W.; Cohen, A.; Shonkoff, S.B.; Krewski, D.; et al. Public health benefits of strategies to reduce greenhouse-gas emissions: Health implications of short-lived greenhouse pollutants. Lancet 2009, 374, 2091–2103. [Google Scholar] [CrossRef] [Green Version]
  6. Wallack, J.S.; Ramanathan, V. The other climate changers: Why black carbon and ozone also matter. Foreign Aff. 2009, 88, 105–113. [Google Scholar]
  7. Bond, T.C.; Doherty, S.J.; Fahey, D.W.; Forster, P.M.; Berntsen, T.; DeAngelo, B.J.; Flanner, M.G.; Ghan, S.; Kärcher, B.; Koch, D.; et al. Bounding the role of black carbon in the climate system: A scientific assessment. J. Geophys. Res. Atmos. 2013, 118, 5380–5552. [Google Scholar] [CrossRef]
  8. Diapouli, E.; Kalogridis, A.C.; Markantonaki, C.; Vratolis, S.; Fetfatzis, P.; Colombi, C.; Eleftheriadis, K. Annual variability of black carbon concentrations originating from biomass and fossil fuel combustion for the suburban aerosol in Athens, Greece. Atmosphere 2017, 8, 234. [Google Scholar] [CrossRef] [Green Version]
  9. Contini, D.; Vecchi, R.; Viana, M. Carbonaceous aerosols in the atmosphere. Atmosphere 2018, 9, 181. [Google Scholar] [CrossRef] [Green Version]
  10. Di Ianni, A.; Costabile, F.; Barnaba, F.; Di Liberto, L.; Weinhold, K.; Wiedensohler, A.; Struckmeier, C.; Drewnick, F.; Gobbi, G.P. Black carbon aerosol in Rome (Italy): Inference of a long-term (2001–2017) record and related trends from AERONET sun-photometry data. Atmosphere 2018, 9, 81. [Google Scholar] [CrossRef] [Green Version]
  11. Wang, R. Global Emission Inventory and Atmospheric Transport of Black Carbon. Ph.D. Thesis, Peking University, Beijing, China, 2015. [Google Scholar]
  12. Janssen, N.A.H.; Gerlofs-Nijland, M.E.; Lanki, T.; Salonen, R.O.; Cassee, F.; Hoek, G.; Fischer, P.; Brunekreef, B.; Krzyzanowski, M. Health Effects of Black Carbon; WHO Regional Office for Europe: Copenhagen, Denmark, 2012. [Google Scholar]
  13. World Health Organization. Ambient Air Pollution: A Global Assessment of Exposure and Burden of Disease; WHO Document Production Services: Geneva, Switzerland, 2016. [Google Scholar]
  14. Secretaría de Medio Ambiente y Recursos Naturales, (SEMARNAT) and Instituto Nacional de Ecología y Cambio Climático (INECC). Inventario Nacional de Emisiones de Gases y Compuestos de Efecto Invernadero 1990–2015; Instituto Nacional de Ecología y Cambio Climático: Mexico City, Mexico, 2018. [Google Scholar]
  15. Watson, J.G.; Chow, J.C. Estimating middle-, neighborhood-, and urban-scale contributions to elemental carbon in Mexico City with a rapid response aethalometer. J. Air Waste Manag. Assoc. 2001, 51, 1522–1528. [Google Scholar] [CrossRef] [Green Version]
  16. Salcedo, D.; Onasch, T.B.; Dzepina, K.; Canagaratna, M.R.; Zhang, Q.; Huffman, A.J.; DeCarlo, P.; Jayne, J.T.; Mortimer, P.; Worsnop, D.R.; et al. Characterization of ambient aerosols in Mexico City during the MCMA-2003 campaign with aerosol mass spectrometry. results from the CENICA Supersite. Atmos. Chem. Phys. 2006, 6, 925–946. [Google Scholar] [CrossRef] [Green Version]
  17. Retama, A.; Baumgardner, D.; Raga, G.B.; McMeeking, G.R.; Walker, J.W. Seasonal and diurnal trends in black carbon properties and co-pollutants in Mexico City. Atmos. Chem. Phys. 2015, 15, 9693–9709. [Google Scholar] [CrossRef] [Green Version]
  18. Peralta, O.; Ortínez-Alvarez, A.; Basaldud, R.; Santiago, N.; Alvarez-Ospina, H.; Cruz, K.; Barrera, V.; Espinosa, M.L.; Saavedra, I.; Castro, T.; et al. Atmospheric black carbon concentrations in Mexico. Atmos. Res. 2019, 230, 104626. [Google Scholar] [CrossRef]
  19. Montelongo-Reyes, M.M.; Otazo-Sánchez, E.M.; Romo-Gómez, C.; Gordillo-Martínez, A.J.; Galindo-Castillo, E. GHG and black carbon emission inventories from Mezquital Valley: The main energy provider for Mexico Megacity. Sci. Total Environ. 2015, 527–528, 455–464. [Google Scholar] [CrossRef]
  20. Raysoni, A.U.; Sarnat, J.A.; Sarnat, S.E.; Garcia, J.H.; Holguin, F.; Flores Luèvano, S.; Li, W.W. Binational school-based monitoring of traffic-related air pollutants in El Paso, Texas (USA) and Ciudad Juárez, Chihuahua (México). Environ. Pollut. 2011, 59, 2476–2486. [Google Scholar] [CrossRef]
  21. Limon-Sanchez, M.T.; Carbajal-Romero, P.; Hernandez-Mena, L.; Saldarriaga-Norena, H.; Lopez-Lopez, A.; Cosio-Ramirez, R.; Arriaga-Colina, J.L.; Smith, W. Black carbon in PM2.5, data from two urban sites in Guadalajara, Mexico during 2008. Atmos. Pollut. Res. 2011, 2, 358–365. [Google Scholar] [CrossRef] [Green Version]
  22. Shores, C.A.; Klapmeyer, M.E.; Quadros, M.E.; Marr, L.C. Sources and transport of black carbon at the California-Mexico border. Atmos. Environ. 2013, 70, 490–499. [Google Scholar] [CrossRef]
  23. Takahama, S.; Russell, L.M.; Shores, C.A.; Marr, L.C.; Zheng, J.; Levy, M.; Zhang, R.; Castillo, E.; Rodriguez-Ventura, J.G.; Quintana, P.J.E.; et al. Diesel vehicle and urban burning contributions to black carbon concentrations and size distributions in Tijuana, Mexico, during the Cal-Mex 2010 campaign. Atmos. Environ. 2014, 88, 341–352. [Google Scholar] [CrossRef]
  24. Liñán-Abanto, R.N.; Peralta, O.; Salcedo, D.; Ruiz-Suárez, L.G.; Arnott, P.; Paredes-Miranda, G.; Alvarez-Ospina, H.; Castro, T. Optical properties of atmospheric particles over an urban site in Mexico City and a peri-urban site in Queretaro. J. Atmos. Chem. 2019, 76, 201–228. [Google Scholar] [CrossRef]
  25. INEGI (Instituto Nacional de Estadística y Geograía). Encuesta Intercensal 2015: Marco Conceptual. 2015. Available online: https://www.inegi.org.mx/contenido/productos/prod_serv/contenidos/espanol/bvinegi/productos/nueva_estruc/702825098742.pdf (accessed on 31 July 2021).
  26. Baumgardner, D.; Grutter, M.; Allan, J.; Ochoa, C.; Rappenglueck, B.; Russell, L.M.; Arnott, P. Physical and chemical properties of the regional mixed layer of Mexico’s Megapolis. Atmos. Chem. Phys. 2009, 9, 5711–5727. [Google Scholar] [CrossRef] [Green Version]
  27. SEMARNAT (Secretaria del Medio Ambiente y Recursos Naturales). Parque Nacional lztaccíhuatl-Popocatépetl. 2016. Available online: https://www.gob.mx/semarnat/articulos/parque-nacional-iztaccihuatl-popocatepetl?idiom=es (accessed on 30 October 2021).
  28. Espinasa, P.R. Historia de la Actividad del Volcán Popocatépetl 17 Años de Erupciones; Centro Nacional de Prevención de Desastres(CENAPRED): Mexico City, Mexico, 2014.
  29. Arnott, W.P.; Moosmüller, H.; Rogers, C.F.; Jin, T.; Bruch, R. Photoacoustic spectrometer for measuring light absorption by aerosol: Instrument description. Atmos. Environ. 1999, 33, 2845–2852. [Google Scholar] [CrossRef]
  30. Wang, Q.; Huang, R.J.; Cao, J.; Han, Y.; Wang, G.; Li, G.; Wang, Y.; Dai, W.; Zhang, R.; Zhou, Y. Mixing state of black carbon aerosol in a heavily polluted urban area of China: Implications for light absorption enhancement. Aerosol Sci. Technol. 2014, 48, 689–697. [Google Scholar] [CrossRef] [Green Version]
  31. Salcedo, D.; Alvarez-Ospina, H.; Peralta, O.; Castro, T. PM1 chemical characterization during the ACU15 campaign, south of Mexico City. Atmosphere 2018, 9, 232. [Google Scholar] [CrossRef] [Green Version]
  32. Bond, T.C.; Habib, G.; Bergstrom, R.W. Limitations in the enhancement of visible light absorption due to mixing state. J. Geophys. Res. Atmos. 2006, 111, D20211. [Google Scholar] [CrossRef]
  33. Velasco, E.; Márquez, C.; Bueno, E.; Bernabé, R.M.; Sánchez, A.; Fentanes, O.; Wöhrnschimmel, H.; Cárdenas, B.; Kamilla, A.; Wakamatsu, S.; et al. Vertical distribution of ozone and VOCs in the low boundary layer of Mexico City. Atmos. Chem. Phys. 2008, 8, 3061–3079. [Google Scholar] [CrossRef] [Green Version]
  34. Johnson, K.S.; Zuberi, B.; Molina, L.T.; Molina, M.J.; Iedema, M.J.; Cowin, J.P.; Gaspar, D.J.; Wang, C.; Laskin, A. Processing of soot in an urban environment: Case study from the Mexico City Metropolitan Area. Atmos. Chem. Phys. 2005, 5, 3033–3043. [Google Scholar] [CrossRef] [Green Version]
  35. Chung, C.E.; Lee, K.; Müller, D. Effect of internal mixture on black carbon radiative forcing. Tellus B Chem. Phys. Meteorol. 2012, 64, 10925. [Google Scholar] [CrossRef] [Green Version]
  36. Liu, S.; Aiken, A.C.; Gorkowski, K.; Dubey, M.K.; Cappa, C.D.; Williams, L.R.; Herndon, S.C.; Massoli, P.; Fortner, E.C.; Chhabra, P.S.; et al. Enhanced light absorption by mixed source black and brown carbon particles in UK winter. Nat. Commun. 2015, 6, 1–10. [Google Scholar] [CrossRef] [Green Version]
  37. Gyawali, M.; Arnott, W.P.; Lewis, K.; Moosmüller, H. In situ aerosol optics in Reno, NV, USA during and after the summer 2008 California wildfires and the influence of absorbing and non-absorbing organic coatings on spectral light absorption. Atmos. Chem. Phys. 2009, 9, 8007–8015. [Google Scholar] [CrossRef] [Green Version]
  38. Pavia, R. Eficiencia de Absorción de Masa de Carbono Elemental y Propiedades Ópticas de Partículas Atmosféricas PM2.5. Master’s Thesis, Universidad Nacional Autónoma de México, Mexico City, Mexico, 2017. [Google Scholar]
  39. Knox, A.; Evans, G.J.; Brook, J.R.; Yao, X.; Jeong, C.-H.; Godri, K.J.; Sabaliauskas, K.; Slowik, J.G. Mass Absorption Cross-Section of Ambient Black Carbon Aerosol in Relation to Chemical Age. Aerosol Sci. Technol. 2009, 43, 522–532. [Google Scholar] [CrossRef]
  40. Taheri, A.; Aliasghari, P.; Hosseini, V. Black carbon and PM2.5 monitoring campaign on the roadside and residential urban background sites in the city of Tehran. Atmos. Environ. 2019, 218, 116928. [Google Scholar] [CrossRef]
  41. INEGI (Instituto Nacional de Estadística y Geograía). Transporte—Parque Vehicular. 2017. Available online: https://www.inegi.org.mx/temas/vehiculos/ (accessed on 20 July 2020).
Figure 1. National Park (ALTZ) and semi-urban (JQRO) sites.
Atmosphere 13 00216 g001
Figure 2. Time series of hourly BC concentrations at (a) JQRO and (b) ALTZ during 2017.
Atmosphere 13 00216 g002
Figure 3. Average daily profile of BC in JQRO and ALTZ for 2017. The shading highlights the standard deviation.
Atmosphere 13 00216 g003
Figure 4. Average weekly profile of BC in JQRO and ALTZ for 2017. The shading highlights the standard deviation.
Atmosphere 13 00216 g004
Figure 5. Polar plots of BC concentrations over JQRO: (a) S1, (b) S2, (c) S3 and (d) S4.
Atmosphere 13 00216 g005
Figure 6. Polar plots of BC concentrations over ALTZ: (a) S1, (b) S2, (c) S3 and (d) S4.
Atmosphere 13 00216 g006
Table 1. Seasonal BC concentrations (µg m−3) for JQRO and ALTZ in 2015 (Peralta et al. [18]) and 2017. Average and standard deviations are shown.
SeasonJQRO 2015ALTZ 2015JQRO 2017ALTZ 2017
S1 (dry-cold)
January–March
0.65 ± 0.46-0.91 ± 0.740.55 ± 0.34
S2 (dry-hot)
April–June
0.81 ± 0.310.26 ± 0.090.83 ± 0.570.63 ± 0.33
S3 (rainy)
July–September
0.68 ± 0.270.48 ± 0.80.62 ± 0.470.43 ± 0.25
S4 (dry-cold)
October–December
0.79 ± 0.490.34 ± 0.420.93 ± 0.840.72 ± 0.45
Annual0.750.270.84 ± 0.700.58 ± 0.37
Table 2. Monthly temperature (°C), radiation (Wm−2) and BC concentration (µg m−3) data of JQRO and ALTZ in 2017.
Jan.Feb.Mar.Apr.MayJun.Jul.Aug.Sep.Oct.Nov.Dec.
JQRO
Temp15.4817.3618.2620.3522.8721.2319.0620.0418.0817.3416.3914.58
Rad382.24456.58463.96533.39487.34460.86412.37448.44436.59443.04499.53427.87
BC1.070.920.730.781.000.700.62-0.630.680.881.24
ALTZ
Temp3.963.553.695.786.966.145.045.875.814.986.094.34
Rad474.42500.17418.57457.77404.77305.11334.23369.74274.70370.26498.49486.82
BC0.450.640.550.710.770.420.380.450.460.610.770.77
Publisher’s Note: MDPI stays neutral with regard to jurisdictional claims in published maps and institutional affiliations.

