
Analysis of the Influence of Convection Heat Transfer in Circular Tubes on Ships in a Polar Environment

Abstract
:1. Introduction
2. Method
2.1. Principle
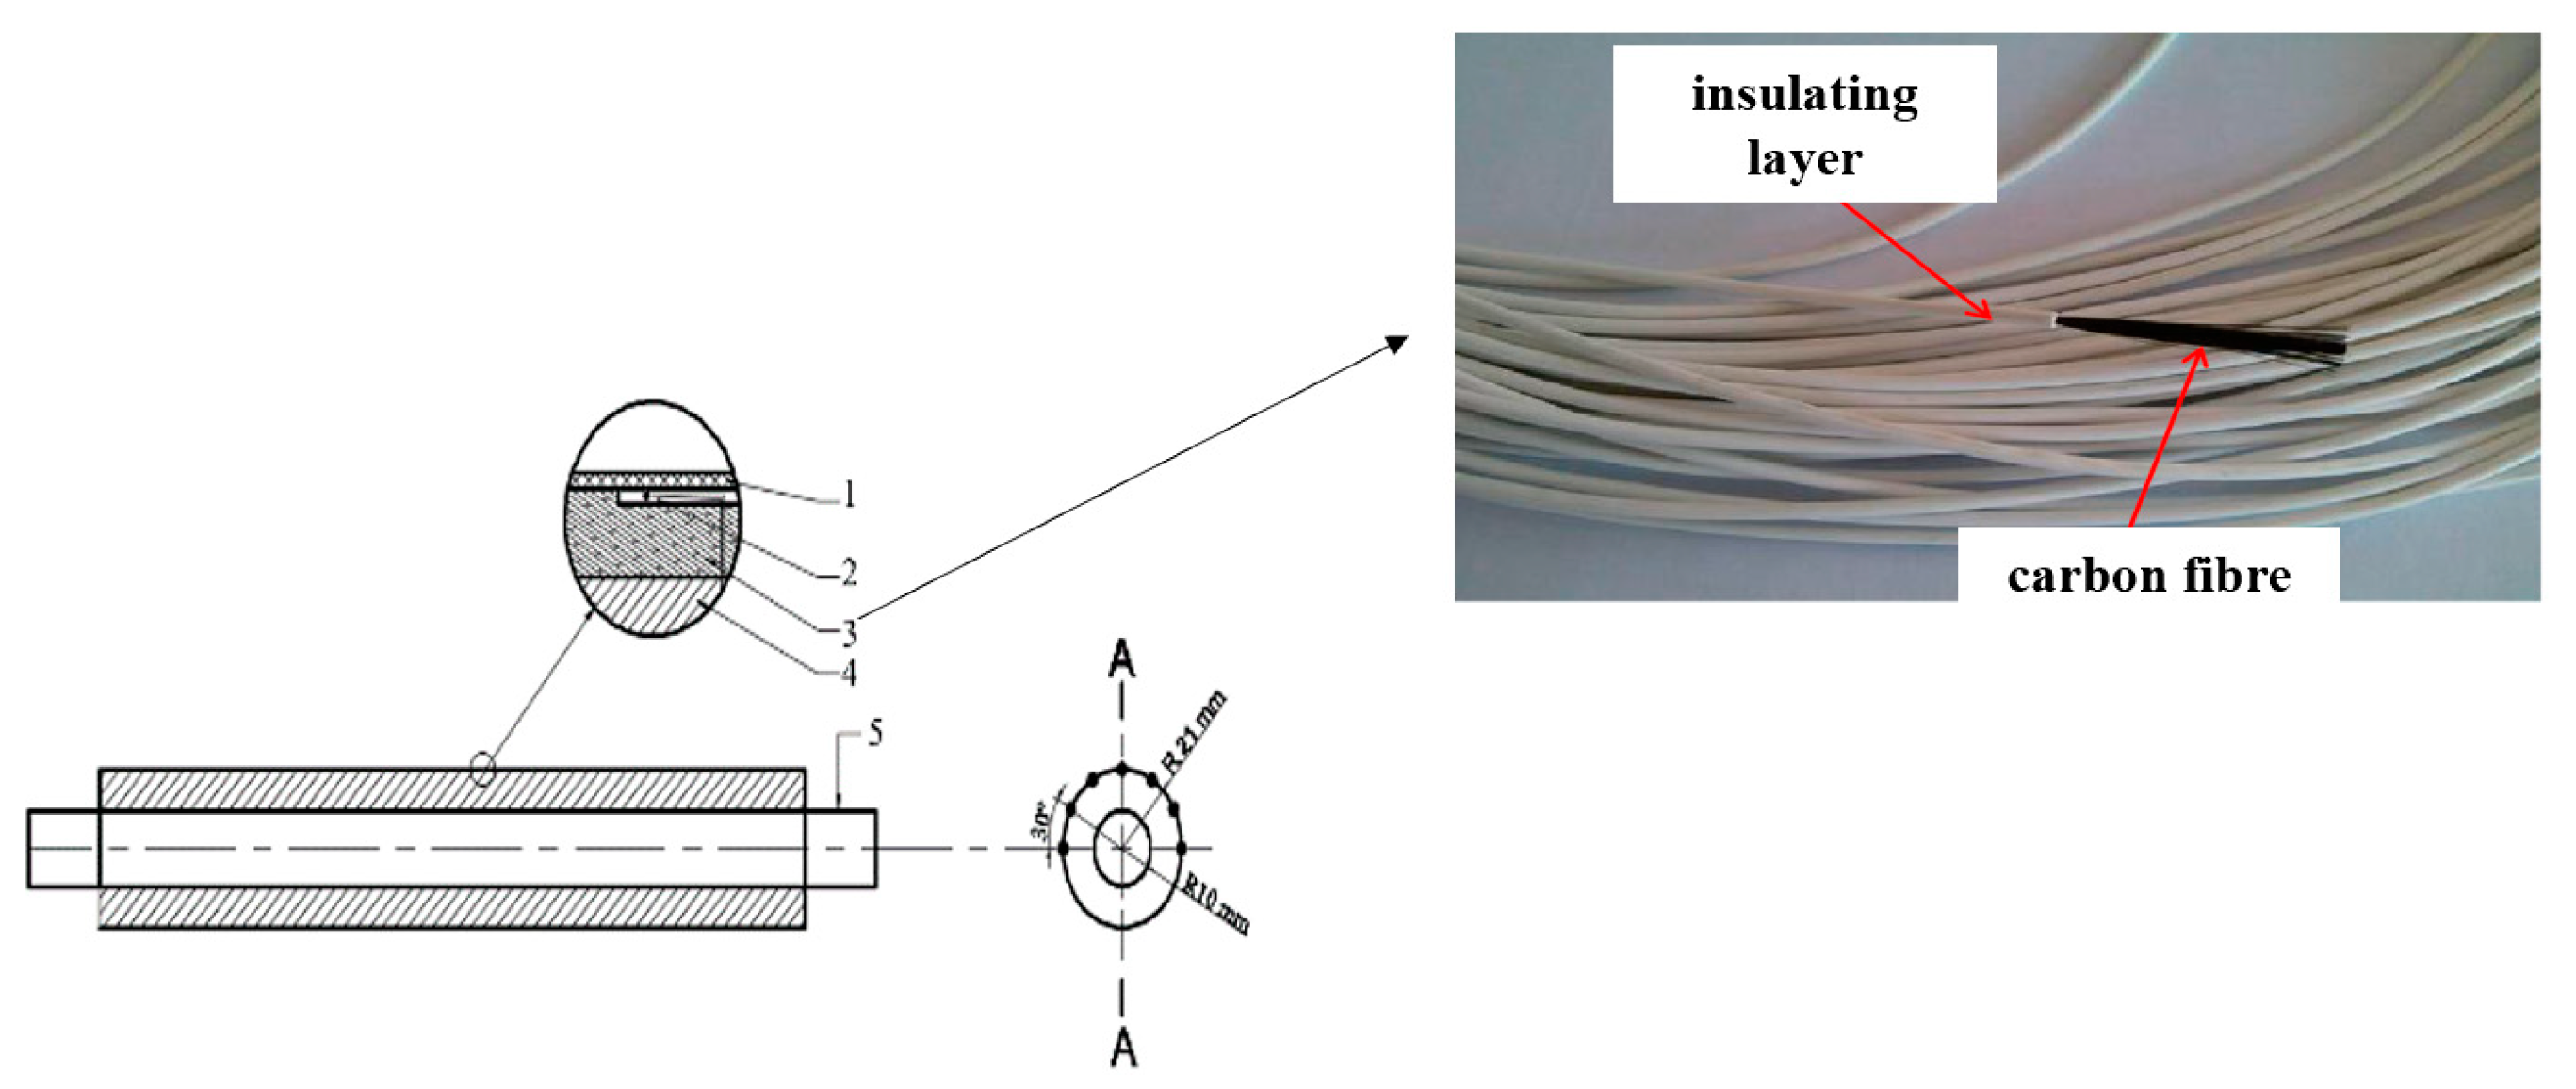
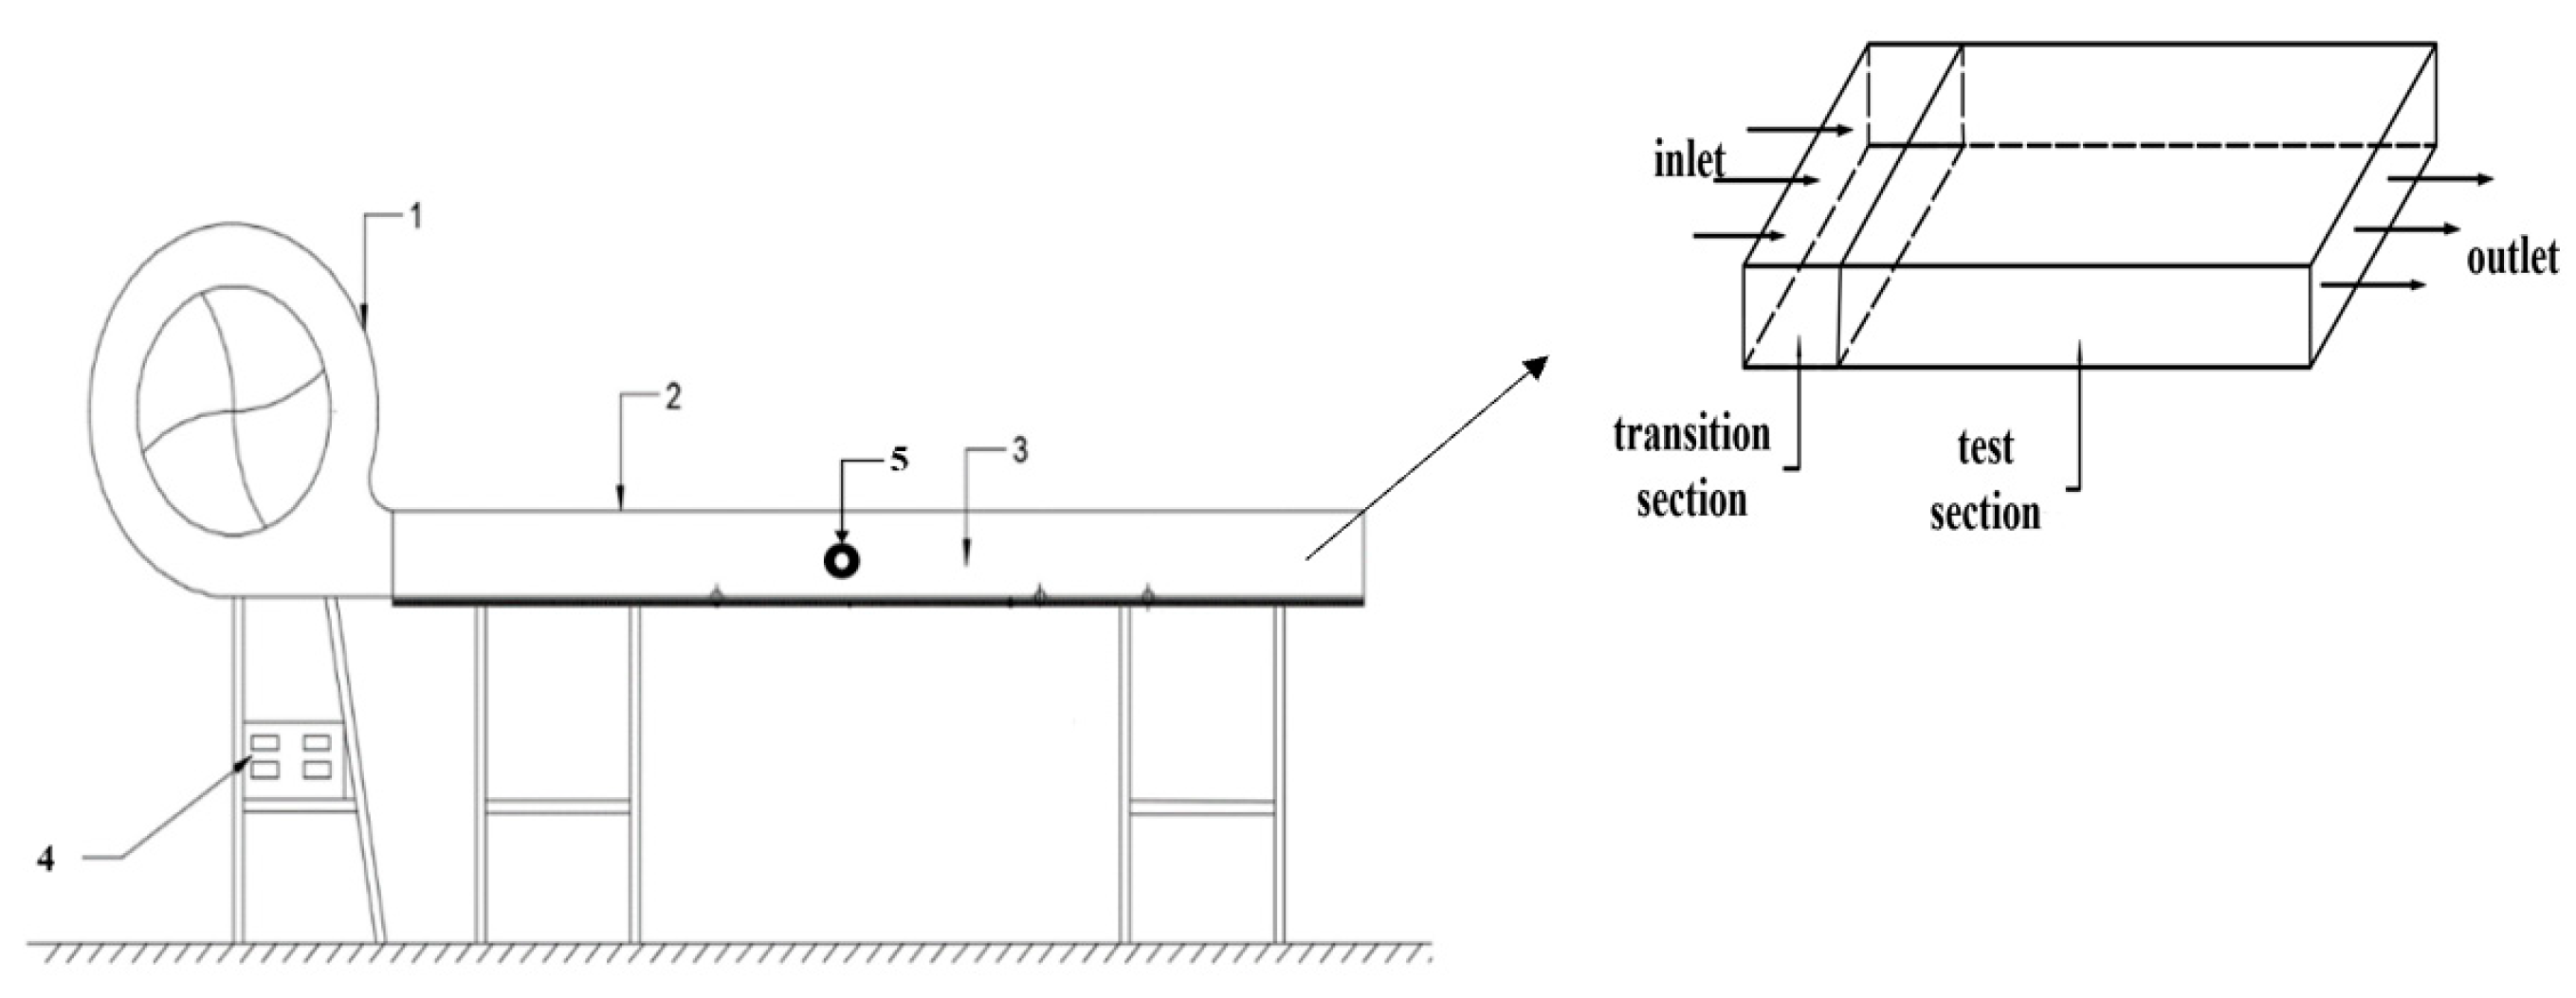
2.2. System
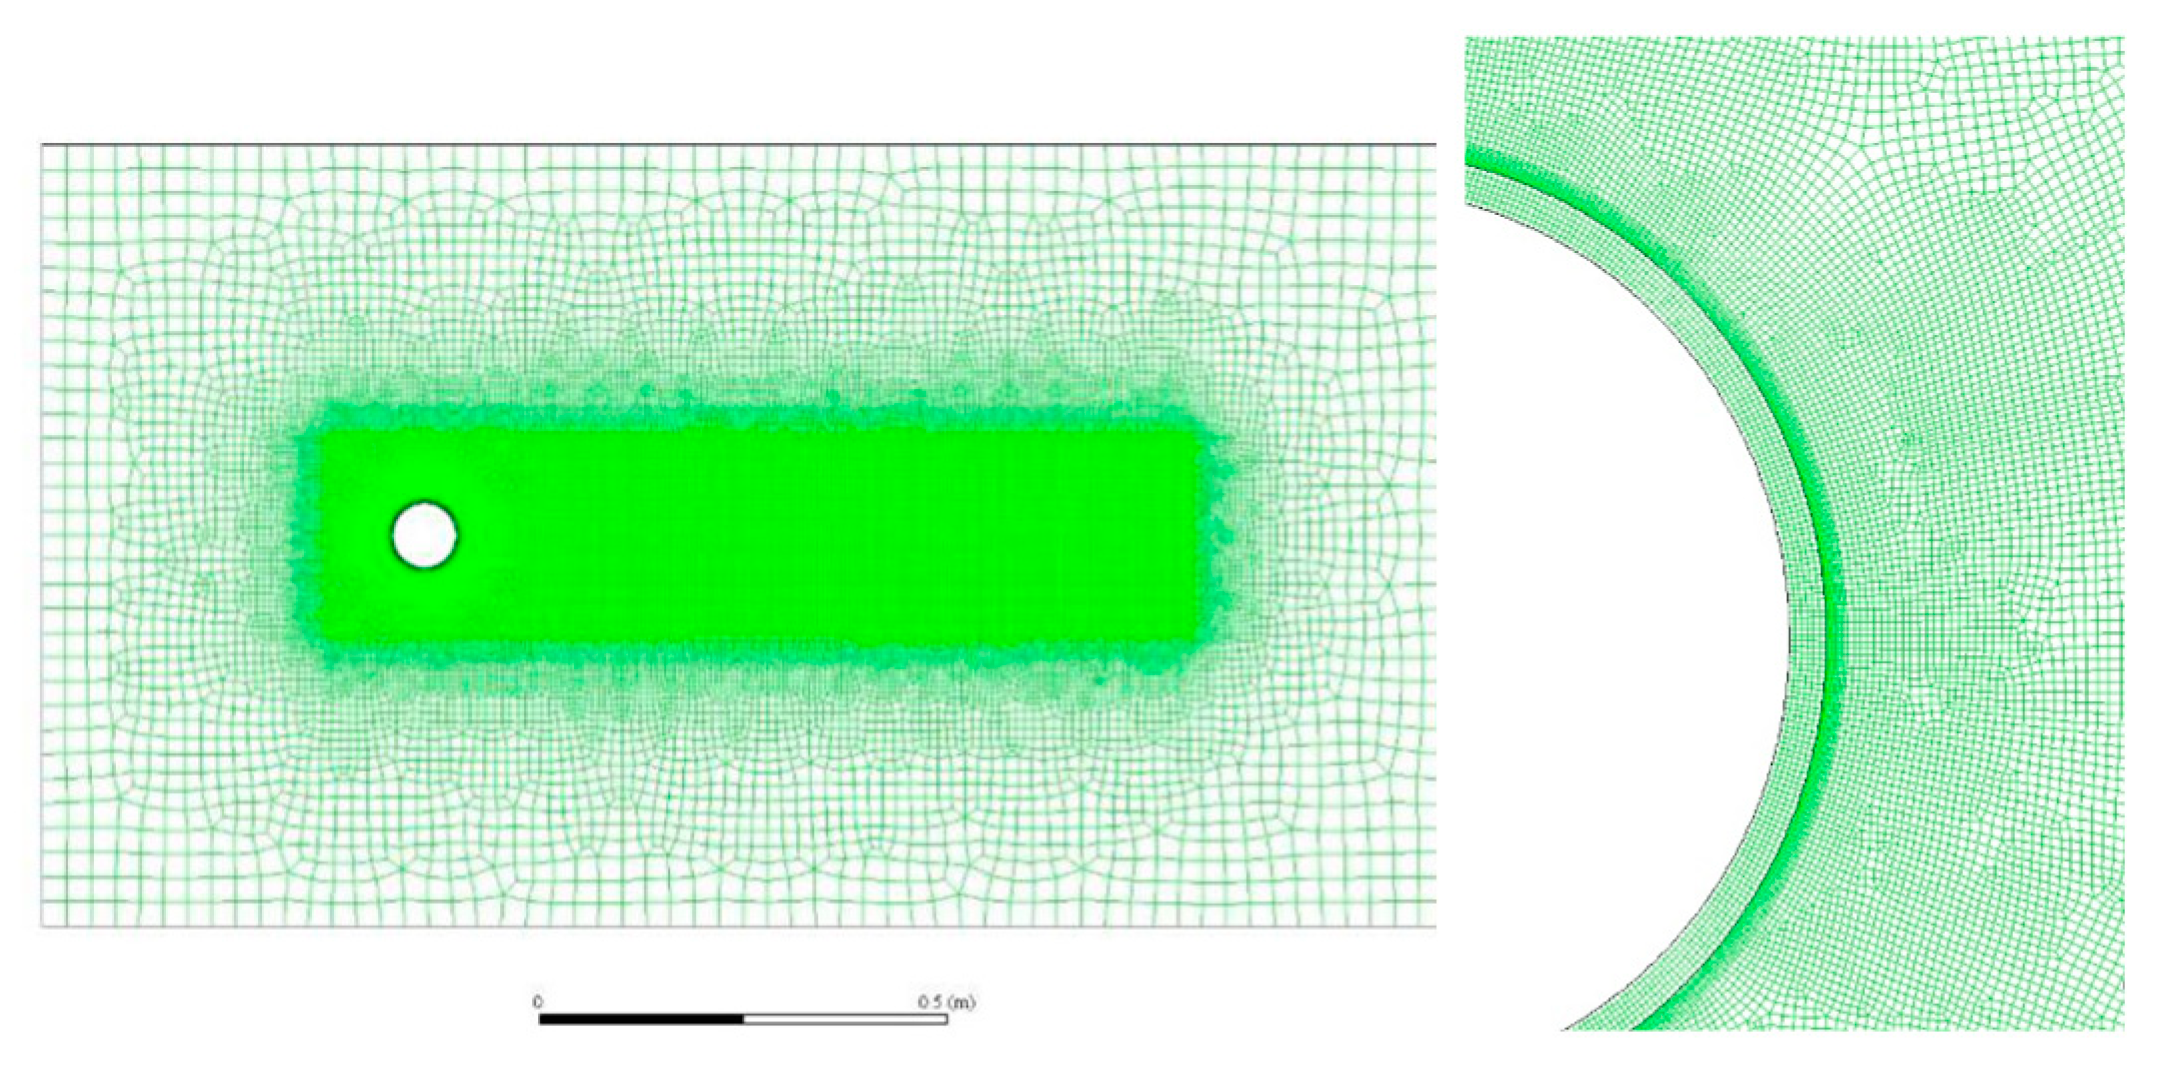
3. Simulation
3.1. Results and Discussion
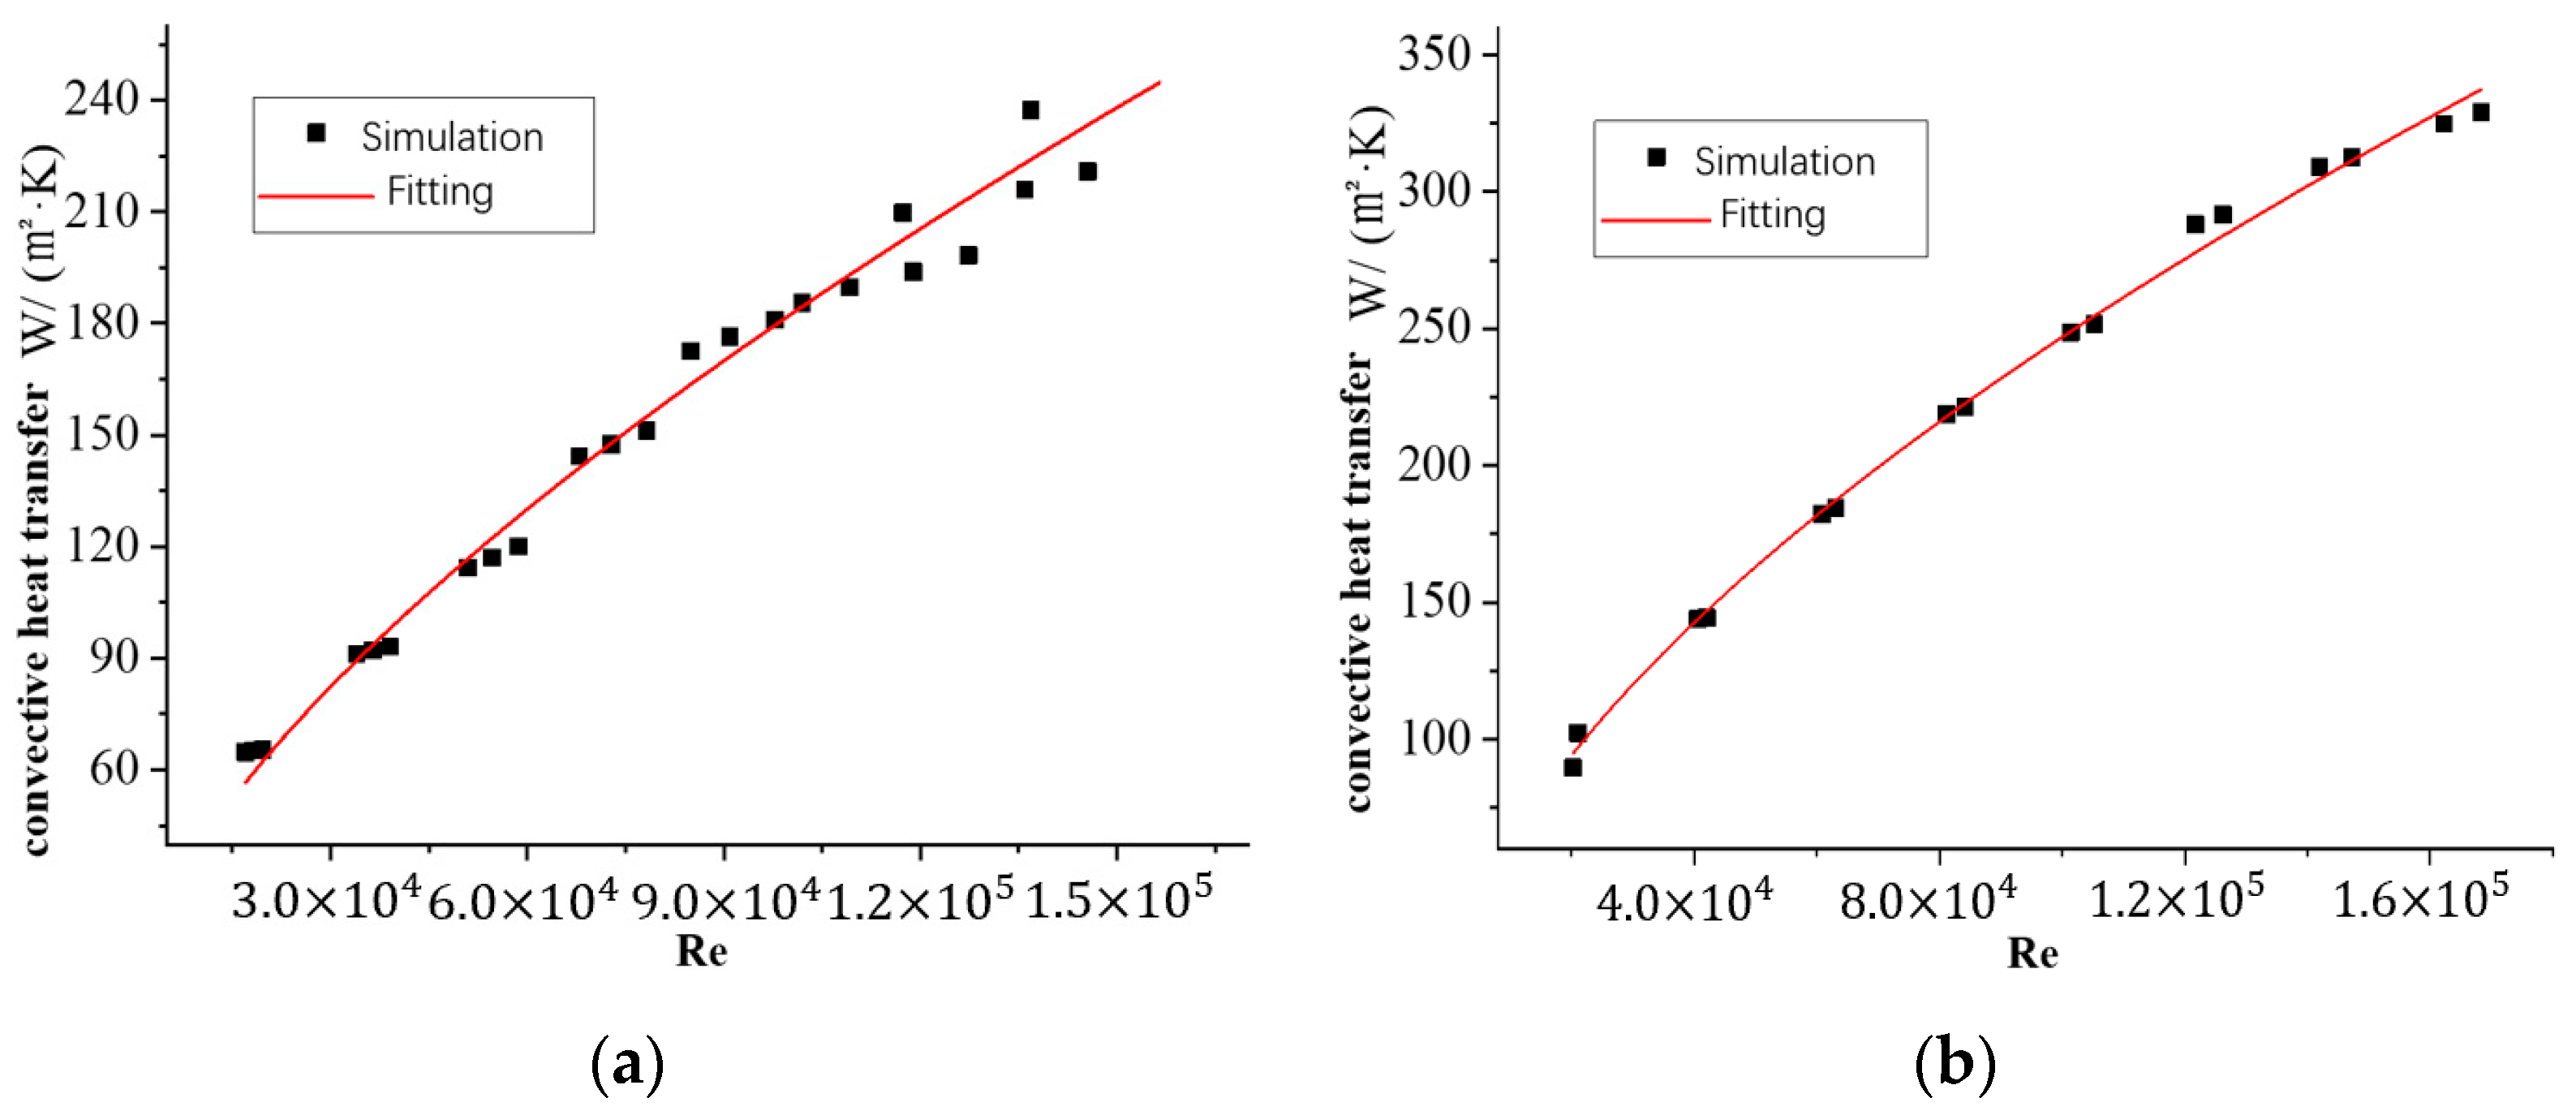
3.2. Prediction Model
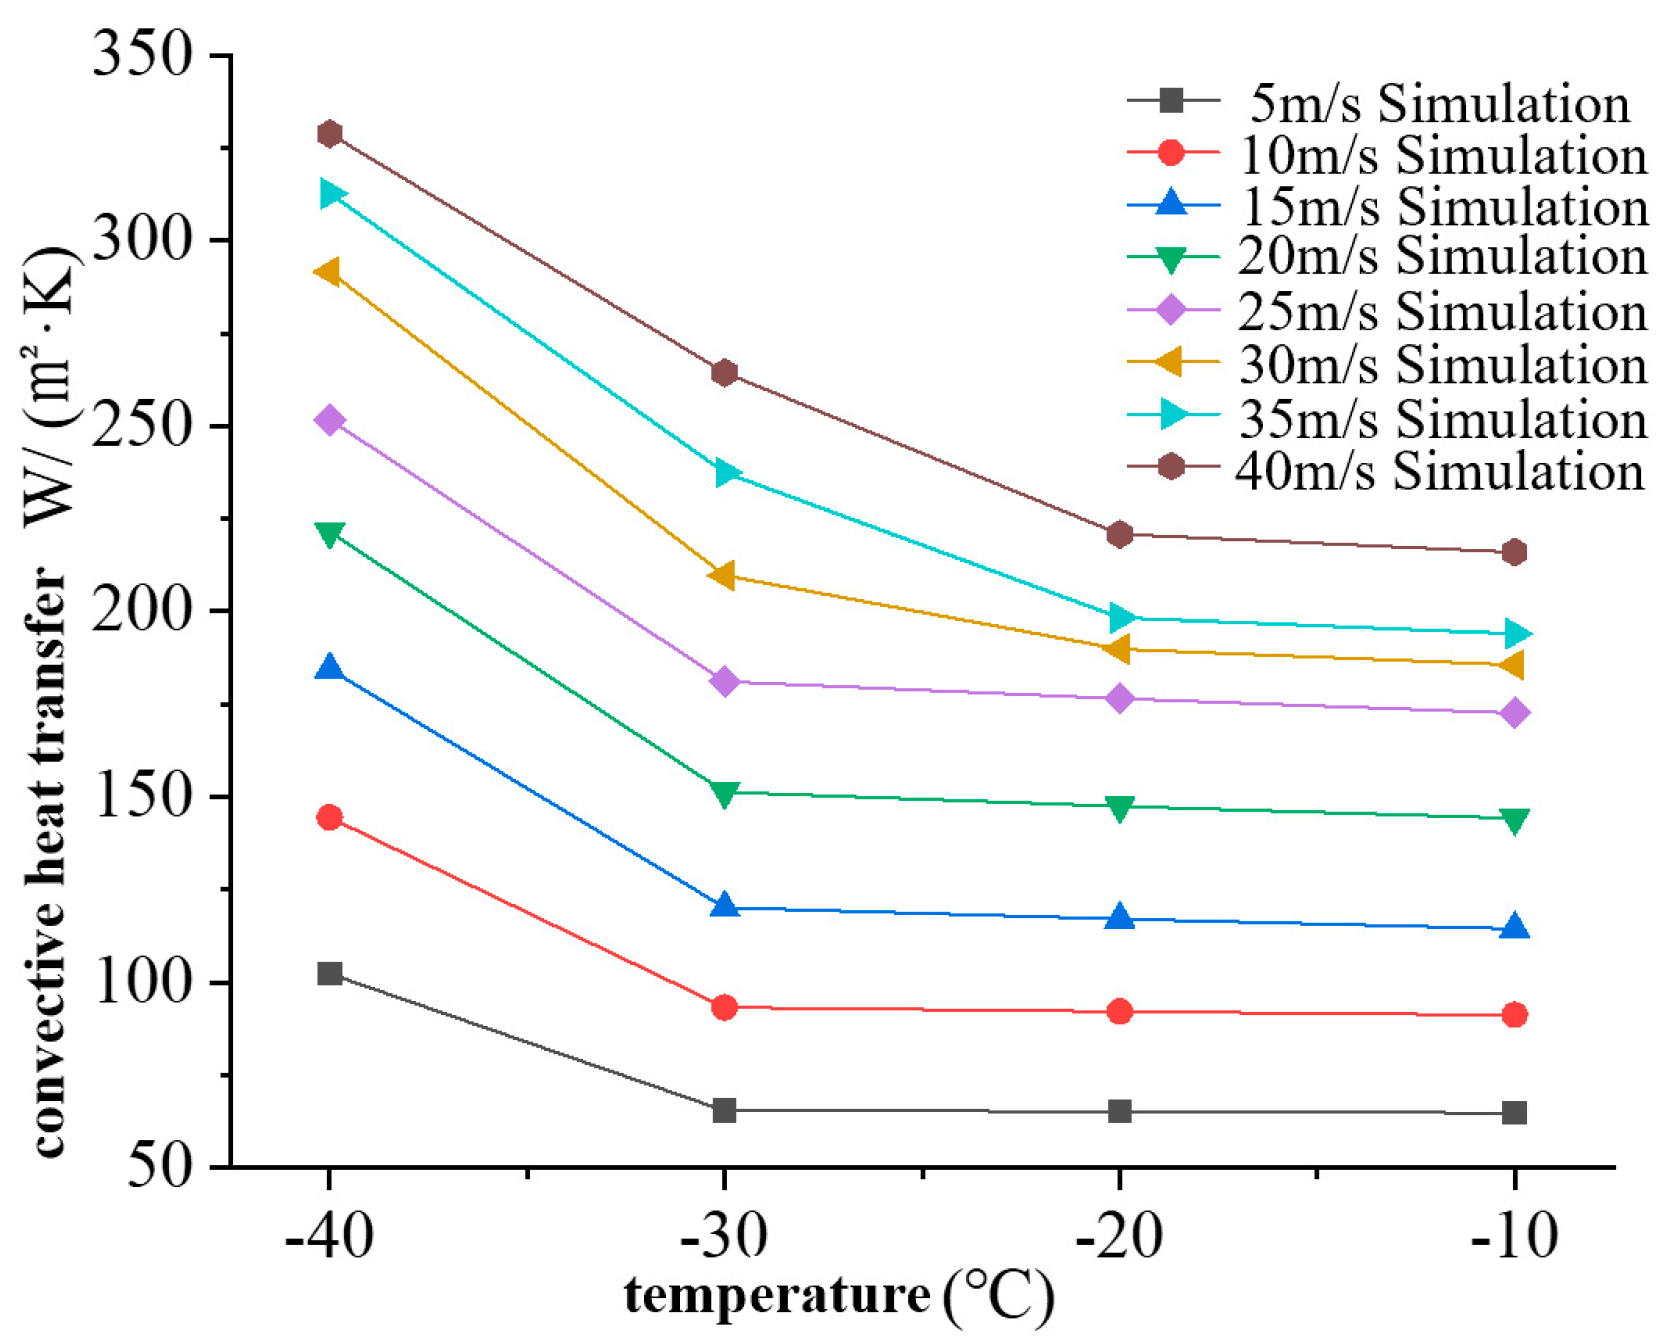
- (1)
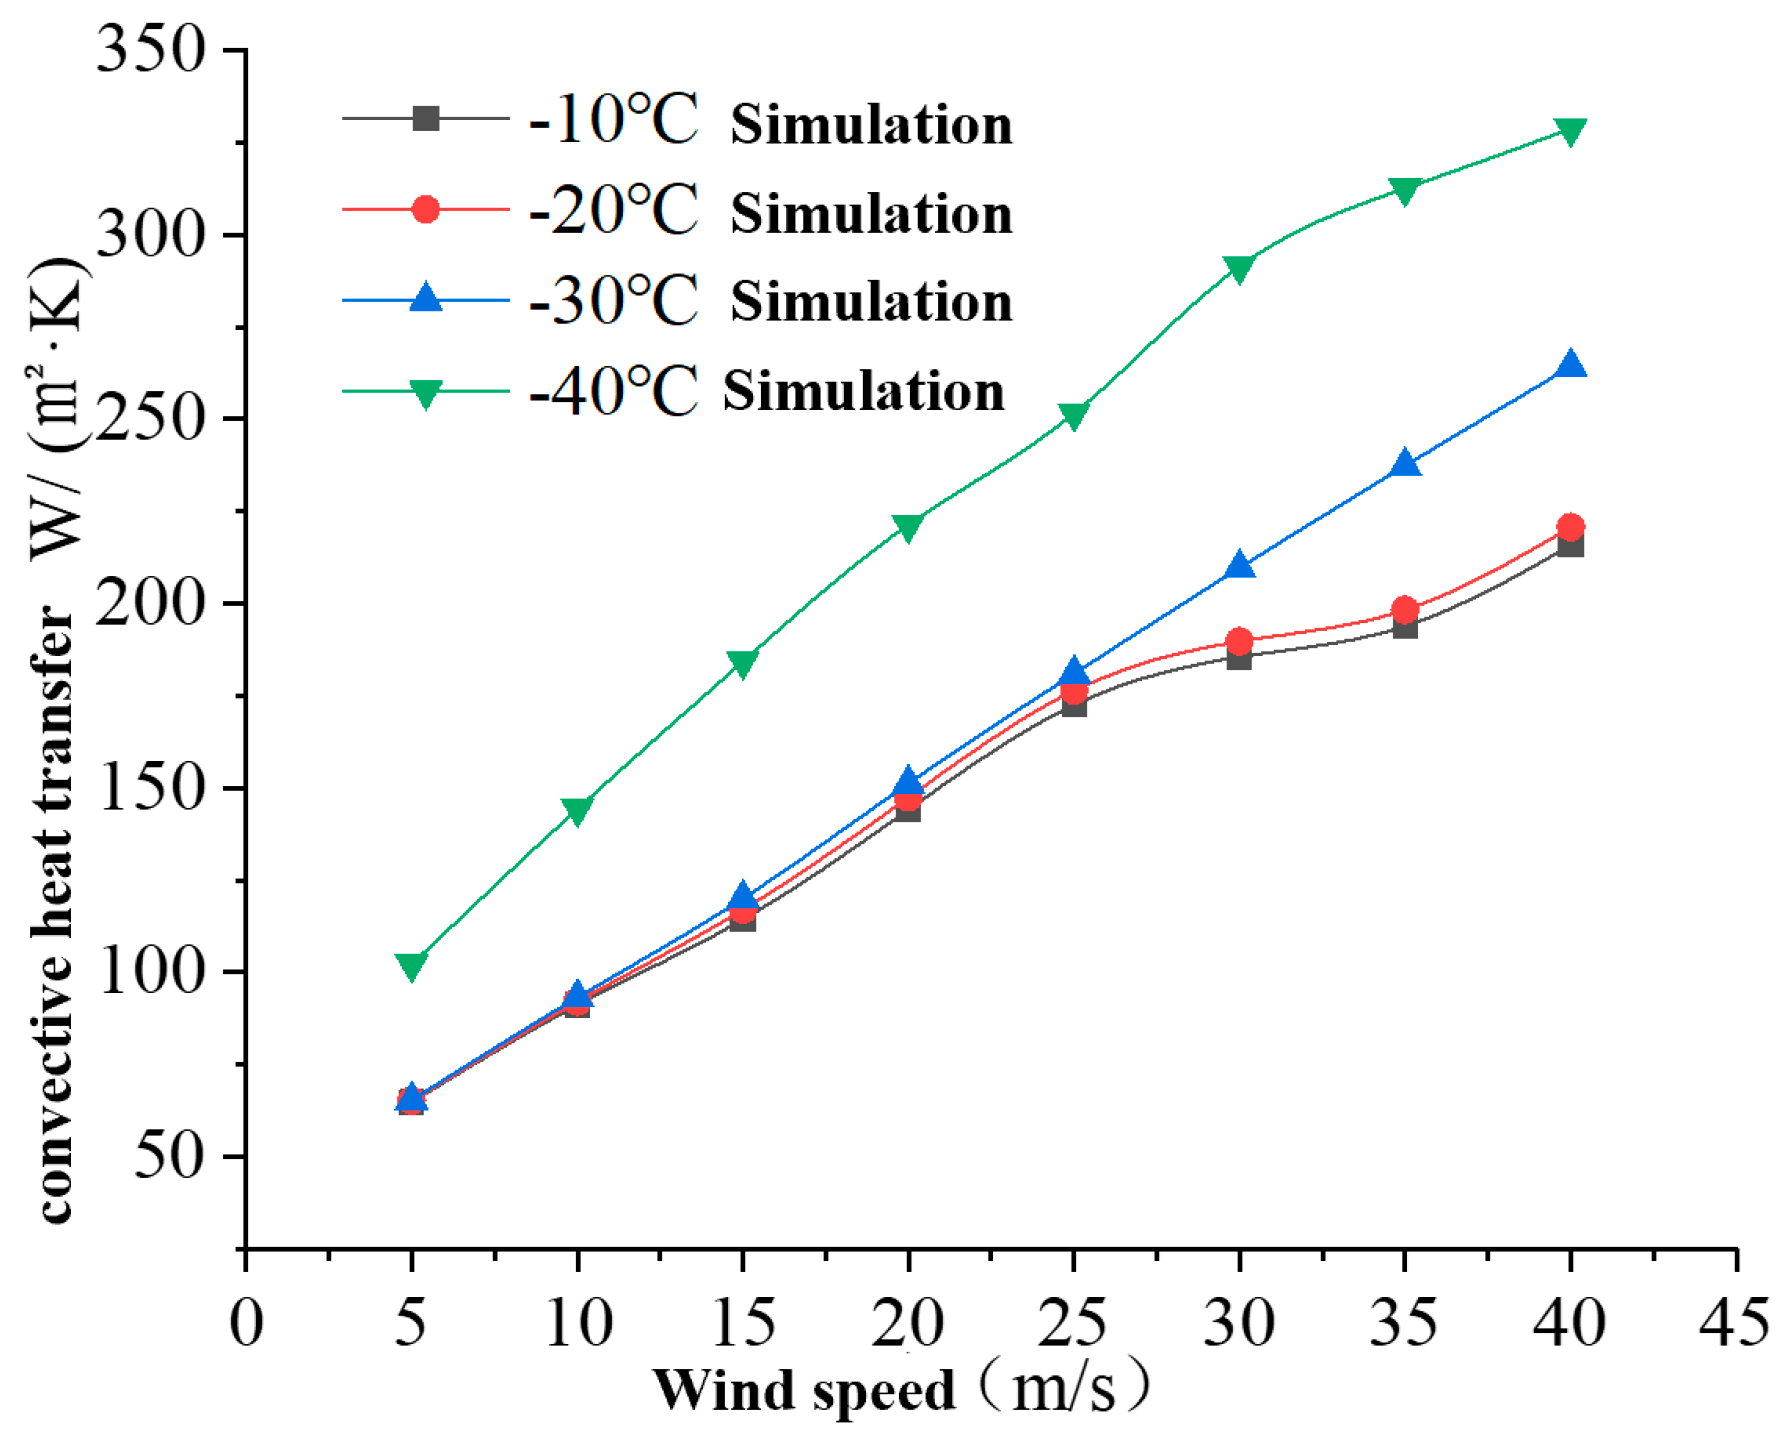
- Temperature −20–0 °C: When wind speed is less than 25 m/s, the convective heat transfer coefficient increases by 1.7% when the temperature decreases by 10 °C. The convective heat transfer coefficient increases by 21.2% when the wind speed increases by 5 m/s. When the wind speed is greater than 25 m/s, the convective heat transfer coefficient increases by 2.2% when the temperature decreases by 10 °C. The convective heat transfer coefficient increases by 7.8% when the wind speed increases by 5 m/s.
- (2)
- Temperature −30–−20 °C: When wind speed is less than 25 m/s, the convective heat transfer coefficient increases by 1.9% when the temperature decreases by 10 °C. The convective heat transfer coefficient increases by 22.4% when the wind speed increases by 5 m/s. When the wind speed is greater than 25 m/s, the convective heat transfer coefficient increases by 1.7% when the temperature decreases by 10 °C. The convective heat transfer coefficient increases by 13.5% when the wind speed increases by 5 m/s.
- (3)
- Temperature −40–−30 °C: When wind speed is less than 25 m/s, the convective heat transfer coefficient increases by 43.2% when the temperature decreases by 10 °C. The convective heat transfer coefficient increases by 23.6% when the wind speed increases by 5 m/s. When the wind speed is greater than 25 m/s, the convective heat transfer coefficient increases by 31.7% when the temperature decreases by 10 °C. The convective heat transfer coefficient increases by 9.4% when the wind speed increases by 5 m/s.
4. Experimental Section
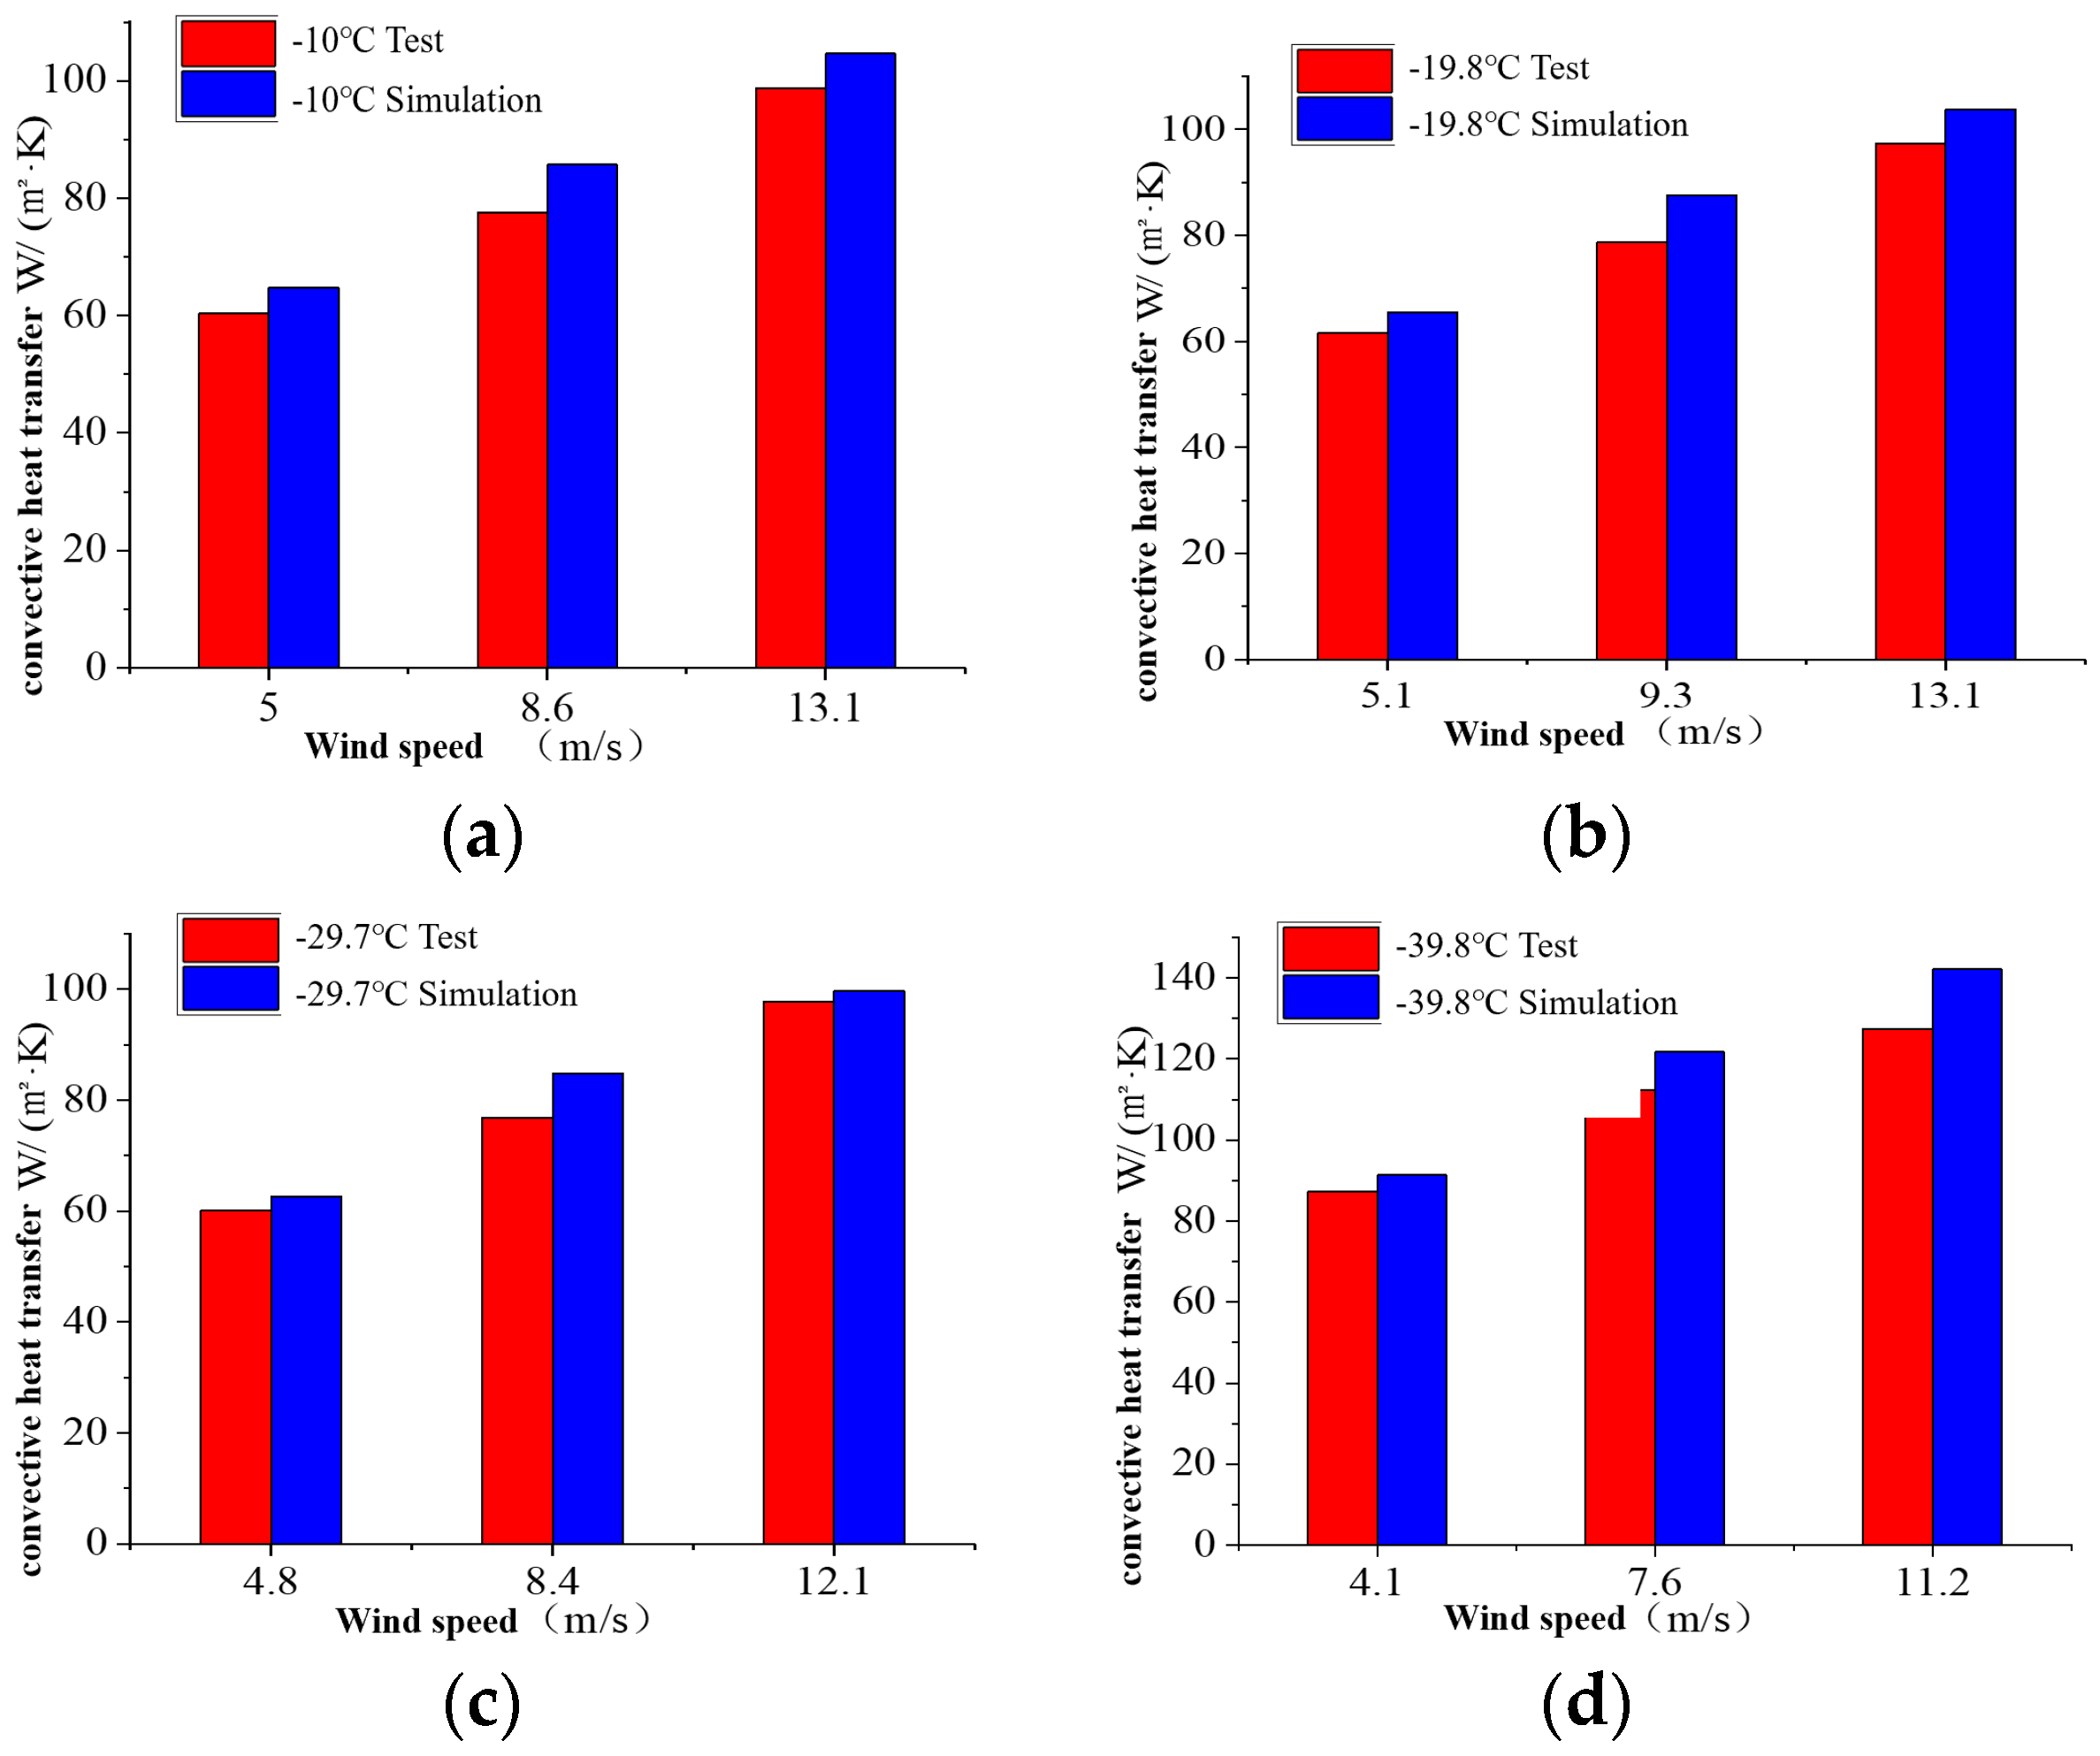
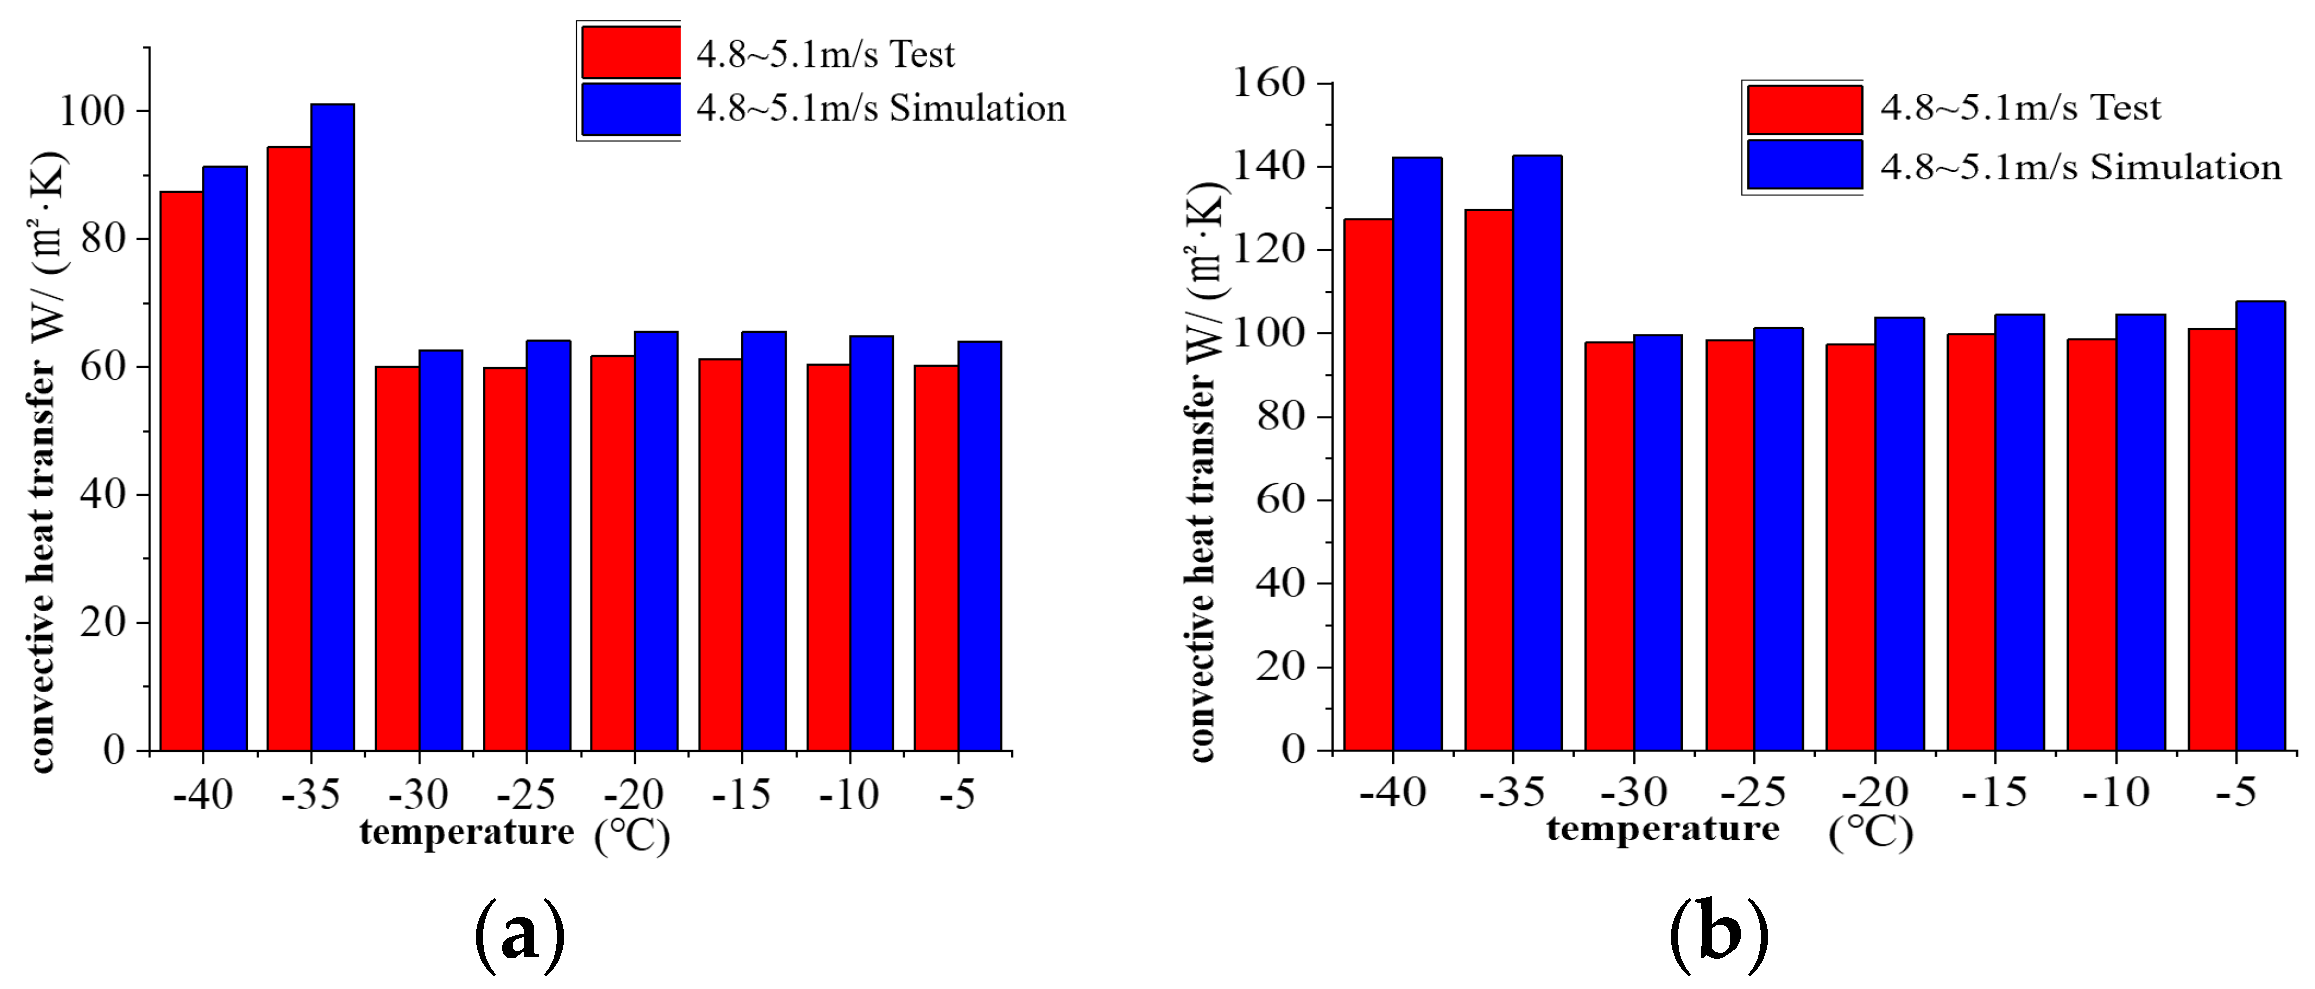
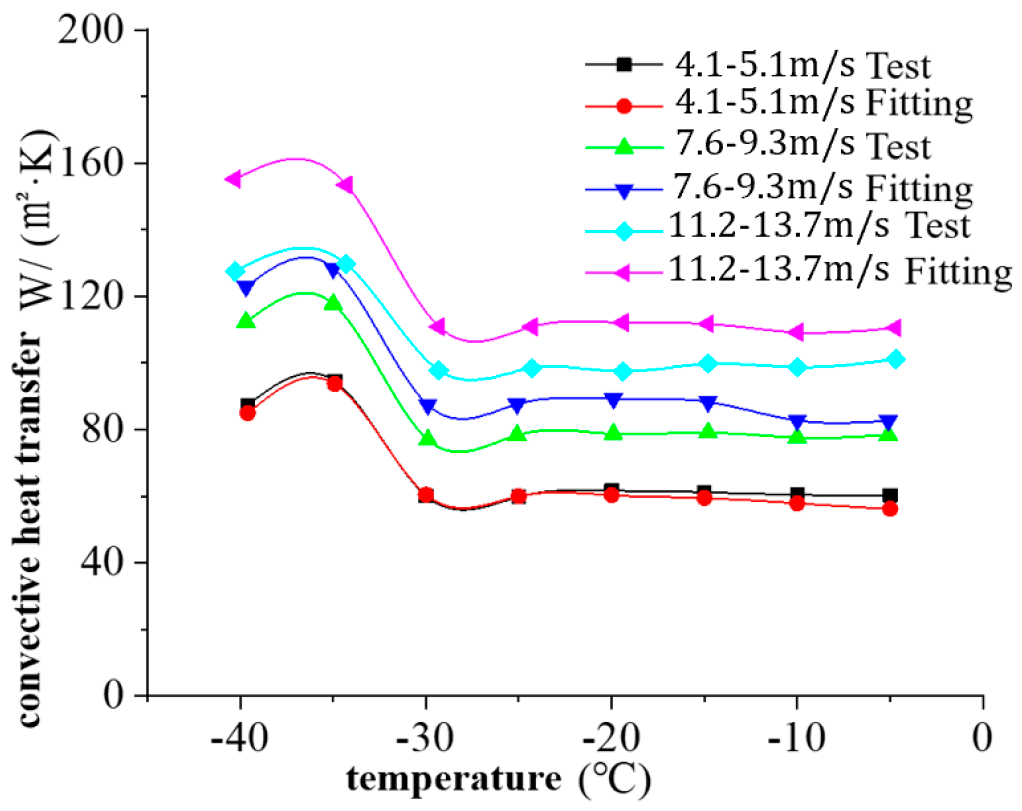
4.1. Results and Discussion
- (1)
- The measuring temperature of the tube fluctuates periodically in this test; K temperature thermocouple accuracy is 1%; and
- (2)
- Each group of tests is conditioned three times; considering the influence of flow separation, the average value of each measuring point is taken as the average heat transfer coefficient.
4.2. Prediction Models
5. Conclusions
- (1)
- Convective heat transfer in circular tubes increases with the increase in wind speed and the decrease in temperature.
- (2)
- When the temperature is lower than −30 °C, the effect of temperature on convective heat transfer is increased.
- (3)
- When the wind speed is greater than 25 m/s and the temperature is lower than −20 °C, the effect of temperature on convective heat transfer is increased.
- (4)
- Based on the simulation data, the prediction model of the convective heat transfer coefficient in circular tubes can be established.
Author Contributions
Funding
Conflicts of Interest
References
- Shen, J.; Bai, X. Numerical simulation of ice formation of polar offshore platform deck structure based on fluent and FENSAP-ICE. Polar Res. 2020, 32, 177–183. [Google Scholar]
- Lu, X.; Cui, M.; Cao, H.; Song, Y. Status and development of anti freezing and deicing technology of ships. Ship Ocean. Eng. 2016, 45, 37–39. [Google Scholar]
- Roeder, W.; Baen, P.; Seitz, R. Electric trace heat design methods for de-icing and anti-icing of vessels, support equipment and infrastructure in the Arctic. In Oceans 2017-Anchorage; IEEE: Piscataway, NJ, USA, 2017; pp. 1–7. [Google Scholar]
- Al-Mdallal, Q.M.; Mahfouz, F.M. Heat transfer from a heated non-rotating cylinder performing circular motion in a uniform stream. Int. J. Heat Mass Transf. 2017, 112, 147–157. [Google Scholar] [CrossRef]
- Zhou, B. Numerical Analysis of Convective Heat Transfer of Horizontal Swept Circular Tube and Non-Circular Tube; Shanghai University of Technology: Shanghai, China, 2018. [Google Scholar]
- Ikhtiar, U.; Manzoor, S.; Sheikh, N.A.; Ali, M. Free stream flow and forced convection heat transfer around a rotating circular cylinder subjected to a single gust impulse. Int. J. Heat Mass Transf. 2016, 99, 851–861. [Google Scholar] [CrossRef]
- Wan, P.; Han, X.; Mao, J. Very Large Eddy Simulation of turbulent flow and heat transfer for single cylinder and cylindrical pin matrix. Appl. Therm. Eng. 2020, 169, 114972. [Google Scholar] [CrossRef]
- Li, X. Study on the Flow and Heat Transfer Law of Low Temperature Seawater in a Circular Tube. Available online: http://zkjournal.upc.edu.cn/ch/reader/download_pdf_file.aspx?journal_id=zgsydxxb&file_name=AEF80878E95ACAA3B101F36464613C82A20225EB740A869F9AF908C2817E8D00759F6EB7AC30B22E91BD883C6B17CED1DE18A4F0C5D32F74ADC80CC1D800D496&open_type=self&file_no=20180615 (accessed on 5 December 2021).
- Churchill, S.W.; Bernstein, M. A Correlating Equation for Forced Convection from Gases and Liquids to a Circular Cylinder in Crossflow. ASME Trans. J. Heat Transf. 1977, 99, 300–306. [Google Scholar] [CrossRef]
- Dhiman, S.K.; Kumar, A.; Prasad, J.K. Unsteady computation of flow field and convective heat transfer over tandem cylinders at subcritical Reynolds numbers. J. Mech. Sci. Technol. 2017, 31, 1241–1257. [Google Scholar] [CrossRef]
- ABS 2 Polar Waters Guide-2008 (E 2008). Guide for Building and Classing Vessels Intended for Navigation in Polar Waters. Available online: http://www.gov.cn/xinwen/2016-12/20/5150611/files/daeacb18184c49b986731d9042ef61f6.pdf (accessed on 5 December 2021).
- China Classification Society. Guide to Polar Ships. Available online: https://www.ccs.org.cn/ccswzen/ (accessed on 5 December 2021).
- Incropera, F.P.; Dewitt, D.P. Fundamentals of Heat and Mass Transfer, 5th ed.; John Wiley & Sons: Hoboken, NJ, USA, 2002; pp. 389–395. [Google Scholar]


| Experimental Test Apparatus | No. | Measuring Range | Precision |
|---|---|---|---|
| Temperature instrument | 1 | −50–220 (°C) | 0.01 (°C) |
| K temperature thermocouple | 7 | −50–220 (°C) | 1% |
| NK1000 anemometer | 1 | 0.6–60 (m/s) | 3% |
| Temperature | Wind Speed | Influence of Temperature on H Increase | Influence of Wind Speed on H Increase |
|---|---|---|---|
| −20–0 (°C) | <25 (m/s) | 1.7 (%) | 21.2 (%) |
| >25 (m/s) | 2.2 (%) | 7.8 (%) | |
| −30–−20 (°C) | <25 (m/s) | 1.9 (%) | 22.4 (%) |
| >25 (m/s) | 1.7 (%) | 13.5 (%) | |
| −40–−30 (°C) | <25 (m/s) | 43.2 (%) | 23.6 (%) |
| >25 (m/s) | 31.7 (%) | 9.4 (%) |
| Temperature | Prandtl Number | Thermal Conductivity |
|---|---|---|
| −30–0 (°C) | 0.707–0.723 | 0.0220–0.0236 (W/(m·°C)) |
| −40–−30 (°C) | 0.723–0.728 | 0.0212–0.0220 (W/(m·°C)) |
| No. | Temperature | Wind | Measured Convective Heat Transfer Coefficient |
|---|---|---|---|
| 1 | −5 (°C) | 4.9 (m/s) | 60.2 (W/(m2 °C)) |
| 2 | −5.1 (°C) | 8.8 (m/s) | 78.3 (W/(m2 °C)) |
| 3 | −4.7 (°C) | 13.7 (m/s) | 101.2 (W/(m2 °C)) |
| 4 | −10.0 (°C) | 5.0 (m/s) | 60.4 (W/(m2 °C)) |
| 5 | −10.0 (°C) | 8.6 (m/s) | 77.6 (W/(m2 °C)) |
| 6 | −10 (°C) | 13.1 (m/s) | 98.7 (W/(m2 °C)) |
| 7 | −15 (°C) | 5.1 (m/s) | 61.2 (W/(m2 °C)) |
| 8 | −14.8 (°C) | 9.3 (m/s) | 79.1 (W/(m2 °C)) |
| 9 | −14.8 (°C) | 13.3 (m/s) | 99.8 (W/(m2 °C)) |
| 10 | −20 (°C) | 5.1 (m/s) | 61.7 (W/(m2 °C)) |
| 11 | −19.9 (°C) | 9.3 (m/s) | 78.7 (W/(m2 °C)) |
| 12 | −19.4 (°C) | 13.1 (m/s) | 97.4 (W/(m2 °C)) |
| 13 | −25 (°C) | 4.9 (m/s) | 59.8 (W/(m2 °C)) |
| 14 | −25.1 (°C) | 8.7 (m/s) | 78.3 (W/(m2 °C)) |
| 15 | −24.3 (°C) | 12.5 (m/s) | 98.5 (W/(m2 °C)) |
| 16 | −30 (°C) | 4.8 (m/s) | 60.1 (W/(m2 °C)) |
| 17 | −29.9 (°C) | 8.4 (m/s) | 76.9 (W/(m2 °C)) |
| 18 | −29.3 (°C) | 12.1 (m/s) | 97.8 (W/(m2 °C)) |
| 19 | −34.9 (°C) | 4.9 (m/s) | 94.5 (W/(m2 °C)) |
| 20 | −35 (°C) | 8.3 (m/s) | 117.7 (W/(m2 °C)) |
| 21 | −34.3 (°C) | 11.2 (m/s) | 129.7 (W/(m2 °C)) |
| 22 | −39.6 (°C) | 4.1 (m/s) | 87.4 (W/(m2 °C)) |
| 23 | −39.7 (°C) | 7.6 (m/s) | 112.3 (W/(m2 °C)) |
| 24 | −40.3 (°C) | 11.2 (m/s) | 127.5 (W/(m2 °C)) |
Publisher’s Note: MDPI stays neutral with regard to jurisdictional claims in published maps and institutional affiliations. |
© 2022 by the authors. Licensee MDPI, Basel, Switzerland. This article is an open access article distributed under the terms and conditions of the Creative Commons Attribution (CC BY) license (https://creativecommons.org/licenses/by/4.0/).
Share and Cite
Yu, D.; Zhang, D.; Wu, L.; Kong, X.; Yue, Q. Analysis of the Influence of Convection Heat Transfer in Circular Tubes on Ships in a Polar Environment. Atmosphere 2022, 13, 149. https://doi.org/10.3390/atmos13020149
Yu D, Zhang D, Wu L, Kong X, Yue Q. Analysis of the Influence of Convection Heat Transfer in Circular Tubes on Ships in a Polar Environment. Atmosphere. 2022; 13(2):149. https://doi.org/10.3390/atmos13020149
Chicago/Turabian StyleYu, Dongwei, Dayong Zhang, Lin Wu, Xiangyi Kong, and Qianjin Yue. 2022. "Analysis of the Influence of Convection Heat Transfer in Circular Tubes on Ships in a Polar Environment" Atmosphere 13, no. 2: 149. https://doi.org/10.3390/atmos13020149
APA StyleYu, D., Zhang, D., Wu, L., Kong, X., & Yue, Q. (2022). Analysis of the Influence of Convection Heat Transfer in Circular Tubes on Ships in a Polar Environment. Atmosphere, 13(2), 149. https://doi.org/10.3390/atmos13020149