Indoor Thermal Environment in Different Generations of Naturally Ventilated Public Residential Buildings in Singapore
Abstract
1. Introduction
2. Literature Review
3. Methodology
3.1. Local Climate of Singapore
3.2. Selecting Typical Flats for Different Generations of HDB Residential Buildings
3.3. Air Temperature Simulation with EnergyPlus and Design Builder Software
3.4. Obtaining Wind Velocity with CFD Simulation
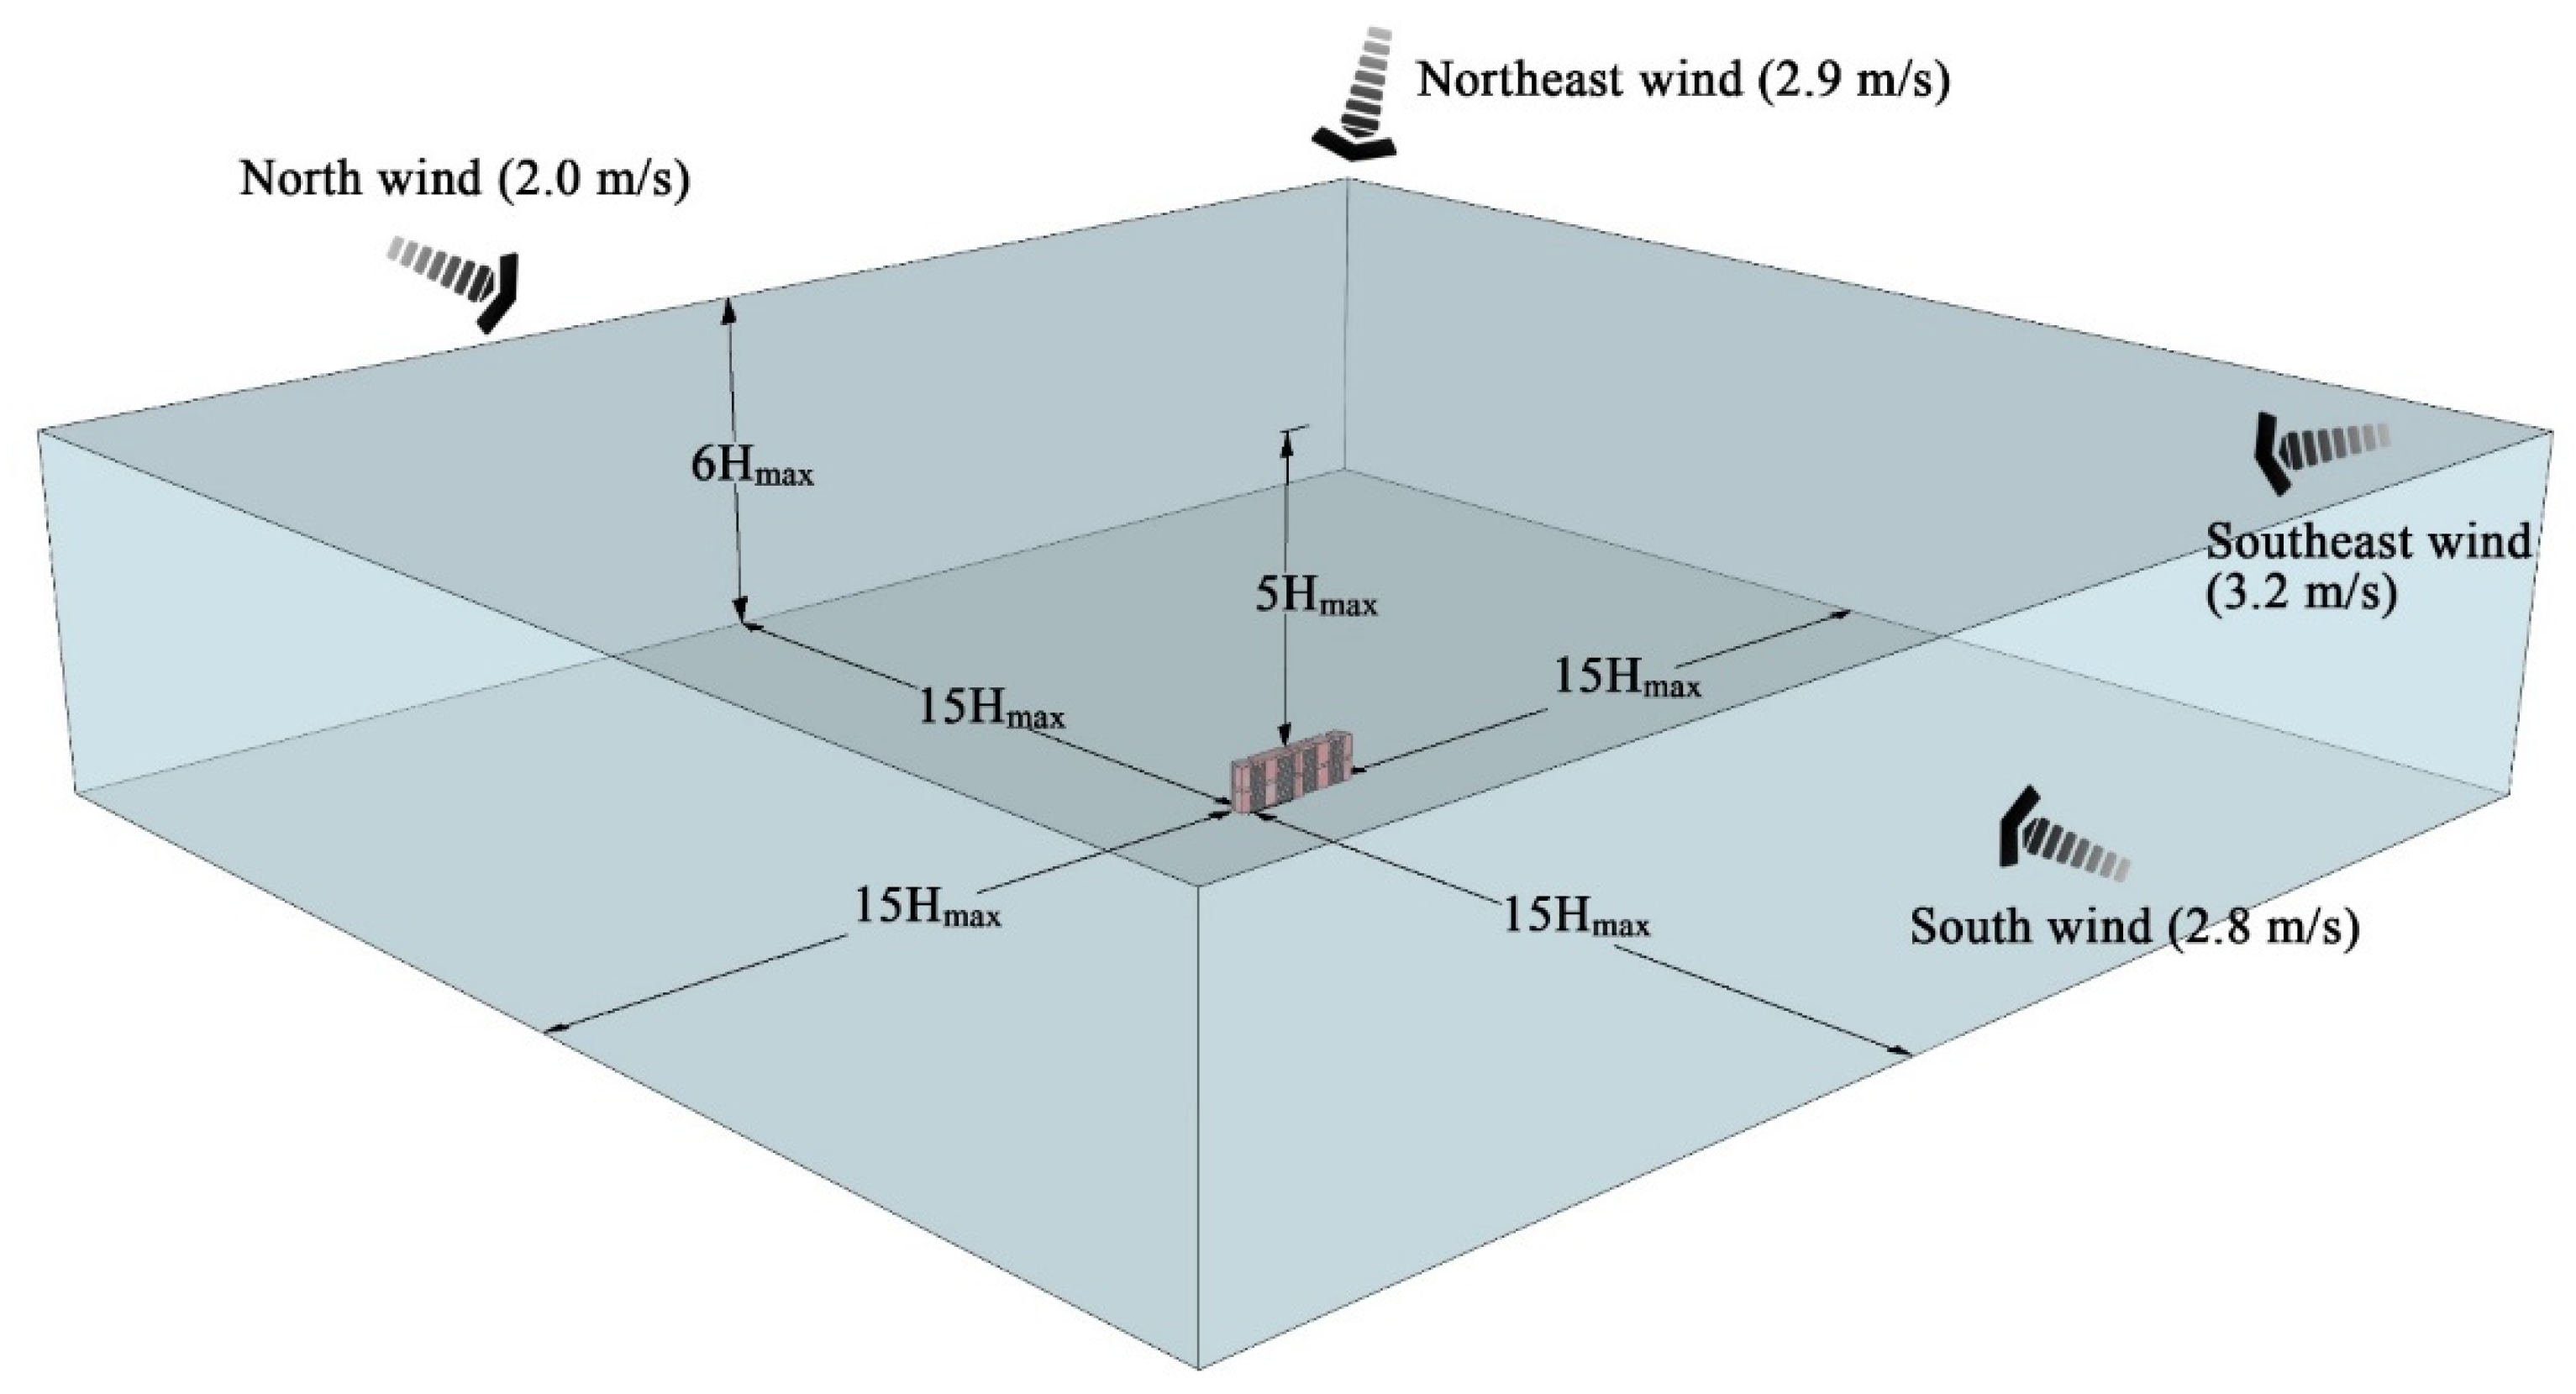
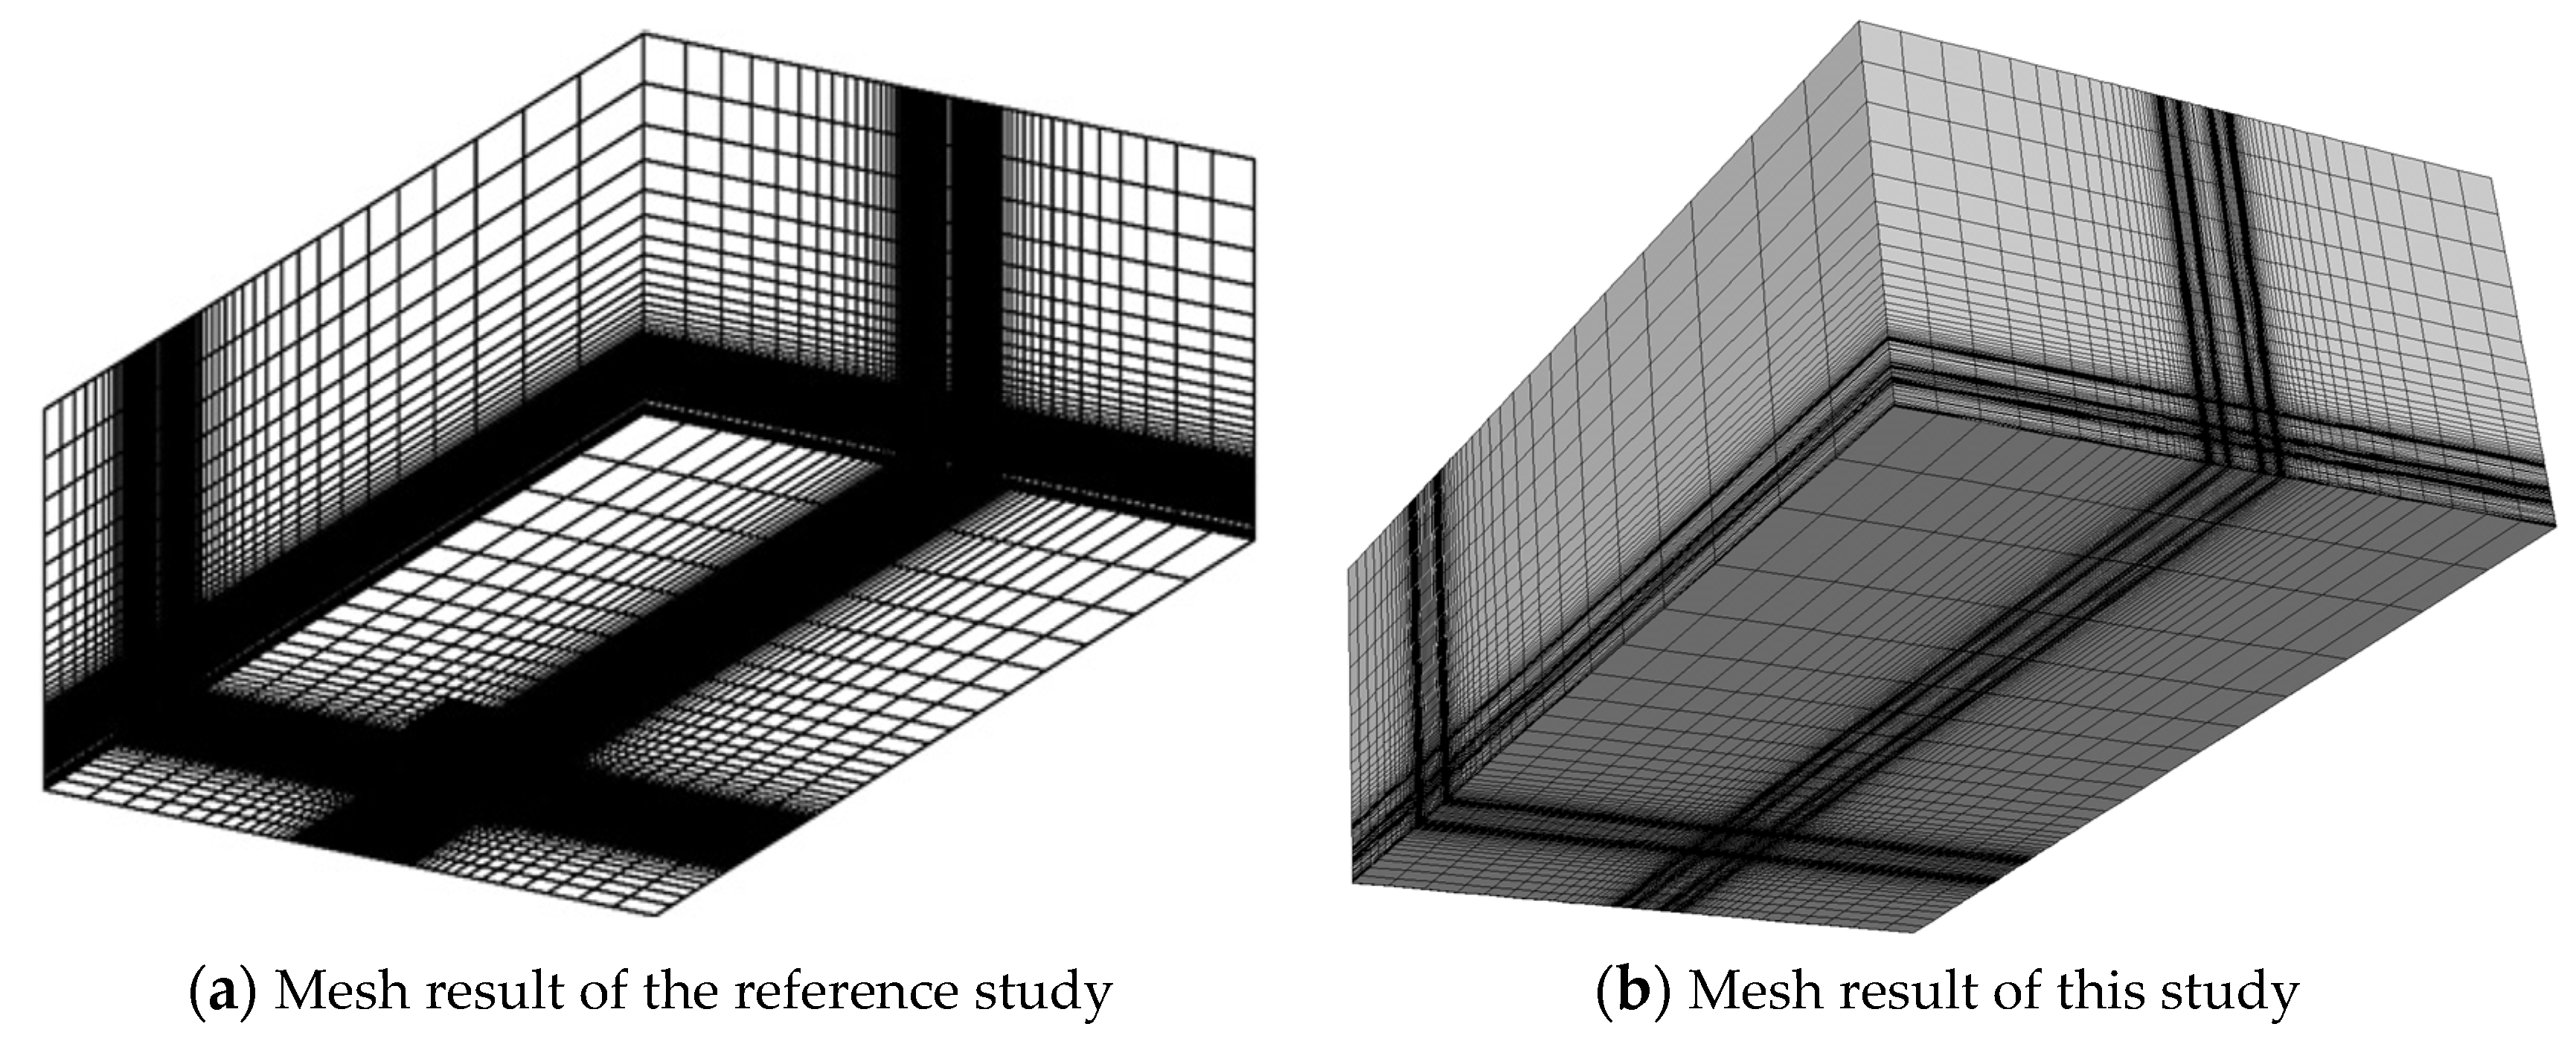
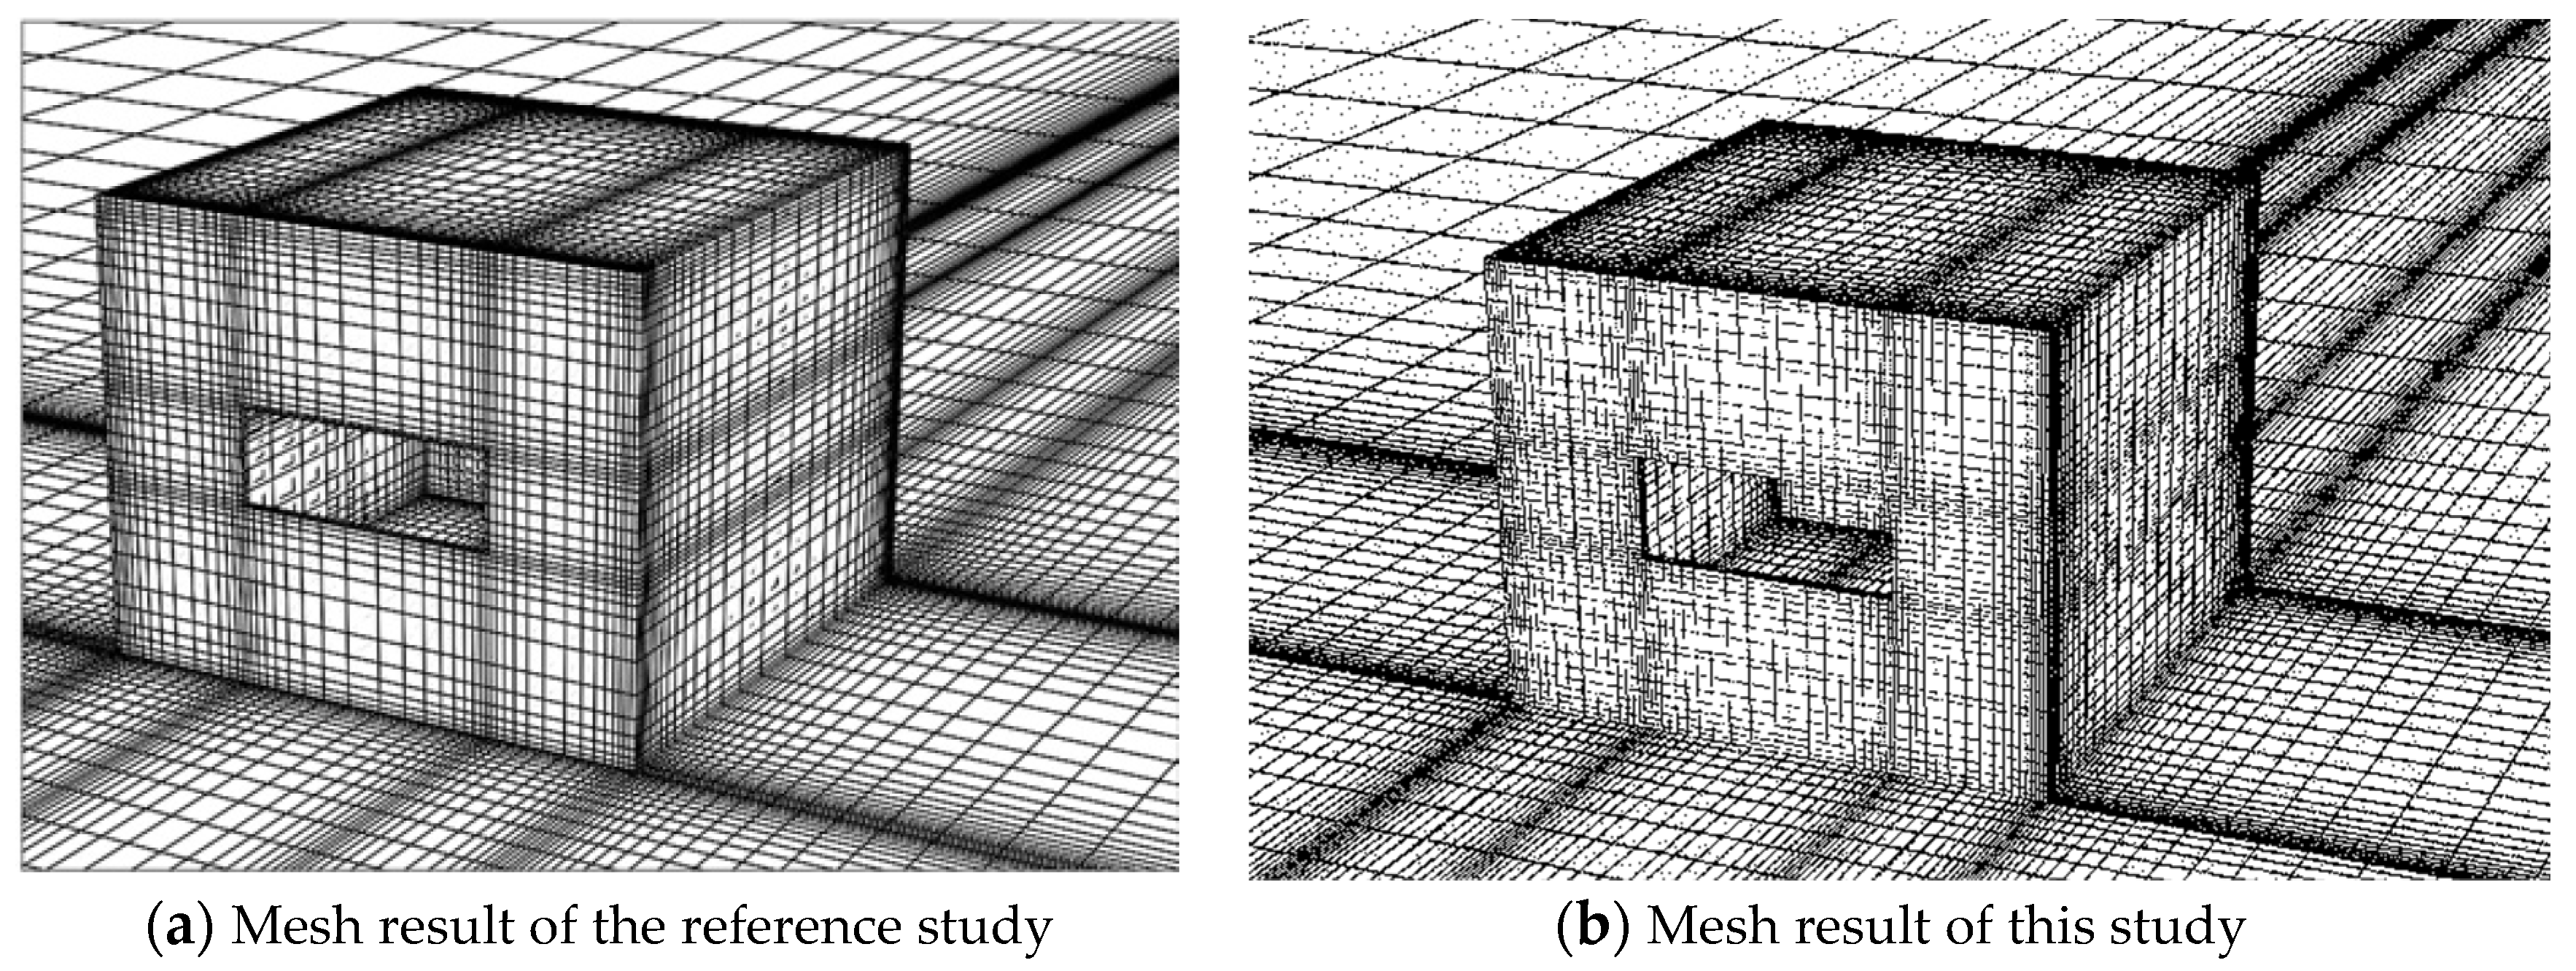
3.4.1. Computational Domain and Grids Generation
3.4.2. Boundary Conditions
3.4.3. Solver Settings
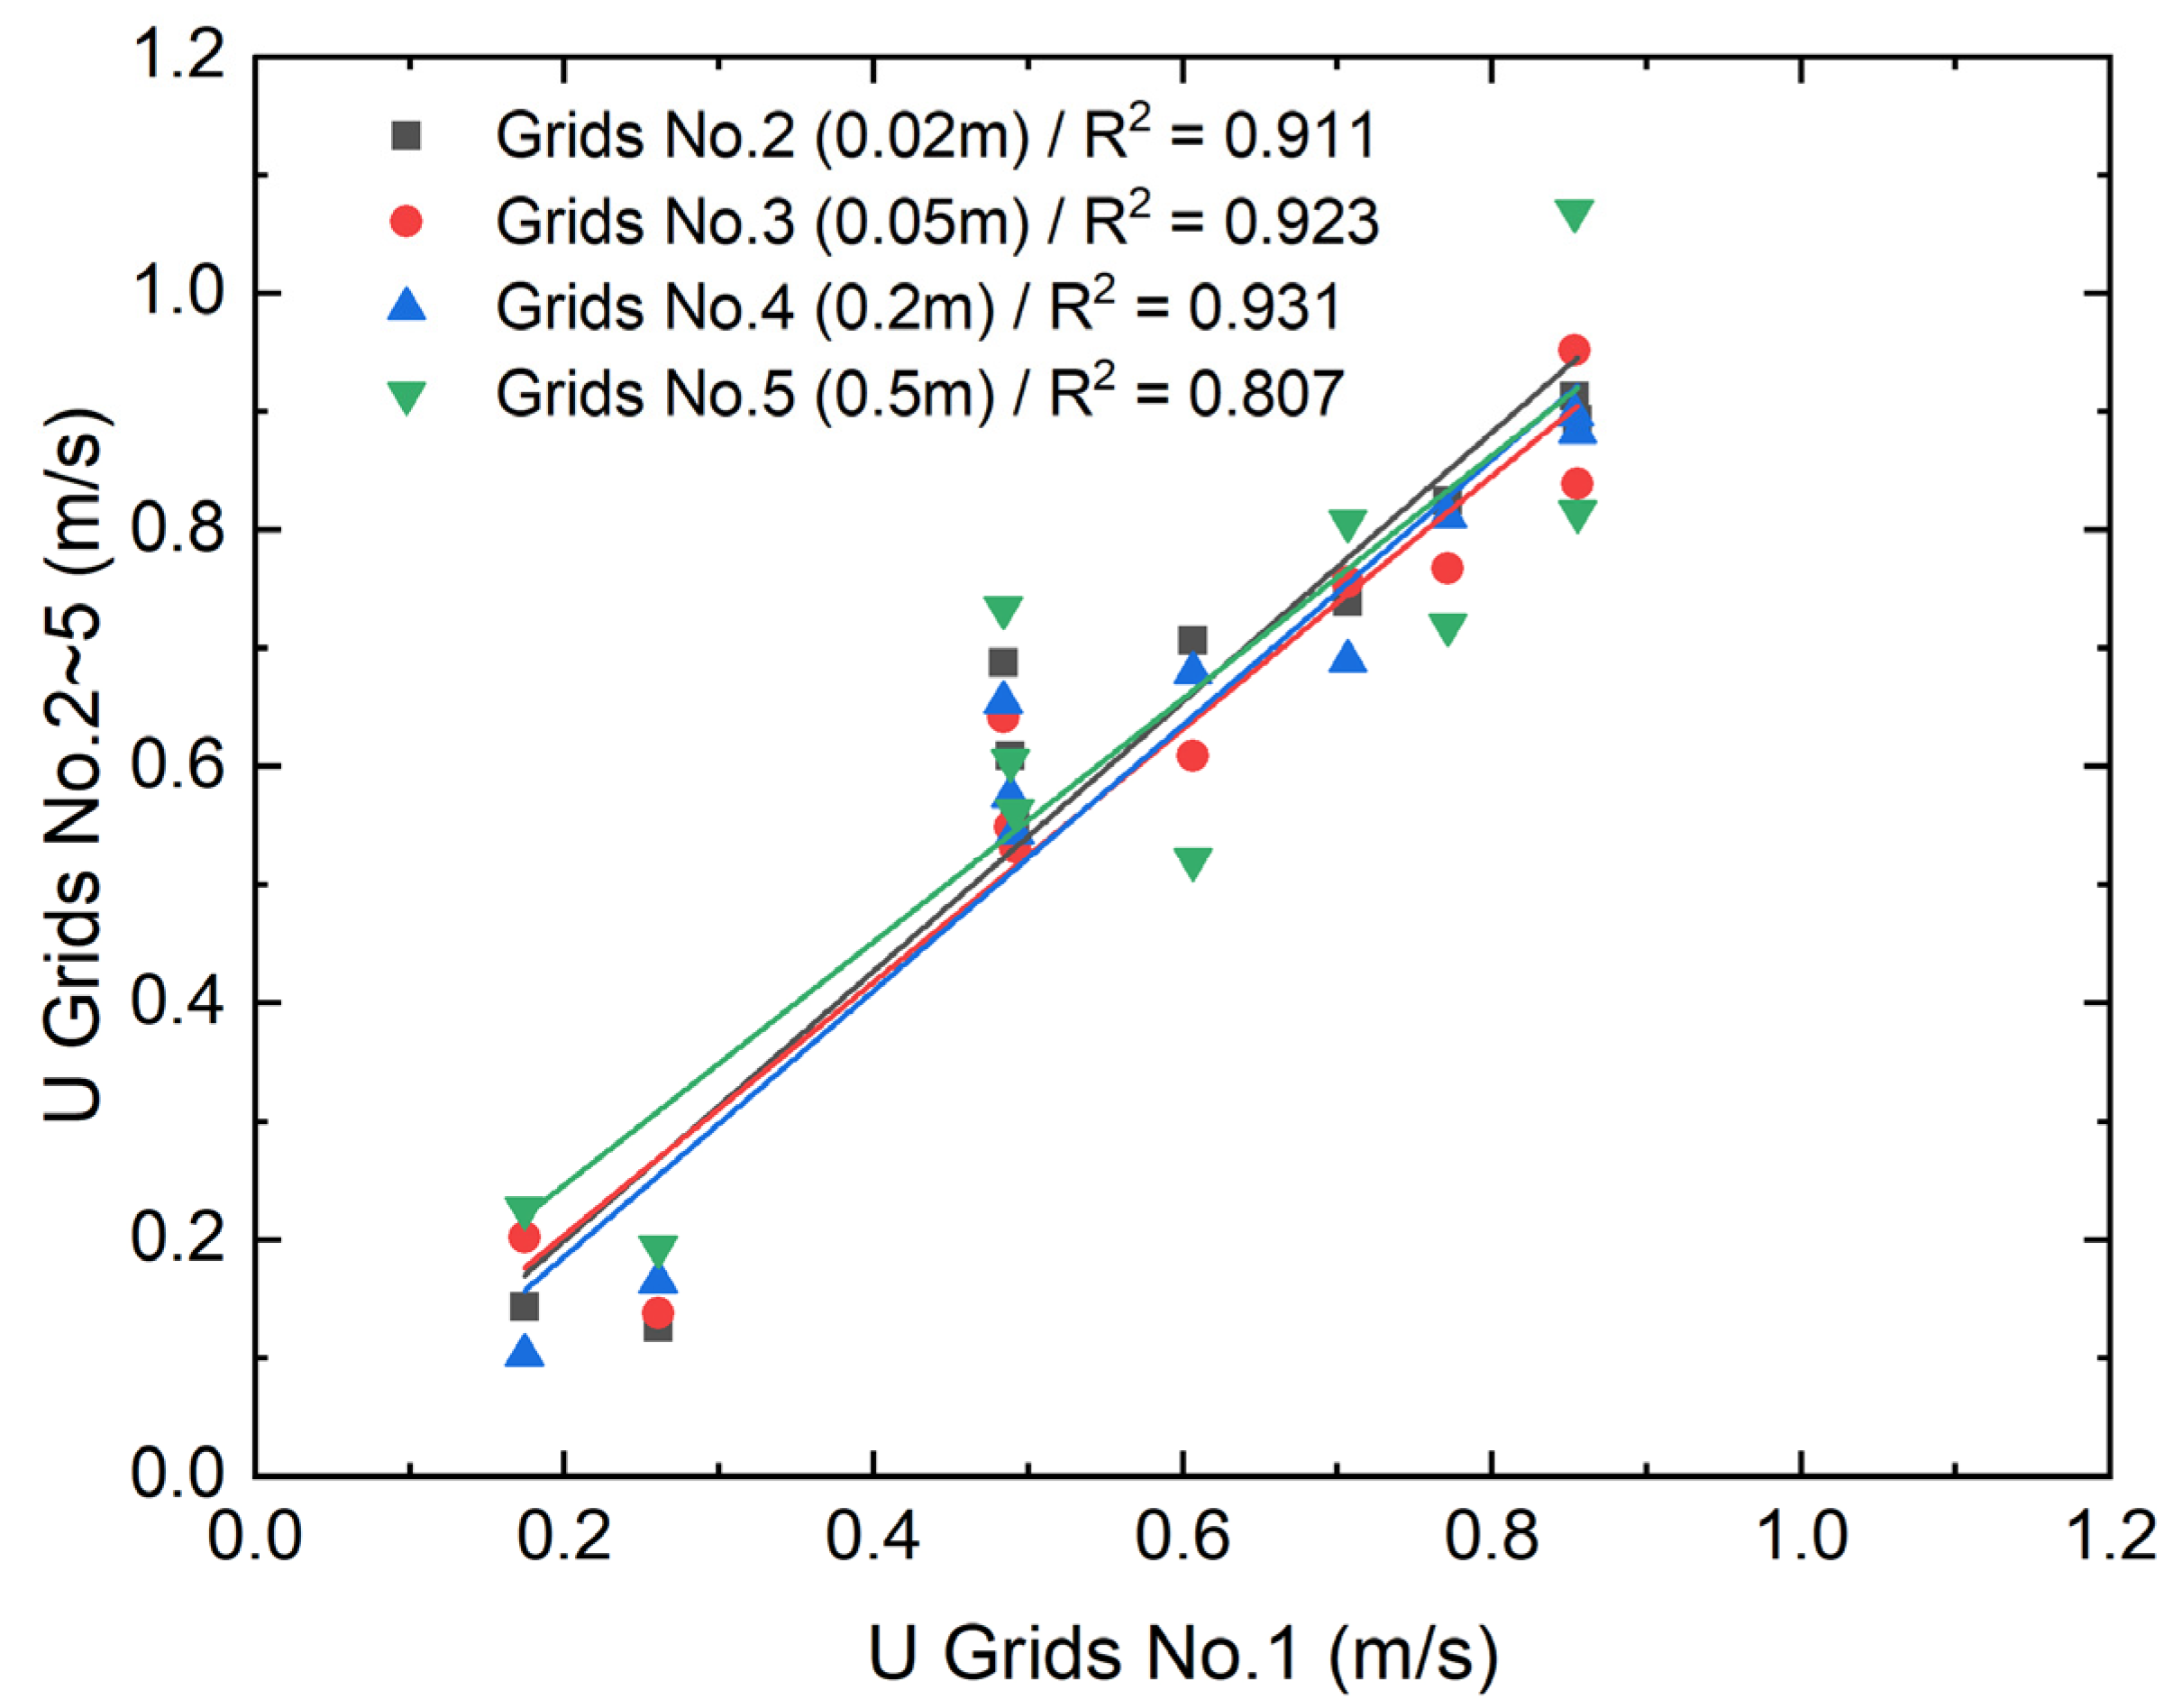
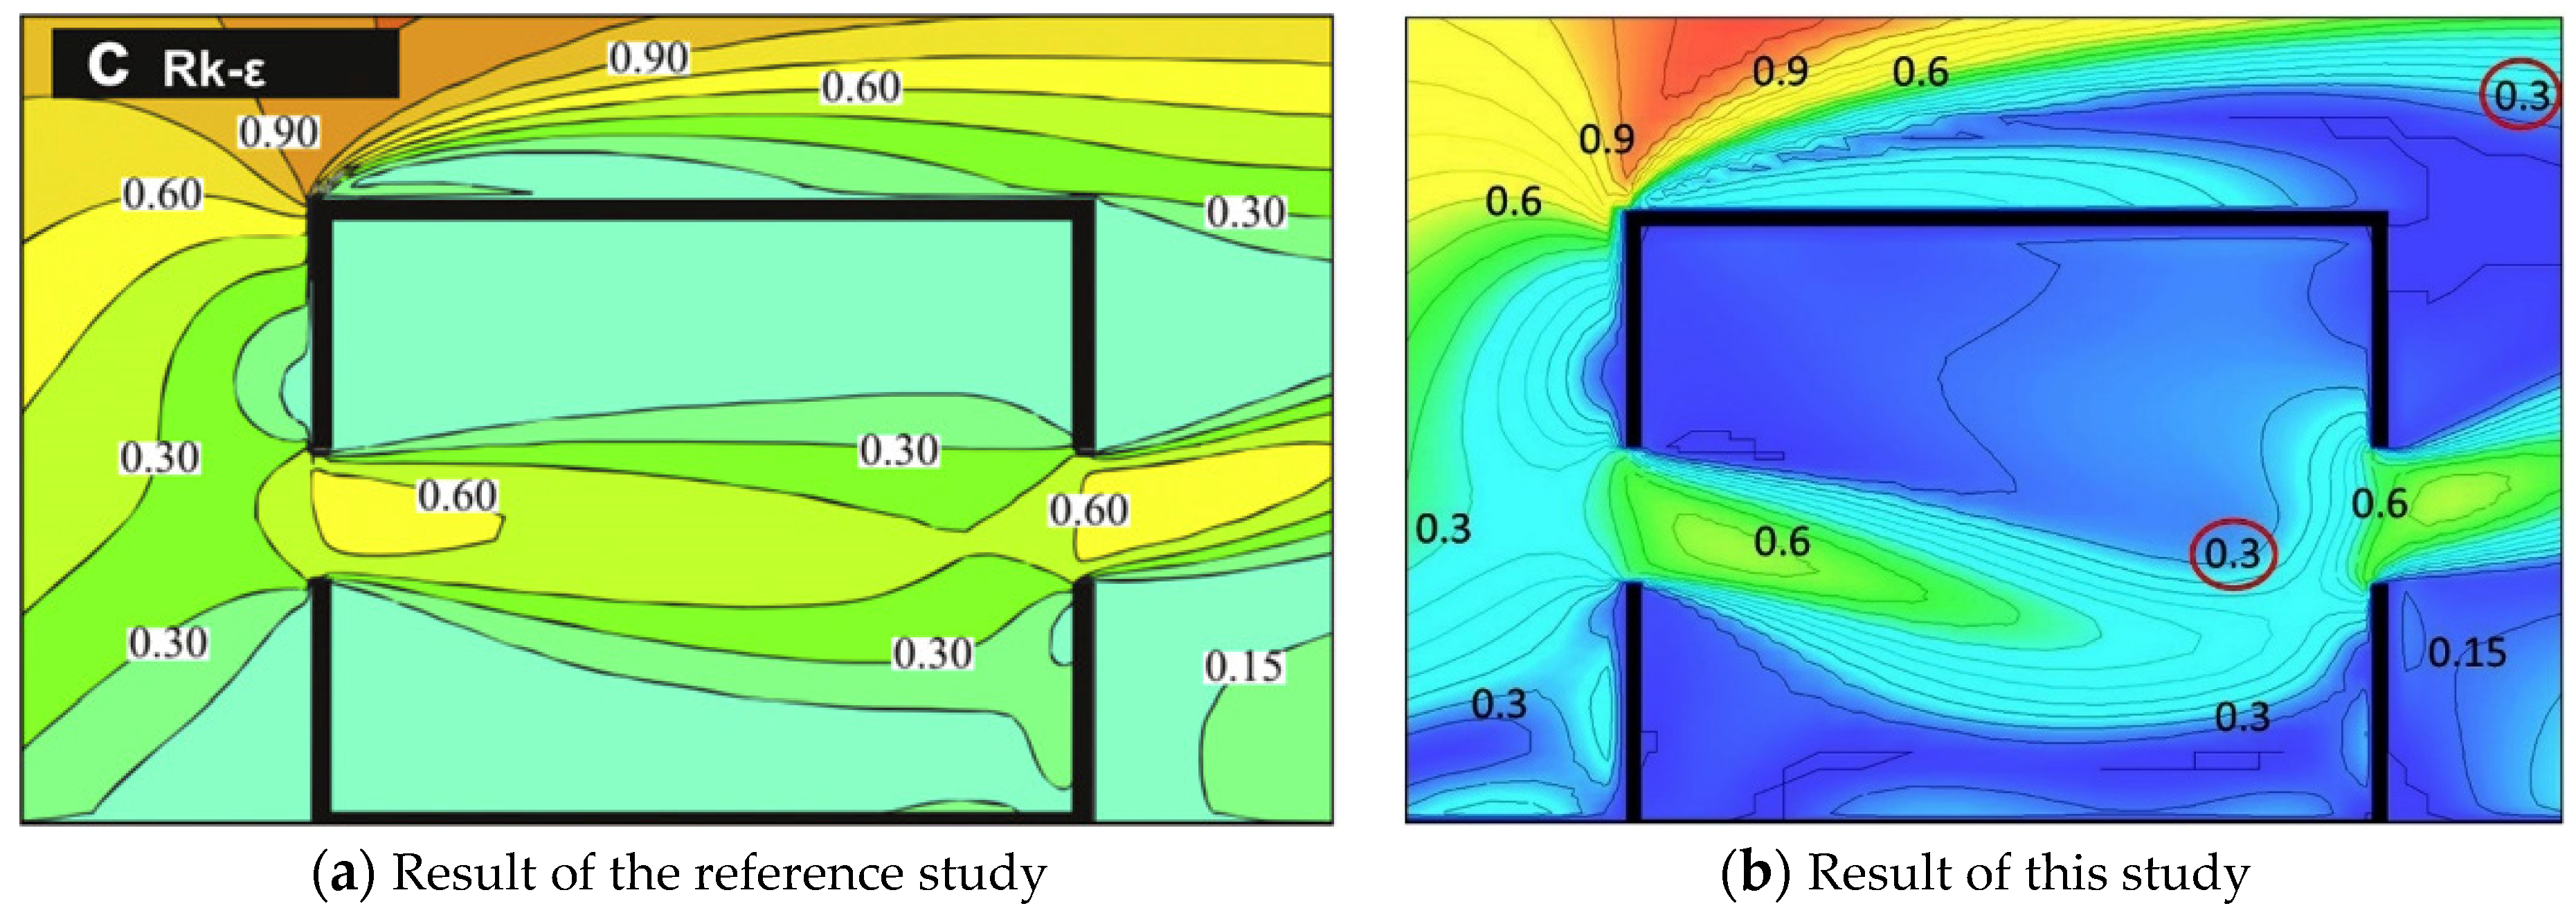
3.4.4. Validation of the CFD Solver with the Realizable k-ε Turbulence Model
3.5. Indoor Thermal Comfort
4. Results and Discussion
4.1. Air Temperature (Ta)
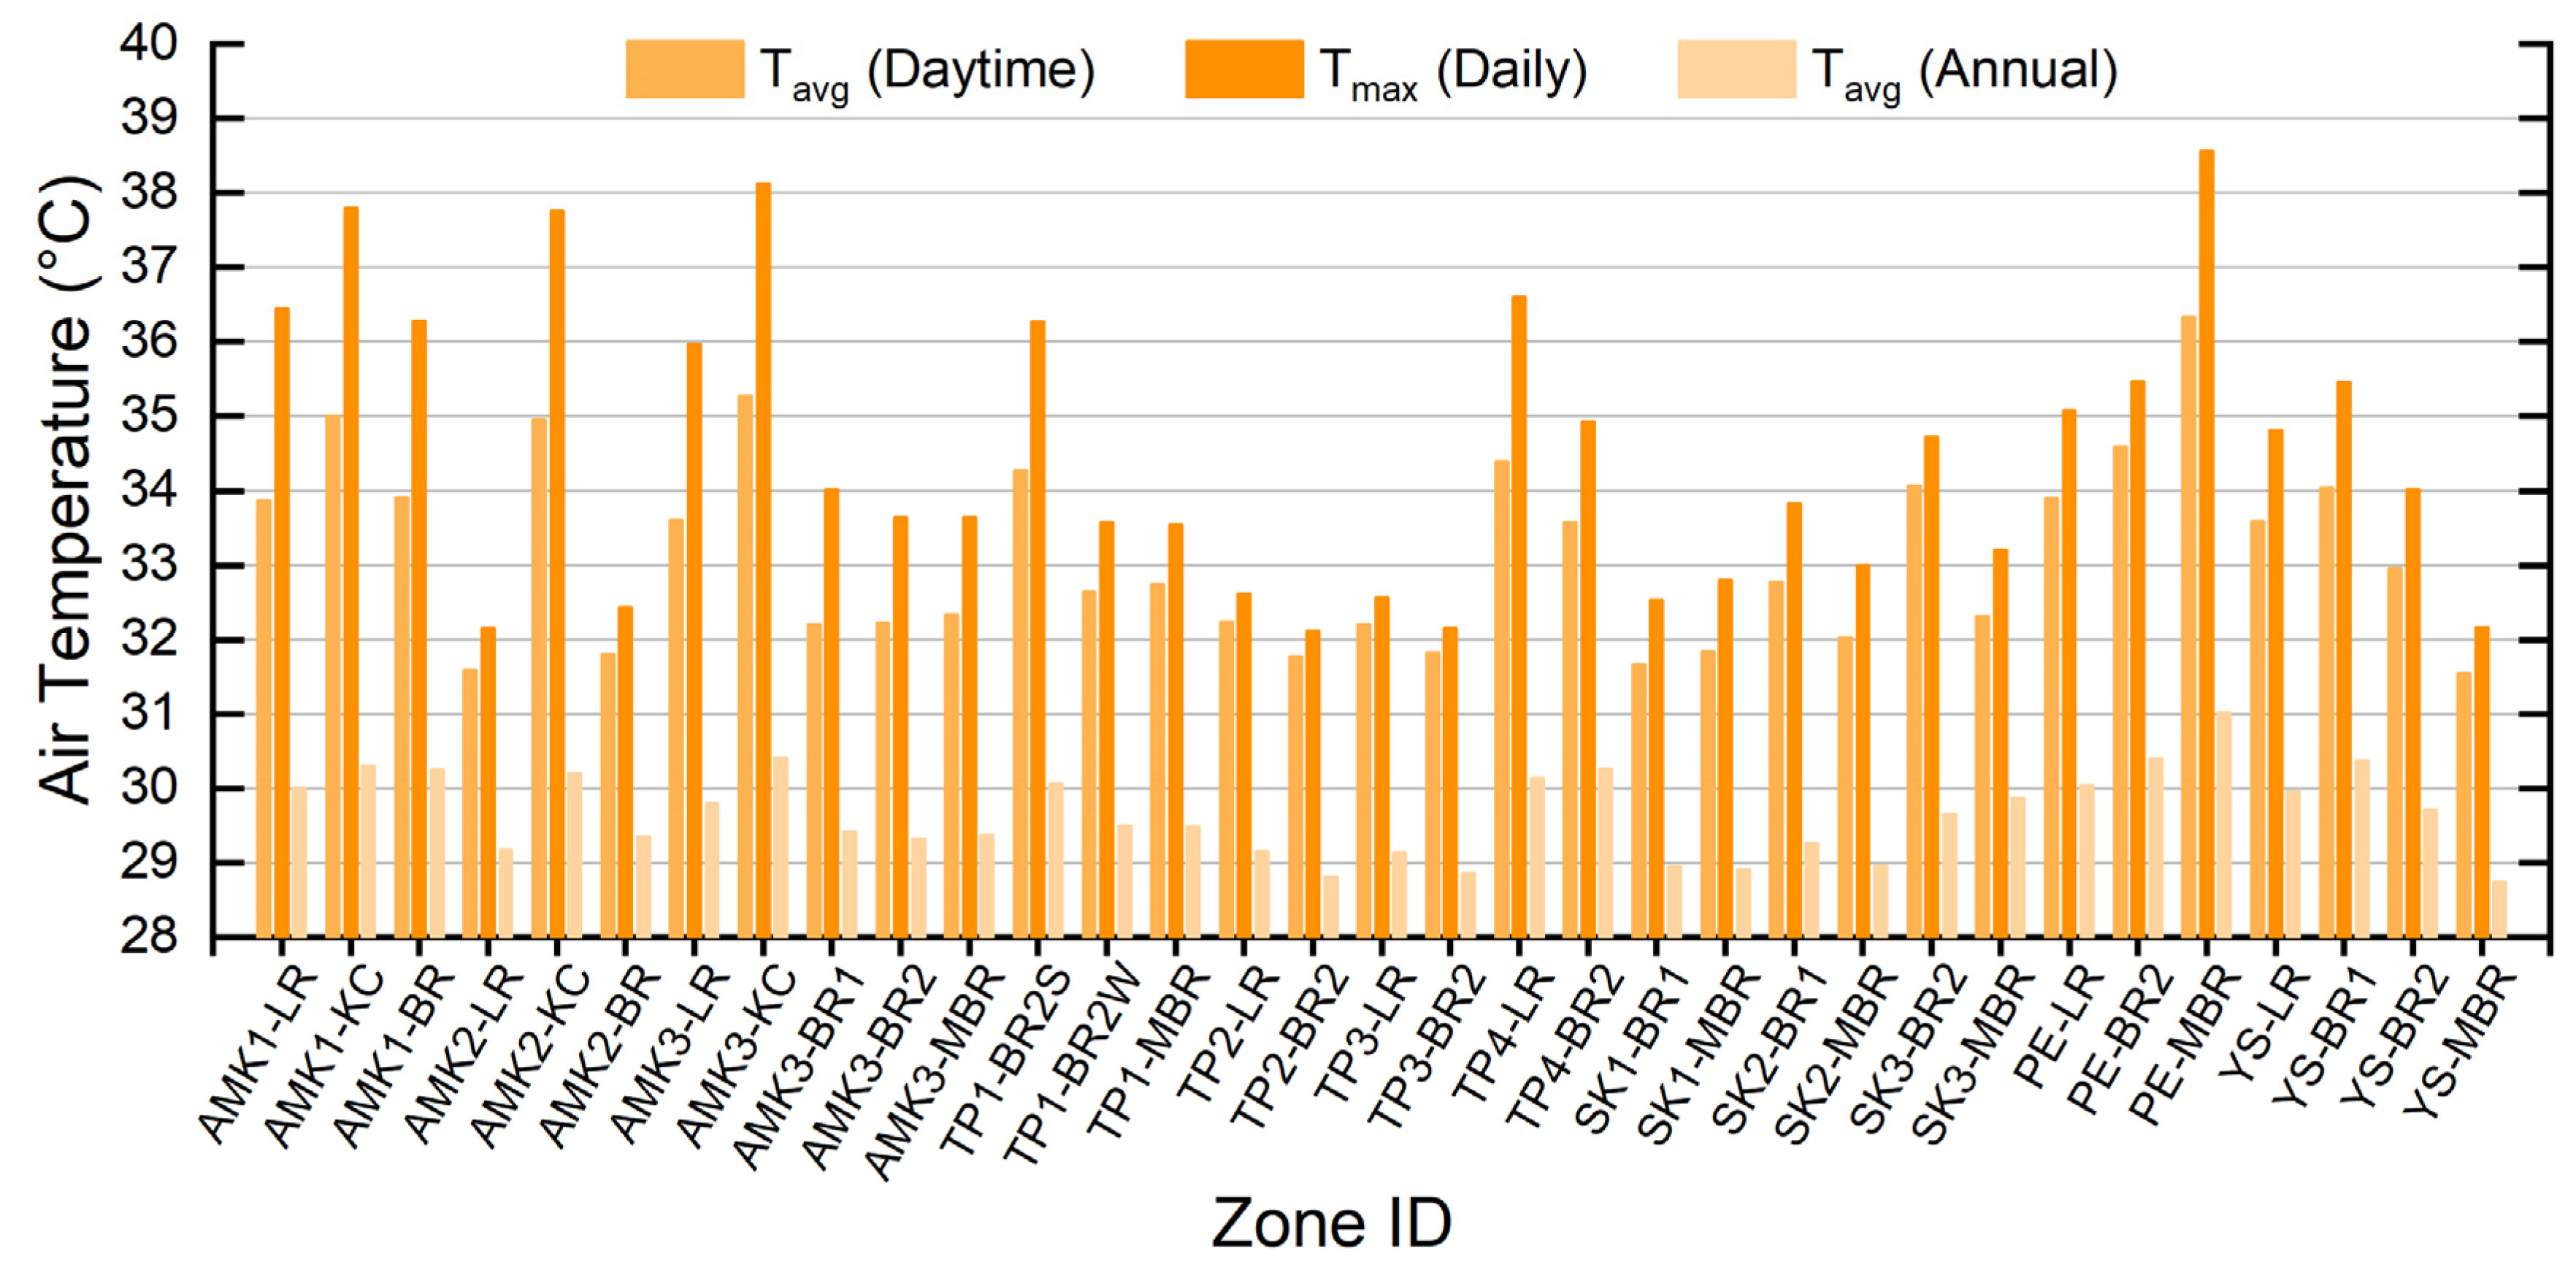
4.1.1. Window Closed Scenarios
4.1.2. Window Open Scenarios
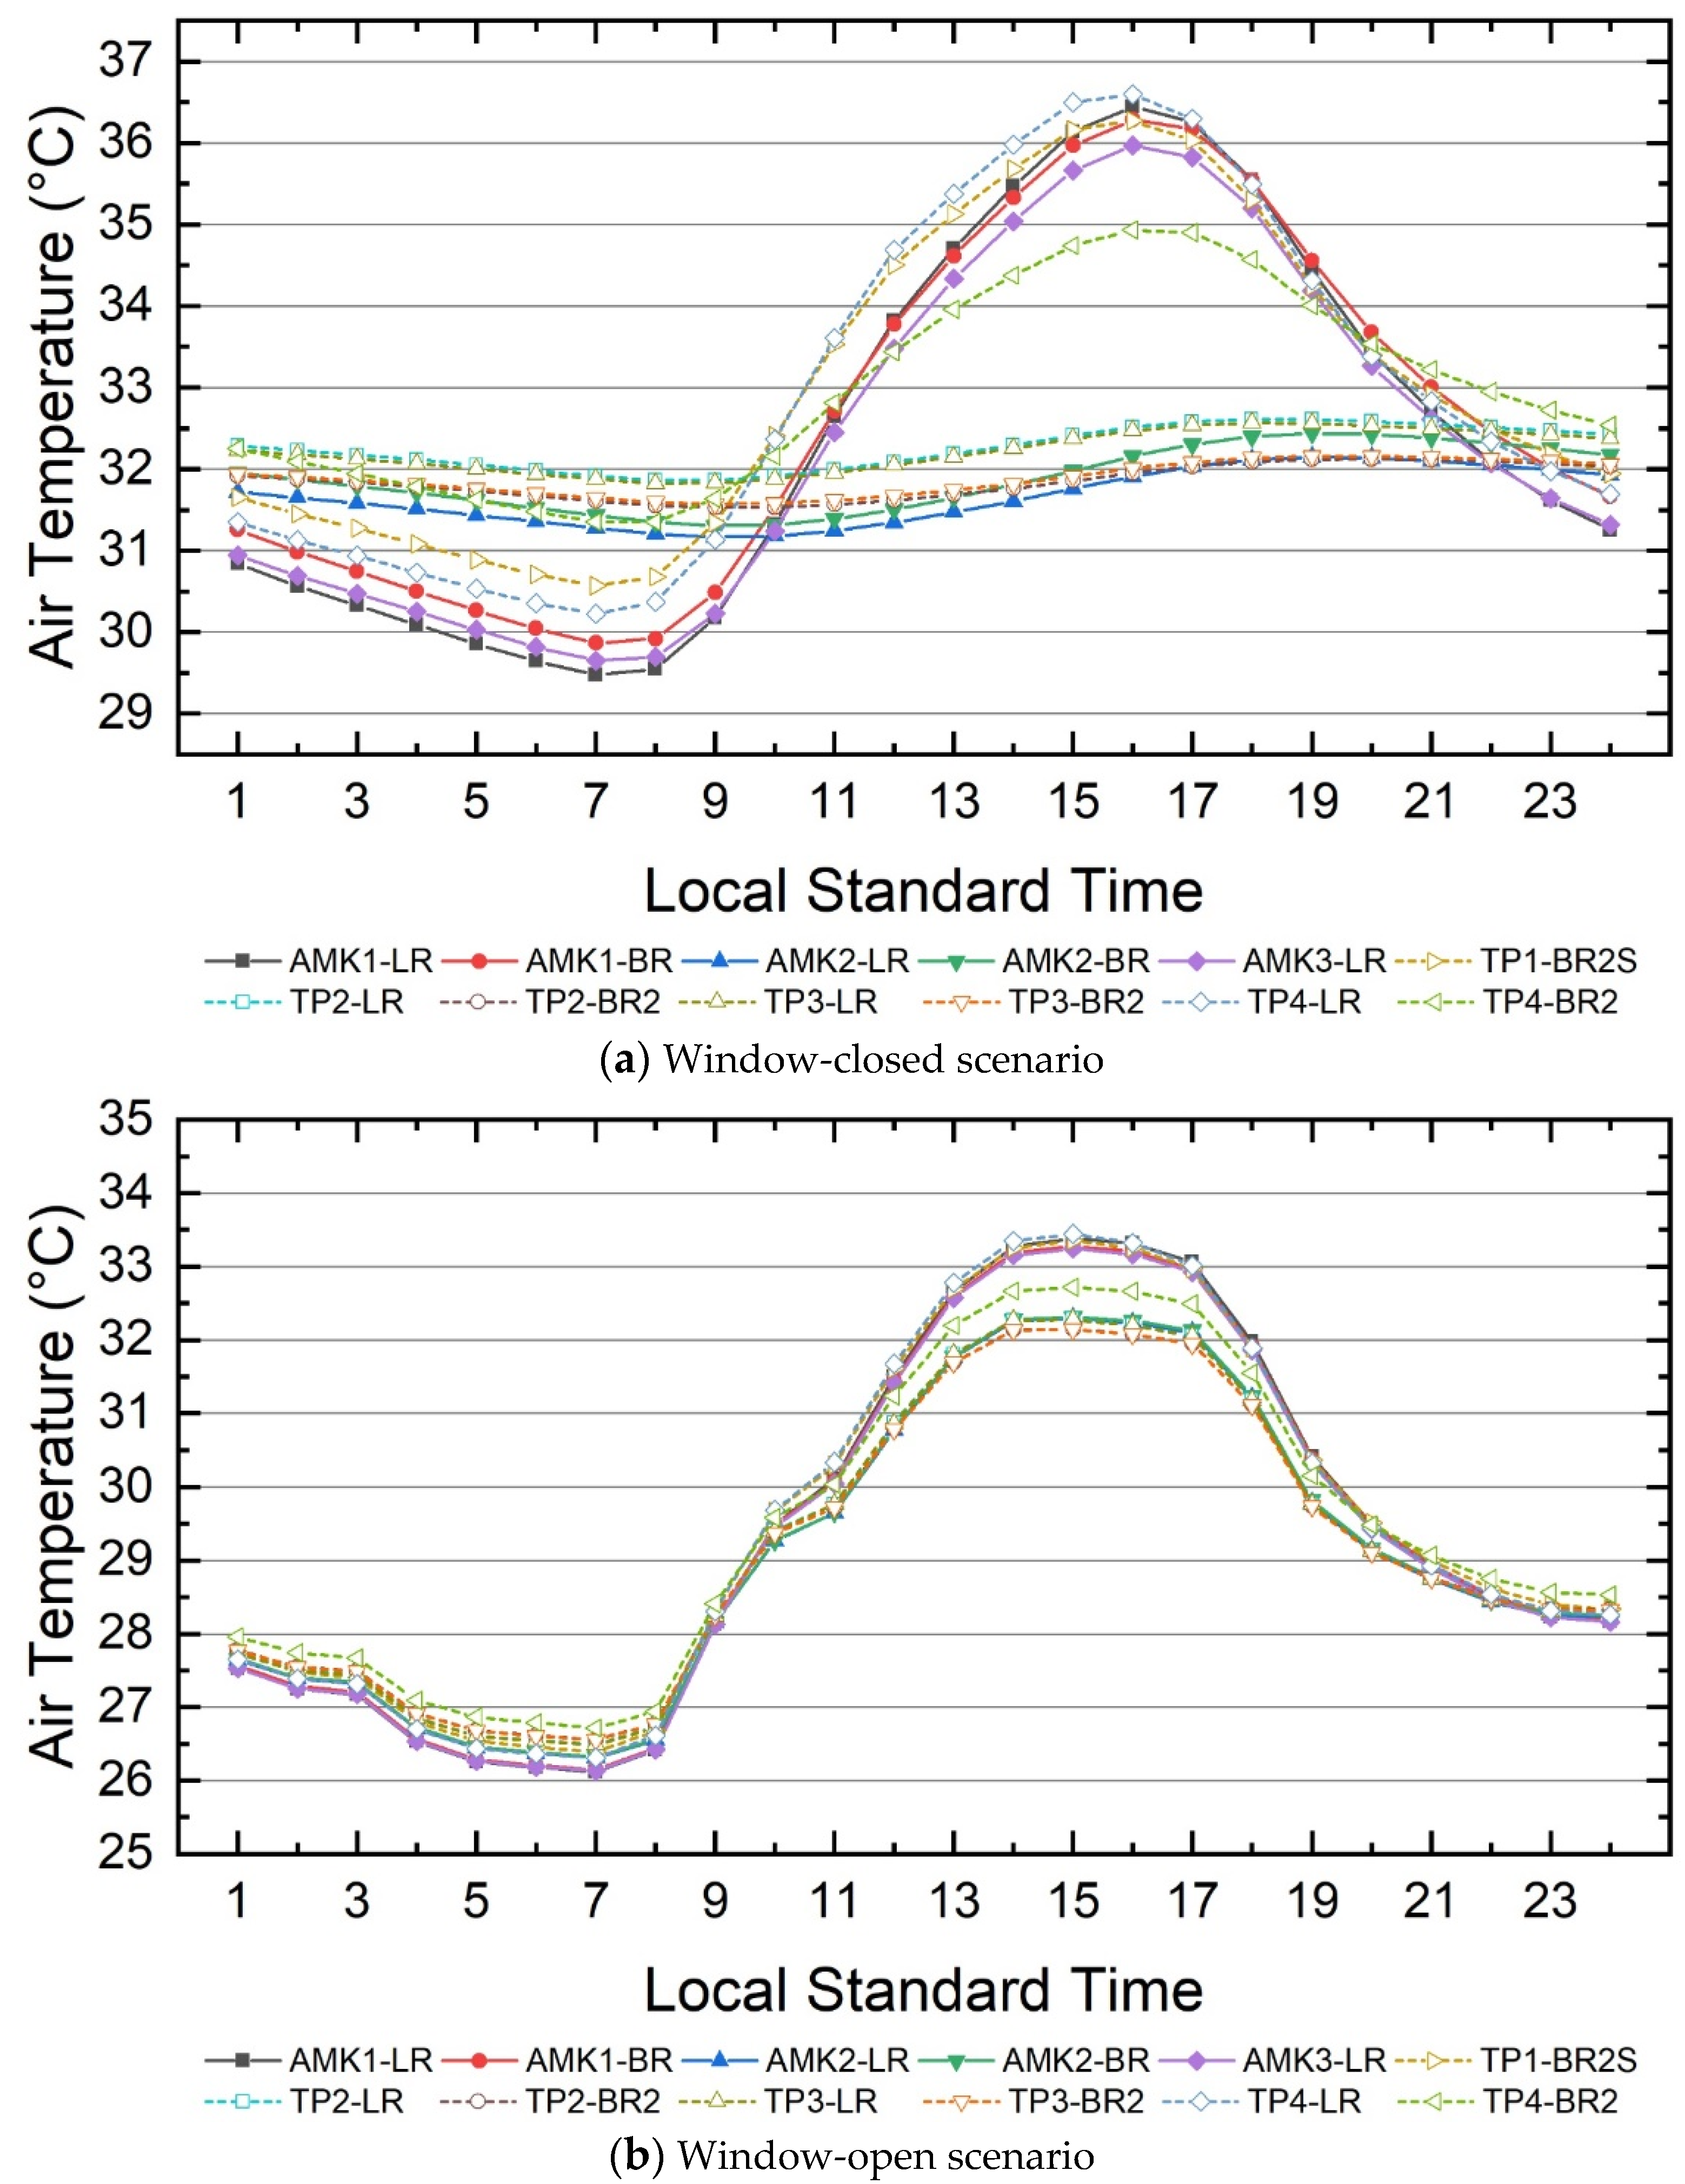
4.1.3. Hourly Ta Profiles
4.2. Indoor Thermal Comfort (PMV)
4.3. Discussion
5. Conclusions
- (1)
- The comparison of the average Ta between the window-closed and window-open scenarios confirms that the window-open scenarios show greater potentials in cooling the indoor spaces in comparison to the window-closed scenarios. The maximum difference in Ta between the two scenarios reaches an average of 3.2 °C. The reason for this behavior can be explained by the fact that the natural ventilation provided by opening the windows is effective in releasing the heat accumulation in the interior spaces caused by the direct solar radiation.
- (2)
- Both the results of PMV and the hourly Ta profiles show that the addition of a corridor in slab blocks could provide effective shading for avoiding excessive solar access and improve the indoor thermal comfort regardless of the windows’ status. In comparison, the point and irregular blocks with the centralized plan layout design usually result in the fact that the indoor air temperature and velocity are more sensitive to the façade orientation and the direction of the prevailing wind.
- (3)
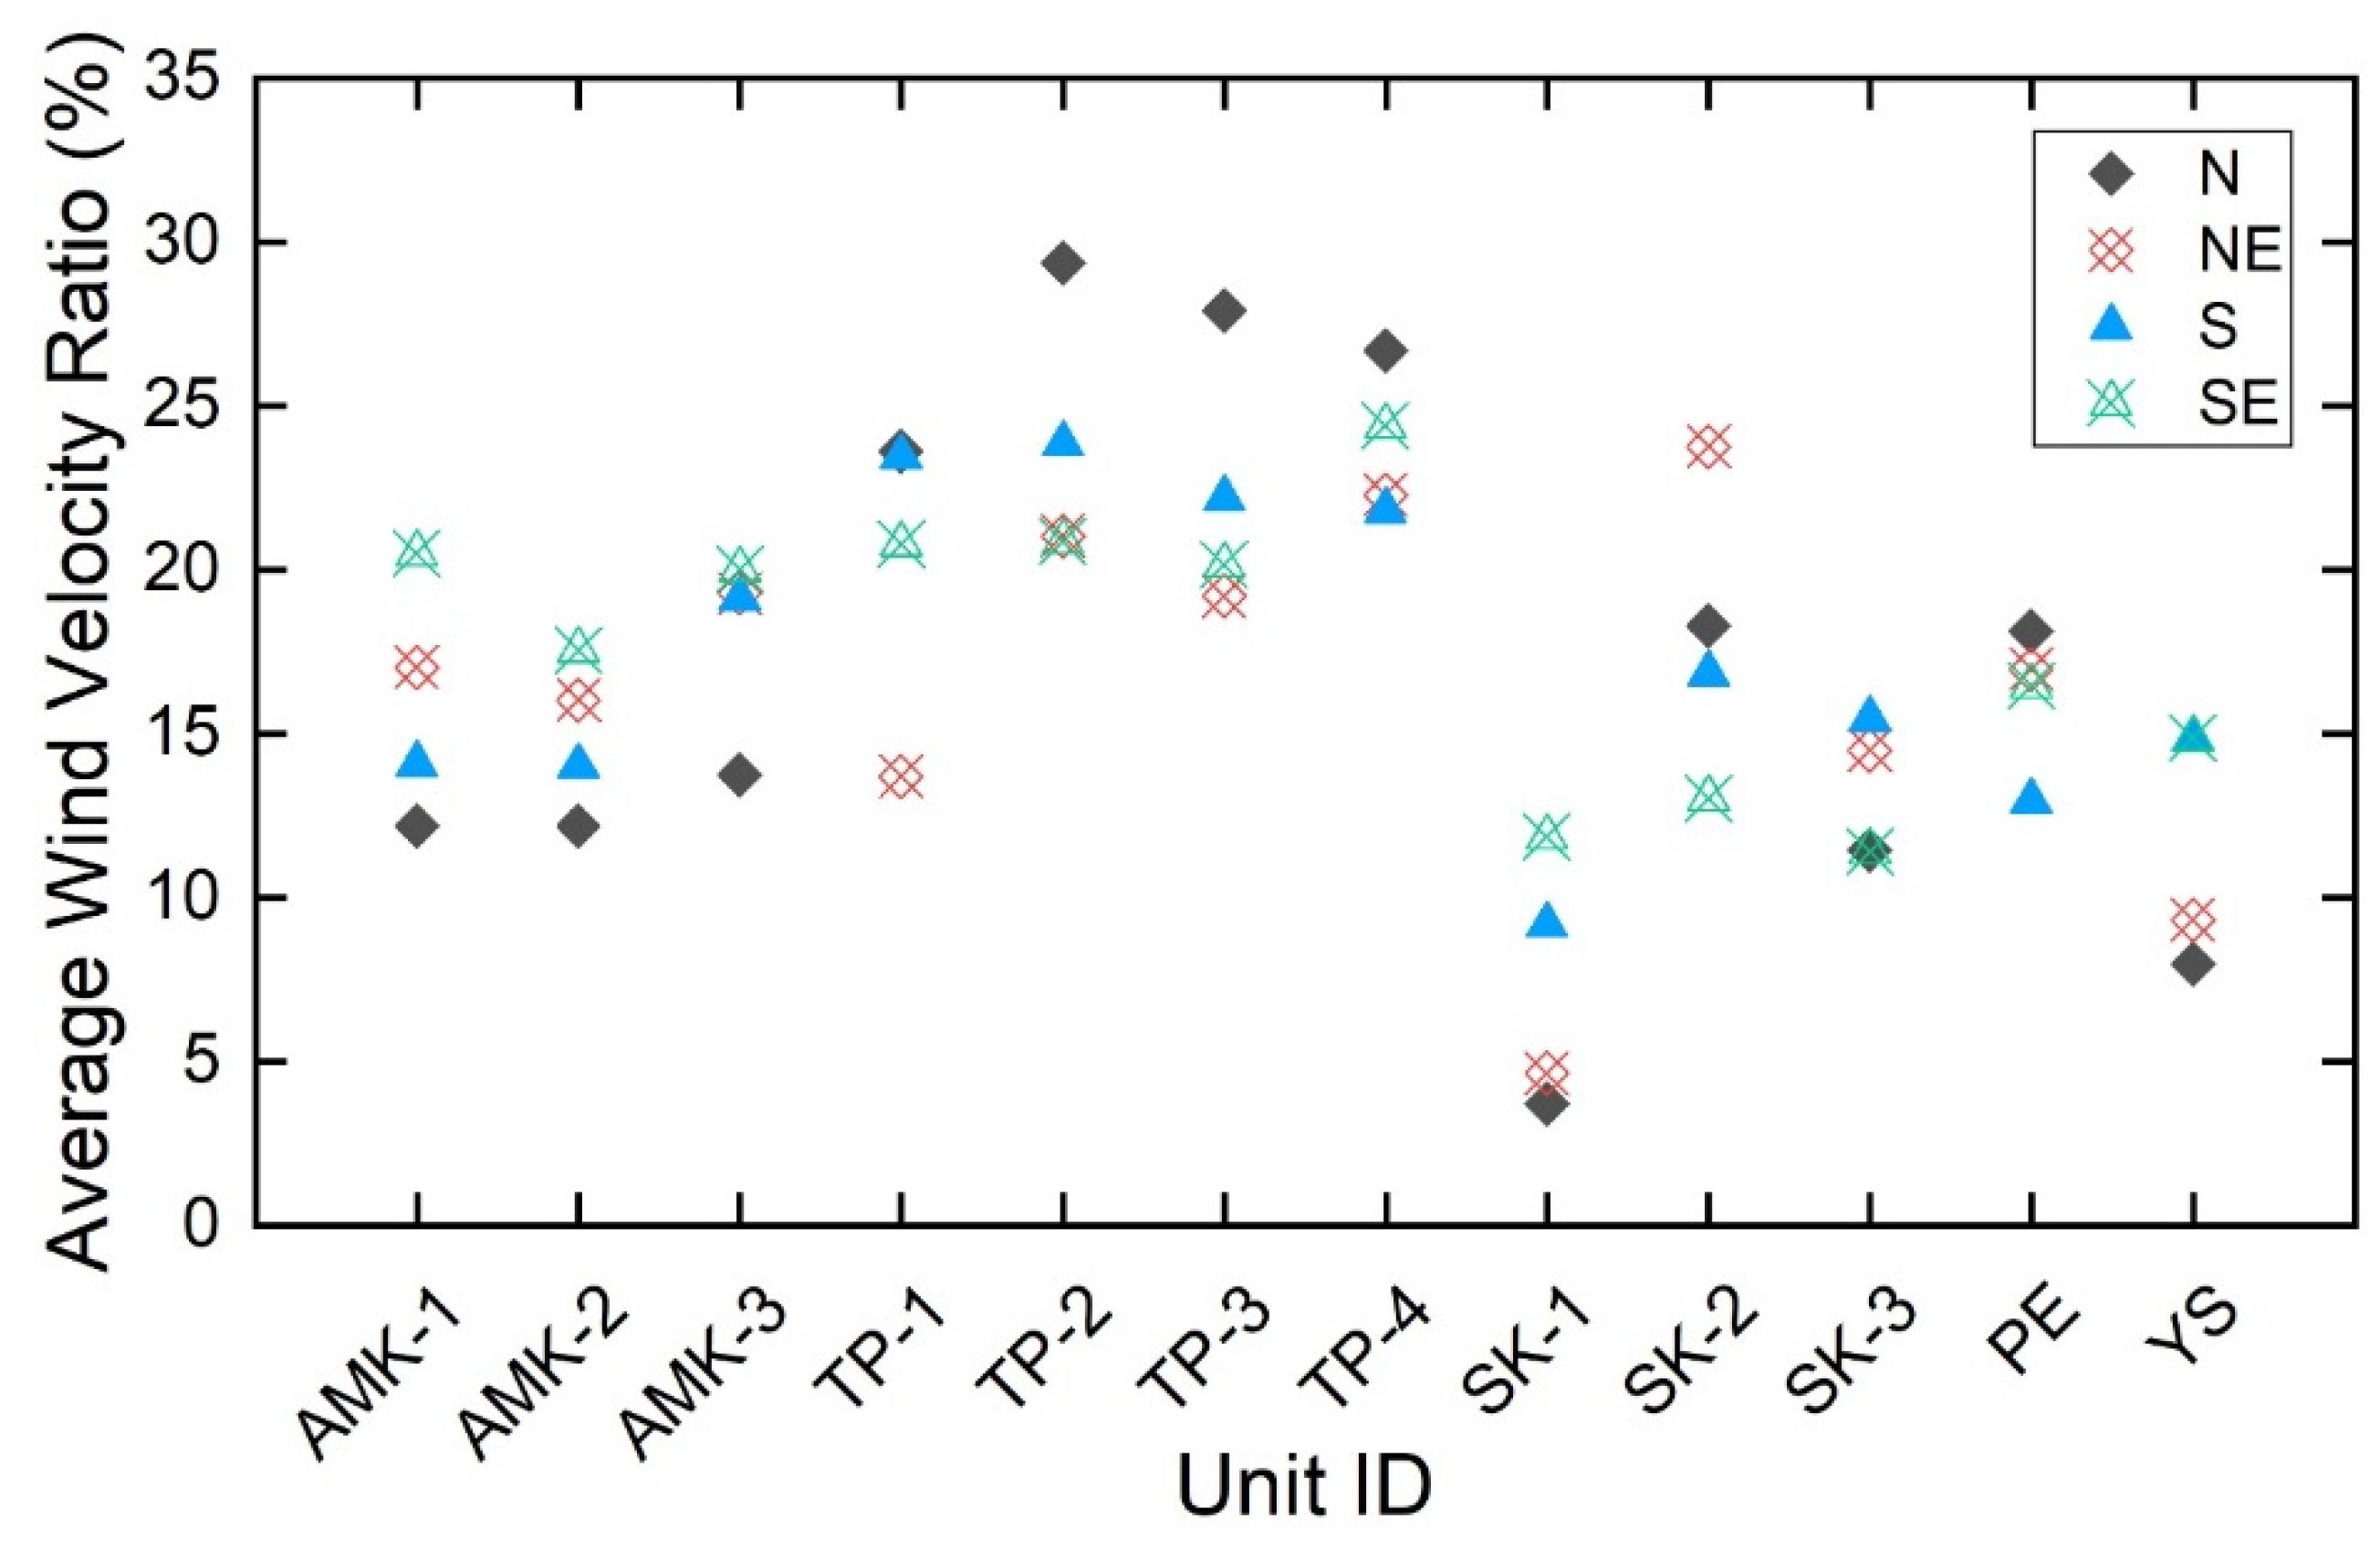
- The results of average wind velocity ratios in various target units confirms that the earlier generations of HDB flats perform better on natural ventilation than the later generations. Nonetheless, this phenomenon cannot be arbitrarily attributed to the change of façade WWR and shading depth. This is because the indoor air velocity is not only affected by these two façade design parameters, but also dependent on the relative sizes of inlet and outlet, as well as the wind direction and facade orientation.
- (4)
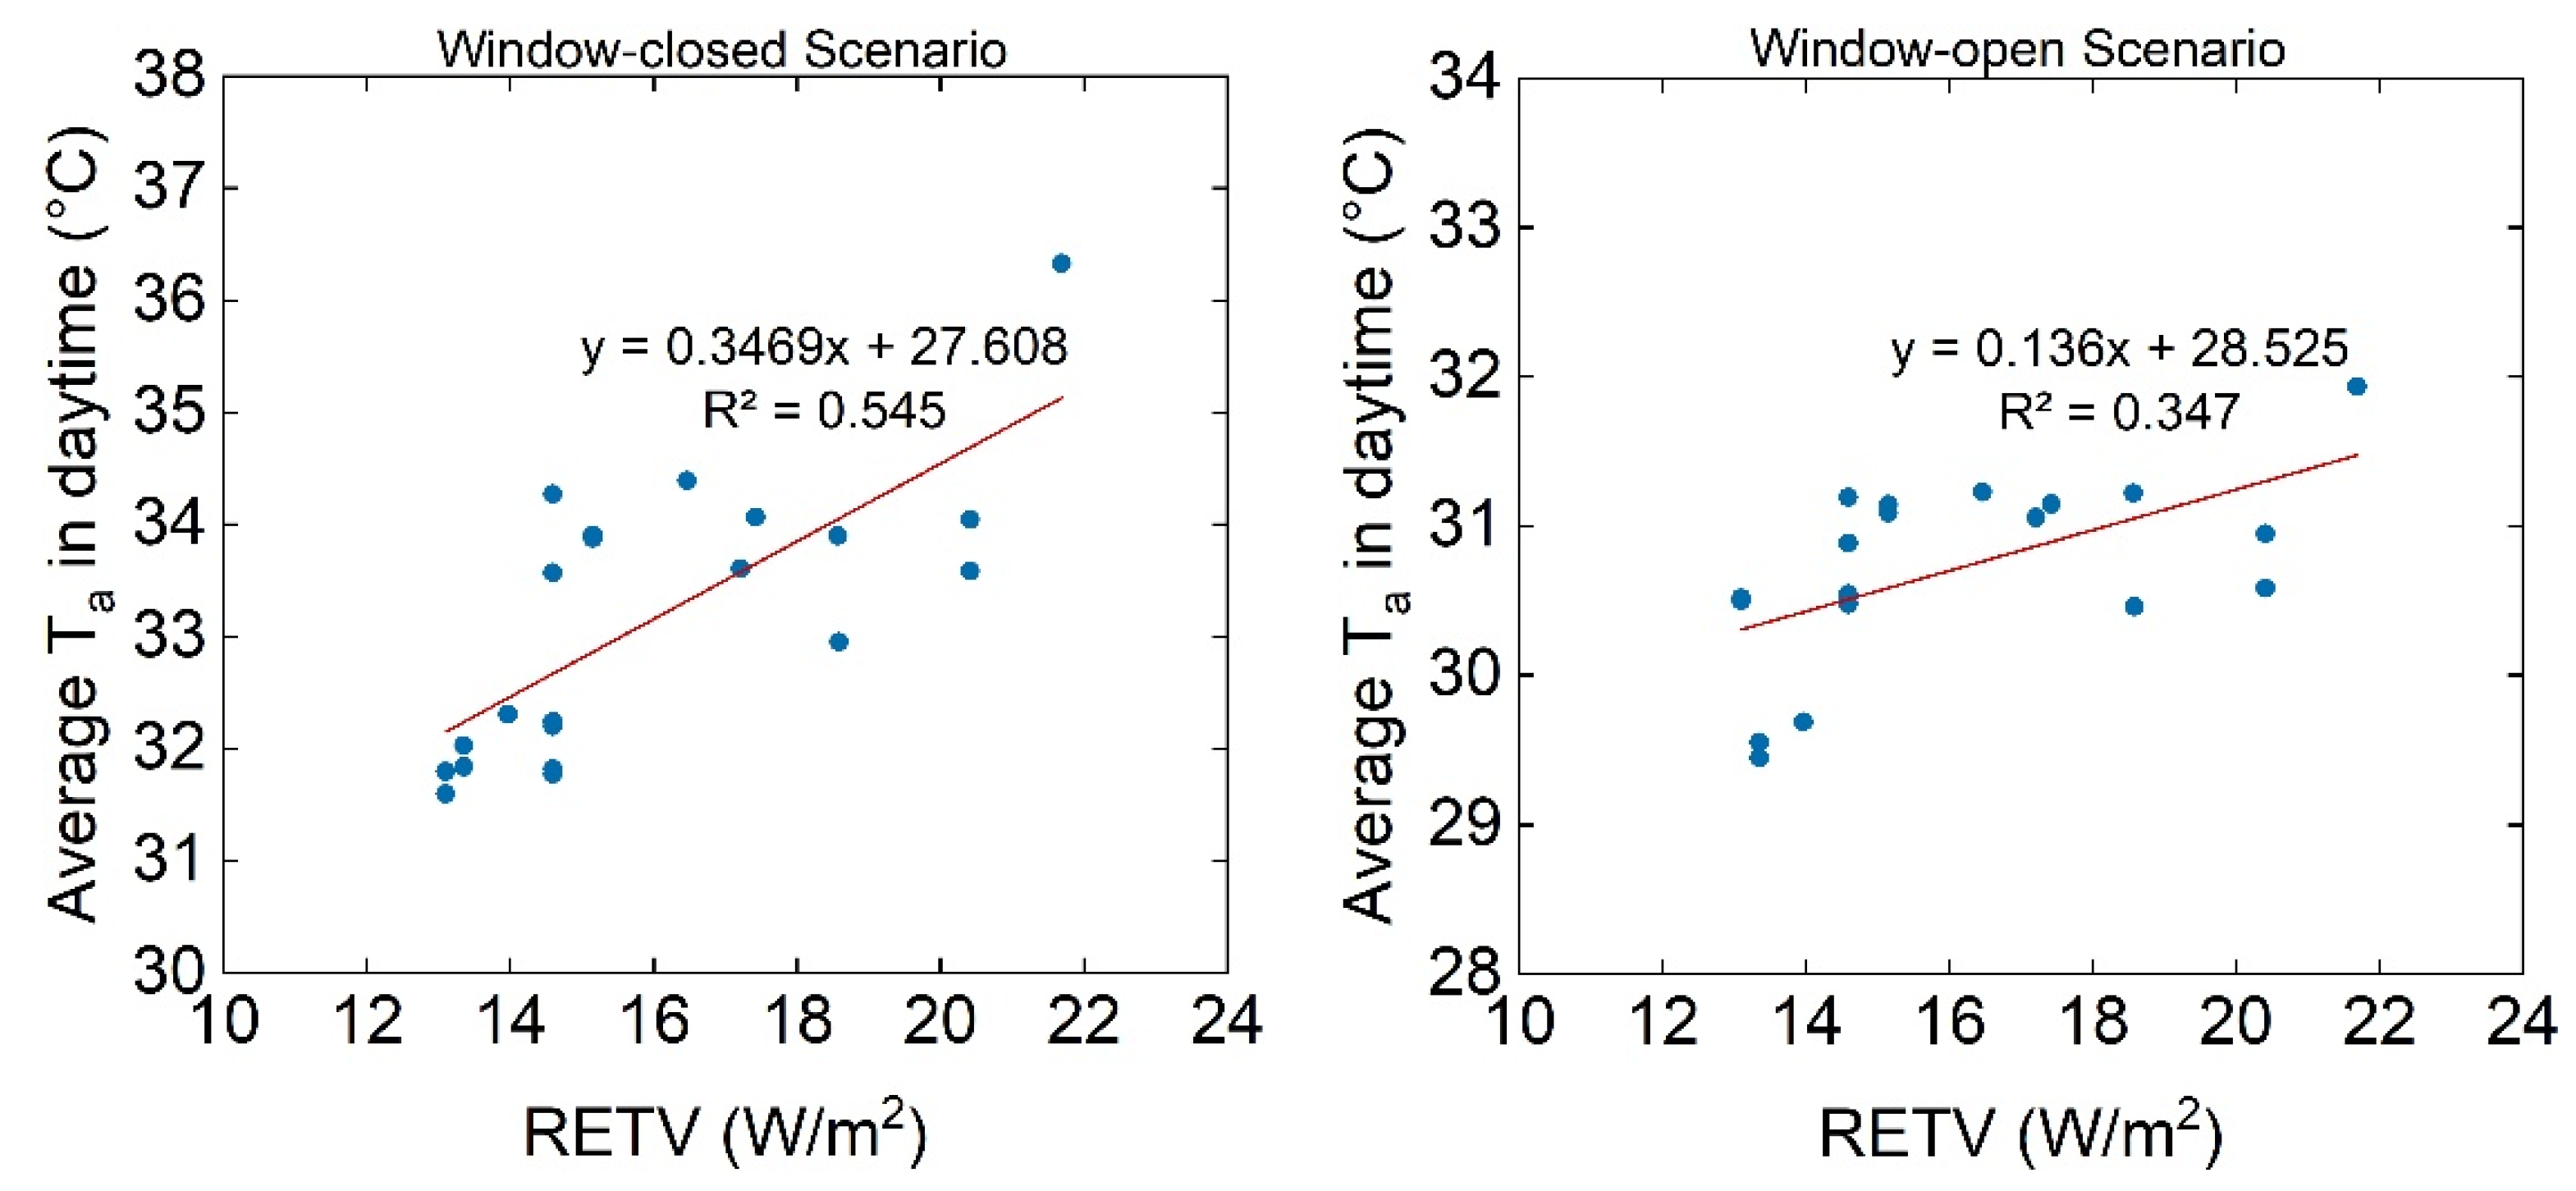
- The linear correlations between the WWR and RETV of façade and average Ta show that these two façade design parameters play important roles in affecting indoor air temperatures. Both the positive impacts of the façade’s WWR and RETV on the average Ta were confirmed by OLS regression analysis with a statistical significance at a 0.05 level. It is worth noting that the correlation between RETV and the average Ta in window-closed scenarios is more significant than that in window-open scenarios because opening the windows could change the RETV values.
Author Contributions
Funding
Institutional Review Board Statement
Informed Consent Statement
Data Availability Statement
Acknowledgments
Conflicts of Interest
Appendix A. EnergyPlus Simulation Weather Data
| Hour | Dry-Bulb Temperature (°C) | Wet-Bulb Temperature (°C) | RH (%) | Global Solar Radiation (W/m²) | Wind Speed (m/s) |
|---|---|---|---|---|---|
| 1 | 27 | 26.21 | 94 | 0 | 0 |
| 2 | 27 | 25.94 | 92 | 0 | 0 |
| 3 | 27 | 25.53 | 89 | 0 | 0 |
| 4 | 26 | 25.22 | 94 | 0 | 0 |
| 5 | 26 | 25.22 | 94 | 0 | 0 |
| 6 | 26 | 25.22 | 94 | 0 | 0 |
| 7 | 26 | 25.22 | 94 | 0 | 0 |
| 8 | 26.5 | 25.45 | 92 | 33 | 0 |
| 9 | 29 | 25.99 | 79 | 151 | 1.5 |
| 10 | 30 | 26.31 | 75 | 280 | 0.5 |
| 11 | 30.2 | 26.17 | 73 | 396 | 1.5 |
| 12 | 32 | 24.8 | 56 | 496 | 1.5 |
| 13 | 33 | 26.23 | 59 | 457 | 2.6 |
| 14 | 33.3 | 26.3 | 58 | 458 | 1.5 |
| 15 | 33 | 26.42 | 60 | 498 | 1.9 |
| 16 | 32.8 | 26.43 | 61 | 413 | 2.2 |
| 17 | 32.5 | 26.35 | 62 | 300 | 2.6 |
| 18 | 31 | 26.4 | 70 | 158 | 3.6 |
| 19 | 29.2 | 26.03 | 78 | 38 | 2 |
| 20 | 28.7 | 25.86 | 80 | 0 | 0.5 |
| 21 | 28.3 | 25.78 | 82 | 0 | 0 |
| 22 | 28 | 25.79 | 84 | 0 | 0 |
| 23 | 27.9 | 25.83 | 85 | 0 | 0 |
| 24 | 28 | 25.93 | 85 | 0 | 0 |
References
- Department of Statistics Singapore. M810381-Residents by Age Group & Type of Dwelling, Annual; Department of Statistics Singapore: Singapore, 2017.
- Teoalida. Map of HDB Blocks. 2017. Available online: http://www.teoalida.com/singapore/hdbmap/ (accessed on 14 December 2018).
- Teoalida. HDB Flats Size 1960–2010 Analysis: Are the Flats Shrinking? 2018. Available online: https://www.teoalida.com/singapore/hdbflatsizes/ (accessed on 27 November 2018).
- Wang, L.; Wong, N.H. The impacts of ventilation strategies and facade on indoor thermal environment for naturally ventilated residential buildings in Singapore. Build. Environ. 2007, 42, 4006–4015. [Google Scholar]
- Givoni, B. Comfort, climate analysis and building design guidelines. Energy Build. 1992, 18, 11–23. [Google Scholar] [CrossRef]
- Givoni, B. Climate Considerations in Building and Urban Design; John Wiley & Sons Inc.: New York, NY, USA, 1998. [Google Scholar]
- Costanzo, V.; Yao, R.; Xu, T.; Xiong, J.; Zhang, Q.; Li, B. Natural ventilation potential for residential buildings in a densely built-up and highly polluted environment. A case study. Renew. Energy 2019, 138, 340–353. [Google Scholar] [CrossRef]
- Ihm, P.; Krarti, M. Design optimization of energy efficient residential buildings in Tunisia. Build. Environ. 2012, 58, 81–90. [Google Scholar] [CrossRef]
- Jaber, S.; Ajib, S. Thermal and economic windows design for different climate zones. Energy Build. 2011, 43, 3208–3215. [Google Scholar] [CrossRef]
- Eskin, N.; Tuerkmen, H. Analysis of annual heating and cooling energy requirements for office buildings in different climates in Turkey. Energy Build. 2008, 40, 763–773. [Google Scholar] [CrossRef]
- Lam, J.C.; Tsang, C.L.; Li DH, W.; Cheung, S.O. Residential building envelope heat gain and cooling energy requirements. Energy 2005, 30, 933–951. [Google Scholar] [CrossRef]
- Al-Tamimi, N.A.M.; Fadzil, S.F.S.; Harun, W.M.W. The effects of orientation, ventilation, and varied WWR on the thermal performance of residential rooms in the tropics. J. Sustain. Dev. 2011, 4, 142–149. [Google Scholar] [CrossRef]
- Gao, C.F.; Lee, W.L. Evaluating the influence of openings configuration on natural ventilation performance of residential units in Hong Kong. Build. Environ. 2011, 46, 961–969. [Google Scholar] [CrossRef]
- Yoon, N.; Piette, M.A.; Han, J.M.; Wu, W.; Malkawi, A. Optimization of Window Positions for Wind-Driven Natural Ventilation Performance. Energies 2020, 13, 2464. [Google Scholar] [CrossRef]
- Corrado, V., Serra, V., Vosilla, A., Eds.; Performance Analysis of External Shading Devices. In Proceedings of the 30th International Passive and Low Energy Architecture (PLEA) Conference, Ahmedabad, India, 1 January 2004. [Google Scholar]
- Al-Tamimi, N.A.; Fadzil, S.F.S. The potential of shading devices for temperature reduction in high-rise residential buildings in the tropics. In Proceedings of the 2011 International Conference on Green Buildings and Sustainable Cities, Bologna, Italy, 15–16 September 2011; Secondini, P., Wu, X., Tondelli, S., Wu, J., Xie, H., Eds.; Elsevier: Amsterdam, The Netherlands, 2011; pp. 273–282. [Google Scholar]
- Wong, N.H.; Li, S. A study of the effectiveness of passive climate control in naturally ventilated residential buildings in Singapore. Build. Environ. 2007, 42, 1395–1405. [Google Scholar] [CrossRef]
- Yang, K.H.; Hwang, R.L. Energy conservation of buildings in Taiwan. Pattern Recognit. 1995, 28, 1483–1491. [Google Scholar] [CrossRef]
- Muniz, P.A. The Geometry of External Shading Devices as Related to Natural Ventilation, Daylighting and Thermal Comfort, with Particular Reference to Tropical Hot-Humid Climates. Ph.D. Thesis, Virginia Polytechnic Institute and State University, Blacksburg, VA, USA, 1987. [Google Scholar]
- Tzempelikos, A.; Athienitis, A.K. The impact of shading design and control on building cooling and lighting demand. Sol. Energy 2007, 81, 369–382. [Google Scholar] [CrossRef]
- Gratia, E.; De Herde, A. The most efficient position of shading devices in a double-skin facade. Energy Build. 2007, 39, 364–373. [Google Scholar] [CrossRef]
- Cheung, C.K.; Fuller, R.J.; Luther, M.B. Energy-efficient envelope design for high-rise apartments. Energy Build. 2005, 37, 37–48. [Google Scholar] [CrossRef]
- Building and Construction Authority. Green Mark for Residential Building: 2016 Criteria (GMRB 2016); Building and Construction Authority: Singapore, 2016. [Google Scholar]
- Energy Market Authority. Household Energy Consumption, Singapore Energy Statistics 2017; Energy Market Authority: Singapore, 2017. [Google Scholar]
- Moolavi Sanzighi, S.; Soflaei, F.; Shokouhian, M. A comparative study of thermal performance in three generations of Iranian residential buildings: Case studies in Csa Gorgan. J. Build. Phys. 2020, 44, 326–363. [Google Scholar] [CrossRef]
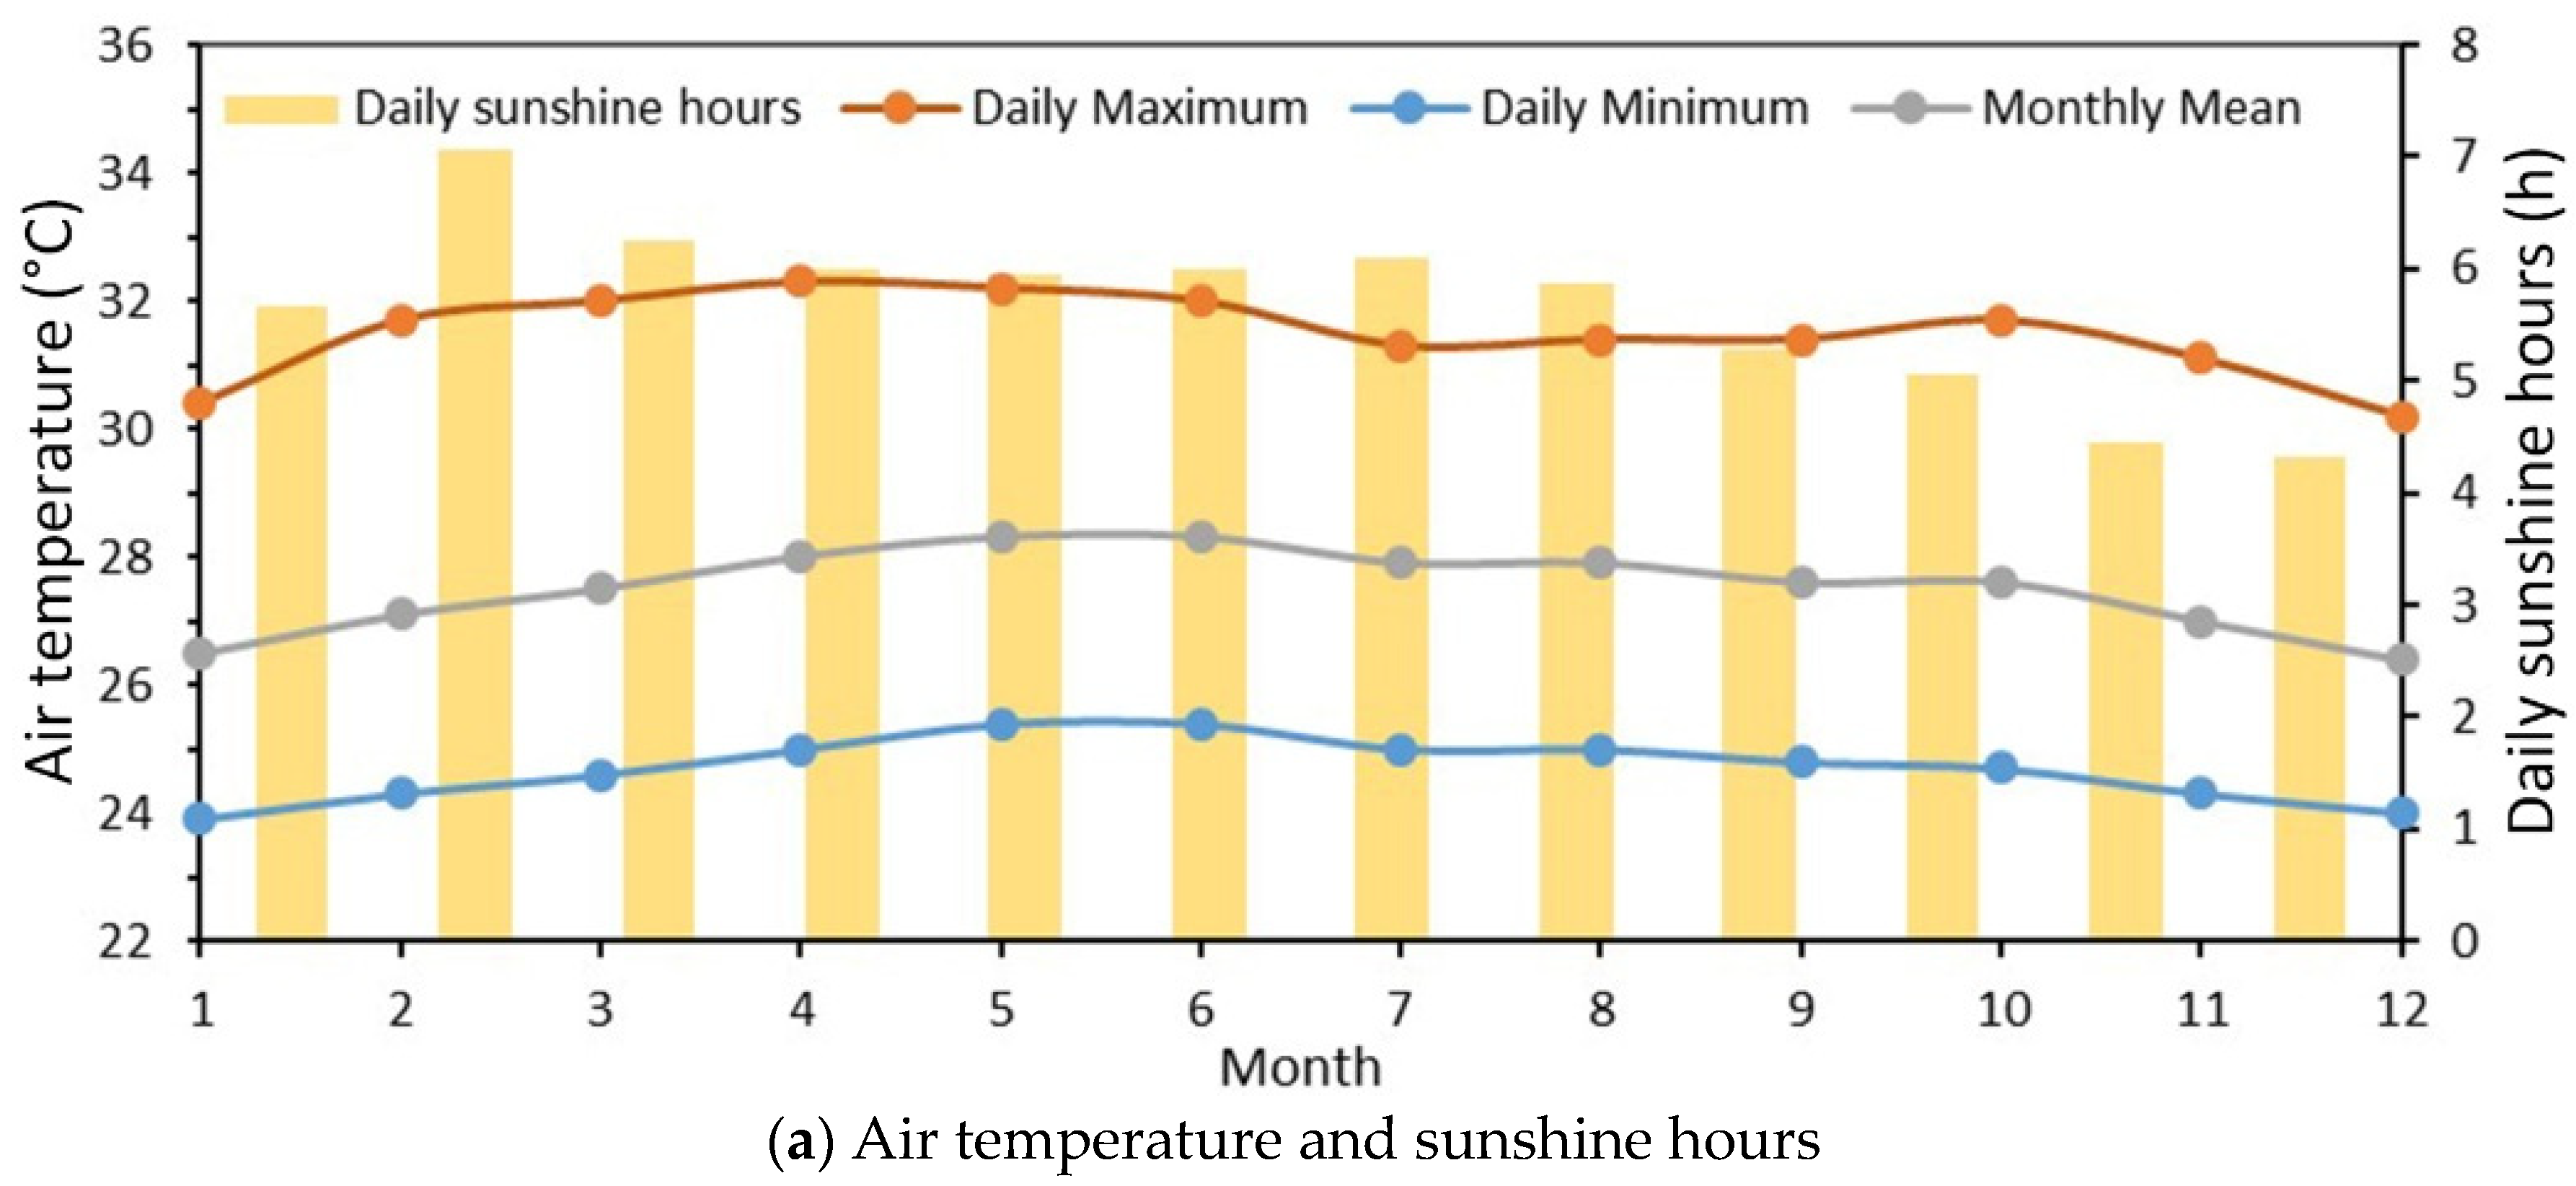
- Meteorological Service Singapore. Climate of Singapore, 2020; Meteorological Service Singapore (MSS): Singapore, 2020. Available online: http://www.weather.gov.sg/climate-climate-of-singapore/ (accessed on 1 September 2020).
- National Environment Agency. Sunshine Duration- Monthly Mean Daily Duration: National Environment Agency. 2020. Available online: https://data.gov.sg/dataset/sunshine-duration-monthly-mean-daily-duration (accessed on 1 September 2020).
- Blocken, B. Computational Fluid Dynamics for urban physics: Importance, scales, possibilities, limitations and ten tips and tricks towards accurate and reliable simulations. Build. Environ. 2015, 91, 219–245. [Google Scholar] [CrossRef]
- Tominaga, Y.; Mochida, A.; Yoshie, R.; Kataoka, H.; Nozu, T.; Yoshikawa, M.; Shirasawa, T. AIJ guidelines for practical applications of CFD to pedestrian wind environment around buildings. J. Wind. Eng. Ind. Aerodyn. 2008, 96, 1749–1761. [Google Scholar] [CrossRef]
- Franke, J.; Hellsten, A.; Schluenzen, K.H.; Carissimo, B. The COST 732 Best Practice Guideline for CFD simulation of flows in the urban environment: A summary. Int. J. Environ. Pollut. 2011, 44, 419–427. [Google Scholar] [CrossRef]
- Richards, P.J.; Hoxey, R.P. Appropriate boundary conditions for computational wind engineering models using the k-ε turbulence model. In Computational Wind Engineering 1; Murakami, S., Ed.; Elsevier: Oxford, UK, 1993; pp. 145–153. [Google Scholar]
- Launder, B.E.; Spalding, D.B. The numerical computation of turbulent flows. Comput. Methods Appl. Mech. Eng. 1974, 3, 269. [Google Scholar] [CrossRef]
- Cebeci, T.; Bradshaw, P. Momentum Transfer in Boundary Layers; Hemisphere Publishing Corporation: New York, NY, USA, 1977. [Google Scholar]
- Shih, T.-H.; Liou, W.W.; Shabbir, A.; Yang, Z.; Zhu, J. A new k-ϵ eddy viscosity model for high reynolds number turbulent flows. Comput. Fluids 1995, 24, 227–238. [Google Scholar] [CrossRef]
- Franke, J.; Hirsch, C.; Jensen, A.G.; Krüs, H.W.; Schatzmann, M.; Westbury, P.S.; Miles, S.D.; Wisse, J.A.; Wright, N.G. (Eds.) Recommendations on the use of CFD in wind engineering. In Proceedings of the International Conference on Urban Wind Engineering and Building Aerodynamics, Sint-Genesius-Rode, Belgium, 5–7 May 2004. [Google Scholar]
- Linden, P.F. The fluid mechanics of natural ventilation. Annu. Rev. Fluid Mech. 1999, 31, 201–238. [Google Scholar] [CrossRef]
- Sorensen, D.N.; Nielsen, P.V. Quality control of computational fluid dynamics in indoor environments. Indoor Air 2003, 13, 2–17. [Google Scholar] [CrossRef] [PubMed]
- Ramponi, R.; Blocken, B. CFD simulation of cross-ventilation for a generic isolated building: Impact of computational parameters. Build. Environ. 2012, 53, 34–48. [Google Scholar] [CrossRef]
- Karava, P.; Stathopoulos, T.; Athienitis, A.K. Airflow assessment in cross-ventilated buildings with operable facade elements. Build. Environ. 2011, 46, 266–279. [Google Scholar] [CrossRef]
- Wang, L.; Wong Nyuk, H.; Li, S. Facade design optimization for naturally ventilated residential buildings in Singapore. Energy Build. 2007, 39, 954–961. [Google Scholar] [CrossRef]
- Fung, Y.W.; Lee, W.L. Identifying the most influential parameter affecting natural ventilation performance in high-rise high-density residential buildings. Indoor Built Environ. 2015, 24, 803–812. [Google Scholar] [CrossRef]
- Heiselberg, P.; Sandberg, M. Evaluation of discharge coefficients for window openings in wind driven natural ventilation. Int. J. Vent. 2006, 5, 43–52. [Google Scholar] [CrossRef]
- Heiselberg, P.; Bjørn, E.; Nielsen, P.V. Impact of open windows on room air flow and thermal comfort. Int. J. Vent. 2002, 1, 91–100. [Google Scholar] [CrossRef]




| Generation | HDB Town | New Town/Estate | Flat Type | Total Flat Amount |
|---|---|---|---|---|
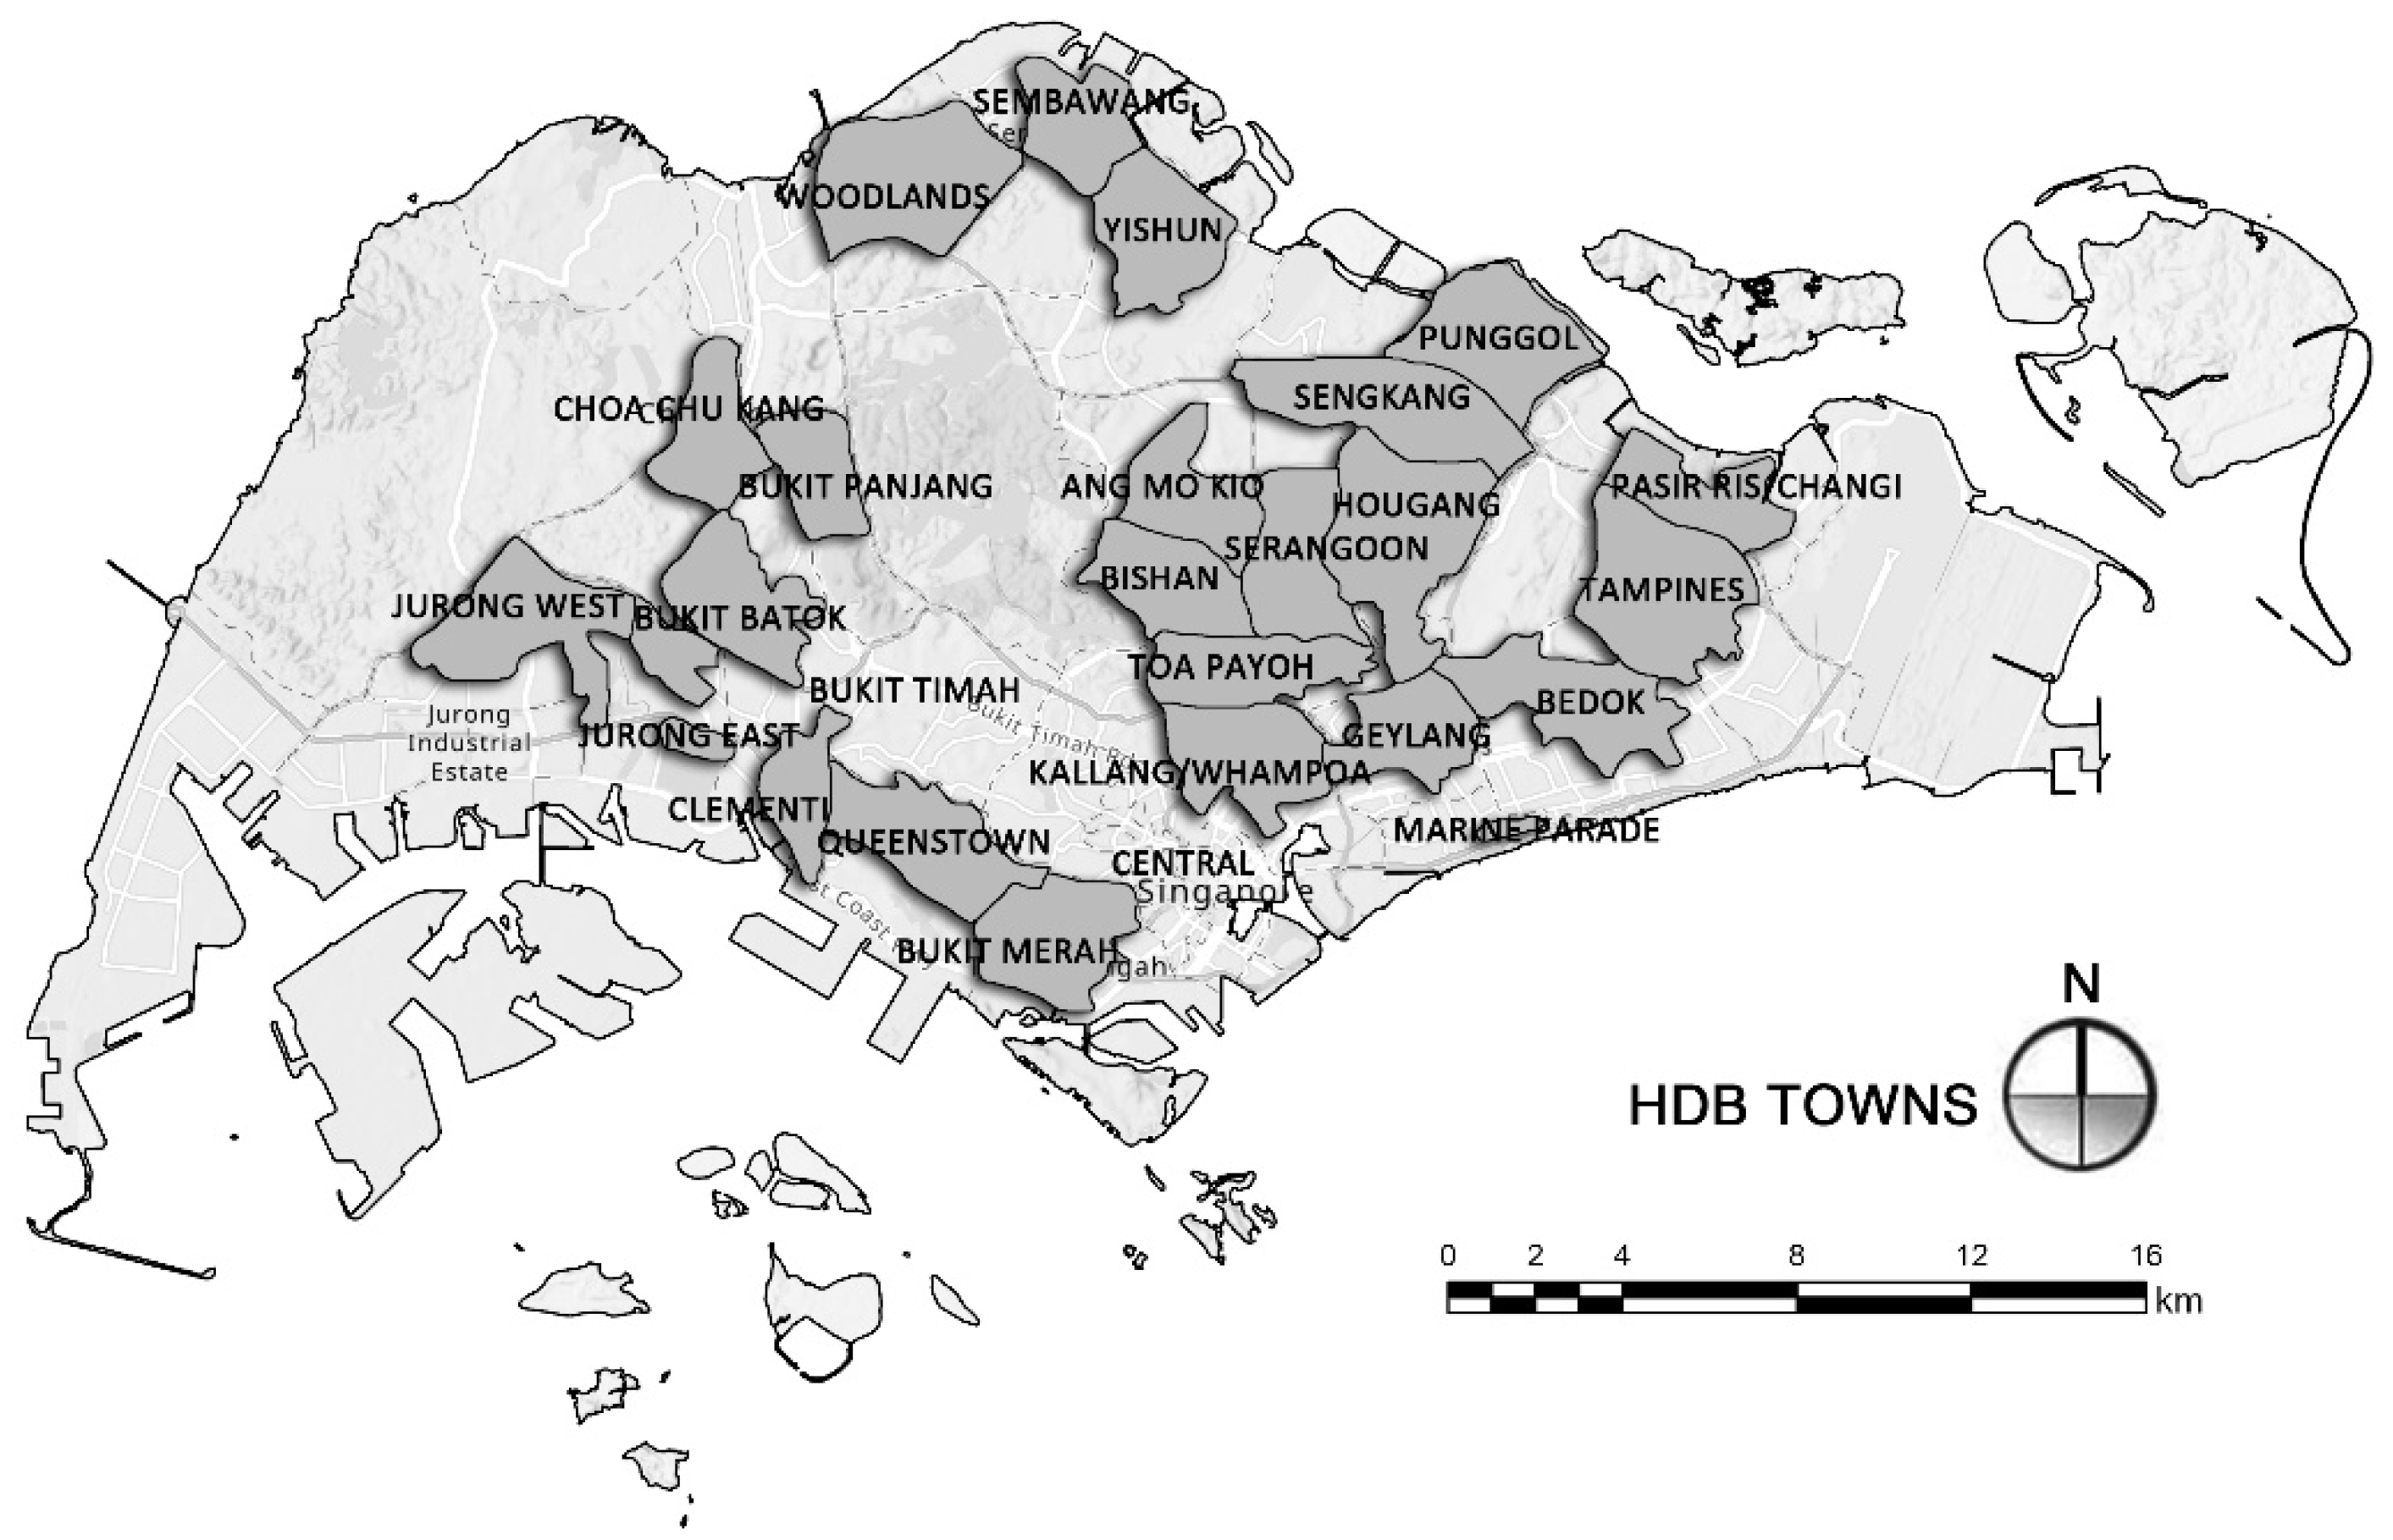
| 1970s | Ang Mo Kio | Ang Mo Kio New Town | 3-room | 24,575 |
| 1980s | Tampines | Tampines New Town | 4-room | 24,046 |
| 1990s | Sengkang | Sengkang New Town | 4-room | 27,684 |
| 2000s | Punggol | Punggol New Town | 4-room | 16,613 |
| 2010s | Yishun | Yishun New Town | 4-room | 4722 |
| Target Building | Total Stories | Building Height (m) | Target Units’ Story | Target Story Height (m) |
|---|---|---|---|---|
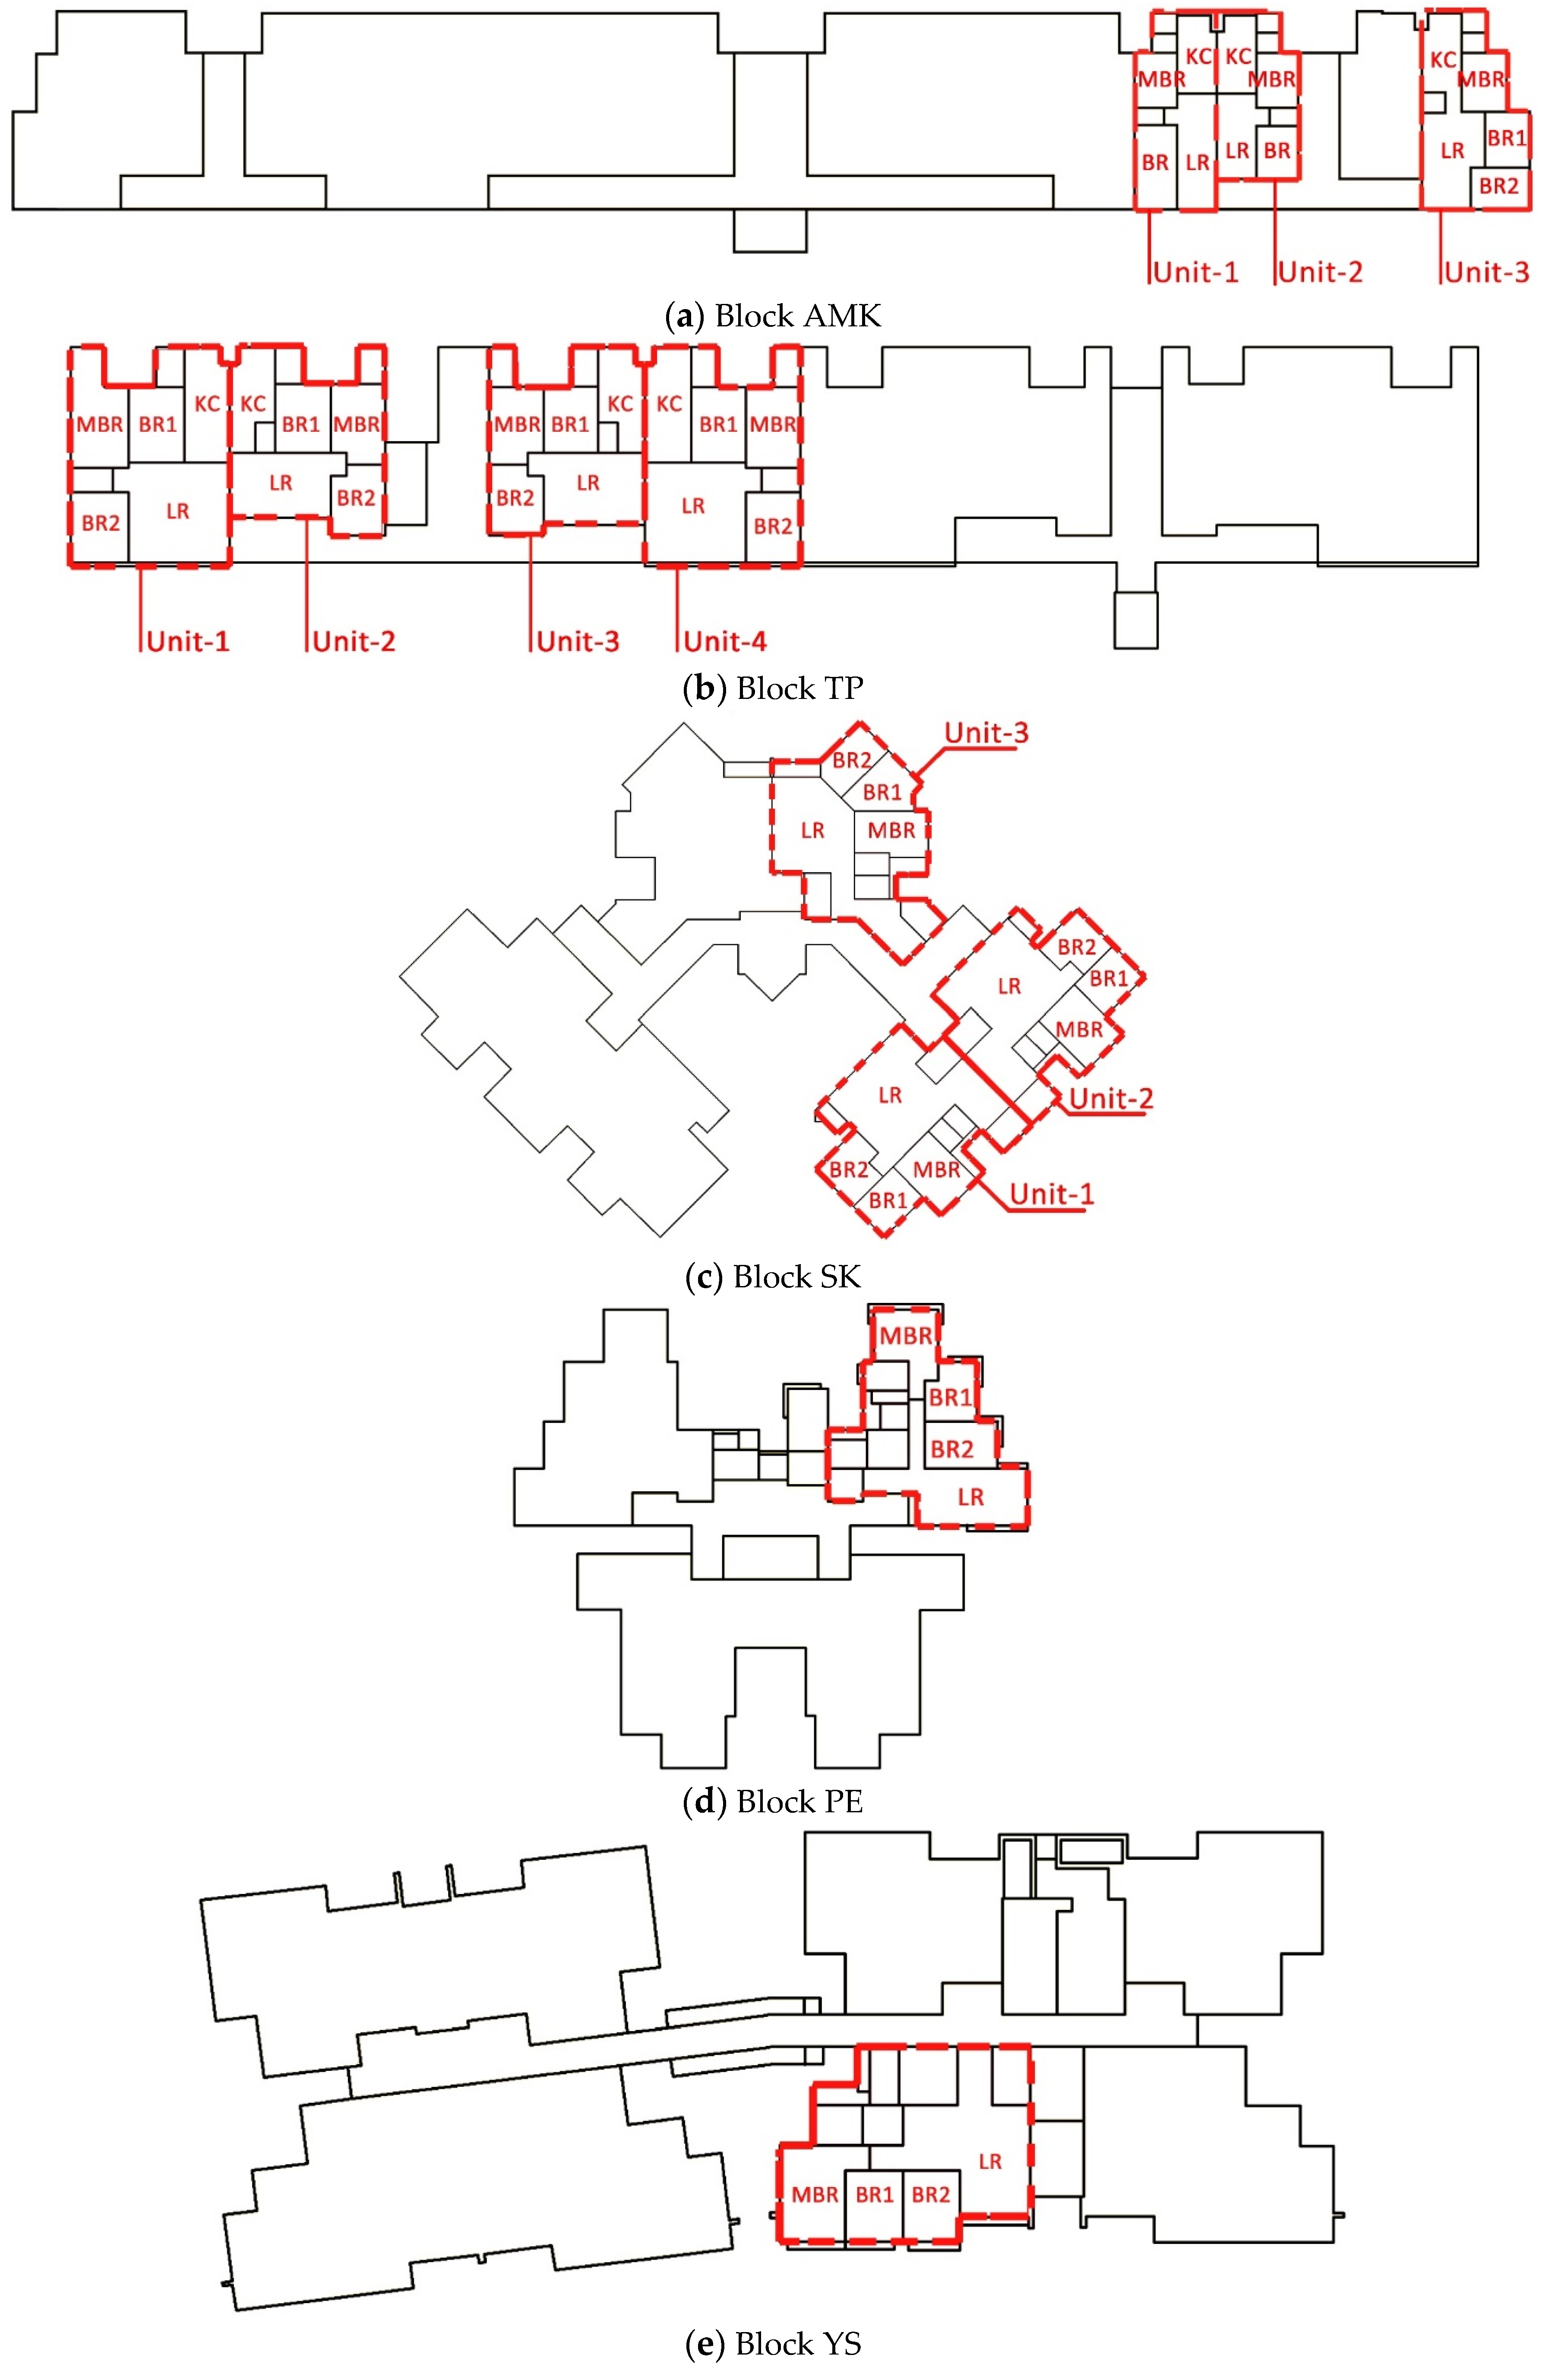
| AMK | 13 | 36.7 | 7 | 17.1 |
| TP | 13 | 36.7 | 7 | 17.1 |
| SK | 17 | 49.4 | 9 | 23.2 |
| PE | 19 | 54 | 9 | 23.2 |
| YS | 13 | 38.2 | 7 | 17.6 |
| Unit | Zone | Orientation | WWR | Depth of Shading | RETV (W/m2) | Adjacent to Corridor |
|---|---|---|---|---|---|---|
| AMK1 | LR | S | 0.3 | 200 mm | 15.15 | No |
| KC | N | 0.4 | 200 mm | 16.83 | No | |
| BR | S | 0.3 | 200 mm | 15.15 | No | |
| AMK2 | LR | S | 0.2 | 200 mm | 13.10 | Yes |
| KC | N | 0.4 | 200 mm | 16.83 | No | |
| BR | S | 0.2 | 200 mm | 13.10 | Yes | |
| AMK3 | LR | S | 0.4 | 200 mm | 17.21 | No |
| KC | N | 0.4 | 200 mm | 16.83 | No | |
| BR1 | E | 0 | No | 4.59 | No | |
| BR2 | E | 0 | No | 4.59 | No | |
| MBR | E | 0 | No | 4.59 | No | |
| TP1 | BR2 | S | 0.3 | 400 mm | 14.59 | No |
| BR2 | W | 0 | No | 7.04 | No | |
| MBR | W | 0.1 | No | 21.51 | No | |
| TP2 | LR | S | 0.3 | 400 mm | 14.59 | Yes |
| BR2 | S | 0.3 | 400 mm | 14.59 | Yes | |
| TP3 | LR | S | 0.3 | 400 mm | 14.59 | Yes |
| BR2 | S | 0.3 | 400 mm | 14.59 | Yes | |
| TP4 | LR | S | 0.4 | 400 mm | 16.46 | No |
| BR2 | S | 0.3 | 400 mm | 14.59 | No | |
| SK1 | BR1 | SW | 0 | No | 11.32 | No |
| MBR | SE | 0.1 | 400 mm | 13.35 | No | |
| SK2 | BR1 | NE | 0 | No | 11.32 | No |
| MBR | SE | 0.1 | 400 mm | 13.35 | No | |
| SK3 | BR2 | NE | 0.3 | 400 mm | 17.42 | No |
| MBR | E | 0.1 | 400 mm | 13.97 | No | |
| PE | LR | S | 0.5 | 850 mm | 18.57 | No |
| BR2 | E | 0.3 | 350 mm | 19.11 | No | |
| MBR | N | 0.6 | 350 mm | 21.69 | No | |
| YS | LR | S | 0.5 | 300 mm | 20.41 | No |
| BR1 | S | 0.5 | 300 mm | 20.41 | No | |
| BR2 | S | 0.4 | 300 mm | 18.58 | No | |
| MBR | W | 0.5 | 300 mm | 20.41 | No |
| Material | Conductivity (W/mK) | Specific Heat (J/kg K) | Density (kg/m3) | Solar Absorptance | |
| Wall | Reinforced concrete | 2.3 | 1000 | 2300 | 0.6 |
| Material | Solar heat gain coefficient (SHGC) | U-value (W/m2 K) | |||
| Glass | Grey glass | 0.71 | 5.5 | ||
| No. | Grid Quality | Minimum Size (m) | Total Cell Numbers |
|---|---|---|---|
| 1 | Finest | 0.005 | 3,058,596 |
| 2 | Fine | 0.02 | 2,477,176 |
| 3 | Medium | 0.05 | 2,018,771 |
| 4 | Coarse | 0.2 | 828,860 |
| 5 | Coarsest | 0.5 | 361,088 |
| Independent Variable | Dependent Variable | Window Closed | Window Open | ||||||
|---|---|---|---|---|---|---|---|---|---|
| β | t | p | R2 | β | t | p | R2 | ||
| WWR | Tavg (Daytime) | 6.621 | 4.739 | 0 | 0.542 | 3.457 | 5.459 | 0 | 0.611 |
| RETV | Tavg (Daytime) | 0.347 | 4.774 | 0 | 0.545 | 0.136 | 3.175 | 0.005 | 0.347 |
Publisher’s Note: MDPI stays neutral with regard to jurisdictional claims in published maps and institutional affiliations. |
© 2022 by the authors. Licensee MDPI, Basel, Switzerland. This article is an open access article distributed under the terms and conditions of the Creative Commons Attribution (CC BY) license (https://creativecommons.org/licenses/by/4.0/).
Share and Cite
Deng, J.-Y.; Wong, N.H.; Hii, D.J.C.; Yu, Z.; Tan, E.; Zhen, M.; Tong, S. Indoor Thermal Environment in Different Generations of Naturally Ventilated Public Residential Buildings in Singapore. Atmosphere 2022, 13, 2118. https://doi.org/10.3390/atmos13122118
Deng J-Y, Wong NH, Hii DJC, Yu Z, Tan E, Zhen M, Tong S. Indoor Thermal Environment in Different Generations of Naturally Ventilated Public Residential Buildings in Singapore. Atmosphere. 2022; 13(12):2118. https://doi.org/10.3390/atmos13122118
Chicago/Turabian StyleDeng, Ji-Yu, Nyuk Hien Wong, Daniel Jun Chung Hii, Zhongqi Yu, Erna Tan, Meng Zhen, and Shanshan Tong. 2022. "Indoor Thermal Environment in Different Generations of Naturally Ventilated Public Residential Buildings in Singapore" Atmosphere 13, no. 12: 2118. https://doi.org/10.3390/atmos13122118
APA StyleDeng, J.-Y., Wong, N. H., Hii, D. J. C., Yu, Z., Tan, E., Zhen, M., & Tong, S. (2022). Indoor Thermal Environment in Different Generations of Naturally Ventilated Public Residential Buildings in Singapore. Atmosphere, 13(12), 2118. https://doi.org/10.3390/atmos13122118


