Article

Performance Evaluation of Fee-Charging Policies to Reduce the Carbon Emissions of Urban Transportation in China

1
Advanced Institute of Natural Sciences, Beijing Normal University, Zhuhai 519087, China
2
School of Environment, Beijing Normal University, Beijing 100875, China
3
College of Resource Environment and Tourism, Capital Normal University, Beijing 100048, China
4
Zhixing College, Beijing Normal University, Zhuhai 519087, China
5
School of Civil and Transportation Engineering, Guangdong University of Technology, Guangzhou 510006, China
*
Author to whom correspondence should be addressed.
Atmosphere 2022, 13(12), 2095; https://doi.org/10.3390/atmos13122095
Submission received: 17 November 2022 / Revised: 10 December 2022 / Accepted: 12 December 2022 / Published: 13 December 2022
(This article belongs to the Section Climatology)

Abstract

:
As a market-based instrument for transportation demand management, a transport fee-charging policy can not only effectively reduce traffic congestion, but also improve air quality. Considering the urgent need to improve urban transport fee-charging policies and reduce transport carbon emissions, the paper focuses on the role of the performance of fee-charging policies in reducing the carbon emissions of urban transport. In this study, we propose a methodological framework for the performance evaluation of urban traffic carbon emission fee-charging policies. First, we analyze the current situation of the implementation of fee-charging policies and their relationship with urban traffic congestion. Subsequently, we analyze changing trends of carbon emissions associated with transportation travel in Beijing in recent years, to identify the main sources of carbon emissions from transport. Finally, we used the DEA method to evaluate the performance of the fee policies for urban transport, which are meant to reduce carbon emissions, analyze their implementation efficiency, and then discuss the main factors affecting their efficiency. The results show that with the implementation of fee-charging policies, urban traffic congestion has eased. The overall carbon dioxide (CO2) emissions from transportation in Beijing grew rapidly. CO2 emissions generated by car travel are the main source of carbon emissions from transportation in Beijing. The average value of the overall technical efficiency (TE) of Beijing’s fee-charging policies to reduce transportation carbon emissions from 2006 to 2018 is 0.962, indicating that the overall implementation of Beijing’s fee-charging policies has been effective. Adjustments to the fee structure reduce motor vehicle travel to an extent, increase the proportion of green travel, and reduce the intensity of transportation carbon emissions. The technical non-efficiency in Beijing’s fee-charging policy is mainly due to non-efficiency of scale, followed by pure technical non-efficiency. Appropriately adjusting the fee structures imposed by different policies would help to improve the efficiency of policy implementation.

1. Introduction

Currently, global warming is recognized as a real and daunting threat to global development and the human race [1,2]. It has already caused many problems, including the melting of glaciers, and droughts, which affect human lives on a global scale [3,4]. More than one-half of the world’s population now lives in urban areas, and these cities are responsible for more than 75% of global greenhouse gas (GHG) emissions [5,6]. In cities, the impacts of transport activities may be even greater [7,8,9,10,11]. As the largest economy in the developing world, China is experiencing rapid economic growth and urbanization, which is coupled with a substantial increase in motorization. To reduce carbon emissions from the transport sector, a rigorous analysis of the economic impacts of an emissions fee as part of a policy framework and coordination scheme is essential. China’s government has implemented many measures (including a motor vehicle lottery policy, vigorously developing public transport, economic policy, etc.) to improve urban traffic so as to significantly reduce air pollutants and GHG emissions [12,13,14,15].
The experience of developed countries has shown that emissions charges are an effective way for the government to intervene in environmental protection in order to establish and implement a set of environmental and economic policies suitable for social and economic development [16,17,18,19]. An effective combination of environmental and economic policies can correct the “failure” of economic mechanisms, compensate for the lack of command and control options, and allow for the effective allocation and use of environmental resources through low-cost economic means. Road congestion pricing and parking levies have been proposed as more effective strategies to mitigate traffic congestion in urban realities and raise social welfare in society [20,21,22,23]. The implementation of an appropriate pricing policy in an urban area could alleviate both environmental and congestion problems by encouraging a shift toward more sustainable modes of transportation [18,19]. Parking levies are a charge on a specific type of parking in a city. Parking levies have been introduced in Singapore (1975–1998), China (Beijing (2002) and Shanghai (2005)), and Australia (Sydney (1992) and Perth (1999)) [17]. Parking levies have previously been used to manage congestion, encourage public transport use, revitalize an area, provide revenue for subsidies, fund public transport investment, improve air quality, and encourage or discourage certain types of users (shoppers/visitors and commuters, respectively) [24,25,26].
With our current in-depth understanding of carbon emissions due to urban traffic in the face of global climate change, reducing urban residents’ carbon emissions from travel has gradually become an important part of reducing traffic carbon emissions and building low-carbon cities [27,28,29,30]. Alsabbagh [31] assessed different measures for road transport sector emissions reduction in Bahrain using a multi-criteria analysis. The results showed that an improved fuel economy standard was the top-ranked measure for road transport emissions reduction. Hasan et al. [32] analyze the acceptability of New Zealand’s transport emission reduction policies. When considering their costs, benefits, mitigation potential, and ethical considerations, subsidizing buses is a good policy measure. In recent years, data envelopment analysis (DEA) has been widely used in environmental efficiency evaluation [33,34,35]. DEA is a popular methodology for estimating the efficiency of decision-making units (DMUs) based on the inputs that each unit uses and the outputs that it produces, i.e., the C2R-DEA model [36]. Because of the characteristics of DEA evaluation, scholars in China and elsewhere have had many achievements in the theoretical research and practical application of the DEA method in past years [37,38,39,40,41,42,43]. EI Mehdi et al. [37] used the DEA method to evaluate the efficiency of Moroccan fiscal expenditure, proving that the population size of Morocco is negatively correlated with the efficiency of financial expenditure. Rotoli et al. [38] described and compared new and previous railway charge regimes, presenting a case study on selected Italian corridors, and used the DEA method to rank the efficiency of different rail segments based on the viewpoints of infrastructure managers, rail operators, and rail regulators. Liu and Wu [40] took 30 regional transportation departments in China as the research object, took CO2 as an undesirable output, and used the slack-based DEA model to evaluate the CO2 emission efficiency. Sun et al. [42] proposed a nonradial DEA preference model to evaluate and analyze the efficiency of Chinese-listed port enterprises. Chen et al. [43] constructed three different cross-evaluation strategies to develop the new DEA cross-efficiency approach; these studies proposed some interesting conclusions and useful suggestions to help the government improve its environmental efficiency.
The evaluation and improvement of policy performance efficiency are crucial to striking the balance between economic development and environmental protection. As a market-based instrument for transportation demand management, transport fee-charging policies can not only effectively reduce traffic congestion, but also improve air quality. However, there are few studies on how an effective environmental and economic policy, and fee-charging policies can improve the implementation efficiency of various policies by properly adjusting fee structures and how they can play a positive role in reducing the emissions of motor vehicle pollutants and in improving the efficiency of regional emission reduction. Considering the urgent need to improve urban transport fee-charging policies and reduce transport carbon emissions, this paper focuses on the role of the performance of fee-charging policies in reducing the carbon emissions of urban transport. To study the impact of urban traffic charging policies on CO2 emissions, this paper proposes a methodological framework for the performance evaluation of urban traffic carbon emission fee-charging policies. First, we analyze the current situation of the implementation of fee-charging policies and their relationship with urban traffic congestion. Subsequently, we use a bottom-up approach to analyze changing trends of carbon emissions associated with transportation travel in Beijing in recent years, to identify the main sources of carbon emissions from transport. Finally, we used the DEA method to evaluate the performance of the fee policies for urban transport, which are meant to reduce carbon emissions, analyze their implementation efficiency, discuss the main factors affecting their efficiency, and then propose suggestions to improve the performance of this policy in the future. The results provide a very interesting perspective on how an effective environmental and economic policy, and fee-charging policies can improve the efficiency of various policies by properly adjusting fee structures, and how they can play a positive role in reducing the emissions of motor vehicle pollutants and in improving the efficiency of regional emission reduction. By analyzing the efficiency of implementing fee-charging policies to reduce traffic carbon emissions, this paper discusses the main factors affecting implementation efficiency to provide a reference and basis for improving the effect of implementing urban traffic fee-charging policies and the management of carbon emission reductions.
The structure of this paper is as follows. Section 2 describes the methodology in detail, which consists of a calculation model for carbon emissions from urban transport and the DEA model. The data sources and descriptive statistics are also presented. The results of the policy implementation—changes in transport-related CO2 emissions from urban transport—and a performance evaluation are presented in Section 4. Finally, a range of conclusions is presented in Section 5.

2. Materials and Methods

2.1. Study Area

Located in the north of North China Plain [44], Beijing is a world-famous ancient capital and modern international city (Figure 1). In 2020, the city had 16 districts with a total area of 16,410.54 km2 and a permanent population of 21.8931 million [45]. In 2020, Beijing’s GDP reached CNY 3610.26 billion, an increase of 1.2% over 2019 at comparable prices [46]. Due to the acceleration of urbanization and the change in the urban spatial layout in recent years, there has been a serious separation of jobs–housing in Beijing, which is manifested in the long commuting time and distance of urban residents, and leads to the increase in urban traffic pressure and traffic congestion in rush hours. What is worse, it will lead to an increase in carbon emissions from urban transportation, making it more difficult for cities to reduce carbon emissions. In recent years, the proportion of traffic CO2 emissions out of the total carbon emissions of Beijing has been increasing. In 2020, transport CO2 emissions accounted for more than 40% of the total carbon dioxide emissions in Beijing. As the most representative city, Beijing has experienced rapid urbanization and economic growth, and societal transformation, as well as increasing transport travel and CO2 emissions. Beijing has a strong demand for carbon emission reduction and air quality improvement. In order to reduce current urban transport carbon emissions, Beijing has implemented policies including private car restrictions and lottery, public transport and taxi price adjustment, fuel price policy, and so on. The evaluation and improvement of policy performance efficiency are crucial to striking the balance between economic development and environmental protection. For this reason, we chose Beijing as the case area to focus on the role of the performance of fee-charging policies in reducing the carbon emissions of urban transport.

2.2. Methodology

2.2.1. Methodological Framework

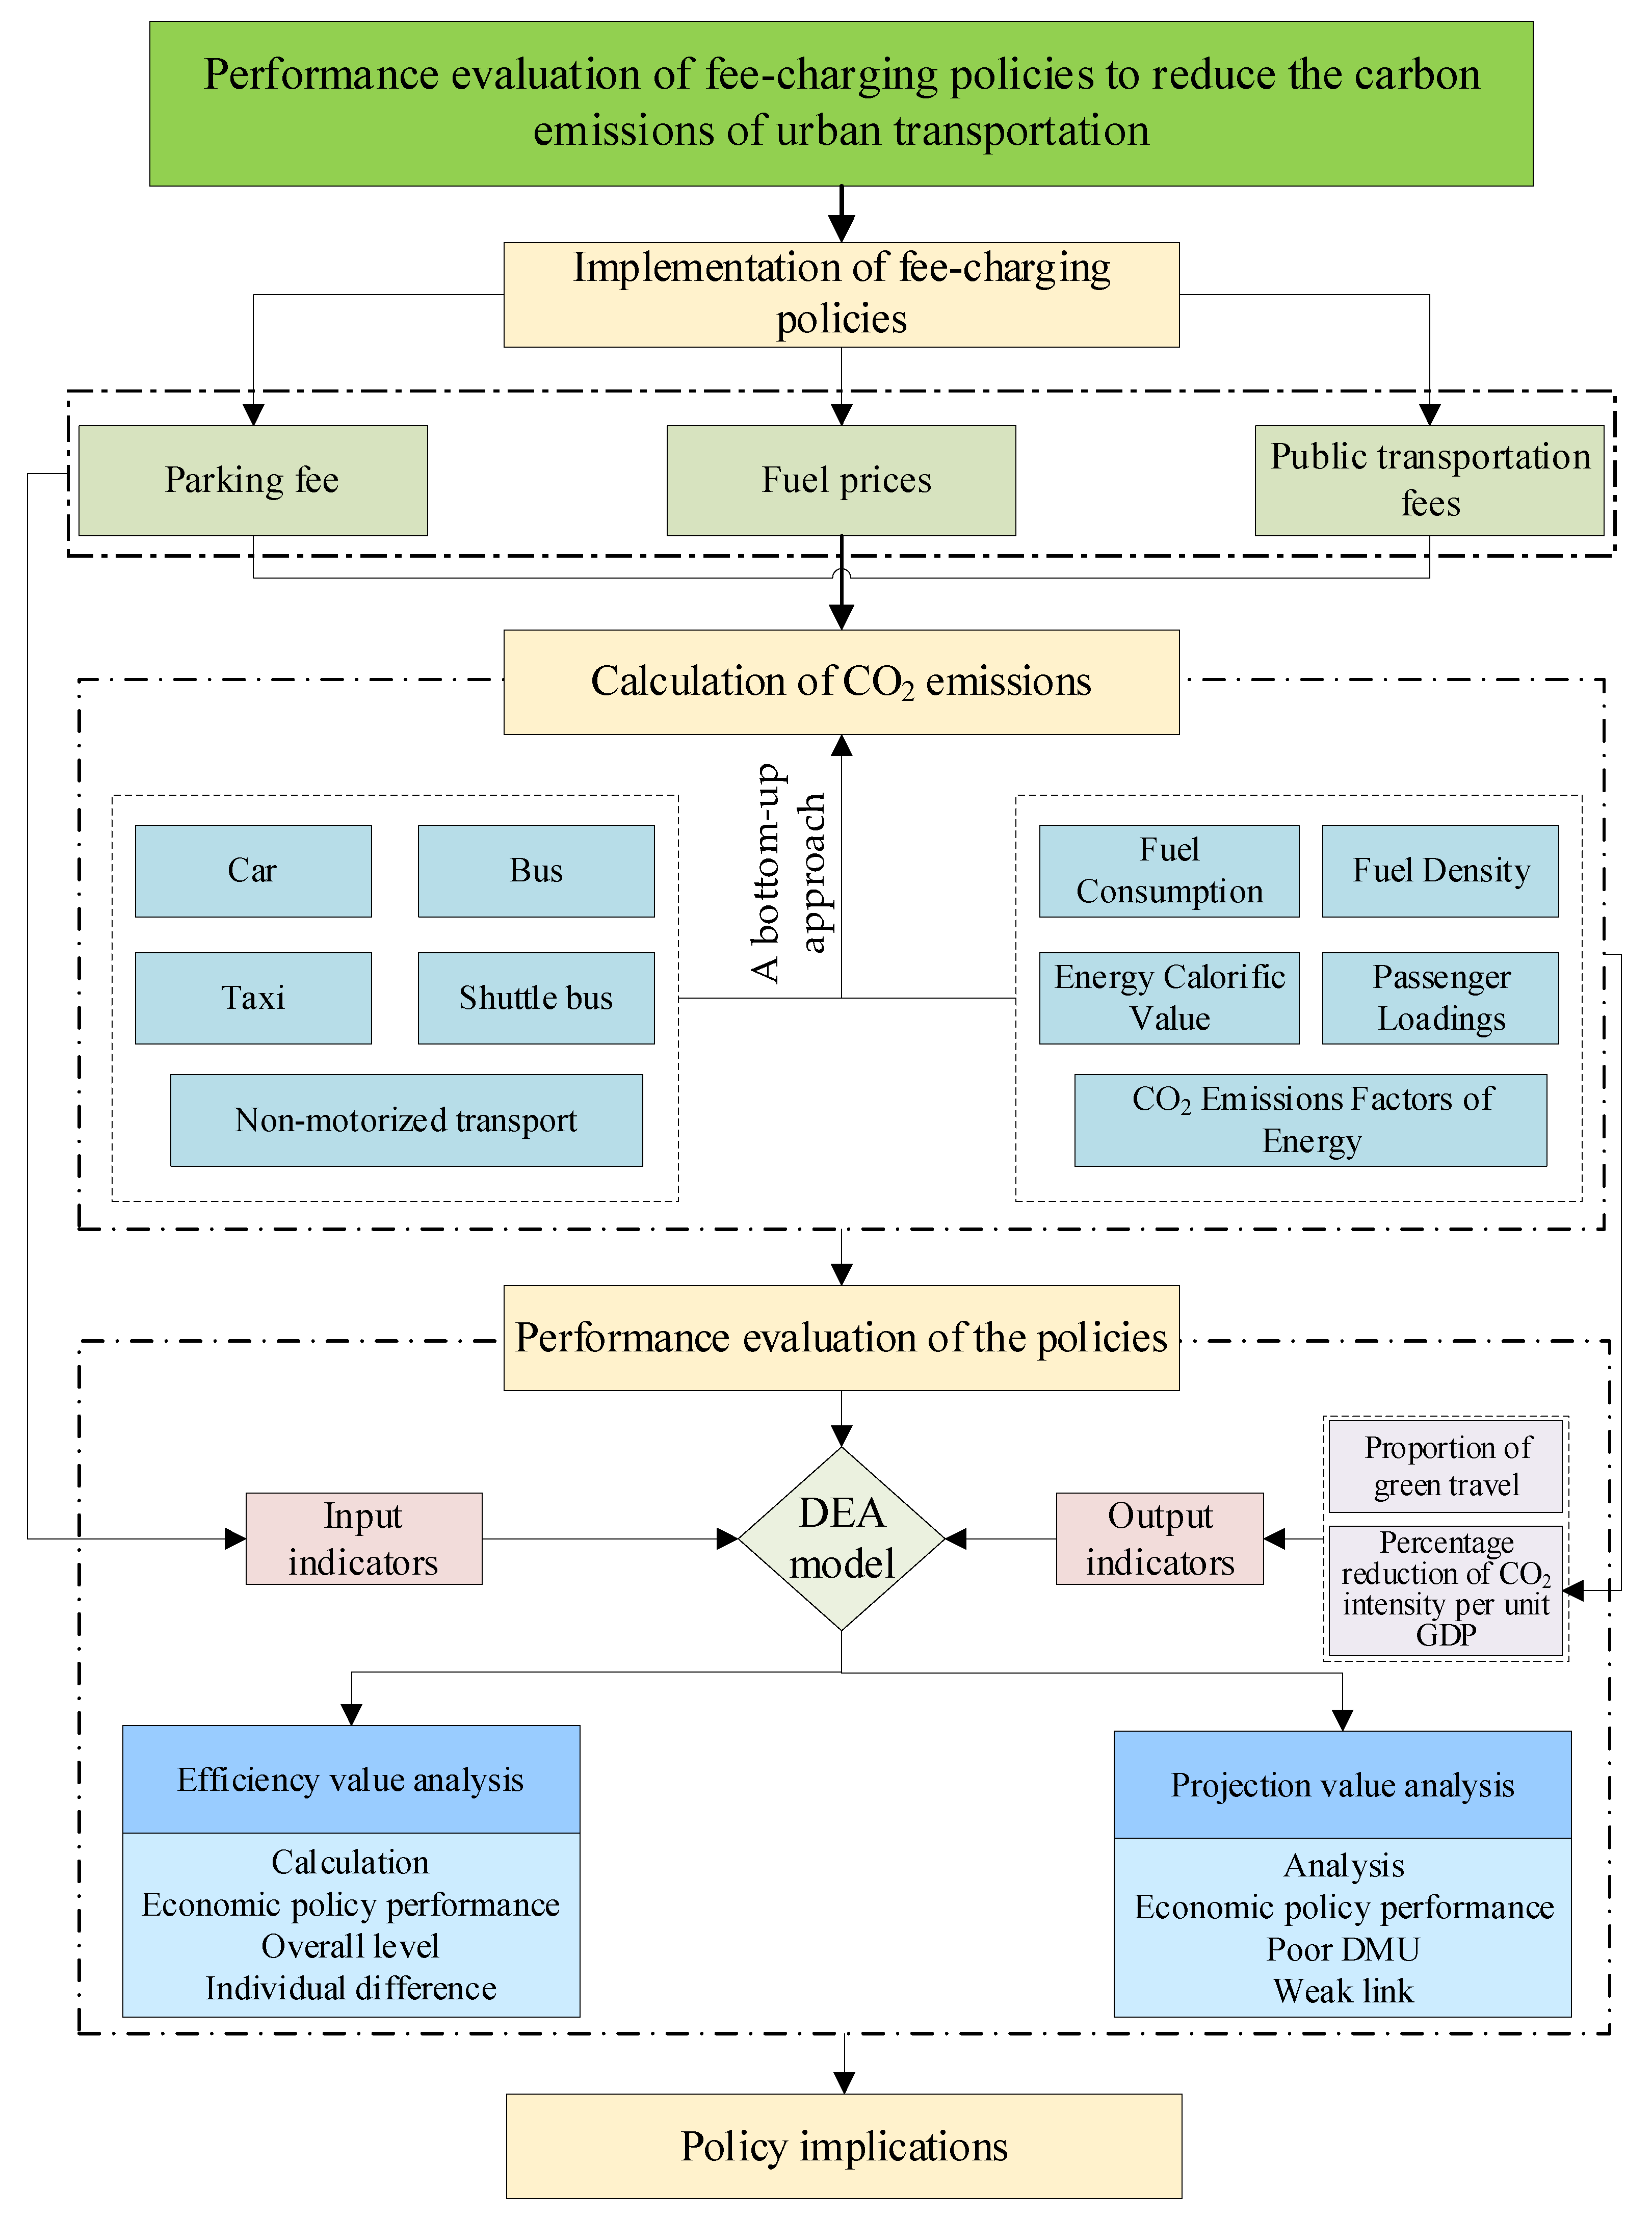
As a market-based instrument for transportation demand management, transport fees can not only effectively reduce traffic congestion, but also improve air quality. The evaluation and improvement of policy performance efficiency are crucial to striking the balance between economic development and environmental protection. The paper focuses on the role of the performance of fee-charging policies in reducing the carbon emissions of urban transport. The results provide a very interesting perspective on how an effective environmental and economic policy, and fee-charging policies can improve the implementation efficiency of various policies by properly adjusting fee structures, and how they can play a positive role in reducing the emissions of motor vehicle pollutants and in improving the efficiency of regional emission reduction.
To study the impact of urban traffic charging policies on CO2 emissions, this paper proposes a methodological framework for the performance evaluation of urban traffic carbon emission fee-charging policies (Figure 2). First, we analyze the current situation of the implementation of fee-charging policies (e.g., parking fees, fuel prices, public transportation fees) and their relationship with urban traffic congestion. Subsequently, we use a bottom-up approach to analyze changing trends of carbon emissions associated with transportation travel in Beijing in recent years, to identify the main sources of carbon emissions from transport. Finally, we used the annual public transportation fee, parking fee, and fuel fee as the input indicators for each policy, and based on the DEA method, we evaluate the performance of the fee policies for urban transport, which are meant to reduce carbon emissions, analyze its implementation efficiency, and then discuss the main factors affecting its efficiency and propose suggestions to improve the performance of this policy in the future.

2.2.2. Calculation Model for Urban Transport Carbon Emissions

Calculation of CO2 Emissions

In this study, the urban transport modes were divided into public buses, subways, taxis, cars, bicycles, and others (shuttle buses). CO2 emissions were calculated as the emission factor of the travel mode multiplied by trip distance using the following equations [4,47]:
Q i = L i × E F i
Q = i Q i
where Qi is the CO2 emission for travel mode (104 tons/year), Q is the total of the CO2 emission (104 tons/year), EFi is the CO2 emission factor for travel mode i, and Li is the trip distance (km).

Calculation of CO2 Emissions Factors

The CO2 emission factors of the terminal vehicle are the key to measuring the carbon emissions of different transport modes. The detailed calculation process was
E F i = C L i × ρ i × q i × e i / P i
where E F i is the CO2 emission factor for travel mode i (kg/(people· km)), C L i is fuel consumption per km (L/km) for travel mode i, ρ i is the fuel density (kg/L), q i is the energy calorific value (TJ/kg (terajoules per kilogram)), e i is the CO2 emissions factor of the energy consumed by travel mode i (kg/TJ), and P i is the passenger loading of travel mode i.
The calculated CO2 emissions factors for Beijing are displayed in Table 1. The energy consumption of various fuels and their CO2 emission factors were derived from Wang et al. [4,48].

2.2.3. DEA Model

Data envelopment analysis (DEA), proposed by Charnes et al. [36], is a non-parametric method for the statistical analysis of systems developed on the basis of “relative efficiency evaluation”. This method evaluates the relative effectiveness of DMUs based on multi-input and multi-output data. The model maximizes the ratio of virtual output and virtual input by determining a set of (yet unknown) weights in a system with multiple inputs and multiple outputs. It can use linear programming models to obtain effective and practical management information, and at the same time, it has the advantage of reducing errors. Therefore, it is widely used. This method is also a relatively complete method for dealing with multi-objective planning decision problems.
The DEA method can be applied to DMUs of the same type, which have the same goals, tasks, external environment, input–output indicators, etc. As a method for evaluating the relative effectiveness of the DMUs, the basic principle of this method is to keep the input and output of the DMU unchanged, use planning and statistical methods to determine a relatively effective production frontier, project it onto the DEA production frontier, and determine the effective production frontier using the weight of each indicator [49]. Next, the degree of deviation between the two frontiers is compared to obtain the relative effectiveness of each decision-making unit and to give the reasons behind the non-effectiveness. Furthermore, the projection analysis method improves the non-effective unit to make it effective. Due to different evaluation purposes and evaluation environments, DEA methods have developed various forms, such as C2R-DEA, BC2-DEA, network DEA, and hierarchical DEA. We used the MaxDEA Ultra platform to research the performance of the Beijing fee-charging policy in reducing traffic carbon emissions.
Suppose there are n decision-making units, DMUj0 (j = 1, 2, 3, …, n). In this study, data on Beijing from 2006 to 2018, for a total of 13 years, are used as the decision-making unit to be evaluated; that is, there are 13 DMUs. Each DMUj0 has m types of input Xj = (x1j, x2j, …, xmj) and s types of output Yj = (y1j, y2j, …, ysj), where (x0, y0) are the input and output of DMUj0. λ j in the model connects effective units in the form of production points to form an effective envelope surface. If DMUj0 is on the frontier, it is considered to be effective, and the DEA model is
Min [ θ j 0 ε ( e ^ T S + e T S + ) ] S . T . { j = 1 n X j λ j + S = θ j 0 X j 0 j = 1 n Y j λ j S + = Y j 0 δ j = 1 n λ j = δ λ j 0 0 , j = 1 , , n S 0 ,   S + 0 e ^ = ( 1 , 1 , , 1 ) T E m ,   e = ( 1 , 1 , , 1 ) T E s
where θ j 0 is the efficiency value of decision-making unit DMUj0 (0 ≤ θ ≤ 1); S+ and S are the relaxation variables, and λj is the coefficient on the input-output index of the DMUs. When δ = 0, it is the C2R model, and when δ = 1, it is the BC2 model.
Assuming that the optimal solution to the DEA model is λ * , S + * , S * , θ j 0 * , then DEA-effectiveness in the C2R model is defined as follows.
When θ j 0 * = 1, e ^ T S * + e T S + * = 0 , the decision unit DMUj0 is DEA effective, reaching Pareto optimality;
When θ j 0 * = 1, e ^ T S * + e T S + * > 0 , the decision unit DMUj0 is weakly DEA effective;
When θ j 0 * < 1, the decision unit DMUj0 is DEA ineffective;
DEA effectiveness in the BC2 model is defined as follows:
If θ j 0 * = 1, DMUj0 is weakly DEA effective;
If θ j 0 * = 1, S+* = 0, S−* = 0, DMUj0 is DEA effective.
In the C2R model, the returns to scale of DMUj0 can be judged based on the optimal value λ*j (j = 1, 2, …, n):
If ∑λ*j = 1, then there are constant returns to scale, DMU0 reaches its maximum output scale point, and the policy implementation effect is optimal;
If ∑λ*j < 1, then there are increasing returns to scale, indicating that by appropriately increasing the number of inputs above the baseline for input x0, the output will increase by a larger proportion. This means that we can continue to increase policy inputs to improve the implementation performance of various policies.
If ∑λ*j > 1, then there are decreasing returns to scale, indicating that for input x0, DMU0 cannot increase its output even if inputs are increased. Therefore, there is no need to increase inputs. In this case, it is necessary for the government to improve the implementation performance of various policies by improving policy management and implementation supervision.
Optimizing the target value θ can reveal the minimum output value from the same proportion of input elements. When θ = 1, at least one of the input elements reaches its lowest value and can no longer be reduced; when θ < 1, the input elements are outside the effective frontier, and the input elements have room for reduction; the smaller the value of θ is, the greater the space for reduction.
The θ j 0 * solved by the C2R model is the comprehensive efficiency value (TE), and the θ j 0 * solved by the BC2 model is the pure technical efficiency value (PTE). By using the formula comprehensive efficiency = pure technical efficiency*scale efficiency, the scale efficiency (SE) can be obtained [49,50,51]. The comprehensive efficiency value reflects the overall performance level of the policy implementation for fiscal transportation investments. When the comprehensive efficiency value = 1, it indicates that the policy implementation is DEA effective, being both technically effective and scale effective; when the comprehensive efficiency value < 1, it indicates that the policy implementation is DEA ineffective, that the main factors that are ineffective need to be determined based on input and output slack variables, and that the implementation performance of the policy needs to be improved. Pure technical efficiency (PTE) reflects the performance of the management systems and technical factors in the implementation of environmental and economic policies for transportation carbon emission reduction without accounting for the various scale changes. As the transportation carbon emission reduction charging policy is an environmental economic means, it mainly collects certain fees from polluters and users by formulating certain collection standards. The collection of fees is only a means. The ultimate goal of the government is to achieve the purpose of environmental protection by collecting the least fees.

2.3. Data Source and Descriptive Statistics

The input and output data needed by the DEA framework for Beijing from 2006 to 2018 were collected for analysis. The data required for the model were obtained from the Beijing Statistical Yearbook, Beijing Traffic Development Annual Report, Beijing Traffic Operation Report, Beijing Fourth and Fifth Comprehensive Traffic Survey Report, Beijing Resident Commuting Travel Questionnaire, Beijing Traffic Development and Construction Plan, and Beijing Traffic Development Research Center [45,46]. Given the accuracy and validity of the data, this paper evaluates the performance of the environmental and economic policies in Beijing from 2006 to 2018 meant to reduce transportation carbon emissions. The fee-charging policy, which levies public transportation fees and parking fees and collects fuel fees, mainly levies these fees on transportation users and land resource and natural resource users by formulating certain fee-charging standards. Since the 1990s, the relevant departments in Beijing have collected their own parking fees. At that time, the parking fee was approximately CNY 1 every 4 h. In 2002, for the first time in Beijing, a clear, unified parking fee structure within the city limits was introduced. The parking fee on the Fourth Ring Road is CNY 1 per half hour. The parking fee standard was implemented through 2009. The number of motor vehicles in Beijing has been increasing rapidly, but the growth rate of parking facilities is far lower than that of motor vehicles. Facing increasingly severe parking chaos and difficult parking situations, Beijing adjusted the parking fee structure that it had used for 7 years in 2009 and raised parking fees for 8 roads, such as in Dongdan. The goal has been to use managed parking fees as an economic lever to address the current parking chaos and parking difficulties. Beijing began to implement differentiated parking fees in 2011. Table 2 shows the specific parking fee structure in Beijing. From Table 2, the parking fee for the type-2 area is 62.5% of the fee for type-1 areas in the open-air parking lots off the road, and the fee for the type-3 area is 40% of that for the type-2 area. For on-street parking, the type-2 area fee is 60% of the type-1 area fee, and the type-3 area fee is 20% of the type-1 area fee.
The construction of Beijing’s public transport system began in the early 20th century, and the first bus line in Beijing was officially opened in August 1935. With the continuous development of the social economy in the past few decades, Beijing’s ground bus system has also developed rapidly. To enhance the attractiveness of public transportation, Beijing formulated the “Opinions on the Priority of Public Transportation for Development” in 2006, and the bus fare policy was reformed in 2007. However, with the increasingly rigid costs of enterprises and changes in the market, various operating costs for enterprises are still rising, and financial pressure on the government will continue to increase. At the same time, with the changes in the scale of the public transportation road network, total passenger flow and travel structure, Beijing’s public transportation is in a new stage of development. The fare policy in place since 2007 is incompatible with the overall development requirements of public transportation, and the development of public transportation needs to be adjusted and improved. Beijing implemented a new public transportation fare plan on 28 December 2014, from which Beijing Rail Transit (except airport lines) adopted a time-limited, ticket-based fare; in kilometers, the mileage increase follows a diminishing fare. As of the end of 2018, the total mileage of Beijing’s rail transit operations reached 637 km, with 5628 vehicles operating, and the annual mileage traveled was 59.825 million kilometers. The passenger load was 3.85 billion passengers, an increase of 1.9% year-over-year. The average daily passenger traffic was 10.5436 million passengers, and peak passenger traffic reached 13.4925 million passengers. Fuel price policy is an important market regulation tool. The adjustment of fuel prices can affect the travel cost of urban residents. To some extent, high fuel prices can change the travel mode of residents and reduce motor vehicle travel, so as to reduce traffic carbon emissions.
Therefore, this paper mainly uses the annual public transportation fee, parking fee, and fuel fee as the input indicators for each policy (Table 3). This study further considers the role of the above three policies on the reduction in transport carbon emissions, and uses the proportion of green travel from 2006 to 2018 and the ratio of the transport carbon emissions reduction per unit of GDP in the current year to that in 2005 as the output index (Table 3). The selection of the above indicators meets the DEA model’s requirements for smaller input indicators and high-quality output indicators. This study evaluates the performance of Beijing’s environmental and economic policies for the reduction in transportation carbon emissions from 2006 to 2018. There are a total of 13 DMUs and a total of 5 input and output indicators, which meets the DEA model’s rule-of-thumb and calculation requirements. The descriptive statistics for each indicator are shown in Table 3.

3. Results

3.1. Relationship between Fee-Charging Policies and Traffic Congestion

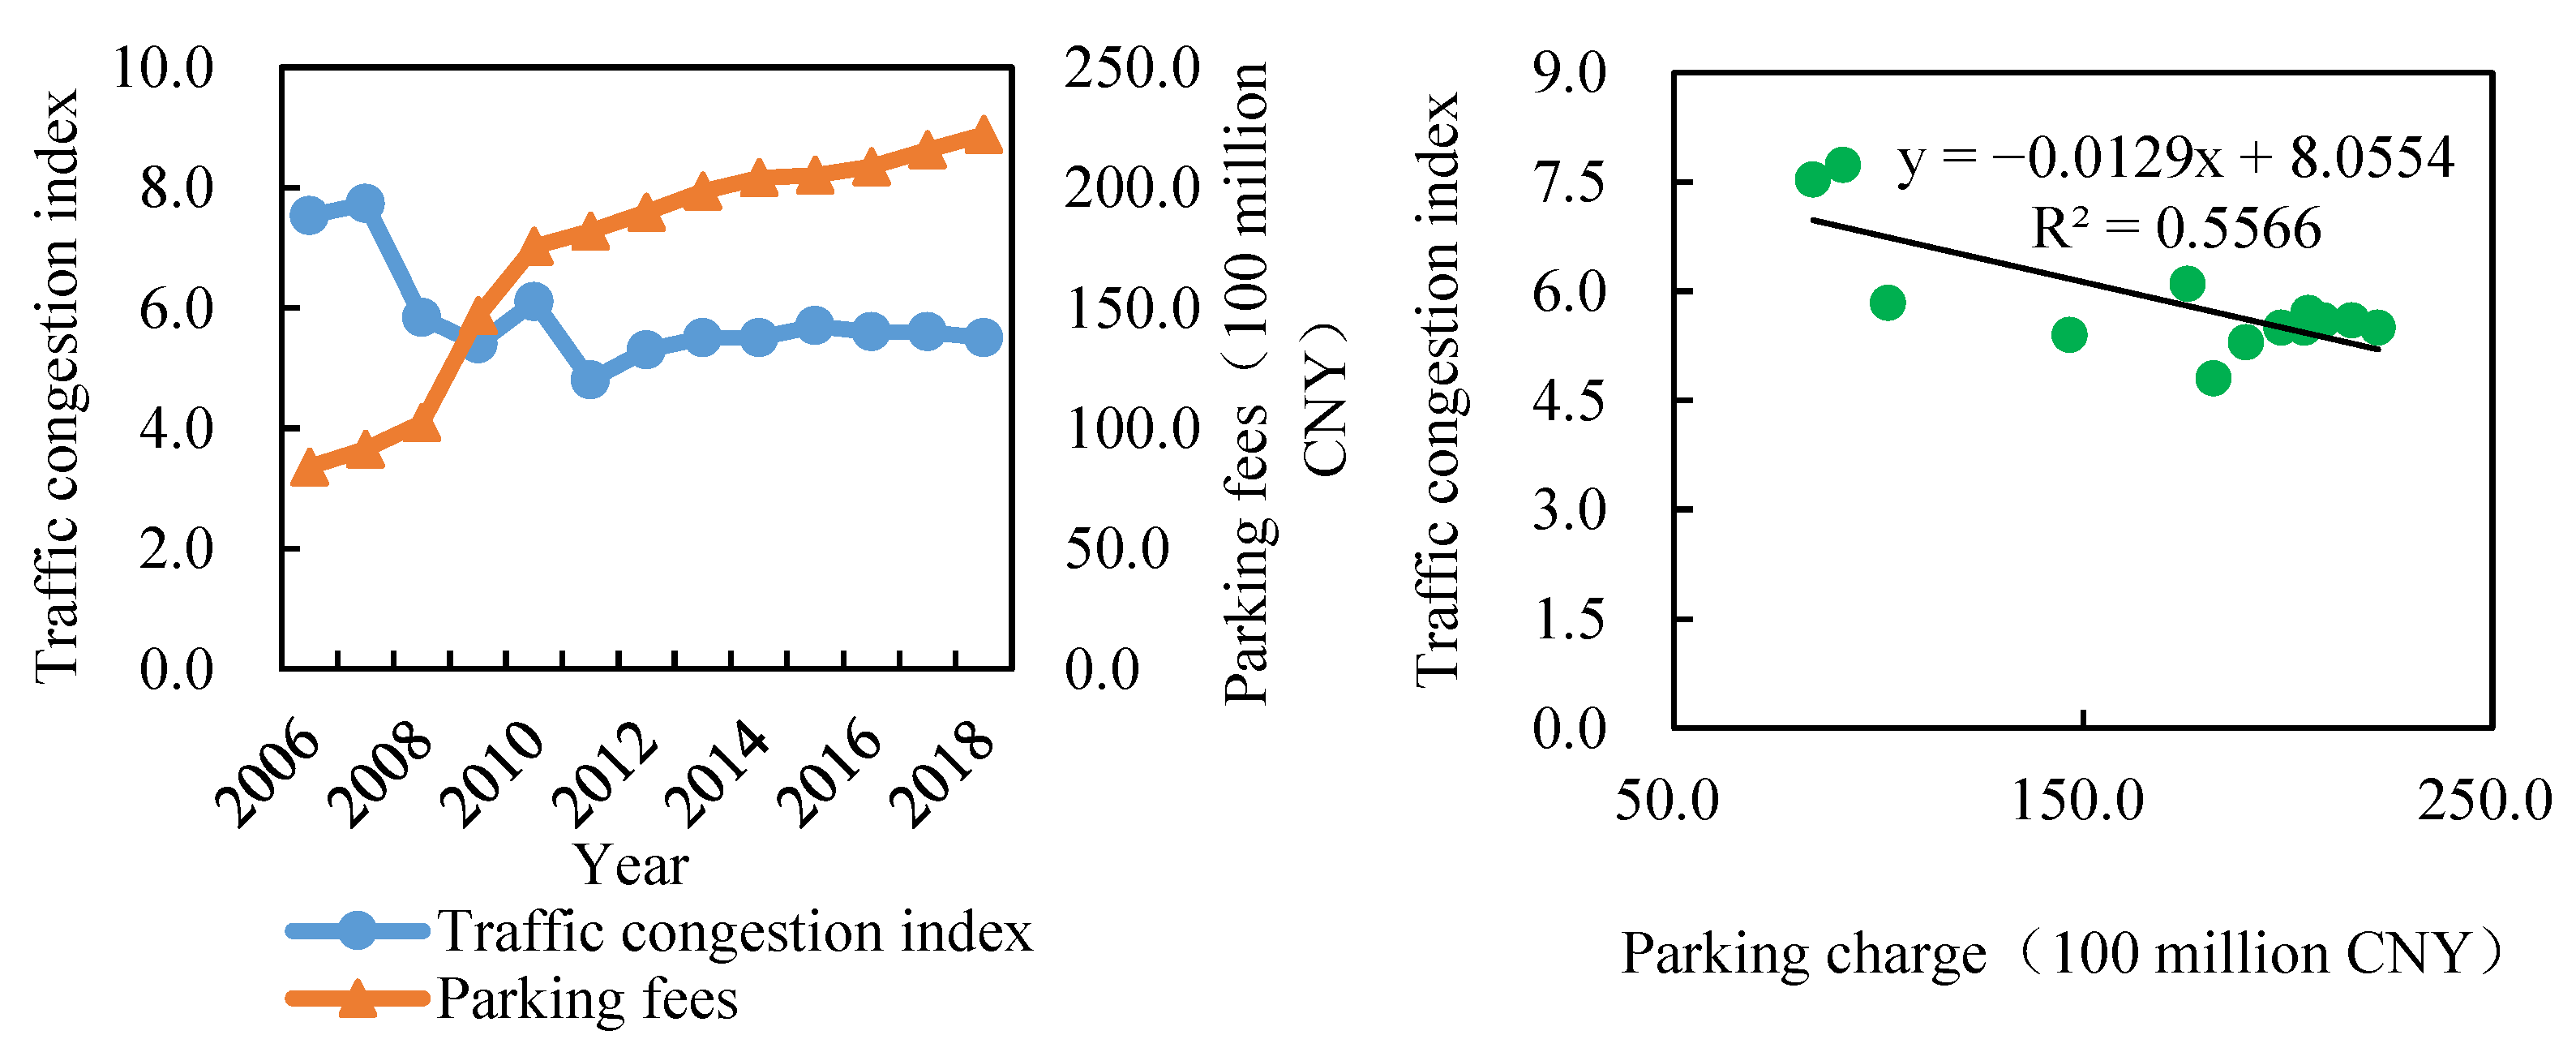
Considering the current status of Beijing’s parking industry, the Beijing Motor Vehicle Parking Management Measures were implemented in 2014. According to data from the Beijing Institute of Transportation Development, since the implementation of differentiated parking fee adjustments in Beijing in 2011, there have been significant changes. The motor vehicle traffic in the parking lots in type-1 areas (regions within the Third Ring Road (inclusive) and the Central Business District (CBD), Yan (Shasha District, Zhongguancun West District, Cuiwei Commercial District, etc.) decreased significantly, with an average decrease of approximately 12%; after the increase in parking fees, the parking volume in some areas decreased significantly, with an average drop of approximately 16%. Since 2016, Beijing has run pilots for electronic toll parking on some roads in the six districts of the city and Tongzhou. As of the end of 2016, a total of 4086 parking spaces were eligible for electronic toll collection. Streets that use electronic toll collection for roadside parking include sections with greater parking demand in various urban areas, such as Stadium Road, Tiantan East Road, Changchun Street Road, Xishiku Street, Wangjing Street, Dongdaqiao Road, Zhongguancun East Road, Wanshousi Road, Yangfangdian Road, Shangdi District, Lugu Road, Lugu West Street, Yuqiao Xili Middle Street, Xinjie Downhill, and Furong East Road. In 2018, Beijing continued to strengthen its management of static traffic facilities, implemented roadside parking management reforms, and prepared ground parking plans; it also planned 13,644 electronic toll parking spaces on 165 roads in Dongcheng, Xicheng, and Tongzhou. By the end of 2018, there were 6324 parking lots and 1,890,573 parking spaces in Beijing. Based on the relation between the annual amount of parking fees and urban traffic congestion in Beijing (Figure 3), we can see that the annual amount of parking fees and urban traffic congestion are positively correlated. Generally, the larger the urban traffic congestion index is, the more serious the urban congestion is. Conversely, urban traffic congestion has eased. It can be seen from Figure 3 that with the implementation of parking fee policies, urban traffic congestion has eased from 2006 to 2018.
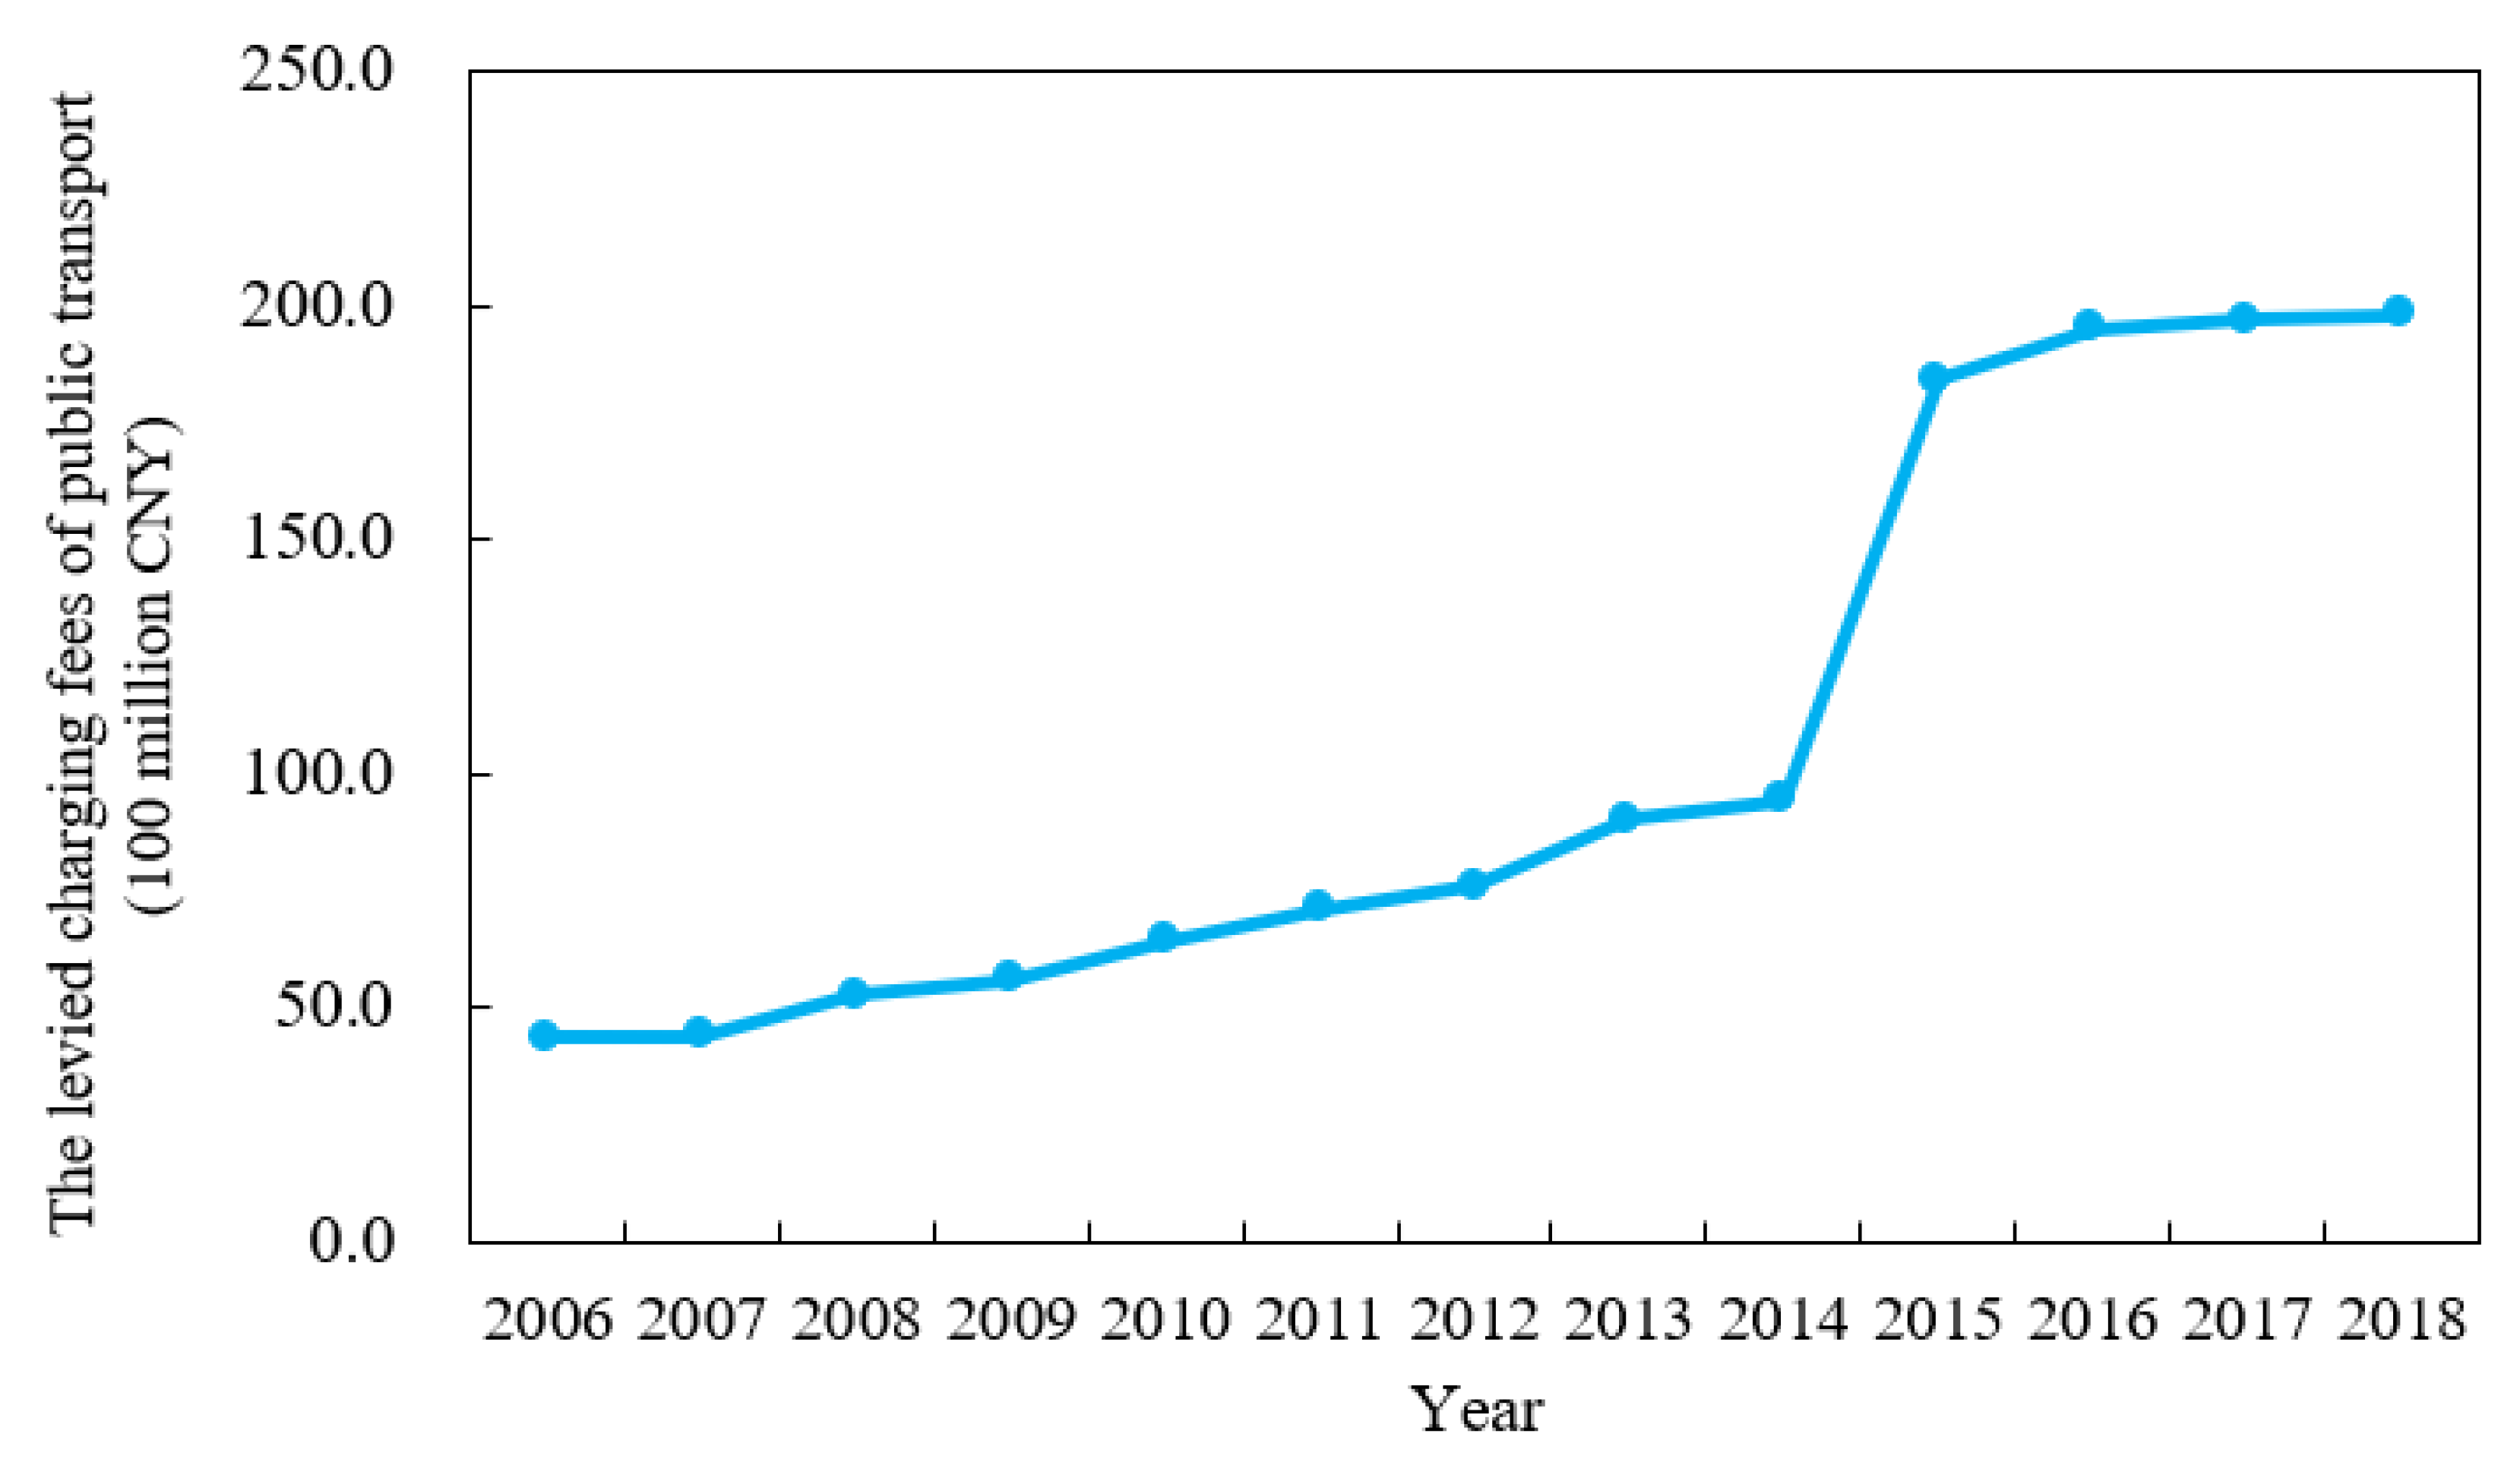
Beijing Rail Transit (except airport lines) has adopted a time-limited, ticket-based fare; in kilometers, the mileage increase follows a diminishing fare. Passengers who use a card or electronic payment to accumulate a certain amount of monthly rail transit spending are given a stepwise discount. Beijing implemented a new public transportation fare plan on 28 December 2014. The adjusted rail transit pricing structure starts at CNY 3/person for the first 6 kilometers, jumps to CNY 4/person for 6–12 kilometers, and is an additional CNY 1 for every 10 additional kilometers from 12 to 32 kilometers and for every 20 kilometers above 32. The fare is not capped. If a municipal transportation card is used to take rail transit and within 30 days the user of that card spends a total of CNY 100, he or she receives 20% off for each trip thereafter; for trips after spending a total of CNY 150, the price is 50% off; when the cumulative expenditure reaches CNY 400, additional trips are no longer discounted. From Figure 4, the annual revenue of public transportation increases year by year, especially in 2014–2015, which is closely related to the reform of the public transportation fares in Beijing in 2014. The low-fare policy has played a positive role in the implementation of the municipal government’s public transport benefits policy and has induced the general public to use public transportation. With the increasingly rigid costs of enterprises and changes in the market, various operating costs for enterprises are still rising, and financial pressure on the government will continue to increase. At the same time, with the changes in the scale of the public transportation road network, and total passenger flow and travel structure, Beijing’s public transportation is in a new stage of development.
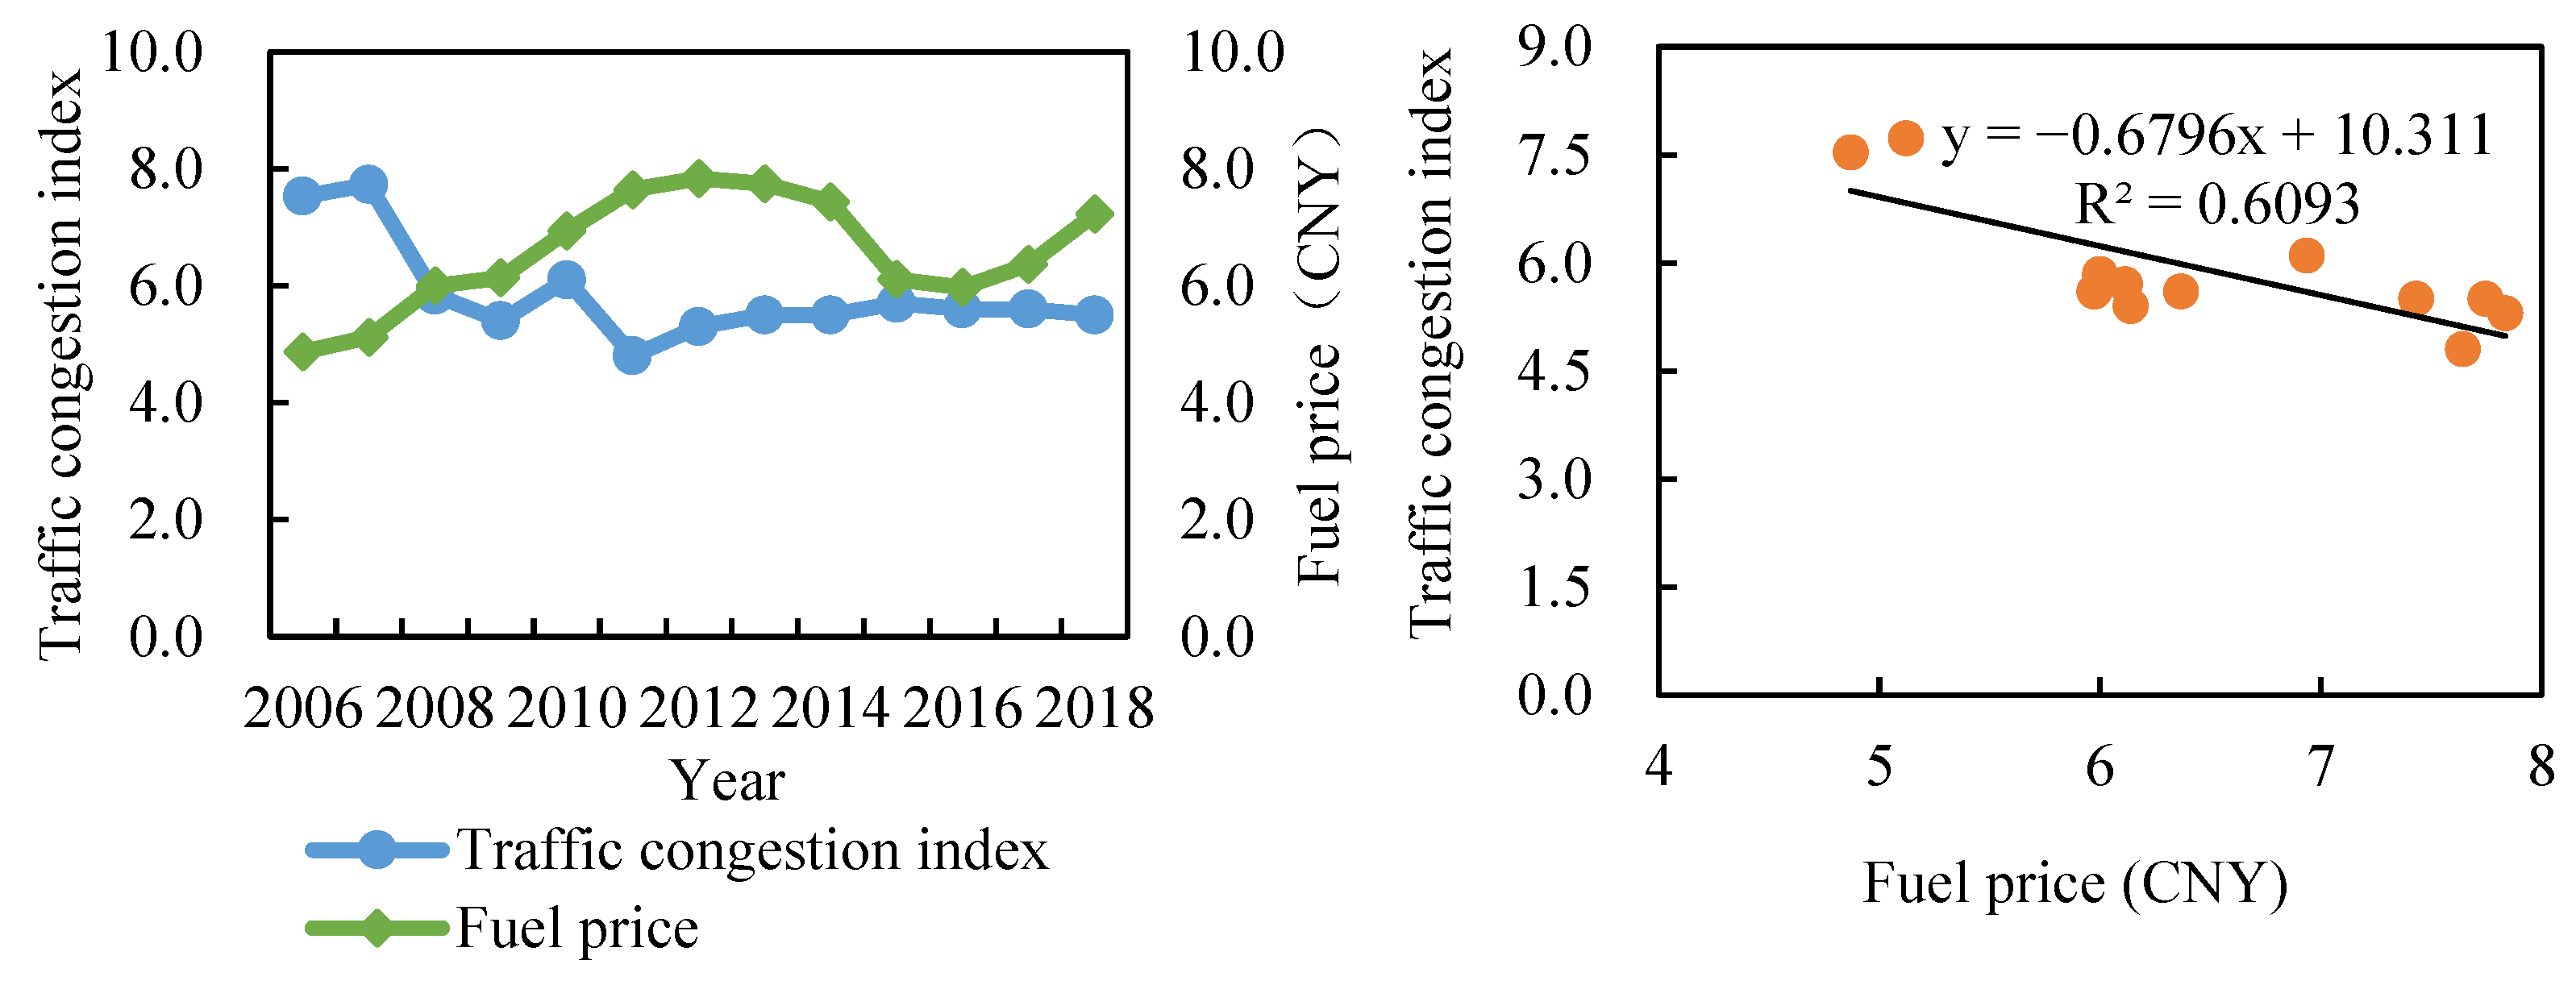
With the rapid development of the country’s urban population and regional economy, the number of motor vehicles has increased significantly. Motor vehicles have brought convenience to residents’ lives but have also caused typical urban problems such as air pollution, energy shortages, and traffic congestion. As a typical megacity in China, Beijing has a large base of motor vehicle ownership. As of 2018, motor vehicle ownership in Beijing reached 6.084 million vehicles. From 2005 to 2018, motor vehicle ownership increased by approximately 3.5 million vehicles, with an average annual growth rate of approximately 7.0%, which is mainly due to growth in private motor vehicles, which was greater than 80.0%. Beijing has been attempting to control motor vehicle pollution and traffic congestion for more than ten years, but the results have not been satisfactory. Therefore, the Beijing Municipal Government has implemented a series of economic policy measures based on foreign experiences and current domestic characteristics. Of these, the fuel price policy is one of the most important market regulation tools. Based on the relation between Beijing’s traffic congestion index and fuel prices, as shown in Figure 5, Beijing’s fuel prices (93 octane) have a positive correlation with Beijing’s traffic congestion index. With the increase in fuel prices, urban traffic congestion has eased from 2006 to 2018. Fuel prices have played a role in alleviating traffic congestion. The adjustment of fuel prices affects the cost of travel and, to a certain extent, changes the way residents travel and reduces motor vehicle travel, thereby alleviating the further deterioration of urban traffic congestion.

3.2. Annual Change in Transportation CO2 Emissions

Based on the survey data on Beijing’s transportation trips, the largest proportion of transport travel modes by residents in Beijing is by car (exceeding 28.0%), with bus use being the second largest (Figure 6). In recent years, the proportion of subway travel by residents in Beijing has increased rapidly, exceeding 30% in 2018. Due to the rapid development of the public transport system, the proportion of public transport has significantly improved. The proportion of people walking in the non-motorized mode has become less than those using bicycles.
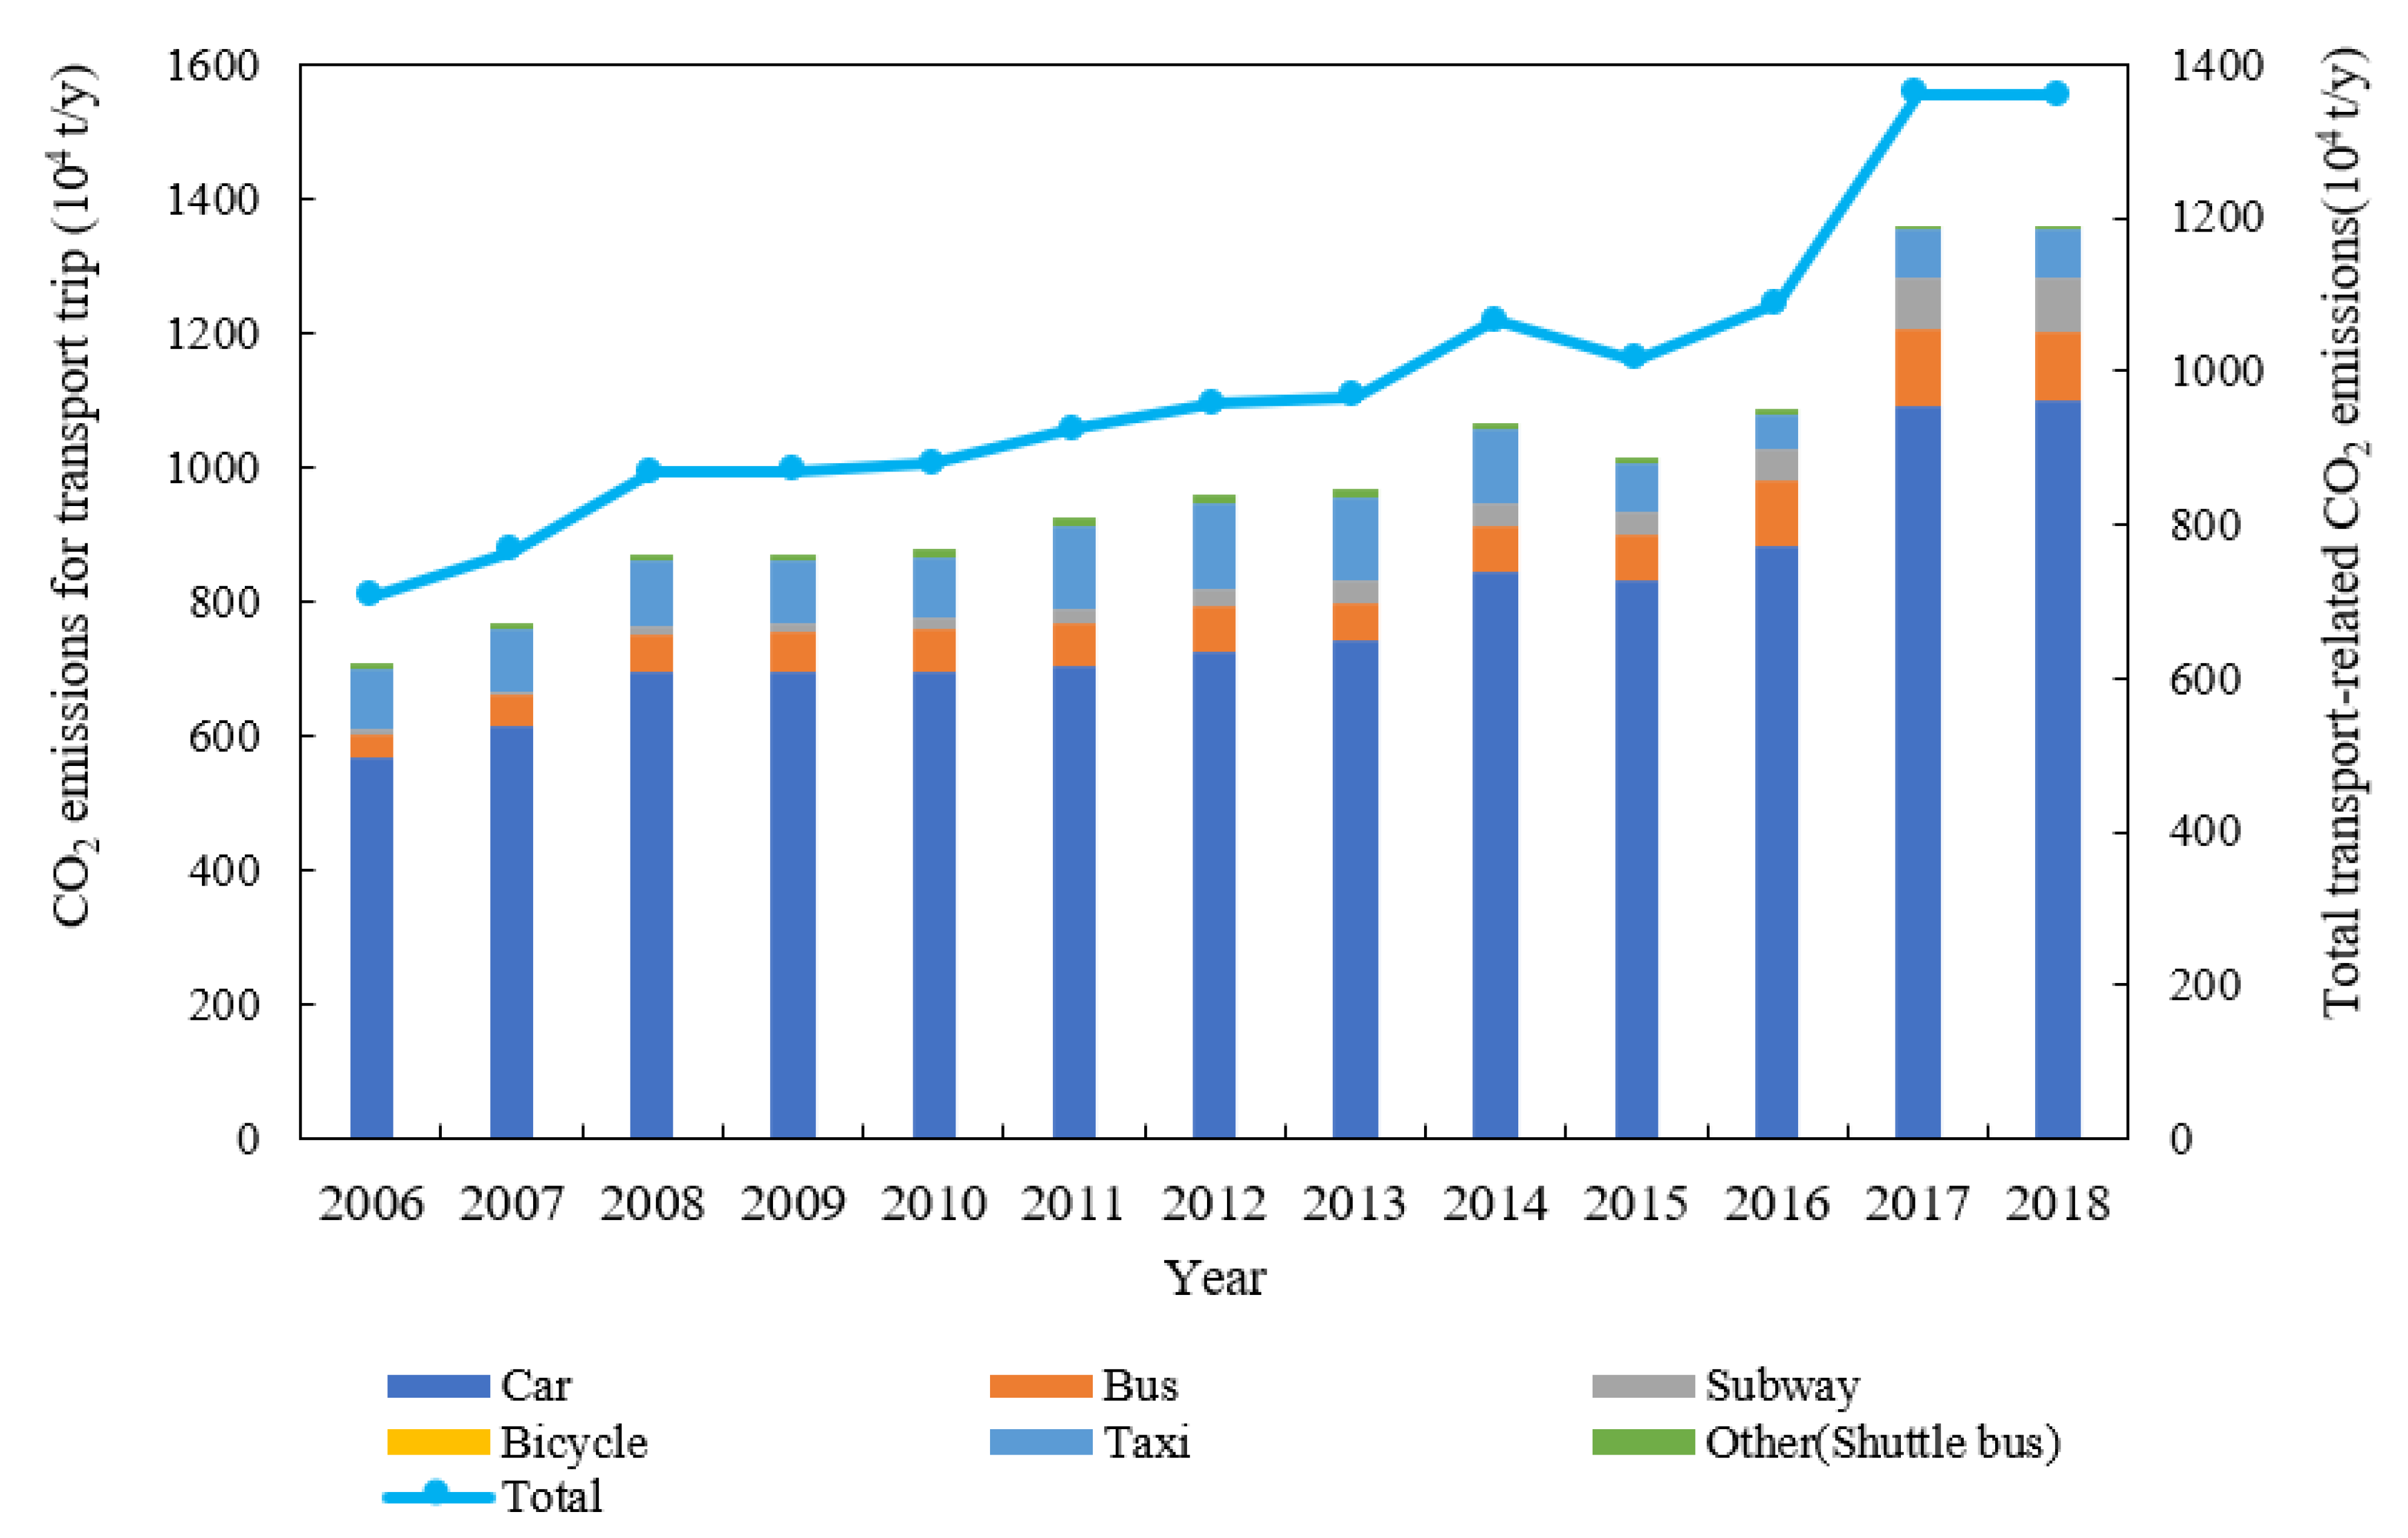
The transportation CO2 emissions in Beijing from 2006 to 2018 were calculated by using the transportation CO2 emission accounting method (Figure 7). It can be seen that from 2006 to 2018, the overall CO2 emissions from transportation in Beijing grew rapidly. CO2 emissions increased 1.925 times over, from 7.069 million tons in 2006 to 13.6059 million tons in 2018, with an average annual growth rate of 5.6%. Looking at smaller time spans, we see that from 2006 to 2008, Beijing’s transportation CO2 emissions grew rapidly; from 2008 to 2010, to ensure the success of the 2008 Beijing Olympic Games, Beijing introduced a number of transportation measures; as a result, there is no obvious growth trend in Beijing’s transportation CO2 emissions, and CO2 emissions remained stable during this period. From 2010 to 2014, Beijing’s transportation CO2 emissions clearly grew; from 2014 to 2015, affected by the new public transportation fare policy, Beijing’s transportation CO2 emissions exhibited a downward trend; from 2015 to 2018, Beijing’s traffic CO2 emissions clearly grew rapidly.
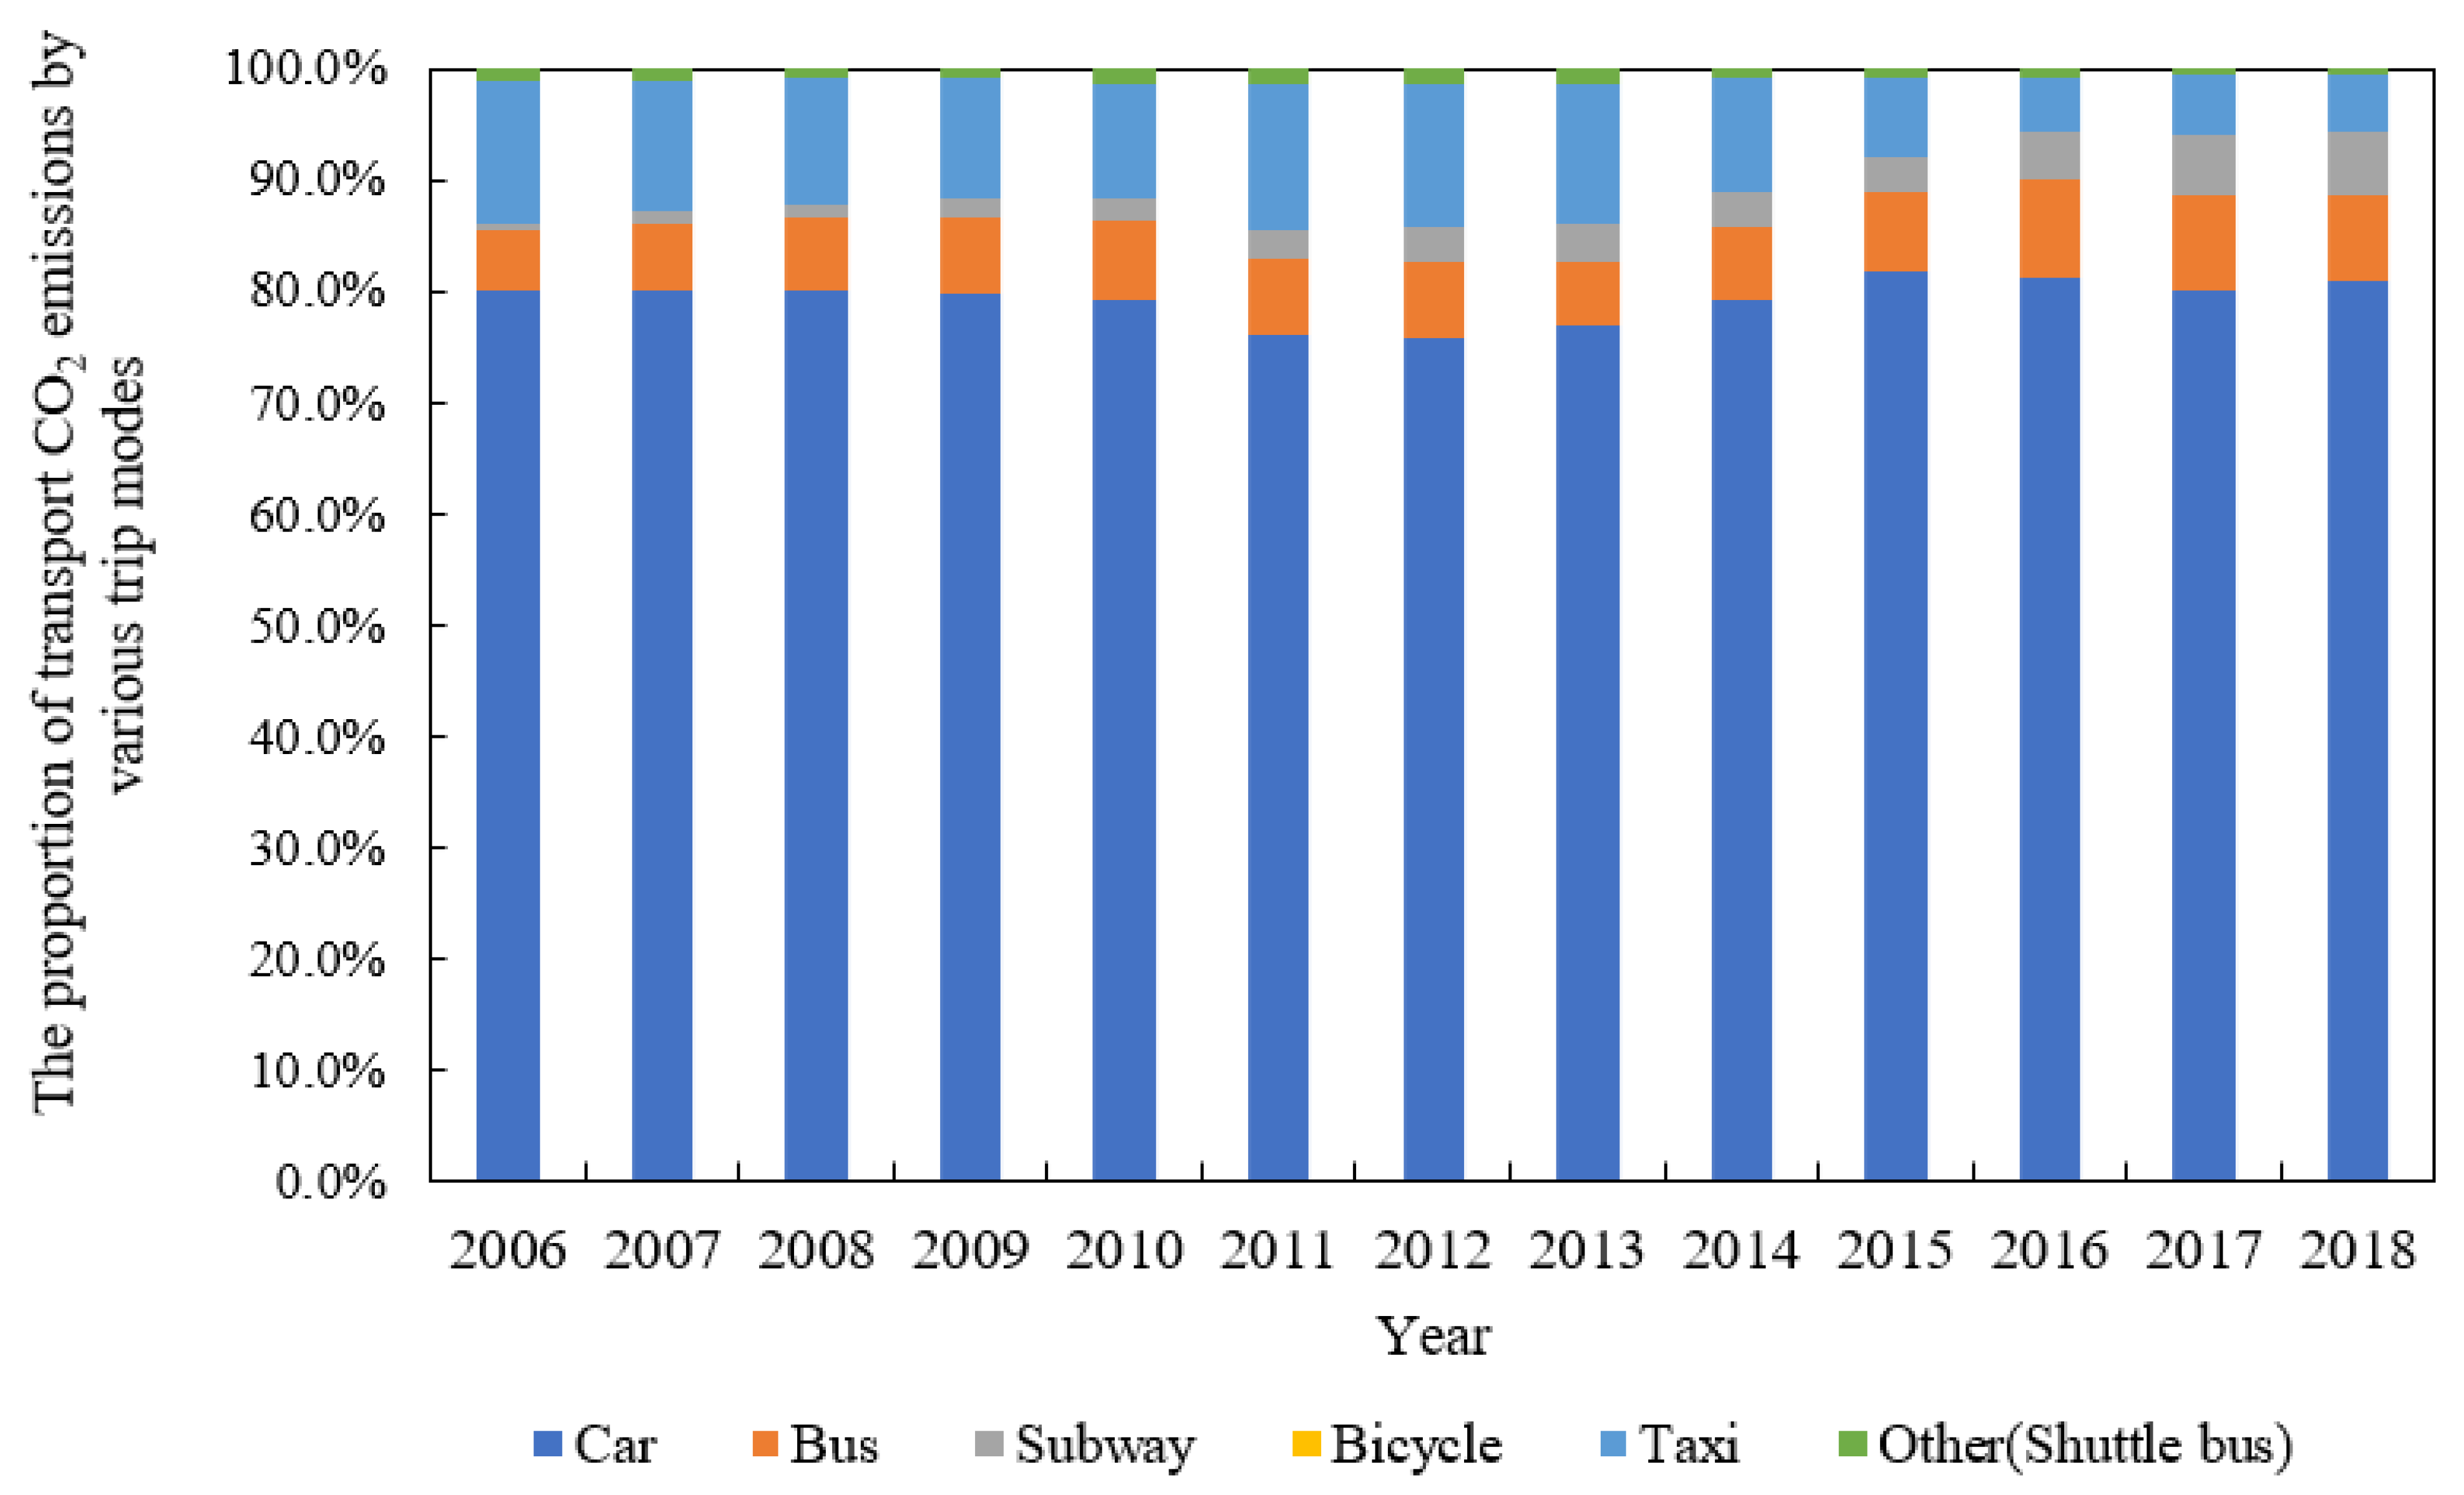
Considering different transportation modes, the CO2 emissions of various forms of transportation in Beijing exhibited different characteristics from 2006 to 2018 (Figure 8). The CO2 emissions of cars, buses, and subways all grew, increasing 1.95 times over, 2.74 times over, and 13.60 times over, respectively, with an average annual growth rate of 5.71%, 8.75%, and 24.3%, respectively; CO2 emissions from taxis were on a downward trend. In terms of total emissions, the CO2 emissions generated by car travel were the highest, followed by taxis, buses, subways, and others (shuttle buses). In terms of proportions, the CO2 emissions generated by car travel were the highest and remained relatively stable, with an average value of 79.3%, and the average ratio of CO2 emissions caused by taxis was 9.9% with a gradual downward trend. The average CO2 emissions ratio for buses was 6.9% with a gradual growth trend. The average CO2 emissions ratio for subways was 2.8%, which also exhibited a gradual, increasing trend. The average CO2 emissions ratio for other buses was 1.0%. The above analysis shows that total carbon emissions from transportation in Beijing are very large, and the growth rate is relatively fast. At the same time, CO2 emissions generated by car travel are the main source of carbon emissions from transportation in Beijing. The proportion of CO2 emissions generated by subways is low but is also increasing year over year.

3.3. Performance Evaluation of the Implementation

This study uses the C2R and BC2 models, which are output-oriented, to evaluate the TE, PTE, SE, and slack variables (S+* and S−*) of the DMUs, as shown in Table 4. In Table 4, S1+* and S2+* are the slack variables for the output indicators “ratio of green travel” and “intensity ratio of the reduction in transportation carbon emissions per unit of GDP”; S1−*, S2−* and S3−* are the slack variables for the input indicators “public transportation fees”, “annual parking fees”, and “fuel fees”, respectively.
As shown in Table 4, the average value from 2006 to 2018 of the comprehensive efficiency (TE) of Beijing’s economic policies to reduce transportation carbon emissions is 0.962, indicating that the overall implementation of Beijing’s environmental and economic policies to reduce transportation carbon emissions has achieved good results. The years in which the policies were technically efficient are 2006–2007, 2011–2013, and 2015; the remaining years were technically inefficient. The year with the minimum efficiency value was 2017, with a value of 0.871. After the implementation of the differentiated parking fee adjustment in Beijing in 2011, parking fees were raised. In 2014, public transportation fares were raised. By analyzing the years when the policies were technically efficient, it can be seen that these are exactly the years when the pricing structure for Beijing parking fees and public transport fares were adjusted (2011 and 2014), and the first years after the fee adjustment were 2012 and 2015, indicating that the adjustment of the fee structure increased the proportion of green travel and reduced the intensity of transportation carbon emissions.
Table 4 further shows that the average pure technical efficiency (PTE) of Beijing’s economic policies to reduce transportation carbon emissions is 0.999, showing that Beijing’s economic policy management technology is at a high level. The average value of the scale efficiency (SE) of Beijing’s economic policies is 0.894. Therefore, in general, the technical inefficiency of Beijing’s economic policies to reduce transportation carbon emissions is mainly due to inefficiencies of scale, followed by pure technical inefficiency.
This study further analyzes the DEA scale returns of Beijing’s economic policies to reduce transportation carbon emissions. As seen in Table 4, there are 6 years between 2006 and 2018 when Beijing’s economic policy DEA scale returns were efficient, which are 2006–2007, 2011–2013, and 2015; in the years when scale returns were inefficient, 2010 exhibited increasing returns to scale, and the remaining five years (2008–2009, 2014, and 2016–2018) exhibited decreasing returns to scale.
Further analysis of the slack variables for the input and output indicators, from an input perspective, shows that in the years with decreasing returns to scale, the main factors influencing this result are the annual collection of public transportation fees and the annual collection of fuel charges (Table 4), namely, conditional on holding the output constant, the annual collection of public transportation fees and fuel charges can be appropriately reduced; in the years with increasing returns to scale, the main factor influencing this result is the annual collection of parking fees (Table 4). The analysis results show that the years with increasing returns to scale are those after the main policy adjustments; this may be because Beijing raised fees in 2014, which played a role in the mode and structure of Beijing residents’ travel and, thus, played a role in improving the implementation of Beijing’s economic policies to reduce transportation carbon emissions. At the same time, Table 4 also shows that most of the years when the policies are DEA ineffective have decreasing returns to scale. Therefore, the relevant departments in Beijing should also improve the technical management and enforcement of various policies. From the perspective of output, the main factor behind the decreasing returns to scale is the proportion of green travel, so Beijing should appropriately raise fees to encourage Beijing residents to adjust their travel methods in order to reduce motor vehicle travel and should implement other measures to more effectively reduce transportation carbon emissions.
Assume that the projection point of a DEA-ineffective DMU0(x0, y0) on the effective frontier of C2R is (x0*, y0*). From DEA projection theory, x 0 = θ x 0 - S * , y 0 = y 0 + S + * , the input adjustment value Δ x 0 = x 0 - x 0 = ( 1 θ ) x 0 + S * and output adjustment value Δ y 0 = y 0 y 0 = S + * , can be calculated as the adjusted values of the input and output of DEA-ineffective DMUs. This paper calculates the adjusted values of the input and output of DEA-ineffective DMUs, which are decision units in the environmental and economic policies to reduce transportation carbon emissions, as shown in Table 5.
As seen in Table 5, there are different levels of input redundancy in Beijing’s fee-charging policies in non-DEA effective years, of which the annual collection of public transportation fees and parking fees in 2018 is the most adjusted value in non-DEA effective years, at CNY 19.528 billion and CNY 22.206 billion, respectively. The 2014 annual collection of fuel fees is the most adjusted value in non-DEA effective years, CNY 139.182 billion. In the output adjustment values, there are different degrees of output shortages in the proportion of green travel, which is the main factor affecting the DEA-ineffectiveness of the performance of Beijing’s economic policies to reduce transportation carbon emissions.

4. Discussion

4.1. Transportation CO2 Emissions Control Strategies

CO2 emissions from transportation are one of the main causes of global climate change. In 2014, the transport sector accounted for 26% of the world’s total energy consumption and a similar proportion, approximately 22%, for energy-related GHG emissions [52]. There are many studies conducted in the past that talk about carbon emission measures in the transport sector [53,54,55,56,57]. Proost and Dender [54] have identified and appraised various policy measures to address the issues related to transportation energy and GHG emissions. They have categorized these policy responses as tax (carbon or fuel), credit exchange or trade (emission trading system), fuel efficiency standard, alternative fuels or technologies, and modal shift and land-use regulation (aiming at limiting sprawl). Doll and Balaban [55] have studied the environmental co-benefits of the transport sector in Delhi. They have observed that the integration of all modes of public transport system along with increased parking fees, and restricting parking space for private vehicles would increase the environmental co-benefits from the transport sector. Kay et al. [56] have reported that pricing policies, along with low carbon technologies, increases in the carbon efficiency of medium and heavy-duty vehicles, renewable fuels, and land use and transit measures are required to reduce the carbon emissions from the transport sector. Therefore, in order to achieve low-carbon city development goals, various transport policies can be employed to tackle the increasing levels of energy consumption and CO2 emissions. These include investment in technological progress such as alternative fuel vehicles or vehicle fuel economy improvement, expansion of public transport services, more investment in active transport, promotion of the use of greener modes and vehicles, encouragement of trip sharing and chaining, and discouragement of car use through travel demand management policies [57]. In addition, given that each urban area has distinctive economic, spatial, demographic, and transport characteristics, the success of such policies, when implemented, varies from one city to another.
China faces particularly severe pressures and challenges in transportation carbon reduction. China’s urban development policies may have a huge potential impact on regional carbon dioxide emissions reduction and global climate change mitigation. It is of great significance to explore the factors of transportation CO2 in China for restraining the growth of CO2 emissions and, more pertinently, to assist in future policy formulations. The government of China has formulated relevant policies to reduce the use of private cars and encourage residents to increase the use of public transport to commute, which is one of the effective ways to alleviate the pressure of CO2 emissions reduction [58,59]. Relevant policies, including public transport and taxi price adjustment policies, car restrictions and lottery policies, and policies to improve fuel quality, should be vigorously promoted and implemented to help cities achieve GHG emission reductions and contribute to the mitigation of regional and global climate change.
The present study has adopted urban travel demand and vehicle classification approaches for estimating annual CO2 emissions for the present (as suggested by Progiou and Ziomas [60]). It accounts for impacts of passenger vehicles, including private and public transport, in the years 2006 and 2018. Further, a number of policy interventions such as public transport charges, collection of fuel fees, and a hike in parking fees of private vehicles have been considered for assessing the effect of passenger vehicle use on CO2 emissions in the study region. Because of the strong pressure exerted by both the national government and the public to improve transport congestion and CO2 reduction, the Beijing municipality government has scheduled a series of regulation and control measures, such as urban road traffic regulation policies, Beijing non-core functional evacuation policy (sub-center construction of Beijing), and Beijing non-capital functional evacuation policy (establishment of the Xiong’an new area). The effects of various policy combinations can be assessed through scenario analysis using the complex model and, thus, provide guidance to policymakers. Wang et al. [4] have proposed a complex system model that couples multi-agent-based models (ABM) and system dynamics (SD) models to simulate the impact of jobs–housing relationship adjustment policies on CO2 emissions from urban transport. In fact, we also can explore the interaction among urban socioeconomic development, low-carbon transportation, environmental economic policies (prices, charging policies, etc.), and other factors, and also simulate the urban traffic CO2 emissions system and policies, investigate the impact of different strategies on traffic CO2 emissions reduction and the economic advantages to the environment, and then select an optimal policy scheme.

4.2. Policy Implications

In this study, according to the implementation effect of the environmental and economic policies for traffic carbon emission reduction in Beijing, market-based economic policy tools have played an important role in alleviating traffic congestion and promoting the effect of traffic carbon emission reduction in Beijing. Therefore, in order to achieve a historic change in energy conservation, emissions reduction, and environmental protection of Beijing, and to realize a sustainable development strategy, it is necessary to establish a set of environmental and economic policies on transportation carbon emission reduction that is compatible with the social and economic development of Beijing. Through the above analysis, several issues still need to be addressed in the implementation of environmental and economic policies on transportation carbon emission reduction in Beijing.
First, the use efficiency of funds in the transportation fiscal investment policies is low, and the investment subject has been simplified. Traffic congestion management, energy conservation, and emissions reduction have gone through several five-year plans in Beijing. The actual investment in the transportation field during the period of the “11th Five-Year Plan” and “12th Five-Year Plan” reached CNY 253.985 billion and CNY 418.73 billion, respectively. Although it effectively checked the trend of worse Beijing traffic congestion, in a way, with such a huge investment, it has not fundamentally reversed the situation of traffic congestion in Beijing. The traffic congestion during rush hours on weekdays is still severe. Moreover, investment in the traffic field will continue to increase in the future. Therefore, ineffective and inefficient capital investment should be avoided for future traffic congestion management in Beijing, thereby improving the investment effectiveness and efficiency of the industry.
Second, the present investment subject in traffic congestion management has been simplified; the investment comes mainly from the government, with less from society, which is also the main factor causing the low-efficiency traffic control in Beijing. The transportation-related investment channels include basic road hubs and supporting funds, bus purchases and renewal funds, tracks, and supporting facilities. In the above investment, the government accounts for more than 85 percent of the total investment. Therefore, in the future, Beijing should also introduce the construction of basic non-operational facilities through market mechanisms and market means, while changing the current investment, construction, and operation mode.
Furthermore, the levy standards for transportation environmental and economic policies need to be further optimized. Beijing was one of the earliest cities to propose charging the traffic congestion fee, but it is still in the stage of demonstration. In addition, Beijing has made several price adjustments for the public transport fare policy and the taxi charging policy. With the increasing economic aggregate and population, the traffic demand of urban residents has increased yearly. Although the capacity of urban transportation improvement has been significantly improved, transportation carbon emissions are still high due to large urban populations and the total number of motor vehicles. Therefore, in order to further improve residents’ awareness of energy conservation and environmental protection and avoid the waste of natural resources, it is necessary to further adjust and optimize corresponding policies based on the current charging ones.

5. Conclusions

In this study, we focused on the role of the performance of fee-charging policies in reducing the carbon emissions of urban transport. This paper proposes a methodological framework for the performance evaluation of urban traffic carbon emission fee-charging policies. First, we analyze the current situation of the implementation of fee-charging policies and their relationship with urban traffic congestion. Fee-charging policies have played a role in alleviating urban traffic congestion. The implementation intensity of fee-charging policies and urban traffic congestion are positively correlated. With an increase in the implementation intensity of the policies, the congestion will be alleviated more obviously. The adjustment of fee-charging policies affects the cost of residents’ travel and, to a certain extent, changes the way residents travel and reduces motor vehicle travel, thereby mitigating the further deterioration of urban traffic congestion. Beijing, as an area that has implemented traffic fee-charging policies earlier than other locations in China, has played a positive role in reducing the emissions of motor vehicle pollutants and in improving the efficiency of regional emission reduction.
Subsequently, based on the survey data on Beijing’s transportation trips, the overall CO2 emissions from transportation in Beijing grew rapidly. CO2 emissions increased 1.925 times over, from 7.069 million tons in 2006 to 13.6059 million tons in 2018, with an average annual growth rate of 5.6%. The CO2 emissions of various forms of transportation in Beijing exhibited different characteristics. The CO2 emissions of cars, buses, and subways all grew, increasing 1.95 times over, 2.74 times over, and 13.60 times over, respectively, with an average annual growth rate of 5.71%, 8.75%, and 24.3%, respectively; CO2 emissions from taxis were on a downward trend. In terms of proportions, the CO2 emissions generated by car travel were the highest and remained relatively stable, with an average value of 79.3%. CO2 emissions generated by car travel are the main source of carbon emissions from transportation in Beijing.
Finally, we used the DEA method to evaluate the performance of the fee policies for urban transport, which are meant to reduce carbon emissions, analyzed their implementation efficiency, and then discussed the main factors affecting their efficiency and proposed suggestions to improve the performance of this policy in the future. Through DEA analysis, the overall effect of the implementation of Beijing’s traffic fee-charging policy is found to be positive; the average value of its comprehensive efficiency (TE) is 0.962; its implementation efficiency level is also high, and the average value of its pure technical efficiency is 0.999. Technical inefficiency is mainly driven by scale inefficiency, and secondarily by pure technical inefficiency. From the perspective of output, the main factor influencing whether there are decreasing returns to scale is the proportion of green travel. Therefore, Beijing should appropriately raise fees to encourage Beijing residents to adjust their travel methods in order to reduce motor vehicle travel and should implement other measures to more effectively reduce transportation carbon emissions. As an effective environmental and economic policy, fee-charging policies can improve the efficiency of various policies by properly adjusting fee structures.
There are some limitations to our study. First, since Beijing has not implemented a congestion fee policy, this study does not analyze the impact of congestion fee policies on traffic carbon emissions. In a follow-up study, we will also use the multi-stage DEA model to deeply study the impact of fee-charging policies on carbon emission reduction related to urban commuting in different regions of Beijing (such as public transportation fees, taxi fees, fuel price, traffic congestion fee, parking fee, and other policies). In fact, how to analyze specifically the impact of congestion fee policies on traffic carbon emissions has always been the top priority of the Chinese government. We will conduct research in this area in the future. Second, because terminal vehicles produce CO2 in the processes of manufacturing, operation, facility construction, and maintenance, it is necessary to further calculate the lifetime traffic CO2 emissions in future research, which will improve the accuracy of the results. Finally, because of government control and supervision over people, the behavior of residents is affected by many factors. The next steps in this research will combine local fee-charging policies and government controls to analyze their impact on the emissions behavior of residents from the perspective of balancing work commutes and housing quality. These limitations will be addressed in future studies.

Author Contributions

Conceptualization, H.W. and W.S.; Data curation, H.W. and W.H.; Funding acquisition, H.W. and Y.L.; Methodology, H.W. and Y.L.; Formal analysis, H.W. and H.X.; Writing —original draft, H.W. and W.S.; Writing—review and editing, Y.L. and W.S. All authors have read and agreed to the published version of the manuscript.

Funding

This research was financially supported by the National Natural Science Foundation of China (No. 42201241, No. 52102390); the National Key Research and Development Project of China (No. 2021YFC3101700); the startup fund to Huihui Wang from Advanced Institute of Natural Sciences, Beijing Normal University at Zhuhai.

Institutional Review Board Statement

Not applicable.

Informed Consent Statement

Not applicable.

Data Availability Statement

The data used in this research are available upon request from the corresponding authors.

Acknowledgments

The authors would like to thank the researchers from Tsinghua University for their support and help, and to the anonymous reviewers for their helpful and constructive comments.

Conflicts of Interest

The authors declare no competing interests.

References

  1. IPCC (Intergovernmental Panel on Climate Change). Summary for Policymakers: In Climate Change 2013: The Physical Science Basis. Contribution of Working Group I to the Fifth Assessment Report of the Intergovernmental Panel on Climate Change; Cambridge University Press: Cambridge, UK, 2013. [Google Scholar]
  2. Jones, R.S.; West, E. Environmental sustainability in veterinary anaesthesia. Vet. Anaesth. Analg. 2019, 46, 409–420. [Google Scholar] [CrossRef] [PubMed] [Green Version]
  3. Clark, P.U.; Shakun, J.D.; Marcott, S.A.; Mix, P.U.C.A.C.; Eby, M.; Kulp, S.; Levermann, A.; Milne, G.A.; Pfister, P.L.; Santer, B.D.; et al. Consequences of twenty-first-century policy for multi-millennial climate and sea-level change. Nat. Clim. Chang. 2016, 6, 360–369. [Google Scholar] [CrossRef]
  4. Wang, H.H.; Cao, R.X.; Zeng, W.H. Multi-agent based and system dynamics models integrated simulation of urban commuting relevant carbon dioxide emission reduction policy in China. J. Clean. Prod. 2020, 272, 1–19. [Google Scholar] [CrossRef]
  5. UNDESA. World Urbanization Prospects: The 2014 Revision; UNDESA: New York, NY, USA, 2014. [Google Scholar]
  6. IPCC. Climate Change 2014: Mitigation of Climate Change; Cambridge University Press: Cambridge, UK, 2015. [Google Scholar]
  7. Chow, A.S. Spatial-modal scenarios of greenhouse gas emissions from commuting in Hong Kong. J. Transp. Geogr. 2016, 54, 205–213. [Google Scholar] [CrossRef]
  8. EIA. International Energy Outlook; EIA: Washington, DC, USA, 2017. [Google Scholar]
  9. Yang, W.; Li, T.; Cao, X. Examining the impacts of socio-economic factors, urban form and transportation development on CO2 emissions from transportation in China: A panel data analysis of China’s provinces. Habitat. Int. 2015, 49, 212–220. [Google Scholar] [CrossRef]
  10. Yang, W.; Wang, W.; Ouyang, S. The influencing factors and spatial spillover effects of CO2 emissions from transportation in China. Sci. Total Environ. 2019, 696, 13390. [Google Scholar] [CrossRef]
  11. Zhao, Q.J.; Ding, S.; Wen, Z.M.; Toppinen, A. Energy flows and carbon footprint in the forestry-pulp and paper industry. Forests 2019, 10, 725. [Google Scholar] [CrossRef] [Green Version]
  12. An, S.; Hu, X.; Wang, J. Urban taxis and air pollution: A case study in Harbin, China. J. Transp. Geogr. 2011, 19, 960–967. [Google Scholar] [CrossRef]
  13. Cai, H.; Jia, X.; Chiu, A.S.F.; Hu, X.; Xu, M. Siting public electric vehicle charging stations in Beijing using big-data informed travel patterns of the taxi fleet. Transp. Res. Part D Transp. Environ. 2014, 33, 39–46. [Google Scholar] [CrossRef] [Green Version]
  14. Geng, Y.; Ma, Z.; Xue, B.; Ren, W.; Liu, Z.; Fujita, T. Co-benefit evaluation for urban public transportation sector e a case of Shenyang, China. J. Clean. Prod. 2013, 58, 82–91. [Google Scholar] [CrossRef]
  15. Luo, X.; Dong, L.; Dou, Y.; Zhang, N.; Ren, J.Z.; Li, Y.; Sun, L.; Yao, S.Y. Analysis on spatial-temporal features of taxis’ emissions from big data informed travel patterns: A case of Shanghai, China. J. Clean. Prod. 2017, 142, 926–935. [Google Scholar] [CrossRef]
  16. Wang, J.N.; Yang, J.T.; Lu, X.Y.; Wang, D.Q. Preliminary study on the system of environmental economic policies under market mechanism. China Environ. Sci. 1995, 15, 183–186. (In Chinese) [Google Scholar]
  17. Burchell, J.; Ison, S.; Enoch, M.; Budd, L. Implementation of the workplace parking levy as a transport policy instrument. J. Transp. Geogr. 2019, 80, 1–11. [Google Scholar] [CrossRef]
  18. Camporeale, R.; Caggiani, L.; Fonzone, A.; Ottomanelli, M. Study of the accessibility inequalities of cordon-based pricing strategies using a multimodal Theil index. Transport. Plan. Techn. 2019, 42, 498–514. [Google Scholar] [CrossRef] [Green Version]
  19. Gomez, J.; Vassallo, J.M. Has heavy vehicle tolling in Europe been effective in reducing road freight transport and promoting modal shift? Transportation 2020, 47, 865–892. [Google Scholar] [CrossRef]
  20. Santos, G. (Ed.) Road Pricing: Theory and Evidence (Vol. 9); University of Cambridge: Cambridge, UK, 2004. [Google Scholar]
  21. Maruyama, T.; Sumalee, A. Efficiency and equity comparison of cordon-and area-based road pricing schemes using a trip-chain equilibrium model. Transp. Res. Part A Policy Pract. 2007, 41, 655–671. [Google Scholar] [CrossRef]
  22. ITF (International Transport Forum). The Social Impacts of Road Pricing: Summary and Conclusions; ITF: Paris, France, 2018.
  23. Parmar, J.; Das, P.; Dave, S. Study on demand and characteristics of parking system in urban areas: A review. J. Traffic Transp. Eng. Engl. Ed. 2020, 7, 111–124. [Google Scholar] [CrossRef]
  24. Enoch, M.; Ison, S. Levying charges on private parking: Lessons from existing practice. World Transp. Policy Pract. 2005, 12, 5–14. [Google Scholar]
  25. Hamer, P.; Currie, G.; Young, W. Parking price policies–a review of the Melbourne congestion levy. In Proceedings of the Australasian Transport Research Forum 2011 Proceedings, Adelaide, Australia, 28–30 September 2011. [Google Scholar]
  26. Burchell, J.; Ison, S.G.; Enoch, M.E. The smeed report fifty years on: A role for the workplace parking levy? Transp. Plan. Technol. 2015, 38, 62–77. [Google Scholar] [CrossRef]
  27. Brand, C.; Preston, J.M. ‘60-20 emission’-The unequal distribution of greenhouse gas emissions from personal, non-business travel in the UK. Transp. Policy 2010, 17, 9–19. [Google Scholar] [CrossRef]
  28. Ma, J.; Chai, Y.W.; Liu, Z.L. The mechanism of CO2 emissions from urban transport based on individuals’ travel behavior in Beijing. Acta Geographica Sinica. 2011, 66, 1023–1032. (In Chinese) [Google Scholar]
  29. Cai, B.; Yang, W.; Cao, D.; Liu, L.; Zhou, Y.; Zhang, Z. Estimates of China’s national and regional transport sector CO2 emissions in 2007. Energ. Policy 2012, 41, 474–483. [Google Scholar] [CrossRef]
  30. Wang, W.W.; Zhang, M.; Zhou, M. Using LMDI method to analyze transport sector CO2 emissions in China. Energy 2011, 36, 5909–5915. [Google Scholar] [CrossRef]
  31. Alsabbagh, M.; Siu, Y.L.; Guehnemann, A.; Barrett, J. Integrated approach to the assessment of CO2 e-mitigation measures for the road passenger transport sector in Bahrain. Renew. Sustain. Energy Rev. 2017, 71, 203–215. [Google Scholar] [CrossRef] [Green Version]
  32. Hasan, M.A.; Chapman, R.; Frame, D.J. Acceptability of transport emissions reduction policies: A multi-criteria analysis. Renew. Sustain. Energy Rev. 2020, 133, 110298. [Google Scholar] [CrossRef]
  33. Sueyoshi, T.; Yuan, Y.; Goto, M. A literature study for DEA applied to energy and environment. Energy Econ. 2016, 62, 104–124. [Google Scholar] [CrossRef]
  34. Song, M.L.; Wang, S.H.; Lei, L.; Zhou, L. Environmental efficiency and policy change in China: A new meta-frontier non-radial angle efficiency evaluation approach. Process Saf. Environ. Protect. 2019, 121, 281–289. [Google Scholar] [CrossRef]
  35. Guo, J.; Zhao, M.; Wu, X.; Shi, B.; Gonzalez, E.D.R.S. Study on the distribution of PM emission rights in various provinces of China based on a new efficiency and equity two-objective DEA model. Ecol. Econ. 2021, 183, 106956. [Google Scholar] [CrossRef]
  36. Charnes, A.; Cooper, W.W.; Rhodes, E. Measuring the efficiency of decision making units. Eur. J. Oper. Res. 1978, 2, 429–444. [Google Scholar] [CrossRef]
  37. EI Mehdi, R.; Hafner, C.M. Local government efficiency: The case of moroccan municipalities. Afr. Dev. Rev. 2014, 26, 88–101. [Google Scholar] [CrossRef] [Green Version]
  38. Rotoli, F.; Valeri, E.; Ricci, S.; Rizzetto, L.; Malavasi, G. An analysis of the railway access charges regime in the Italian context. Transp. Policy 2018, 64, 20–28. [Google Scholar] [CrossRef]
  39. Liu, Z.; Guan, D.B.; Crawford-Brown, D.; Zhang, Q.; He, K.; Liu, J.G. A low carbon road map for China. Nature 2013, 500, 143–145. [Google Scholar] [CrossRef]
  40. Liu, X.; Wu, J. Energy and Environmental Efficiency analysis of China’s regional transportation sectors: A slack-based DEA approach. Energy Syst. 2015, 8, 747–759. [Google Scholar] [CrossRef]
  41. Zhang, J.R.; Zeng, W.H.; Shi, H. Regional environmental efficiency in China: Analysis based on a regional slack-based measure with environmental undesirable outputs. Ecol. Indic. 2016, 71, 218–228. [Google Scholar] [CrossRef]
  42. Sun, J.S.; Yuan, Y.; Yang, R.; Ji, X.; Wu, J. Performance evaluation of Chinese port enterprises under significant environmental concerns: An extended DEA-based analysis. Transp. Policy 2017, 60, 75–86. [Google Scholar] [CrossRef]
  43. Chen, L.; Wu, F.M.; Wang, Y.M.; Li, M.J. Analysis of the environmental efficiency in China based on the DEA cross-efficiency approach under different policy objectives. Expert Syst. 2020, 37, 1–18. [Google Scholar] [CrossRef]
  44. Dong, C.; Huang, G.H.; Cai, Y.P.; Liu, Y. An inexact optimization modeling approach for supporting energy systems planning and air pollution mitigation in Beijing city. Energy 2012, 37, 673–688. [Google Scholar] [CrossRef]
  45. NBS (National Bureau of Statistics). China Statistical Yearbook; China Statistics Press: Beijing, China, 2019.
  46. BMBS (Beijing Municipal Bureau of Statistics). Beijing Statistical Yearbook; Beijing Municipal Bureau of Statistics: Beijing, China, 2006–2019. Available online: http://nj.tjj.beijing.gov.cn/nj/main/2019-tjnj/zk/indexch.htm (accessed on 13 September 2019).
  47. IPCC (Intergovernmental Panel on Climate Change). IPCC Guidelines for National Greenhouse Gas Inventories; IPCC: Geneva, Switzerland, 2006. [Google Scholar]
  48. Wang, H.; Zeng, W. Revealing Urban carbon dioxide (CO2) emission characteristics and influencing mechanisms from the perspective of commuting. Sustainability 2019, 11, 385. [Google Scholar] [CrossRef] [Green Version]
  49. Zhang, J.; Wang, J.; Zeng, W.; Jiang, H.; Yang, F. Performance evaluation on the water pollution control charging policy of Dianchi Lake basin. China Environ. Sci. 2016, 35, 634–640. (In Chinese) [Google Scholar]
  50. Liu, W.; Tian, J.; Li, X.; Liu, T.; Chen, L. Studies on environmental performance of sector-integrate eco-Industrial parks with data envelopment analysis. Ecol. Econ. 2012, 7, 125–128. (In Chinese) [Google Scholar]
  51. Wu, L.; Yi, R.; Ma, Z. Evaluation on the efficiency of the urban infrastructural investment in Inner Mongolia based on the method of DEA. J. Inn. Mong. Univ. Philos. Soc. Sci. 2012, 44, 5–9. (In Chinese) [Google Scholar]
  52. IEA. Key World Energy Statistics; IEA: Paris, France, 2016. [Google Scholar]
  53. Preeti, A.; Suresh, J. Energy demand and CO2 emissions from urban on-road transport in Delhi: Current and future projections under various policy measures. J. Clean. Prod. 2016, 128, 48–61. [Google Scholar] [CrossRef]
  54. Proost, S.; Dender, K.V. Energy and environment challenges in the transport sector. Econ. Transp. 2012, 1, 77–87. [Google Scholar] [CrossRef]
  55. Doll, C.N.H.; Balaban, O. A methodology for evaluating environmental cobenefits in the transport sector: Application to the Delhi metro. J. Clean. Prod. 2013, 58, 61–73. [Google Scholar] [CrossRef]
  56. Kay, A.I.; Noland, R.B.; Rodier, C.J. Achieving reductions in greenhouse gases in the US road transportation sector. Energy Policy 2014, 69, 536–545. [Google Scholar] [CrossRef]
  57. İrfan, B.; Islam, S.B.; Muammer, K. Impact assessment of supply-side and demand-side policies on energy consumption and CO2 emissions from urban passenger transportation: The case of Istanbu. J. Clean. Prod. 2019, 219, 391–410. [Google Scholar] [CrossRef]
  58. Tian, Y.P.; Song, W.J.; Liu, M. An assessment of how environmental policy affects urban innovation: Evidence from China’s low-carbon pilot cities program. Econ. Anal. Policy 2021, 71, 41–56. [Google Scholar] [CrossRef]
  59. Wang, Z.; Xiao, Z.; Tam, C.Y.; Pan, W.J.; Chen, J.; Hu, C.; Ren, C.; Wei, W.; Yang, S. The projected effects of urbanization and climate change on summer thermal environment in Guangdong-Hong Kong-Macao Greater Bay Area of China. Urban Clim. 2021, 37, 100866. [Google Scholar] [CrossRef]
  60. Progiou, A.G.; Ziomas, I.C. Road traffic emissions impact on air quality of the Greater Athens Area based on a 20 year emissions inventory. Sci. Total Environ. 2011, 410, 1–7. [Google Scholar] [CrossRef]
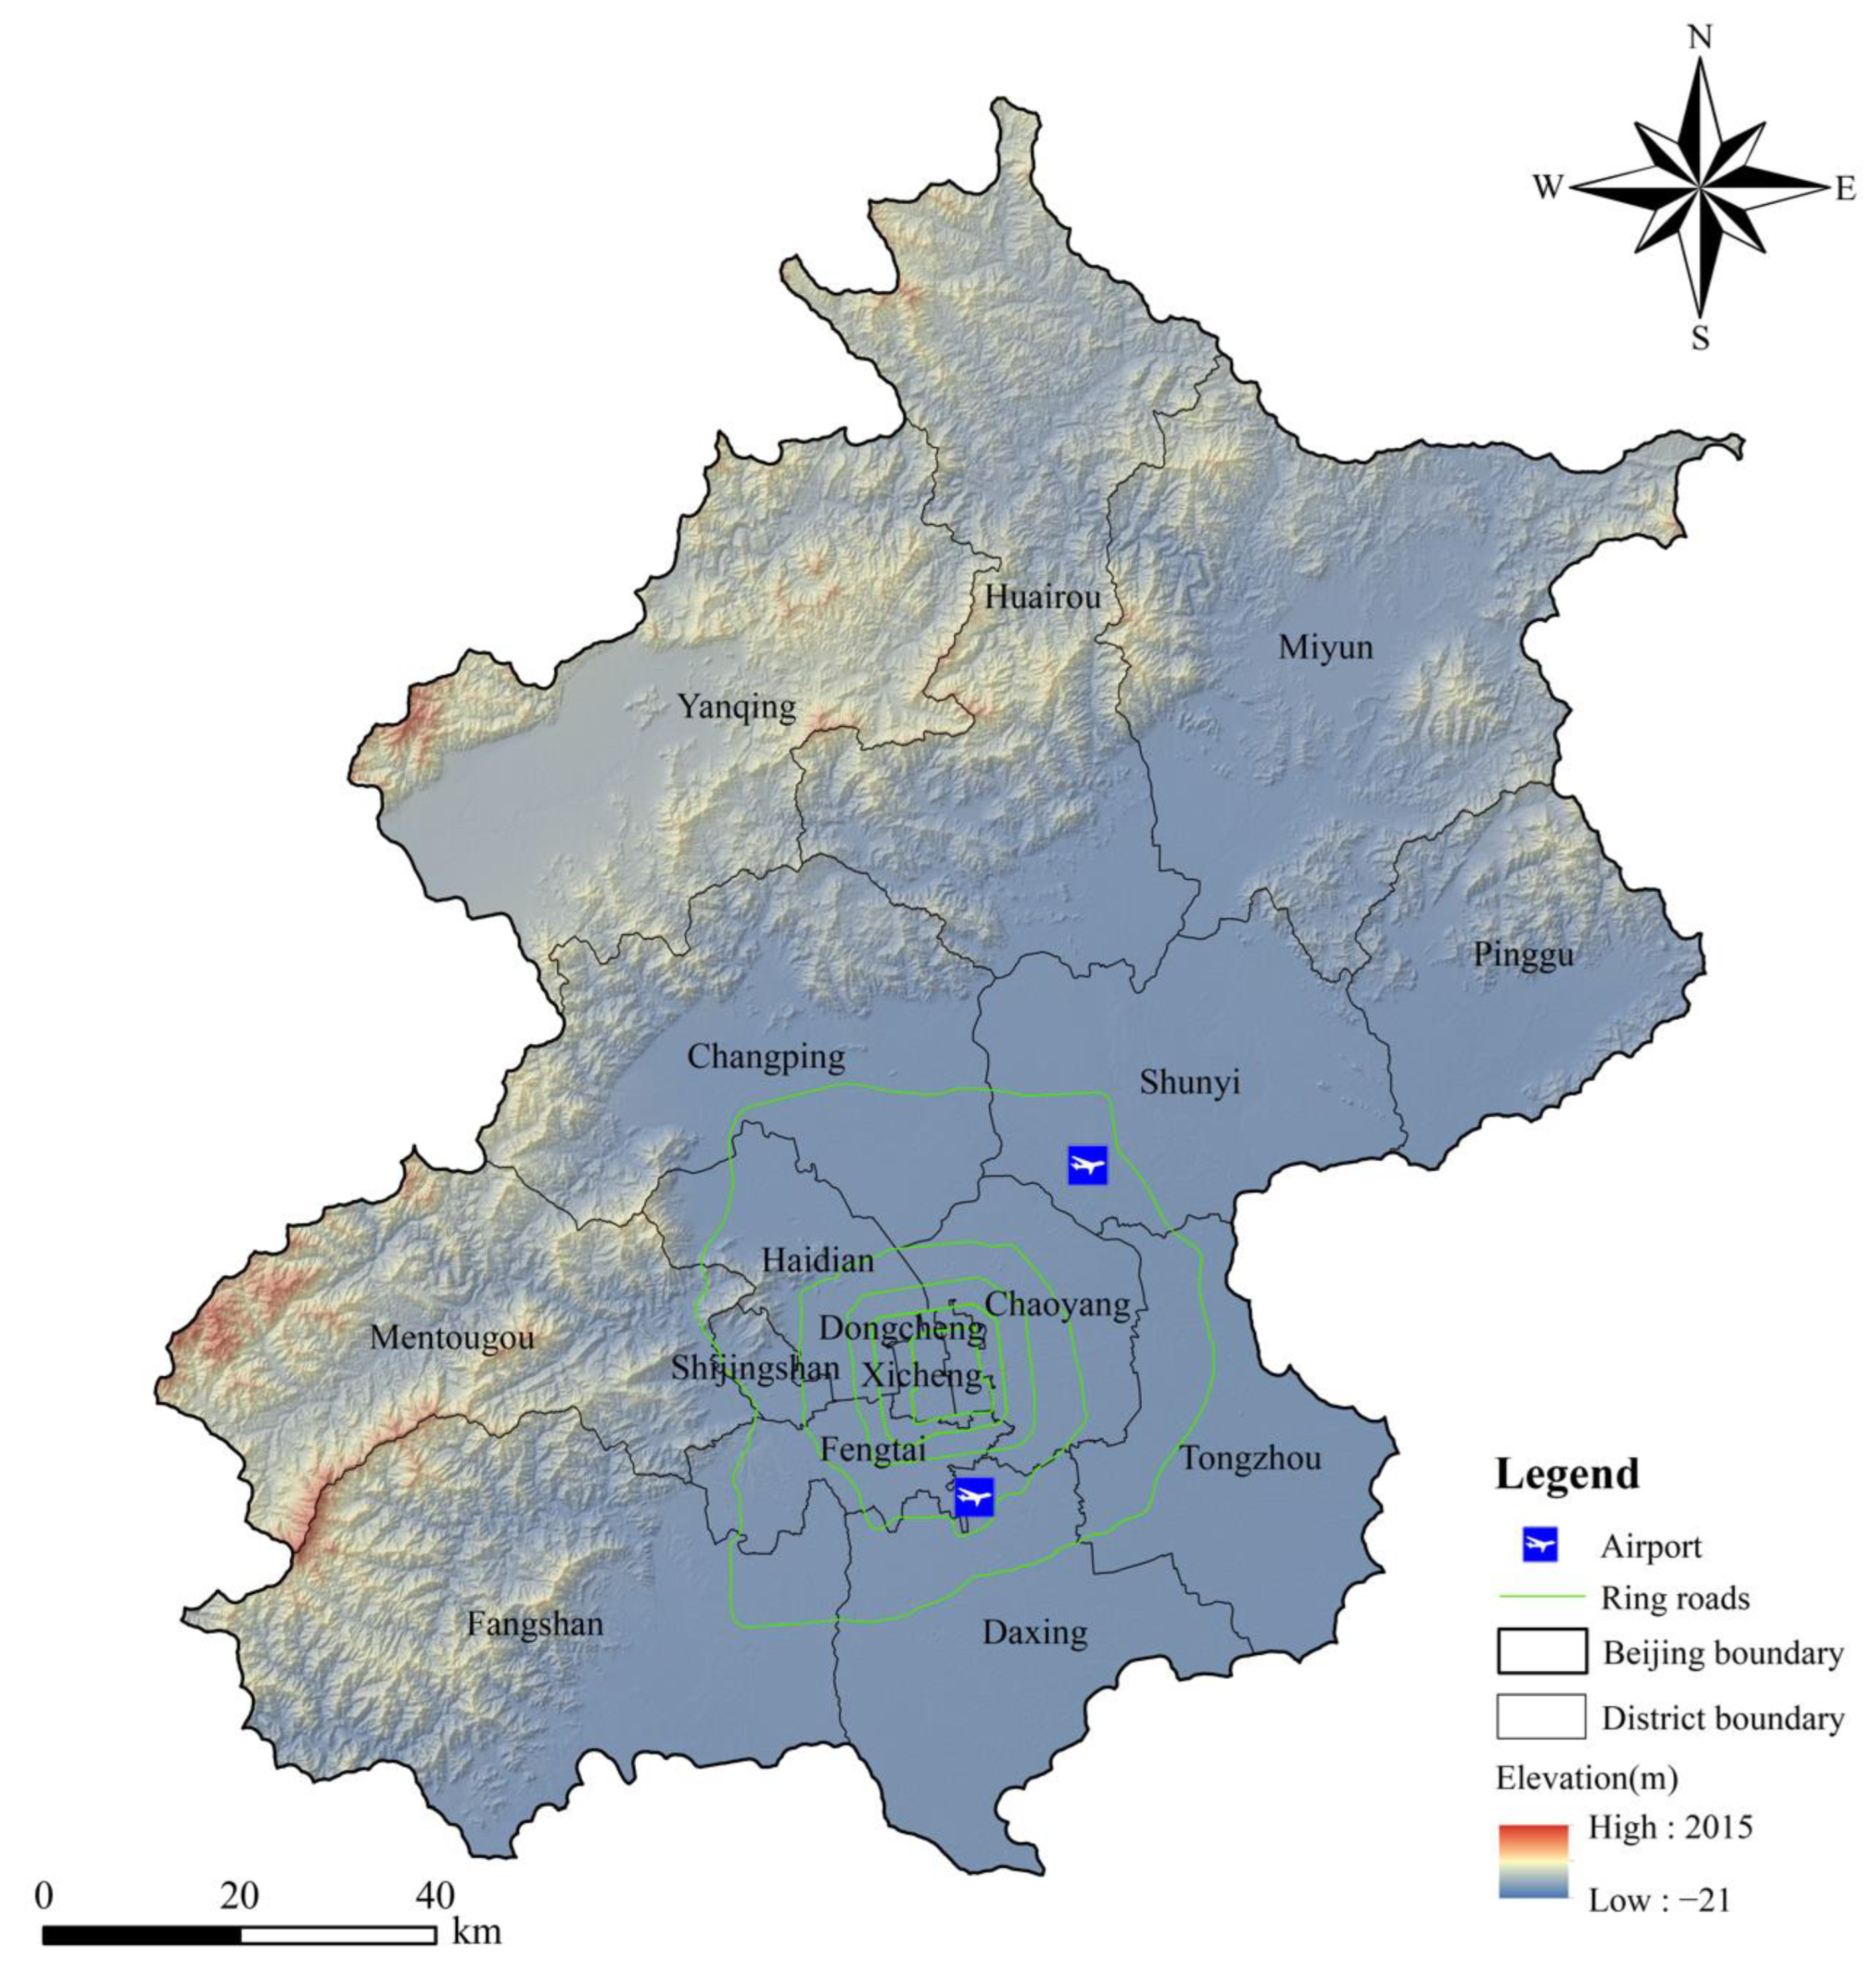
Figure 1. The Beijing study area.
Atmosphere 13 02095 g001
Figure 2. The methodological framework of this study.
Atmosphere 13 02095 g002
Figure 3. The relation between parking fees and the traffic congestion index in Beijing.
Atmosphere 13 02095 g003
Figure 4. The fees levied for public transport from 2006 to 2018.
Atmosphere 13 02095 g004
Figure 5. The relationship between fuel prices and the traffic congestion index for Beijing.
Atmosphere 13 02095 g005
Figure 6. Changes in transport travel structure in Beijing from 2006 to 2018.
Atmosphere 13 02095 g006
Figure 7. Changes in transport-related CO2 emissions from urban transport from 2006 to 2018.
Atmosphere 13 02095 g007
Figure 8. Proportion of transport-related CO2 emissions from urban transport from 2006 to 2018.
Atmosphere 13 02095 g008
Table 1. CO2 emission factors of various transport modes.
Travel ModeFuel Consumption per km/L·km−1Fuel Density/kg·L−1Energy Calorific Value/TJ·kg−1CO2 Emissions Factors of Energy/kg·TJ−1Passenger LoadingsCO2 Emission Factor/kg. (People·km)−1
Car0.0880.7250.000044369,3001.10.1781
Bus0.40.8350.00004374,100500.0213
Subway1.27/0.000025894,6003400.0091
Taxi0.0880.7250.000044369,3001.10.1781
Shuttle bus0.40.8350.00004374,100400.0266
Non-motorized transport000010
Table 2. Strategy of parking charge in Beijing.
AreaMaximum Parking ChargeParking Fees Standard
DayNight
On the RoadOff the RoadOpen
Air
Non-Open Air
Within the First Hour (CNY/15 min)After the First Hour
(CNY/15 min)
Open Air (CNY/15 min)Non-Open Air (CNY/15 min)CNY/2 hCNY/2 h
Non-residential areaTemporary parking in public parking lotCategory I region2.53.7521.512.5
Category II region1.52.251.251.25
Category III region0.50.750.50.5
Long-term parking in open-air public parking lotNo more than CNY 150/month, CNY 1600/year
Long-term parking in public buildingsMarket adjust price
Park and ride (P + R) parkCNY 2/time
Independent parking garageMarket price
Residential areaTemporary parking in open parking lotCNY 1/two h
Long-term parking in open parking lotNo more than CNY 150/month, CNY 1600/year
Temporary parking of underground parking garageNo more than CNY 1/half an hour
Underground parking garage, parking building, and three-dimensional parking facilities shall be built for long-term parkingMarket price
Table 3. Statistical description of input and output indicators.
Indicator TypeIndex Name (unit)Total SampleMinimum ValueMaximum ValueAverage ValueStandard DeviationCoefficient of VariationSkewness
Input
indicators
Public transportation fees (CNY 100 million)1343.67197.99104.9963.310.600.75
Annual parking fee collection (CNY 100 million)1383.98222.07171.2048.950.29−0.96
Annual collection of fuel fees (CNY 100 million)13332.831573.361042.56417.620.40−0.65
Output
indicators
Proportion of green travel (%)1368.4073.0070.341.330.020.41
Percentage reduction in carbon emission intensity per unit GDP (%)131.3050.7131.7617.190.54−0.64
Table 4. Performance evaluation of financial investment policies in the transportation industry.
DMUsInput Slack (CNY 100 million)Output Slack (%)Efficiency Valueλ*jReturns to Scale
S1*S2*S3*S1+*S2+*TEPTESE
2006000001.000 1.000 1.000 1.000 CRS
2007000001.000 1.000 1.000 1.000 CRS
20082.995 0109.639 000.878 0.976 0.900 1.122 DRS
2009018.891 5.186 000.919 0.975 0.942 1.069 DRS
2010016.482 0000.989 0.992 0.996 0.993 IRS
2011000001.000 1.000 1.000 1.000 CRS
2012000001.000 1.000 1.000 1.000 CRS
2013000001.000 1.000 1.000 1.000 CRS
20140014.164 000.957 1.000 0.957 1.063 DRS
2015000001.000 1.000 1.000 1.000 CRS
20167.480 015.585 0.478 00.994 1.000 0.994 1.017 DRS
201711.336 0179.093 000.871 0.994 0.877 1.173 DRS
20182.712 0283.323 000.904 1.000 0.904 1.144 DRS
Average 0.962 0.9990.894
Notations: DRS means decreasing returns to scale, IRS means increasing returns to scale, and CRS means constant returns to scale.
Table 5. Adjustment values for the input and output indexes of non-DEA effective years.
DMUsAdjusted Value of Input Index (CNY 100 Million)Adjusted Value of Output Index (%)
Public Transport ChargesAnnual Parking FeeAnnual Collection of Fuel FeeProportion of Green Travel Percentage Reduction in Carbon Emission Intensity per Unit GDP
200849.337 102.317 443.376 78.584 10.364
200955.954 127.803 672.864 74.671 18.211
201064.179 159.047 959.287 69.179 27.874
201494.134 204.072 1391.821 74.297 43.784
2016187.427 208.671 1226.706 71.933 51.035
2017185.375 215.679 1237.119 82.792 49.917
2018195.280 222.066 1290.041 80.778 52.893
Publisher’s Note: MDPI stays neutral with regard to jurisdictional claims in published maps and institutional affiliations.