Abstract
To investigate the pollutant dispersion of a nuclear power plant, a field tracing experiment was carried out in neutral stratification weather with the main wind direction SSW. On this basis, a wind speed profile and turbulence intensity profile consistent with the site were created in the wind tunnel. Meanwhile, how to generate a wind field of neutral stratification in a wind tunnel was studied in detail. Finally, a 1:1000 nuclear power area model was made to conduct tracing experiments in the wind tunnel. The results show that when the horizontal and vertical distances of the spire are 300 mm and 500 mm, and the horizontal and vertical distances of the rough element are 250 mm and 500 mm. A wind speed profile with a wind profile index of 0.321 was generated in the wind tunnel (0.334 in the field test), and the wind tunnel tracer experiment had the same diffusion trend as the field, which verified the accuracy of the flow field.
1. Introduction
The study of the wind field flow characteristics in the atmospheric boundary layer has always been one of the most important topics in the field of atmospheric diffusion. Field tests, wind tunnel experiments, and numerical simulation are usually used to study the laws of the wind field flow characteristics. However, the field test has a long cycle and is not easy to reproduce, and the results of the numerical simulation is uncertainty with various assumptions [1]. The wind tunnel experiment can artificially control various conditions of the experiment, repeat the test under the same atmospheric condition, and visually simulate the atmospheric flow field of the field test [2]. Payne, A W studied the influence of pollutant diffusion in nuclear power plants under neutral conditions with a 1:3000 terrain model [3].
The reliability of the wind tunnel experiment mainly lies in the accuracy of the wind field simulation. The wind field flow characteristics in the atmospheric boundary layer are mainly described by atmospheric stratification (or atmospheric stability), atmospheric boundary layer height, average wind speed profile, turbulence intensity profile, turbulence integral scale, and wind power spectrum [4]. The ideal method to simulate the atmospheric boundary layer in a wind tunnel is to generate a turbulent boundary layer by the natural development of rough surface, but this method requires a long experimental section. Therefore, the most common method for wind tunnel experiments is to arrange vortex generators and rough elements of a certain length in the test section to form the target wind field [5]. Cook [6] used the grid and surface roughness element to simulate wind field, and believe that the formation of a turbulent boundary layer depends on the size and shape of the roughness element. Counihan [7,8] arranged several spire turbulence generators in the wind tunnel to simulate the atmospheric boundary layer. The research showed that the use of these types of turbulence generators would cause less external momentum loss and more internal momentum loss in the boundary layer, and the length required for turbulence development should be 4–5 times the height of the target atmospheric boundary layer. Irwin [9] arranged a spire rough element combination device in the wind tunnel and successfully simulated the required atmospheric boundary layer flow field. Research showed that the shape and width of the spires will affect the turbulence intensity and turbulence integral scale of the upper and lower parts of the flow field, and the area of the spires determines the blockage ratio of the wind tunnel (the ratio of the maximum windward area of the obstacle to the cross-sectional area of the wind tunnel test section), which greatly affects the wind speed profile. In addition, he also provided an empirical formula for simulating the wind speed distribution in the atmospheric boundary layer by using the combination of spires and rough elements.
Phillips [10] simulated the atmospheric boundary layer in the wind tunnel with non-uniform variable spacing plate grids. This method can form a weak shear flow with zero vertical pressure gradient, but it is rarely used to simulate the atmospheric boundary layer. Owen [11] used parallel round bars with different intervals to form a bar grid, respectively forming a linear distribution velocity profile and an exponential distribution velocity profile. Balendra [12] used a pitot tube and hot wire anemometer to measure the average velocity and flow field characteristics of the simulated atmospheric boundary layer in the new low speed wind tunnel at the National University of Singapore. The natural wind in an urban terrain is simulated by using a damping network, quarter elliptical spires, and a rough element. Fang [13] studied and analyzed the relationship between the dynamic rough length and the size, shape, and arrangement of rough elements. Kozmar [14] generated atmospheric boundary layer flow fields of urban, suburban and rural landforms by using rough elements, elliptical spires-shaped spires, and trough baffles. Jiaqi Liu [15] studied the effects of plant morphology and coverage on sand accumulation, roughness, and wind-blown sand flux by using cylinder, cone, and inverted truncated cone arrays. Abiy F. Melaku [16] conducted wind tunnel experiments with spires and baffles to verify the correctness of the large eddy simulation of the generation of inflow turbulence.
Based on the above analysis, few studies have studied the influence of the relative distance between the spires and the rough element in the wind tunnel when simulating the atmosphere boundary layer obtained by the field experiment. Therefore, the wind field of the wind tunnel under the neutral atmospheric boundary layer was created by changing the relative position of the spires and the rough element. It is expected that the influence of the change in the relative distance between the spires and the rough element on the wind field of the wind tunnel would be obtained. Next, a nuclear power plant model was established with scale of 1:1000 to operate the tracing experiment, whose accuracy could be obtained by comparing with the field experiments.
2. Field Experiments
2.1. Meteorological Data
The diffusion of pollutants in nuclear power plants is related to meteorological conditions. The nuclear power plant is equipped with an automatic weather tower collection system and a ground weather station, which can collect hourly and per minute parameters at heights of 10 m, 30 m, 50 m, 70 m, and 100 m including average wind speed, wind direction, temperature, humidity, air pressure, rainfall, total irradiance, net irradiance, etc. We used meteorological data to fit the wind speed and turbulence intensity profiles for the wind tunnel experiments.
2.2. Wind Speed and Turbulence Intensity
Atmospheric stability refers to the strength of the vertical movement of the near-surface atmosphere, which is related to the vertical distribution of temperature, and different degrees of stability have a great impact on the diffusion of pollutants. There are many ways to classify the degree of stability. In this paper, it was determined that the atmosphere on the day of the field experiment was neutral stratification using the temperature lapse rate-wind speed method [17]. Regardless of the experiments or numerical simulations, reproducing the ABL is a key issue. In order to accurately reproduce the characteristics of the ABL, the target wind speed profile must be obtained. The wind speed profile under neutral conditions includes the logarithmic law and power law. In practical applications, most researchers use the power law empirical formula as the expression of the wind speed profile [18,19],which is as follows:
where U is the mean wind speed value at height Z (m s−1); is the reference mean wind speed value at reference height (usually is 10 m); and α is the wind speed profile index. According to the field experiment data, α was fitted to 0.334.
To realize the wind field simulation in a wind tunnel, it is necessary not only to consider the wind speed profile, but also to simulate the variation of turbulence intensity with height, that is, the distribution of turbulence profile. Similar to the wind speed profile, the turbulence intensity profile also requires an appropriate mathematical model. Therefore, the calculation of turbulence intensity during the field test adopts the empirical formula mentioned in this document [20]:
Figure 1 shows the vertical wind speed and turbulence intensity profile of the meteorological tower in the nuclear power plant during the tracer test based on Equations (1) and (3).
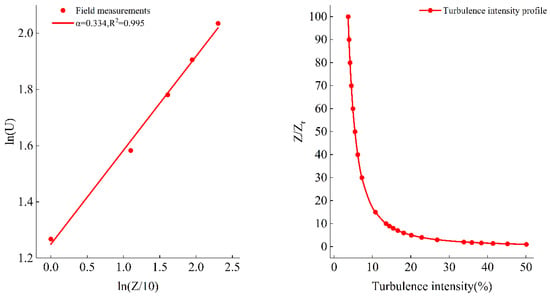
Figure 1.
Wind and turbulence intensity profile under neutral conditions.
2.3. Atmospheric Boundary Layer Height
The height of the ABL is not only an important parameter that describes the flow characteristics of the boundary layer and reflects the vertical diffusion of airborne pollutants, but is also an important parameter that needs to be determined in the atmospheric diffusion wind tunnel test and field experiment [21]. Some scholars [22,23] have summarized the definition and method of determining the height of the ABL from multiple perspectives such as turbulent motion, thermal action, dynamic action, and material distribution. In this study, the ABL height was calculated according to the diagnostic formula mentioned through Equations (4) and (5) [24].
where is the ABL height (m); is the mean wind speed at the height of 10 m of the site weather tower (m s−1); is the mixed layer coefficient, 0.012 [24]; f is the geostrophic parameter; is the geostrophic angular velocity (7.29 × 10⁻⁵ rad s−1); is the geographic latitude.
The height of the ABL during the field experiment was calculated to be 681 m.
2.4. Field Tracing Experiment
In the field and wind tunnel experiments, sulfur hexafluoride (SF6) with a purity of 99.995% was selected as the gas tracer because it has the advantages of low natural background value, stable chemical properties, and non-toxicity. It can be quickly mixed with air and fully represent atmospheric movement, and also has high detection sensitivity [25]. Figure 2 shows the field experiment layout, and the field tracer experiment was carried out on a 70 m height working platform of the meteorological iron tower, where this height is consistent with the emission of airborne pollutants from nuclear power plants. The release time of the experiment was 88 min. Weighing the total weight of the steel cylinder before and after the release, the release amount of sulfur hexafluoride at the release point was 14.46 kg, the release rate was 2.74 g s−1, the mean air velocity at the release point was 6.73 m s−1, and the average wind direction was SSW. The sample was collected 5 min after the SF6 reached the sampling point. The on-site sampling points were arranged in the sector area within 7 km in the downwind direction.
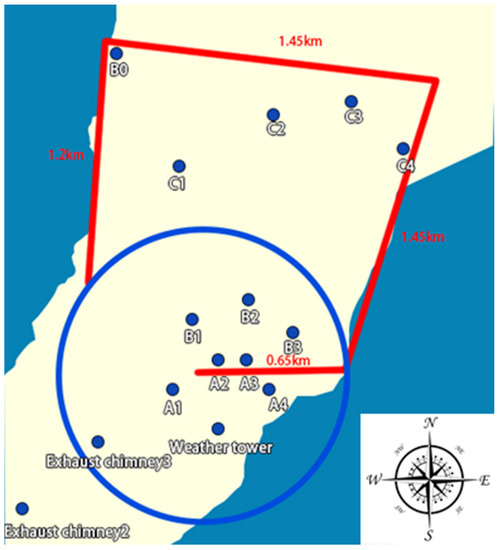
Figure 2.
Layout of the on-site sampling point.
3. Wind Tunnel Experiments
3.1. Description of Wind Tunnel
Figure 3a shows the main part of the wind tunnel, which was a horizontal direct flow blowout wind tunnel with a total length of 36 m, the test section was 17.6 m long, 1.5 m wide, 1–1.4 m high (with adjustable top plate), and the diameter of the turntable was 1.3 m. The test section used steel plate as the main frame structure, and ordinary glass was installed on the frame, and the wind speed range was 0.2–9 m s−1. The velocity profile of the wind tunnel was measured by a constant temperature hot wire anemometer (CTA) with three I-type hot-wire anemometer (DANTEC 55P11) placed on the rod at equal intervals of 20 cm. Figure 3b is a three-dimensional move rod. Figure 3c shows the Stream type constant temperature anemometer (CTA) speed measurement and calibration device. Generate the flow field in the case of an empty wind tunnel, and verify the basic parameters to show that the wind tunnel meets the basic requirements of the experiment. Considering the stability of the operation of different fans, the average wind speed was finally selected as 2.05 m s−1 (fan frequency was 50 Hz) for the following experiments.
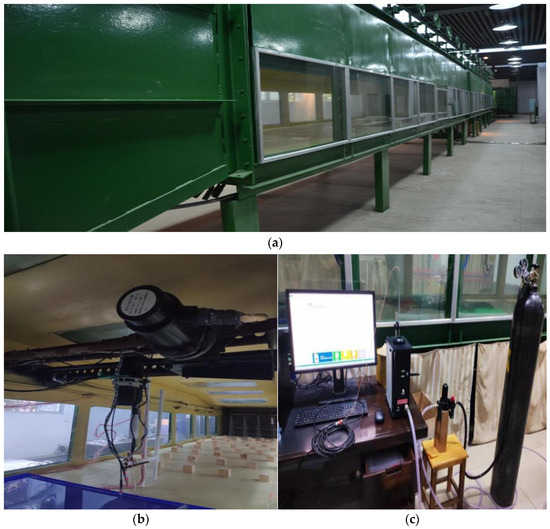
Figure 3.
(a) ABL wind tunnel at the University of South China. (b) Three-dimensional translational rod. (c) Streamline CTA.
3.2. Wind Tunnel Simulation of Atmosphere Boundary Layer
The height of the neutral ABL during the field experiment obtained in the second section was 681 m. Considering the geometric similarity, the scale of the wind tunnel and field model was determined as 1:1000 since the height of the wind tunnel was 1 m. Therefore, the height of the ABL that needed to be simulated in the wind tunnel in this article was 0.681 m. In order to create the target wind speed and turbulence intensity profile in the wind tunnel, the spires–rough element passive simulation technology [9] was adopted. The size of the spires and the rough element was also calculated according to the empirical formula proposed in this study. The height of the trapezoidal spires was initially selected as h = 811 mm, the side length of the cube rough element was L = 90 mm, and the arrangement length of the rough element was X = 4866 mm (6 × h). In order to obtain the target wind field, four sets of different experiments were carried out: the horizontal distance between the spires and spires; the longitudinal distance between the spires and the outlet of the wind tunnel grid; the horizontal distance between the rough elements; and the longitudinal distance between the rough elements. The horizontal distance in Figure 4 refers to the width of the wind tunnel, and the longitudinal distance refers to the length of the wind tunnel.

Figure 4.
Different horizontal distances of the spires: (a) 300 mm, (b) 375 mm, (c) 500 mm.
3.3. Wind Tunnel Tracing Experiment
The wind tunnel tracing experiment was based on the ground object model of the area of a nuclear power plant with a scale ratio of 1:1000. Figure 5 is a wind tunnel experimental model composed of a non-deformable composite wood board, the building was made of acrylonitrile butadiene styrene material, and the rest was made of acrylic sheet. The hills, trees, and other objects with green plastic fleece were sandblasted to increase the roughness, and the model building and terrain production error was controlled within 10%, ensuring geometric similarity to a certain extent. The meteorological tower was used as the release point, and the A~C arc at the same position as the field tracing experiment was arranged in the downwind direction. The linear distance from the release source in the wind tunnel was A1 (300 mm), A2 (330 mm), A3 (340 mm), A4 (270 mm), B0 (1910 mm), B1 (540 mm), B2 (660 mm), B3 (600 mm), C1 (137 mm), C2 (1570 mm), C3 (1720 mm), and C4 (1600 mm). The release rate of the tracer gas in the wind tunnel experiment followed the following rule: the release rate of the tracer source/the velocity ratio of the average wind speed at the release point should be equal. The average wind speed at the release point was measured with a hot wire anemometer before the tracing experiment (see Table 1 for specific parameters). The wind tunnel tracing experiment research used the meteorological tower of the nuclear power plant as the elevated point source, the wind direction was the SSW direction, and the sampling range was within 1.5 km downwind of the meteorological tower. The tracer gas was high-purity sulfur hexafluoride (99.995%), adjusted by a rotameter with a controllable flow rate, and then uniformly released into the wind tunnel through a pneumatic high-pressure polyurethane tubing air pipe during the test. The discharge method was cold discharge.
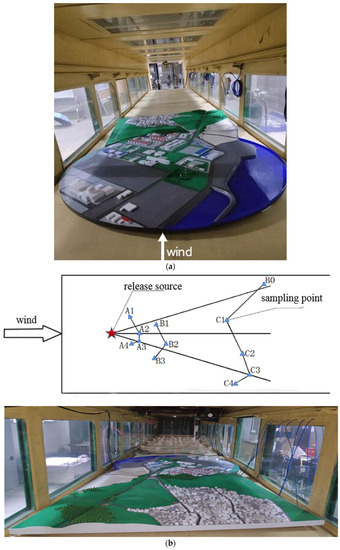
Figure 5.
(a) Wind tunnel experimental model (1:1000). (b) Sampling diagram of the wind tunnel experiment.

Table 1.
The release parameter table at the release source between the field and wind tunnel experiments.
The wind tunnel tracer experiments used the same atmospheric sampler and atmospheric sampling bag as the field tracing experiment to collect the tracer gas. The flow rate of the atmospheric sampler was 0.5 L min−1, the sampling time was 2 min, and the measurement error was less than 5%. The atmospheric sampling bag was made of a polymer film and an aluminum foil multilayer composite material, with a gas storage capacity of 1 L.
4. Results and Discussion
4.1. Simulation of Velocity Profile and Turbulence Intensity in Wind Tunnel
In this study, the spires and roughness element were used to create the wind speed profile and turbulence intensity in the wind tunnel. The effects of different arrangements using only wedges or only rough elements on the wind profiles and turbulence intensity were studied, and the effects of combined spires and rough elements were also studied. The results are as follows.
4.1.1. Influence of Horizontal Distance of the Spires on Velocity and Turbulent
It was assumed that these were arranged at a distance of 500 mm from the outlet of the grid. The center distances of the slashes were selected to be 300 mm, 375 mm, and 500 mm, respectively, and the velocity in the wind tunnel was 2.05 m s−1. Figure 6 shows the mean wind speed, turbulence intensity, and wind profile index obtained in the wind tunnel. It can be seen from Figure 6 that when the height exceeded 620 mm, the downstream average wind speed was maintained at about 2.016 m s−1, and the stable point of the vertical turbulence intensity profile was also about 620 mm. This shows that the height of the ABL generated by the spires was about 620 mm, and the relative error of the ABL calculated by the field experiments was 8.96%. The turbulence intensity simulated by the wind tunnel was inversely proportional to the horizontal distance of the spires, and the wind profile index increased with the increase in the horizontal distance of the spires. According to the field test wind profile index and the larger turbulence intensity obtained in the wind tunnel, the horizontal distance of the spires was selected as 300 mm.
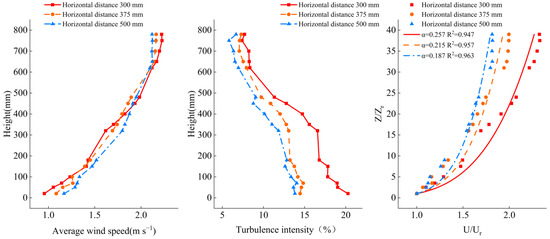
Figure 6.
Wind speed, turbulence intensity, wind profile index of the wind tunnel with different horizontal distances of the spires.
4.1.2. Influence of Longitudinal Distance of the Spires on Velocity and Turbulent
We selected the longitudinal distance of the spires (from the grid exit) 250 mm, 500 mm, 750 mm, 1000 mm, 1500 mm to create the boundary layer in the wind tunnel, and the mean wind speed was 2.05 m s−1.
It can be seen from Figure 7 that the change in the longitudinal distance of the spires had little effect on the mean wind speed profile and turbulence intensity. The farther the spires were arranged from the outlet of the wind tunnel grid, the smaller the value of the wind profile index. However, the wind profile index reached the maximum at 500 mm from the exit of the wind tunnel grid. The results show that changing the longitudinal distance of the spires had little effect on the flow field that formed at the weather tower of the wind tunnel model. After comprehensive consideration, the longitudinal distance of the selected spires is 500 mm (from the outlet of the wind tunnel grid). Therefore, in order to generate sufficient ABL in a short experimental period, the influence of the horizontal distance of the spires was stronger than the longitudinal distance of the spires.
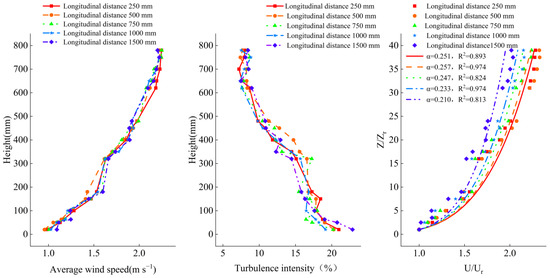
Figure 7.
Wind speed, turbulence intensity, and wind profile index of the wind tunnel with different longitudinal distance of the spires.
4.1.3. Effect of Longitudinal Distance of the Rough Elements on Velocity and Turbulent
When the height and shape of the rough element are constant, the primary research problem is how to arrange the rough element to simulate the best wind speed profile that matches the field experiment. Therefore, the longitudinal center distance of the rough element was set to 250 mm, 500 mm, 750 mm, 1000 mm, and the horizontal center distance was 300 mm, and the mean inflow wind speed was 2.05 m s−1. As shown in Figure 8, reducing the longitudinal distance of the rough element in the wind tunnel will increase the density of the rough element layout. The intensity of turbulence near the ground will be greatly enhanced. However, when the longitudinal distance is less than 500 mm, even if the longitudinal distance is reduced, the wind profile will be affected. When the longitudinal distance is reduced below 500 mm, the turbulence intensity near the ground for wind tunnels with a vertical height below 350 mm increase by 18.68% on average. Therefore, the longitudinal center distance of the rough element was selected to be 500 mm.
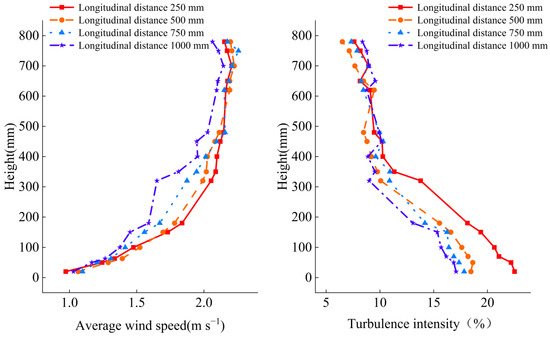
Figure 8.
Wind speed, turbulence intensity, and wind profile index of the wind tunnel with different longitudinal distances of rough elements.
4.1.4. Effect of Horizontal Distance of the Rough Elements on Velocity and Turbulent
The longitudinal distance of the rough element was 500 mm, and three sets of experiments were carried out according to the horizontal center distance of the rough element of 250 mm, 300 mm, and 375 mm (Figure 9). When the horizontal distance of the rough element is reduced in the wind tunnel, the blockages near the ground of the wind tunnel will increase, so the velocity gradient near the ground of the wind tunnel will increase, and the turbulence intensity in the lower part of the wind tunnel will increase slightly. Therefore, the horizontal center distance of rough element was selected as 250 mm.
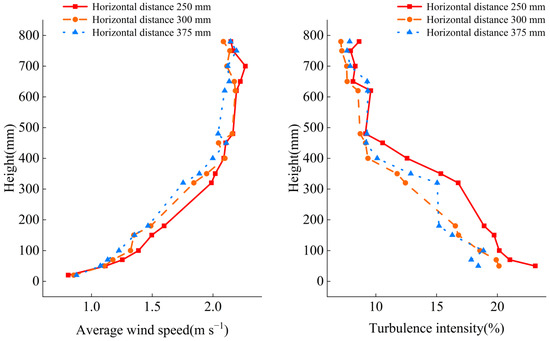
Figure 9.
Wind speed, turbulence intensity, and wind profile index of the wind tunnel with different horizontal distances of rough elements.
4.1.5. Combination of Spires and Rough Elements
Based on the experimental results discussed above, the final layout of the experimental device was as follows: the horizontal distance of the spires was 300 mm, the longitudinal distance was 500 m, the height of the cube rough element was 90 mm, the longitudinal center distance of the rough element was 500 mm, and the horizontal center distance was 250 mm. The fan frequency was 50 Hz and the mean wind speed was 2.05 m s−1. Figure 10 shows the specific layout of the experimental device in the wind tunnel. Figure 11 is the final commissioning diagram of the wind tunnel experiment, where it can be seen from the figure that the wind speed profile index at the meteorological tower in the final wind tunnel experiment was α = 0.321. Compared with the wind profile index of 0.344 obtained in the field experiment, the error was 3.89%. Although the turbulence intensity near the ground in the wind tunnel experiment was slightly less in the field experiment, but basically met the experimental requirements, the final result was acceptable. We found that spires mainly generated the target wind speed profile and the turbulence intensity profile, while reducing the horizontal distance of the spires could significantly increase the atmospheric turbulence intensity, and the rough element mainly enhanced the turbulence intensity near the ground in the wind tunnel.

Figure 10.
The final layout of the spires and rough elements in the wind tunnel experiment.
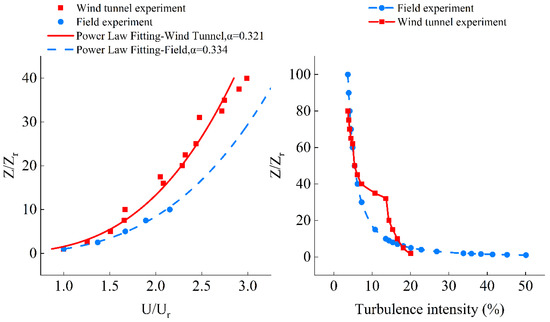
Figure 11.
Comparison of the wind tunnel experiment and field experiment.
4.2. Tracer Experiment Results
The concentration value measured in the wind tunnel tracer experiment was dimensionless according to the concentration scaling law proposed by Pasquale to compare and verify the concentration value of the field tracer experiment. The dimensionless concentration formula proposed by Pasquale is [26]:
where C* is the measured concentration; is the mean velocity at the exit of the release source; Ta is the absolute temperature of the ambient air; Ts is the absolute temperature of the tracer gas; L is the characteristic length; and Qs is the emission rate of the pollution source.
The tracer gas collected in the wind tunnel tracer experiment was detected by gas chromatography, then the concentration was nondimensionalized using Formula (6). Figure 12 is a comparison of the non-dimensional concentration of each measurement point between the wind tunnel experiment and field experiment.
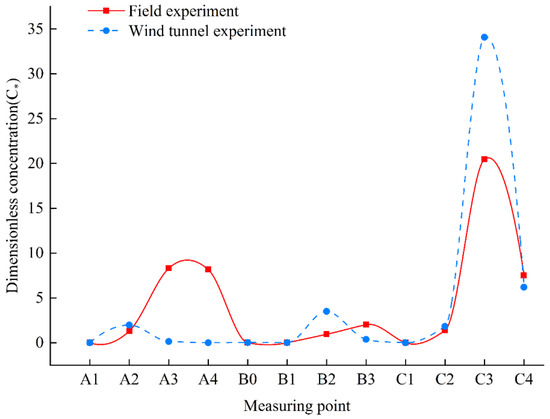
Figure 12.
Comparison of the non-dimensional concentration between the wind tunnel experiment and the field experiment.
The results of the tracer experiment showed that the trend of the pollutant concentration in the wind tunnel experiment was basically the same as that in the field experiment, and the maximum concentration of non-dimensional pollutants all appeared at point C3. The pollutant concentration varied with the horizontal distance in accordance with the normal distribution, and the concentration value was inversely proportional to the axis distance. On one hand, as the axis distance increased, the rate of decrease of the pollutant concentration slowed down. On the other hand, the horizontal spreading range gradually increased as the distance from the downwind direction increased. Since the dominant wind direction was SSW, and the measurement points A1–A4 in the wind tunnel were relatively close to the release source, points A3 and A4 were just down the dominant wind, so SF6 may not be completely diffused before being collected by the atmospheric sampler. At the same time, the instability of the wind direction during the field experiment is also an influencing factor of peak deviation. Therefore, the values of these two points in the wind tunnel were lower than the measured values on site. In addition, C1–C4 points were far away from the release source, and the concentration difference was obvious. The diffusion data show that the wind direction at the atmospheric boundary is the main factor leading to the downwind diffusion of airborne pollutants.
5. Conclusions
In order to obtain the rule of pollutant dispersion of a nuclear power plant, the field tracing experiment was carried out in neutral stratification weather with the main wind direction of SSW, and the vertical distribution profiles of wind speed and turbulence intensity at the site were obtained. On this basis, the wind speed profile and turbulence intensity profile consistent with the site were created in the wind tunnel. Meanwhile, how to generate a wind field of neutral stratification in the wind tunnel was studied in detail, and some interesting results were obtained. Finally, a 1:1000 nuclear power area model was developed to conduct tracing experiments in the wind tunnel.
Some conclusions can be summarized as follows. (1) The spires and rough elements are important tools for generating ABL. The function of the spires is to form the target wind profile and ABL height, and the rough element is to enhance the turbulence intensity near the ground. (2) The velocity profile index decreased with the increase in the transverse distance of the tower tip, and decreased with the increase in the longitudinal distance of the tower tip (the maximum value was reached when d = 500 mm). The wind profile index finally generated in the wind tunnel experiment was 0.321, and the error was 3.89% compared with the meteorological tower wind profile of 0.334 obtained in the field experiment. (3) The concentration variation trend of the wind tunnel tracing experiment was also in good agreement with the field tracing experimental results.
Author Contributions
Supervision, Funding acquisition, D.X. and H.W.; Writing—original draft preparation, review & editing, P.X. and N.C.; Data curation, N.C. and L.S.; Investigation, X.D. All authors have read and agreed to the published version of the manuscript.
Funding
This research was funded by the National Natural Science Foundation of China (U186720079, 12275122), and the APC was funded by Hanqing Wang and Dong Xie financial support of the National Natural Science Foundation of China (U186720079, 12275122).
Institutional Review Board Statement
Not applicable.
Informed Consent Statement
Not applicable.
Data Availability Statement
Data will be made available on request.
Acknowledgments
We appreciate the relevant people who provided the meteorological data and their help in the field experiments. The images used in this article were created by the author without any copyright conflict.
Conflicts of Interest
The authors declare no conflict of interest.
References
- Gartmann, A.; Fister, W.; Schwanghart, W.; Müller, M.D. CFD modelling and validation of measured wind field data in a portable wind tunnel. Aeolian Res. 2011, 3, 315–325. [Google Scholar] [CrossRef]
- Cermak, J.E. Applications of wind tunnels to investigation of wind-engineering problems. AIAA J. 1979, 17, 679–690. [Google Scholar] [CrossRef]
- Payne, A.W.; Snyder, W.H.; Binkowski, F.S.; Watson, J.E., Jr. Diffusion in the vicinity of standard-design nuclear power plants-II. Wind-tunnel evaluation of building-wake characteristics. Health Phys. 1982, 43, 829–844. [Google Scholar] [CrossRef] [PubMed]
- Simiu, E.; Yeo, D.H. Wind Effects on Structures; John Wiley & Sons Ltd.: Hoboken, NJ, USA, 2019. [Google Scholar]
- Yassin, M.F.; Kato, S.; Ooka, R.; Takahashi, T.; Kouno, R. Field and wind-tunnel study of pollutant dispersion in a built-up area under various meteorological conditions. J. Wind Eng. Ind. Aerodyn. 2005, 93, 361–382. [Google Scholar] [CrossRef]
- Cook, N.J. On simulating the lower third of the urban adiabatic boundary layer in a wind tunnel. Atmos. Environ. 1973, 7, 691–705. [Google Scholar] [CrossRef]
- Counihan, J. Simulation of an adiabatic urban boundary layer in a wind tunnel. Atmos. Environ. 1973, 7, 673–689. [Google Scholar] [CrossRef]
- Counihan, J. An improved method of simulating an atmospheric boundary layer in a wind tunnel. Atmos. Environ. 1969, 3, 197–214. [Google Scholar] [CrossRef]
- Irwin, H. The design of spires for wind simulation. J. Wind Eng. Ind. Aerodyn. 1981, 7, 361–366. [Google Scholar] [CrossRef]
- Phillips, J.C.; Thomas, N.H.; Perkins, R.J.; Miller, P.C.H. Wind tunnel velocity profiles generated by differentially-spaced flat plates. J. Wind Eng. Ind. Aerodyn. 1999, 80, 253–262. [Google Scholar] [CrossRef]
- Owen, P.R.; Zienkiewicz, H.K. The production of uniform shear flow in a wind tunnel. J. Fluid Mech. 1957, 2, 521–531. [Google Scholar] [CrossRef]
- Balendra, T.; Shah, D.A.; Tey, K.L.; Kong, S.K. Evaluation of flow characteristics in the NUS-HDB Wind Tunnel. J. Wind Eng. Ind. Aerodyn. 2002, 90, 675–688. [Google Scholar] [CrossRef]
- Fang, C.; Sill, B.L. Aerodynamic roughness length: Correlation with roughness elements. J. Wind Eng. Ind. Aerodyn. 1992, 41, 449–460. [Google Scholar] [CrossRef]
- Kozmar, H. Natural wind simulation in the TUM boundary layer wind tunnel. In Proceedings of the 5th European-African Conference on Wind Engineering, Florence, Italy, 19–23 June 2009. [Google Scholar]
- Liu, J.; Kimura, R.; Miyawaki, M.; Kinugasa, T. Effects of plants with different shapes and coverage on the blown-sand flux and roughness length examined by wind tunnel experiments. Catena 2021, 197, 104976. [Google Scholar] [CrossRef]
- Melaku, A.F.; Bitsuamlak, G.T. A divergence-free inflow turbulence generator using spectral representation method for large-eddy simulation of ABL flows. J. Wind Eng. Ind. Aerodyn. 2021, 212, 104580. [Google Scholar] [CrossRef]
- Albornoz, C.P.; Soberanis, M.E.; Rivera, V.R.; Rivero, M. Review of atmospheric stability estimations for wind power applications. Renew. Sustain. Energy Rev. 2022, 163, 112505. [Google Scholar] [CrossRef]
- Amini, S.; Ahangar, F.E.; Heist, D.K.; Perry, S.G.; Venkatram, A. Modeling dispersion of emissions from depressed roadways. Atmos. Environ. 2018, 186, 189–197. [Google Scholar] [CrossRef]
- Kikumoto, H.; Ooka, R.; Sugawara, H.; Lim, J. Observational study of power-law approximation of wind profiles within an urban boundary layer for various wind conditions. J. Wind Eng. Ind. Aerodyn. 2017, 164, 13–21. [Google Scholar] [CrossRef]
- Li, H.; Guan, G.; Zhen, B. Data Processing of Atmospheric Boundary Layer Simulation Test. J. Zhengzhou Univ. Eng. Sci. 2002, 23, 64–67. (In Chinese) [Google Scholar]
- Cui, H.; Yao, R.; Chen, L.; Lv, M.; Xin, C.; Wu, Q. Field study of atmospheric boundary layer observation in a hilly Gobi Desert region and comparison with the CALMET/CALPUFF model. Atmos. Environ. 2020, 235, 117576. [Google Scholar] [CrossRef]
- Garratt, J.R. The atmospheric boundary layer. Earth-Sci. Rev. 1994, 37, 89–134. [Google Scholar] [CrossRef]
- Van Ulden, A.P.; Holtslag, A.A.M. Estimation of atmospheric boundary layer parameters for diffusion applications. J. Appl. Meteorol. Clim. 1985, 24, 1196–1207. [Google Scholar] [CrossRef]
- Zhang, H.; Zhang, X.; Li, Q.; Cai, X.; Fan, S.; Song, Y.; Hu, F.; Che, H.; Quan, J.; Kang, L.; et al. Research progress on estimation of the atmospheric boundary layer height. J. Meteorol. Res. 2020, 34, 482–498. [Google Scholar] [CrossRef]
- Gromke, C.; Jamarkattel, N.; Ruck, B. Influence of roadside hedgerows on air quality in urban street canyons. Atmos. Environ. 2016, 139, 75–86. [Google Scholar] [CrossRef]
- Xuan, J. Physical Modeling of Atmospheric Diffusion; China Meteorological Press: Beijing, China, 2000; pp. 215–216. (In Chinese) [Google Scholar]
Publisher’s Note: MDPI stays neutral with regard to jurisdictional claims in published maps and institutional affiliations. |
© 2022 by the authors. Licensee MDPI, Basel, Switzerland. This article is an open access article distributed under the terms and conditions of the Creative Commons Attribution (CC BY) license (https://creativecommons.org/licenses/by/4.0/).