Article

Comparison of Urban Heat Island Diurnal Cycles under Various Atmospheric Conditions Using WRF-UCM

Institute of Geography, Faculty of Science, Pavol Jozef Šafárik University in Košice, 041 54 Košice, Slovakia
*
Author to whom correspondence should be addressed.
Atmosphere 2022, 13(12), 2057; https://doi.org/10.3390/atmos13122057
Submission received: 12 October 2022 / Revised: 22 November 2022 / Accepted: 6 December 2022 / Published: 8 December 2022
(This article belongs to the Section Atmospheric Techniques, Instruments, and Modeling)

Abstract

:
The rapid growth of urbanization significantly influences local atmospheric conditions and life quality of residents living in urban areas by creating a localized phenomenon known as an urban heat island. Urban heat island characteristics are strongly formed by prevailing atmospheric conditions influencing their magnitude and intensity. In this study, we used the Weather Research and Forecasting model to investigate the effects of different airmass and windspeed characteristics on the diurnal cycle of the urban heat island phenomenon during four real weather situations presenting typical scenarios with clear sky conditions. The scenarios consisted of warm dynamic and non-dynamic situations and cold dynamic and non-dynamic situations identified with respect to temperature profiles, humidity and wind speed. The comparison of urban heat island intensity between all four scenarios showed a significant effect of wind speed on urban heat island characteristics and intensity as well as the role of humidity and airmass temperature in diurnal changes. The results showed that urban heat island is best defined by conditions with strong radiative heating and weak wind speed regardless of temperature. Air humidity appears to have significant influence on UHII with cold non-dynamic situations in dry air showing a very high UHII amplitude during the daylight period and high intensity during the night. The comparison of warm and cold dynamics situations showed the influence of vertical heat exchange with strong mixing of air between near-surface levels and lower levels of the troposphere with a mild effect on UHII during the warm situation and strong influence on decreasing UHII during the cold scenario.

1. Introduction

An urban heat island represents one of the most significant impacts of urbanization and anthropogenic modification of microclimates caused primarily by a change in land use and anthropogenic heat production. Urban areas have a localized and significant effect on atmospheric conditions and largely influence heat distribution and fluxes in the planetary boundary layer (PBL) [1,2,3] creating the urban heat island (UHI) phenomenon [4]. The UHI is defined as a closed isotherm that indicates an area that is relatively warm compared to the surroundings [5,6]. The UHI phenomenon influences atmospheric conditions beyond temperature and has also a considerable effect on cloud development, especially over large cities with a prolonged duration and increased persistence of low clouds [7]. Urban areas also influence nighttime relative humidity and consequently reduce fog formation and increase cloud base height [8]. With an ever growing population in urban areas and climate change exhibiting an increased frequency of heat waves [9,10], the microclimate of urban areas and UHI are becoming a major concern for densely populated areas. Heat waves are amplified by urban areas which significantly increases a thermal stress on inhabitants living in cities [11]. In the long term, this phenomenon is also reflected in increased mortality of the population in urban areas [12,13] and negatively influences the comfort of city inhabitants.
Current research focuses mainly on the possibilities of modeling and mapping UHI intensity, as well as influencing factors, in order to better describe the phenomenon and potentially mitigate the consequences [12,14]. New possibilities of using data from Earth observation techniques and increasing computational power make it possible to map and simulate the conditions and energy balance within the urban environment at high spatial resolution. Earth observation methods can directly record surface temperature [15,16,17,18], but also other physical parameters of the land surface necessary for modeling conditions, such as albedo or vegetation indexes [19,20,21]. The use of models to simulate conditions and energy balance of the UHI is currently the preferred choice for its more detailed mapping and the quantitative description of its intensity. Good examples are models developed in GRASS GIS [22,23], models simulating the ground layer of the atmosphere and energy fluxes within it, such as the Urban Weather Generator [24], or computational fluid dynamics models used to simulate airflow within built-up areas [25]. Among the various computational options, urban microclimate models are becoming very popular and are quickly developing for assessing the UHI and microclimate conditions in urban areas. The urban microclimate models allow for simulation of the atmospheric conditions with high precision and resolution. Such models as MUKLIMO, PALM, METRAS and MITRAS [26,27,28] are also capable of running simulations with complex urban morphology, including building geometry and detailed physical parameters of the land surface. Many of the microclimate models can be coupled with meteorological numerical models, such as COSMO or ICON [29], which represent another powerful tool for the investigation of urban microclimates and UHIs. Originally designed for operational weather forecasts and the study of the state of the atmosphere on a synoptic and mesoscale level, these models were also gradually developed for microscale applications and for complex land cover in urban areas. Weather Research and Forecasting (WRF) [30] is an open-source numerical weather prediction (NWP) model with the capabilities to run detailed simulations over urban areas. The model currently contains many options for setting up the physical parameterization of the simulation [31] and built-in surface and urban models derived from input land cover data [32,33]. Land cover data provide crucial information about the physical characteristics of the surface, such as surface albedo, surface moisture, surface emissivity, surface roughness and surface thermal inertia [34]. Numerous studies have demonstrated the importance of new and detailed land cover data in NWP simulations with a grid resolution below 1 km [34,35,36,37]. The main advantage of the NWP models is the capability to run simulations with complex atmospheric physics and surface–atmosphere interactions and include a wide area to cover the local orographic effects for running real case scenarios. NWP models can also directly include into the simulation dynamics the development of atmospheric disturbances and phenomena occurring on the mesoscale level, which is a great advantage over the localized urban microclimate models when investigating the effects of airmass and wider atmospheric conditions on UHIs. This also allows for the investigation of various idealized and real case scenarios with different atmospheric conditions influencing the characteristics of UHIs and their intensity. The studies evaluating UHIs using the NWP models are primarily focused on the conditions during heatwave events [38,39] because of the UHI heat amplification effect, or are focused on evaluating the UHI phenomenon from a climatological point of view and global warming amplification [40,41,42], focusing especially on the wider summertime period or whole year. Several studies have analyzed the effects of wind on UHIs [43,44,45], concluding that lowered heat intensity is caused by a wind-induced vertical mixing within the boundary layer [46]. Humidity was also proven to be an important factor affecting urban heat island intensity [47], however there is less knowledge available on the UHI phenomenon during colder and dry conditions with strong radiative heating taking place during the summer periods. The focus of this study is to evaluate the effects of various atmospheric conditions on UHI intensity and diurnal development with respect to airmass characteristics and windspeed in order to describe UHI dynamics more precisely.
In this paper, the NWP model WRF 4 parameterized to use the urban canopy model (UCM) was used to simulate the UHI phenomenon for Košice, a mid-sized European city in East Slovakia with typical urban settings. The WRF model was chosen deliberately because of its ability to include complex atmospheric physics and processes, as well as its ability to run detailed simulations over urban areas. Different case study scenarios were selected to cover various clear-sky conditions with consideration of air humidity, temperature and wind speed. Overall, four situations were identified and compared to cover warm dynamic, warm non-dynamic, cold dynamic and cold non-dynamic conditions with prevailing representative conditions during the 24-h period. Section 2 characterizes the model setup, domains and data preparation required to run the simulation in an urban environment. This section also contains identification and description of the case study scenarios, as well as methods to evaluate model accuracy and urban heat island intensity. Section 3 presents the results of the model accuracy and describe the characteristics of urban heat island intensity in all four case study scenarios. Section 4 contains the discussion and main conclusions, and the outlooks for future research are presented in Section 5.

2. Methodology and Data

2.1. Model Parameterization

The WRF model contains a wide range of physical parameters and options for setting the resolution of the simulation [30]. Basic physical parameterization options include configuration of surface physics, shortwave and longwave radiation, interactions within the planetary boundary layer, microphysics and convection [31]. The parameterization of the model dynamics affects the calculation of air mass kinematics and momentum, including turbulence, air mass mixing, advection schemes and gravity wave dynamics. Nesting [48] is also required for simulations at high resolution when using the low-resolution initial conditions. Using multiple domains in nesting allows us to correctly simulate the boundary conditions and include a wider area in greater resolution which is also necessary for running a simulation in areas with rugged topography [36,37,49].
Identical model configuration was used for all four case studies with configuration options presented in Table 1. Three domains were set with a grid resolution of 100 × 100 and 100 vertical levels. The grid size was set in radial units to 0.002 degrees, which corresponds to about 222 m for the main domain (D3) with a timestep of 1.2 s between iterations and a history interval of 10 min. The parent domains used in nesting were set at a 1:5 ratio for the timestep and horizontal grid size. NCEP GDAS/FNL 0.25 Degree Global Tropospheric Analyses and Forecast Grids [50] were used as initial conditions for all selected scenarios. The simplified physical parameterization was set for running the simulation in urban areas using the unified Noah land surface model [51] and a single-layer urban canopy model [32] for all domains. The Dudhia shortwave scheme [52] was used for shortwave radiation and the Rapid Radiative Transfer Model (RRTM) longwave scheme [53] was used to configure a longwave radiation. The microphysics option was set to the Purdue Lin scheme [54], and the Kain–Fritsch scheme [55] was used for cumulus physics parameterization for parent domains, while for the nest domain, the cumulus physics were disabled. The boundary layer option was set to the local turbulent kinetic energy (TKE) Bougeault–Lacarrere (Boulac) scheme [56]. The model run was set the day before the case study time interval in order to provide several hours of spin-up from initial conditions.

2.2. Domains and Atmospheric Conditions

Three nested model domains were equally set to cover the surrounding urban area, as shown in Figure 1a,b. The first domain was set to a horizontal resolution of 0.05 degrees (≈5500 m) covering a wider area of the Carpathian Mountains. The second domain covers a diverse local topography, which significantly influences the airflow and microclimate in the Košice basin. The third the nest domain was set directly over the urbanized area covering the city of Košice, scattered settlements, industrial areas and airport with available surface synoptic observations (SYNOP) for evaluating the model accuracy and identification of case study scenarios.
Four real case scenarios were selected for comparison of the UHI diurnal cycle covering dynamic and non-dynamic conditions in warm and cold air during the summer period. All scenarios were carefully selected from vertical profiles [57], SYNOP data and multiple freely available archived synoptic and model maps with emphasis on minimal cloud cover during the 24-h period. The period was deliberately set from 3:00 UTC to 3:00 UTC on the next day to better cover the diurnal cycle of the UHI and to include more appropriate weather conditions. The skew-t vertical profiles represent a thermodynamic diagram used to plot the vertical distribution of humidity, temperature and wind of the atmosphere. The vertical profile shows horizontal pressure lines (isobars) with a logarithmic scale ranging from the surface usually up to the 100 hPa level. The solid, dark lines represent the actual temperature (right line) and dewpoint (left line), while the wind barbs represent wind speed and direction at a certain level in knots, or, as in this case, in meters per second. The skewed, straight blue lines are isotherms with a corresponding temperature scale at the bottom of the diagram, and the skewed, straight purple lines represent the saturation water vapor mixing ratio in grams of water vapor per kilogram of dry air (g/kg). The green line corresponds to the dry adiabatic lapse rate or a rate of cooling of a rising unsaturated parcel of air, while the blue lines skewing to the left represent the moist adiabatic lapse rate or a rate of cooling of the rising parcel of the saturated air. The grey line is the actual path of the rising parcel of the air from PBL [58]. The vertical profiles were obtained from the Gánovce aerological center, the closest available site with data in the region. Given the greater distance and rugged topography between the observation site and the Košice basin, the data represent general windspeed and airmass characteristics for each synoptic situation. All of the situations were chosen with consideration of more homogenous atmospheric conditions during the day. A few differences, however, need to be considered when interpreting the vertical profiles, especially the low level windspeed in dynamic scenarios. The Košice basin has an open topography with typically higher windspeeds in lower levels during situations with a stronger cold advection, while the Gánovce site is significantly influenced by the Tatra mountains which act as a barrier to airflow in lower levels and deflect the flowing air from the north. The difference in windspeed can be seen between the skew-t profile measured from Gánovce in Figure 2b and data measured at the Košice airport.
The dynamic warm case scenario was identified during the day of 31 August 2015 with a peaking heatwave in the warm sector and a close proximity of an advancing cold front, creating a relatively strong south-west flow in lower levels of the troposphere (Figure 2a). The maximum temperature in 2 m during that day reached 34.2 °C with measured 8 m/s maximum wind speed at 10 meters above ground. The second case scenario included warm, non-dynamic conditions during the heatwave of 30 June 2022. The synoptic situation was typical for the heatwave event in central Europe [10] with a relatively stable backside of an upper-level ridge reaching from the south-west and advecting warm tropical air over the continent. The vertical profile of this situation shows a deep dry profile following a dry adiabatic lapse rate up to 700 hPa and weak eastern flow at lower levels (Figure 2c). The maximum temperature during that situation peaked at 36 °C with only 4 m/s maximum wind speed. The cold dynamic scenario was chosen for the 12 June 2022 with a strong northern flow advecting cold air behind the cold front and expanding the ridge from the south-west. The strong northern flow is less defined in the profile because of different characteristics of the measuring site and its distance but is still clearly visible in the shallow layer near the surface (Figure 2b). The maximum temperature reached 26.4 °C with 11 m/s maximum wind speed. The cold non-dynamic situation was harder to identify, since such conditions during the summer often lead to a diurnally driven convection with numerous shallow cumilform clouds forming in the afternoon under the inversion layer. One situation without clouds was identified during the 3 June 2017 with a broad high-pressure area and very low horizontal pressure gradients. The vertical profile shows little to no wind at the near-surface level and coldest air in lower levels among all four scenarios (Figure 2d). The maximum recorded temperature at the Košice airport reached during this situation was 27.2 °C, with maximum wind speed of 4 m/s in the morning and almost no wind during the day. Although the first situation was set for late August with different solar radiation intensity in comparison to the other situations occurring during June, the data were proven to be sufficient for evaluating summer UHI intensity, as shown in Table 2. The diurnal heating was still strong enough to make comparisons with situations in June, though it is of lesser importance than during typical non-dynamic situations. In this case, the ongoing warm advection and mixing with warmer air in higher levels played a significant role in temperature development during the day.

2.3. Data Preparation

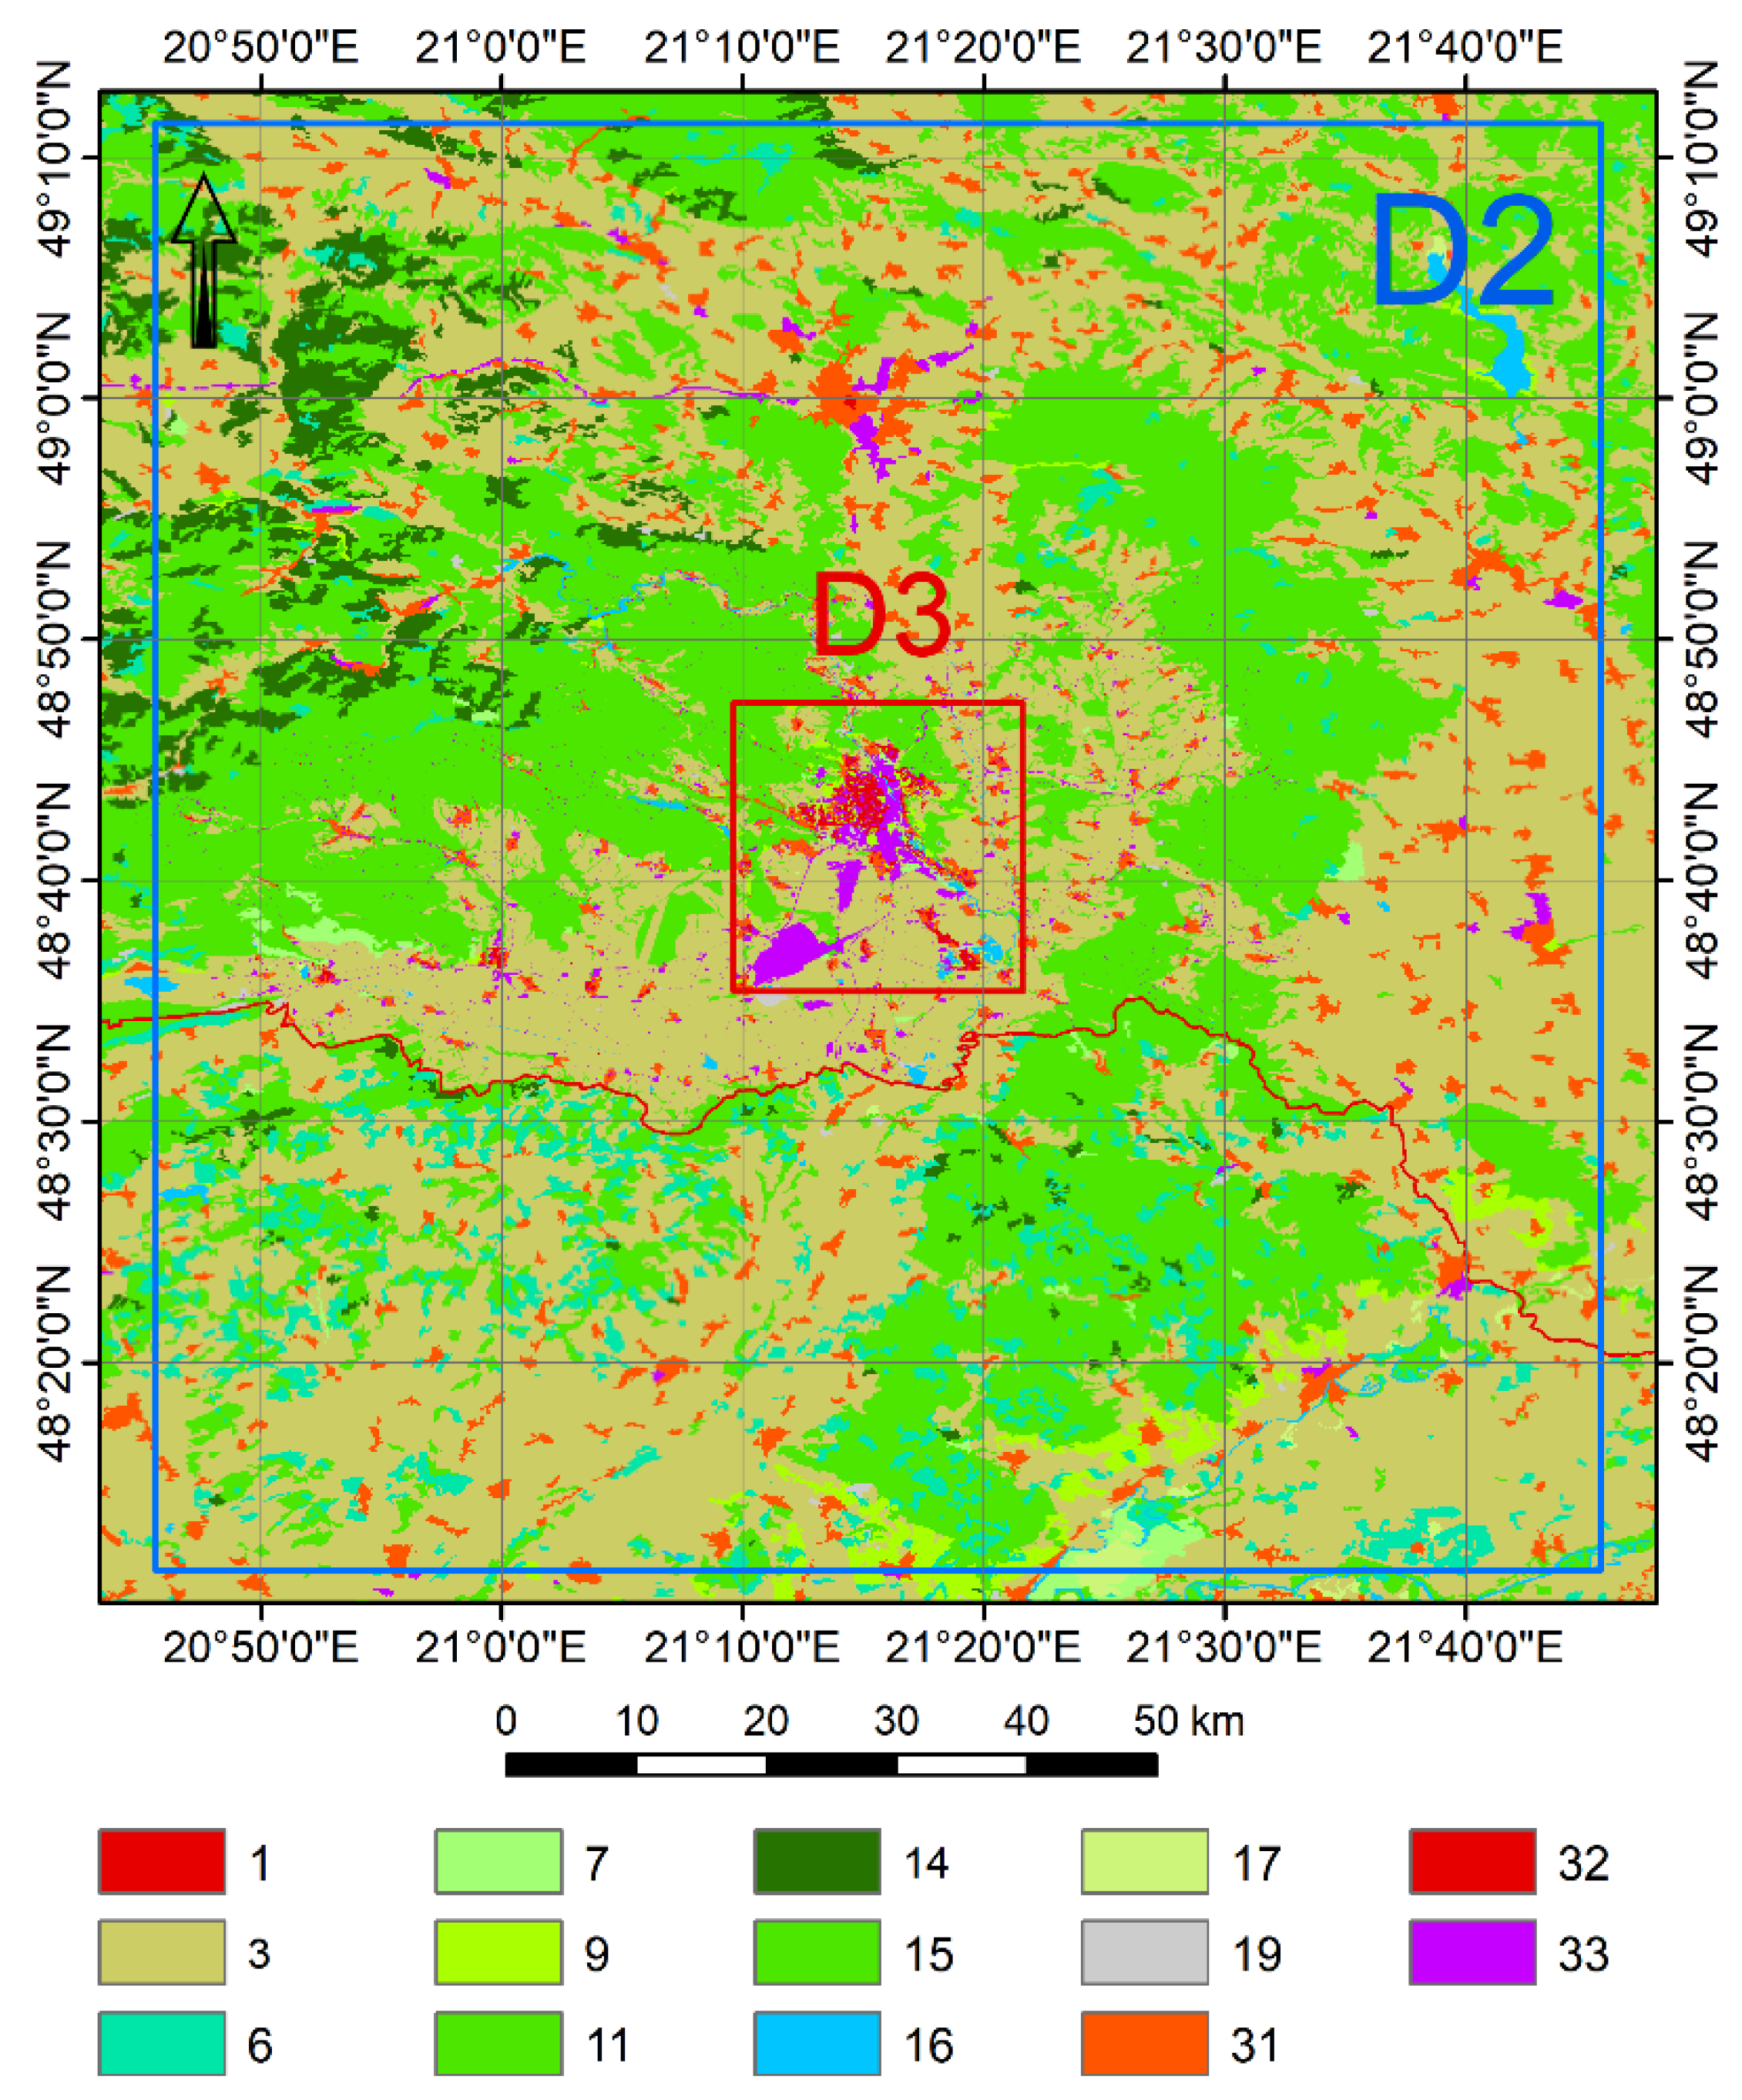
For high-resolution simulations, the preparation of new, more detailed geographic data is necessary, as the original global datasets do not provide sufficient spatial resolutions for simulations with a grid smaller than 500 m [36]. New elevation and land cover data were prepared as a model input for all simulations and domains except the largest parent domain. For elevation data, the new Japanese Aerospace Agency (JAXA) digital elevation model was used and resampled to 100 m resolution. The land cover data were derived from two datasets, the CORINE Land Cover (CLC) 2018 [59], covering a wider area of the second domain, and Urban Atlas 2018 (UA) [60], providing a detailed urban map for the Košice region in the nest domain. The data were reclassified according to extended United States Geological Survey (USGS) land cover classes containing more detailed classification of urban and built-up areas. This expanded classification contains, in total, 27 land cover classes, of which 3 are additional classes for urban and built-up areas based on the built-up area ratio and usage. The new urban classes were defined as class 31 for low intensity residential zone with 30–80% built-up area, 32 for high intensity residential zone with >80% built-up area and 33 for commercial, industrial and transport areas. The other land cover classes were reclassified to the most similar classes [61], as shown in Table A1 for Urban Atlas and Table A2 for CORINE Land Cover. The reclassified data from both sources were consequently merged into one high-resolution dataset containing the Urban Atlas data for the third domain and CORINE Land Cover for the second domain (Figure 3).

2.4. Evaluation of Data

For evaluation of the model accuracy, a set of statistical accuracy indicators was used, including mean bias error (MBE) in Equation (1), average absolute error (MAE) in Equation (2) and root mean square error (RMSE) in Equation (3) for evaluating model performance under all four scenarios [62,63]. The model output was compared in hourly steps with the SYNOP data from the Košice airport. The airport is located close to the southern part of the city on flat terrain with identical model elevation and thus no lapse rate correction was necessary for proper comparison of observations with the model output.
MBE = i = 1 N ( f i o i ) N
MAE = i = 1 N | ( f i o i ) | N
RMSE = i = 1 N ( f i o i ) 2 N
In these formulas, f i is a forecasted value of temperature at 2 m above the ground or wind speed at 10 m above the ground level and o i corresponds to data measured at the Košice airport.
UHI intensity (UHII) is defined as the temperature difference between the urban and surrounding rural area [64]. The urban and surrounding rural areas often have different characters, and several methods exist in estimating the UHII considering the study area morphology, surface observation data availability and weather conditions [65]. Košice has the fragmented character of built-up and especially industrial areas, making it more difficult to use some methods, e.g., rural ring reference which would likely include multiple built-up areas unevenly scattered on the outskirts of the city. The urban region was thus defined as all built-up areas within the nest model domain and the rural region as other areas with the exclusion of water bodies. For the spatial interpretation of UHII, a difference between daily mean temperature over the whole domain and daily mean temperature of all values in the rural region was calculated for all four scenarios, as shown in Equation (4). The overall UHII was calculated by subtracting the difference between mean values in urban and rural regions, as shown in Equation (5) [65]. Equation (5) was also used to calculate the time series of UHII for each scenario with a timestep of 10 min, in which the data were written in the model output for the third domain to give a more detailed view on the UHII development during the day.
UHII ¯ ( t ) = T t   T rural ( t )
UHII ( t ) = T urban t   T rural ( t )
In these formulas, T is a temperature at 2 m above the ground over the whole domain, T urban is a temperature at 2 m above the ground over the built-up region and T rural is a temperature at 2 m above the ground over the rural region.
Given the large elevation differences in the third model domain and for evaluating the spatial aspect of UHII, a simple lapse rate correction was made [66]. Considering the stable vertical temperature gradients in lower levels during the day (Figure 2), a dry adiabatic lapse rate correction was used with a vertical temperature gradient of 9.8 °C/km. The choice of dry adiabatic lapse rate correction was carefully considered and selected to be the preferred method given the area topography and available data. During the day, the vertical profiles follow the dry adiabatic lapse rate in all scenarios, but with nighttime surface inversion, development the temperature distribution may be different. Especially, the greatest differences may be recorded over the highest parts of the model domain, but with only small and localized differences in temperature, as the correction is targeted on 2 m temperature, not temperature of the open atmosphere, which is primarily influenced by radiative cooling over most parts of the model domain. The corrected values were calculated for the average elevation of the model domain with 259.67 m above sea level as shown in Equation (6):
T corrected = T + ( T dry   ×   h )
where T corrected is a corrected temperature, T is a model temperature, T dry is a dry adiabatic lapse rate and h is a difference in elevation between average model domain elevation and elevation at a given point.

3. Results

3.1. Evaluation of Model Accuracy

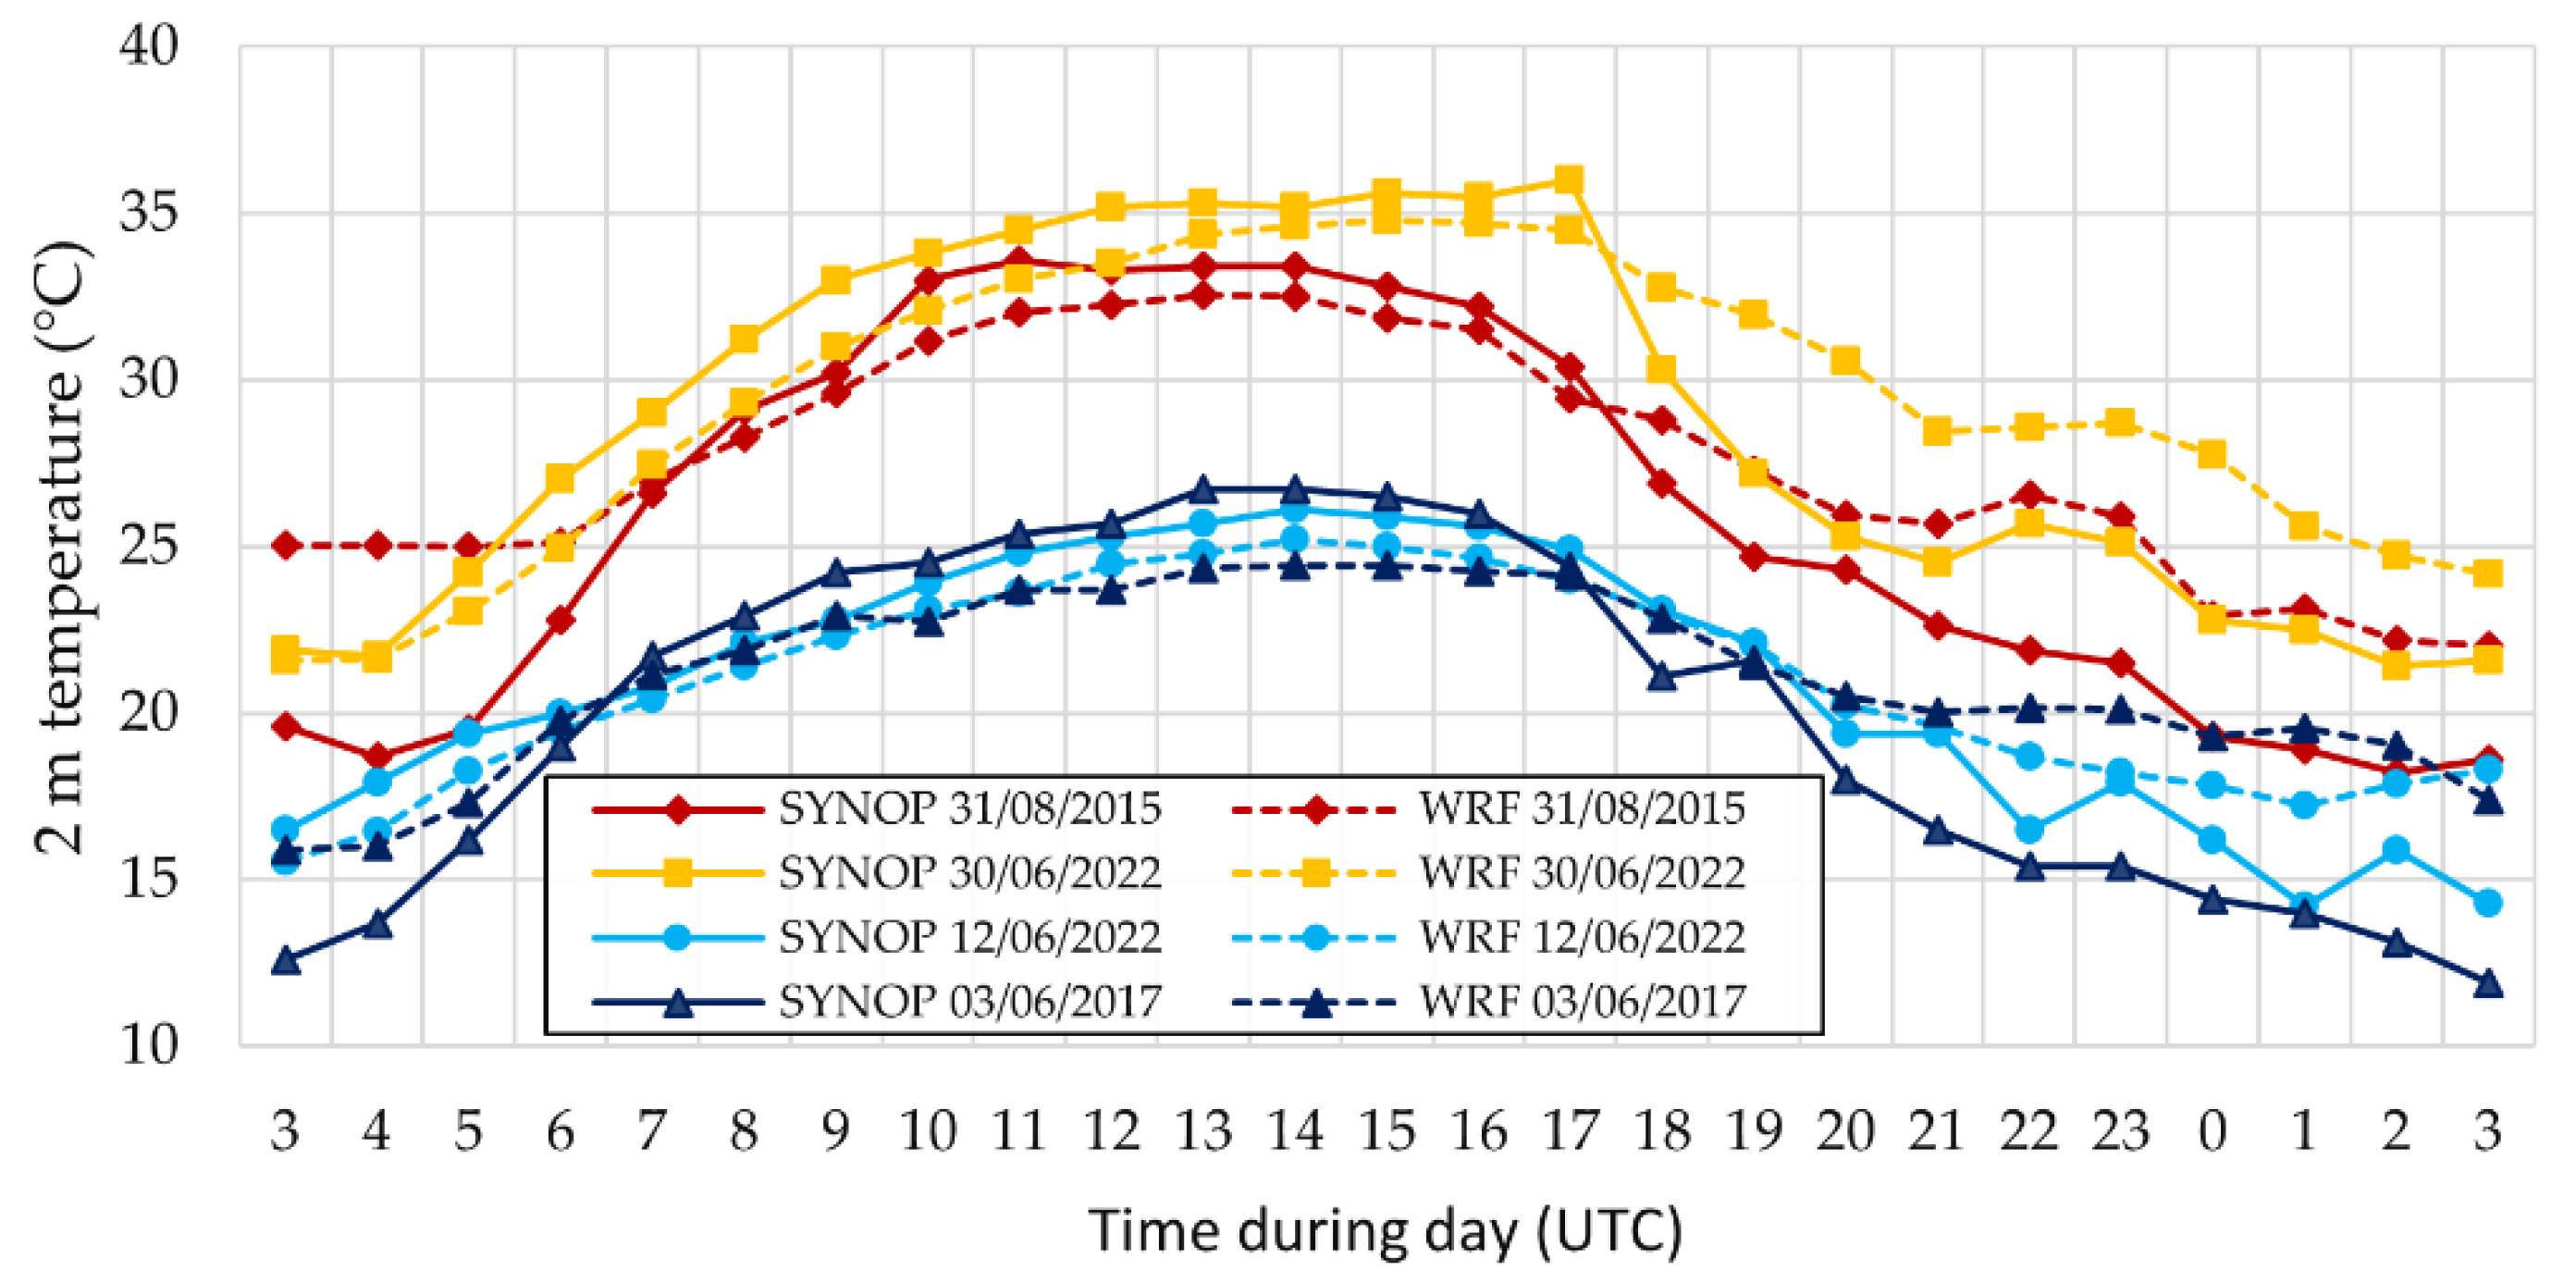
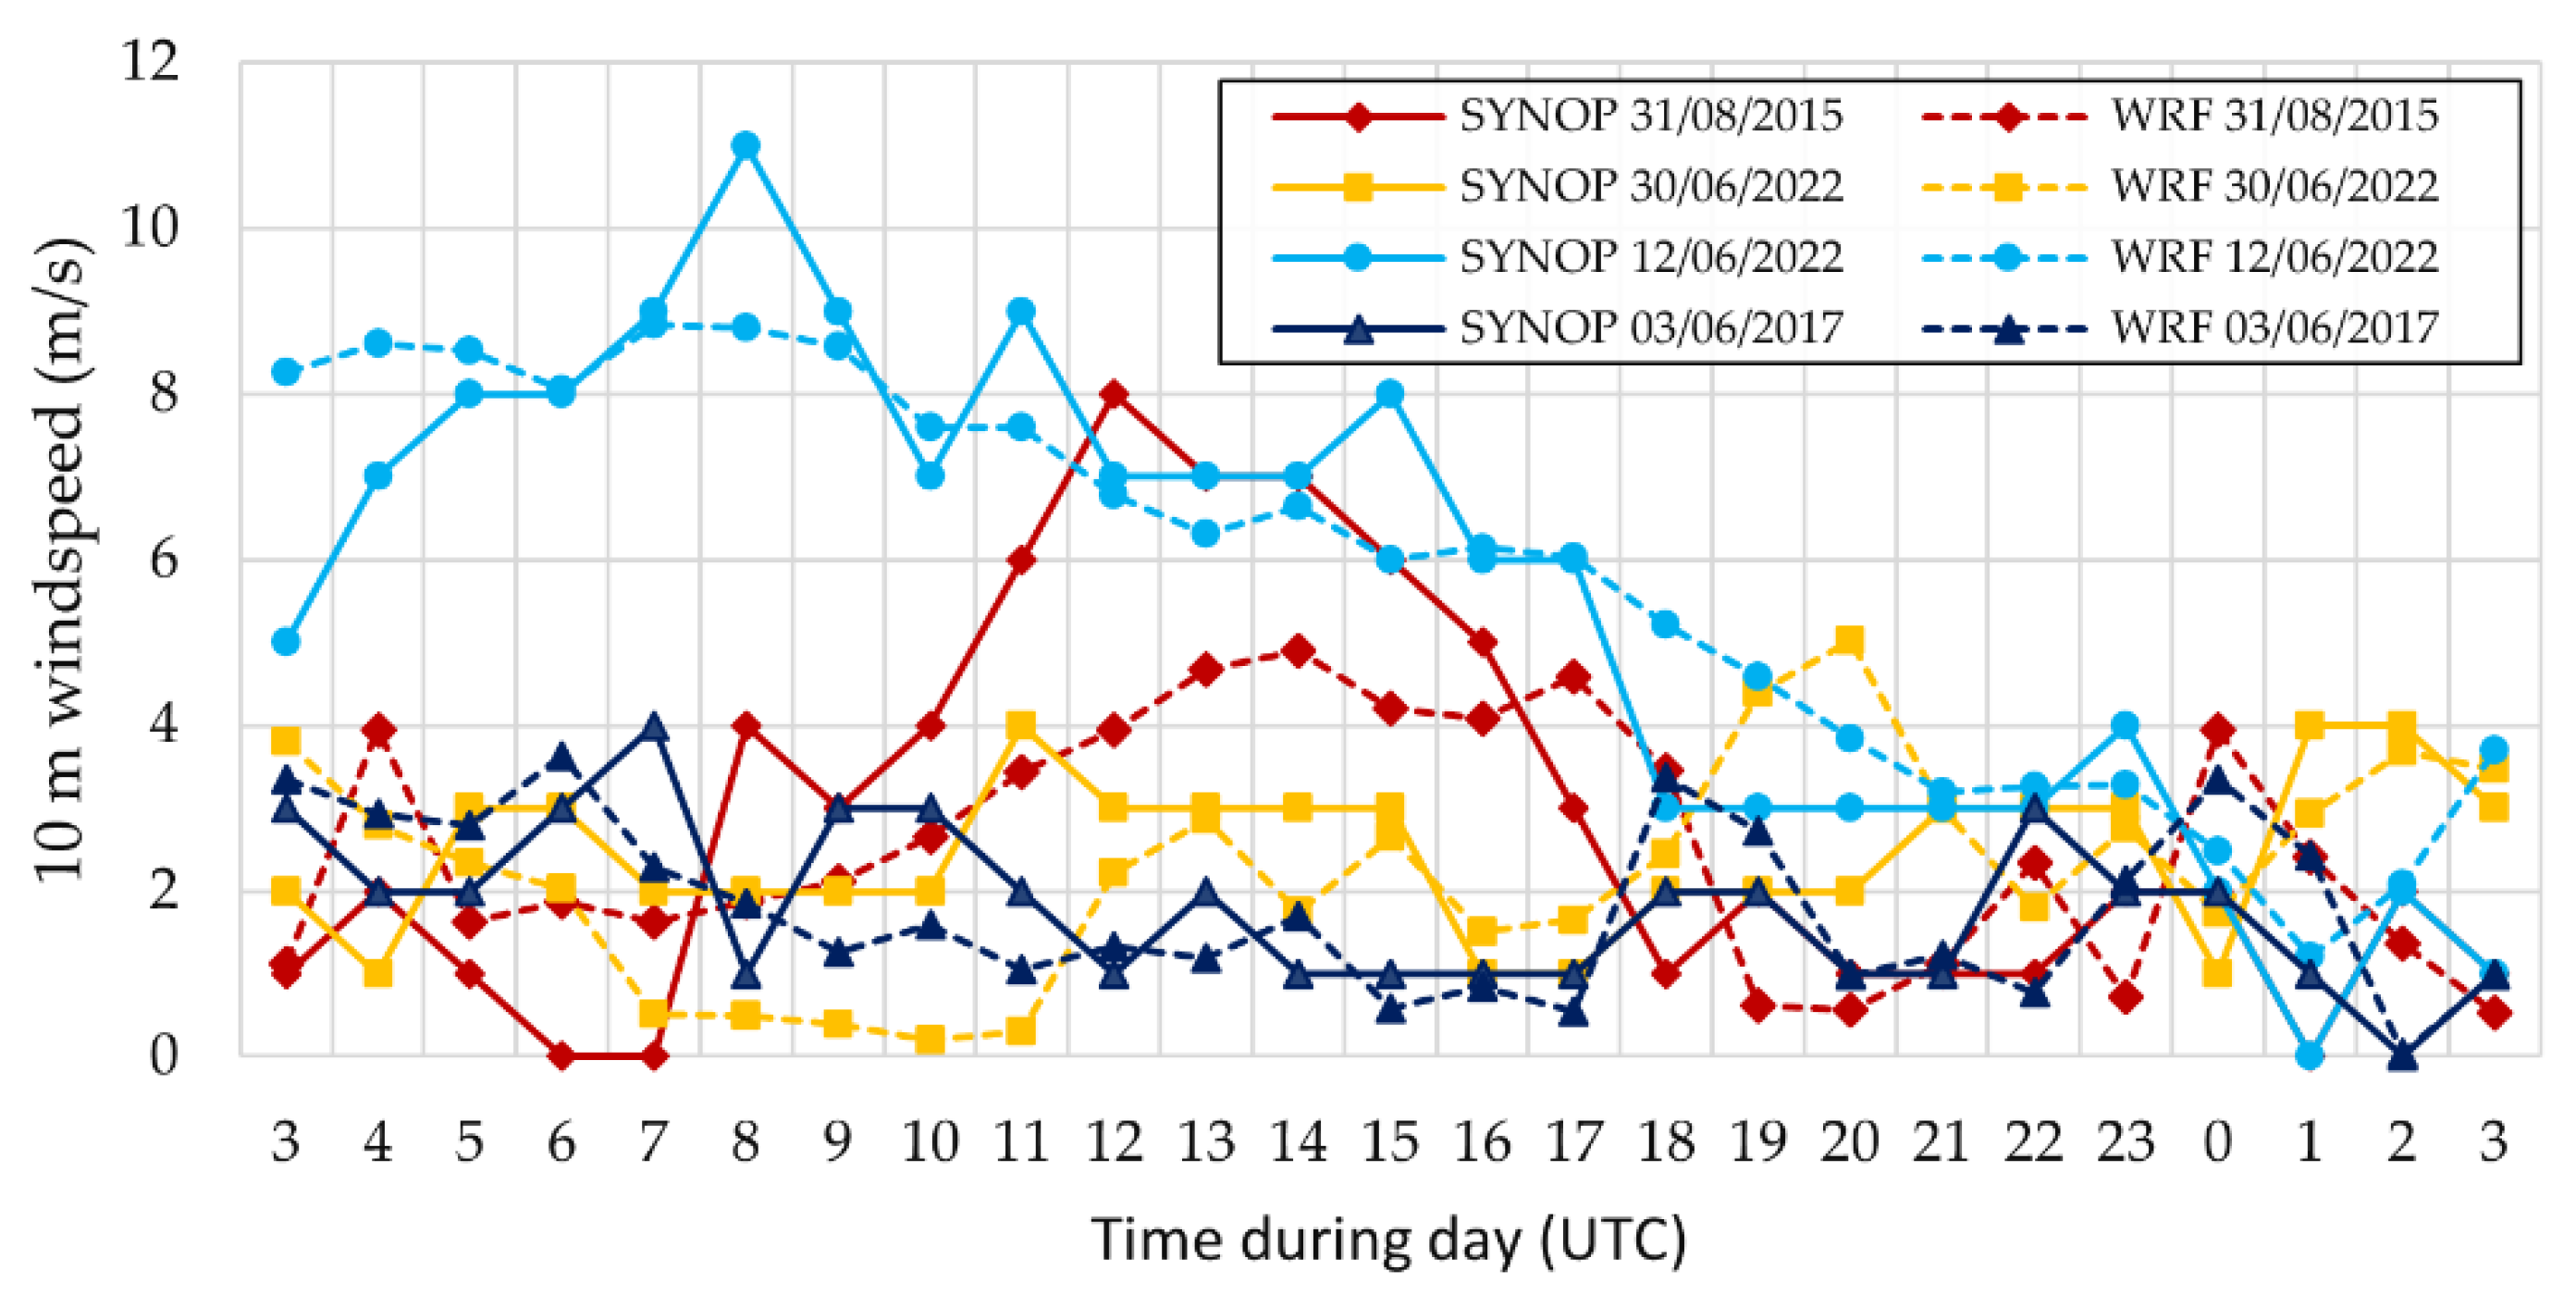
The comparisons of the predicted and observed values of temperature and wind speed are shown in Figure 4 and Figure 5, respectively. The prediction of 2 m temperature shows a slight underestimation of temperature during the daylight in comparison with the surface observations, though the difference leading to an overestimation is more significant after the sunset with radiative cooling taking place. This difference is caused by the definition of the land cover class representing the airport area, which is defined as built-up area, though large part of it including the observation site is covered by grass. The wind speed was relatively stable with only minor differences between the observed and predicted values, given the character of the observation site in open and low terrain. The largest differences were recorded during the warm dynamic scenario of 31 June 2015, with an average underestimation of wind speed of 3 m/s during the afternoon and overestimation during the night, which also consequently led to a higher temperature. The statistical evaluation of 2 m temperature and 10 m wind speed is shown in Table 3. Overall, the best model performance was observed during the cold dynamic situation of 12 June 2022 with the highest wind speed and strongest temperature mixing of all four scenarios. The temperature at 2 m above the ground scored MAE = 1.094 and RMSE = 1.411. The 10 m wind speed MBE was relatively large, but only because of the highest wind speed values in all four scenarios. The model performance was poorest during the warm dynamic scenario of 31 August 2015 with the greatest error score in both wind speed and temperature. Non-dynamic situations scored a relatively high error in 2 m temperature, which is primarily associated with generalized land cover representation over the observation site.

3.2. Urban Heat Island Intensity

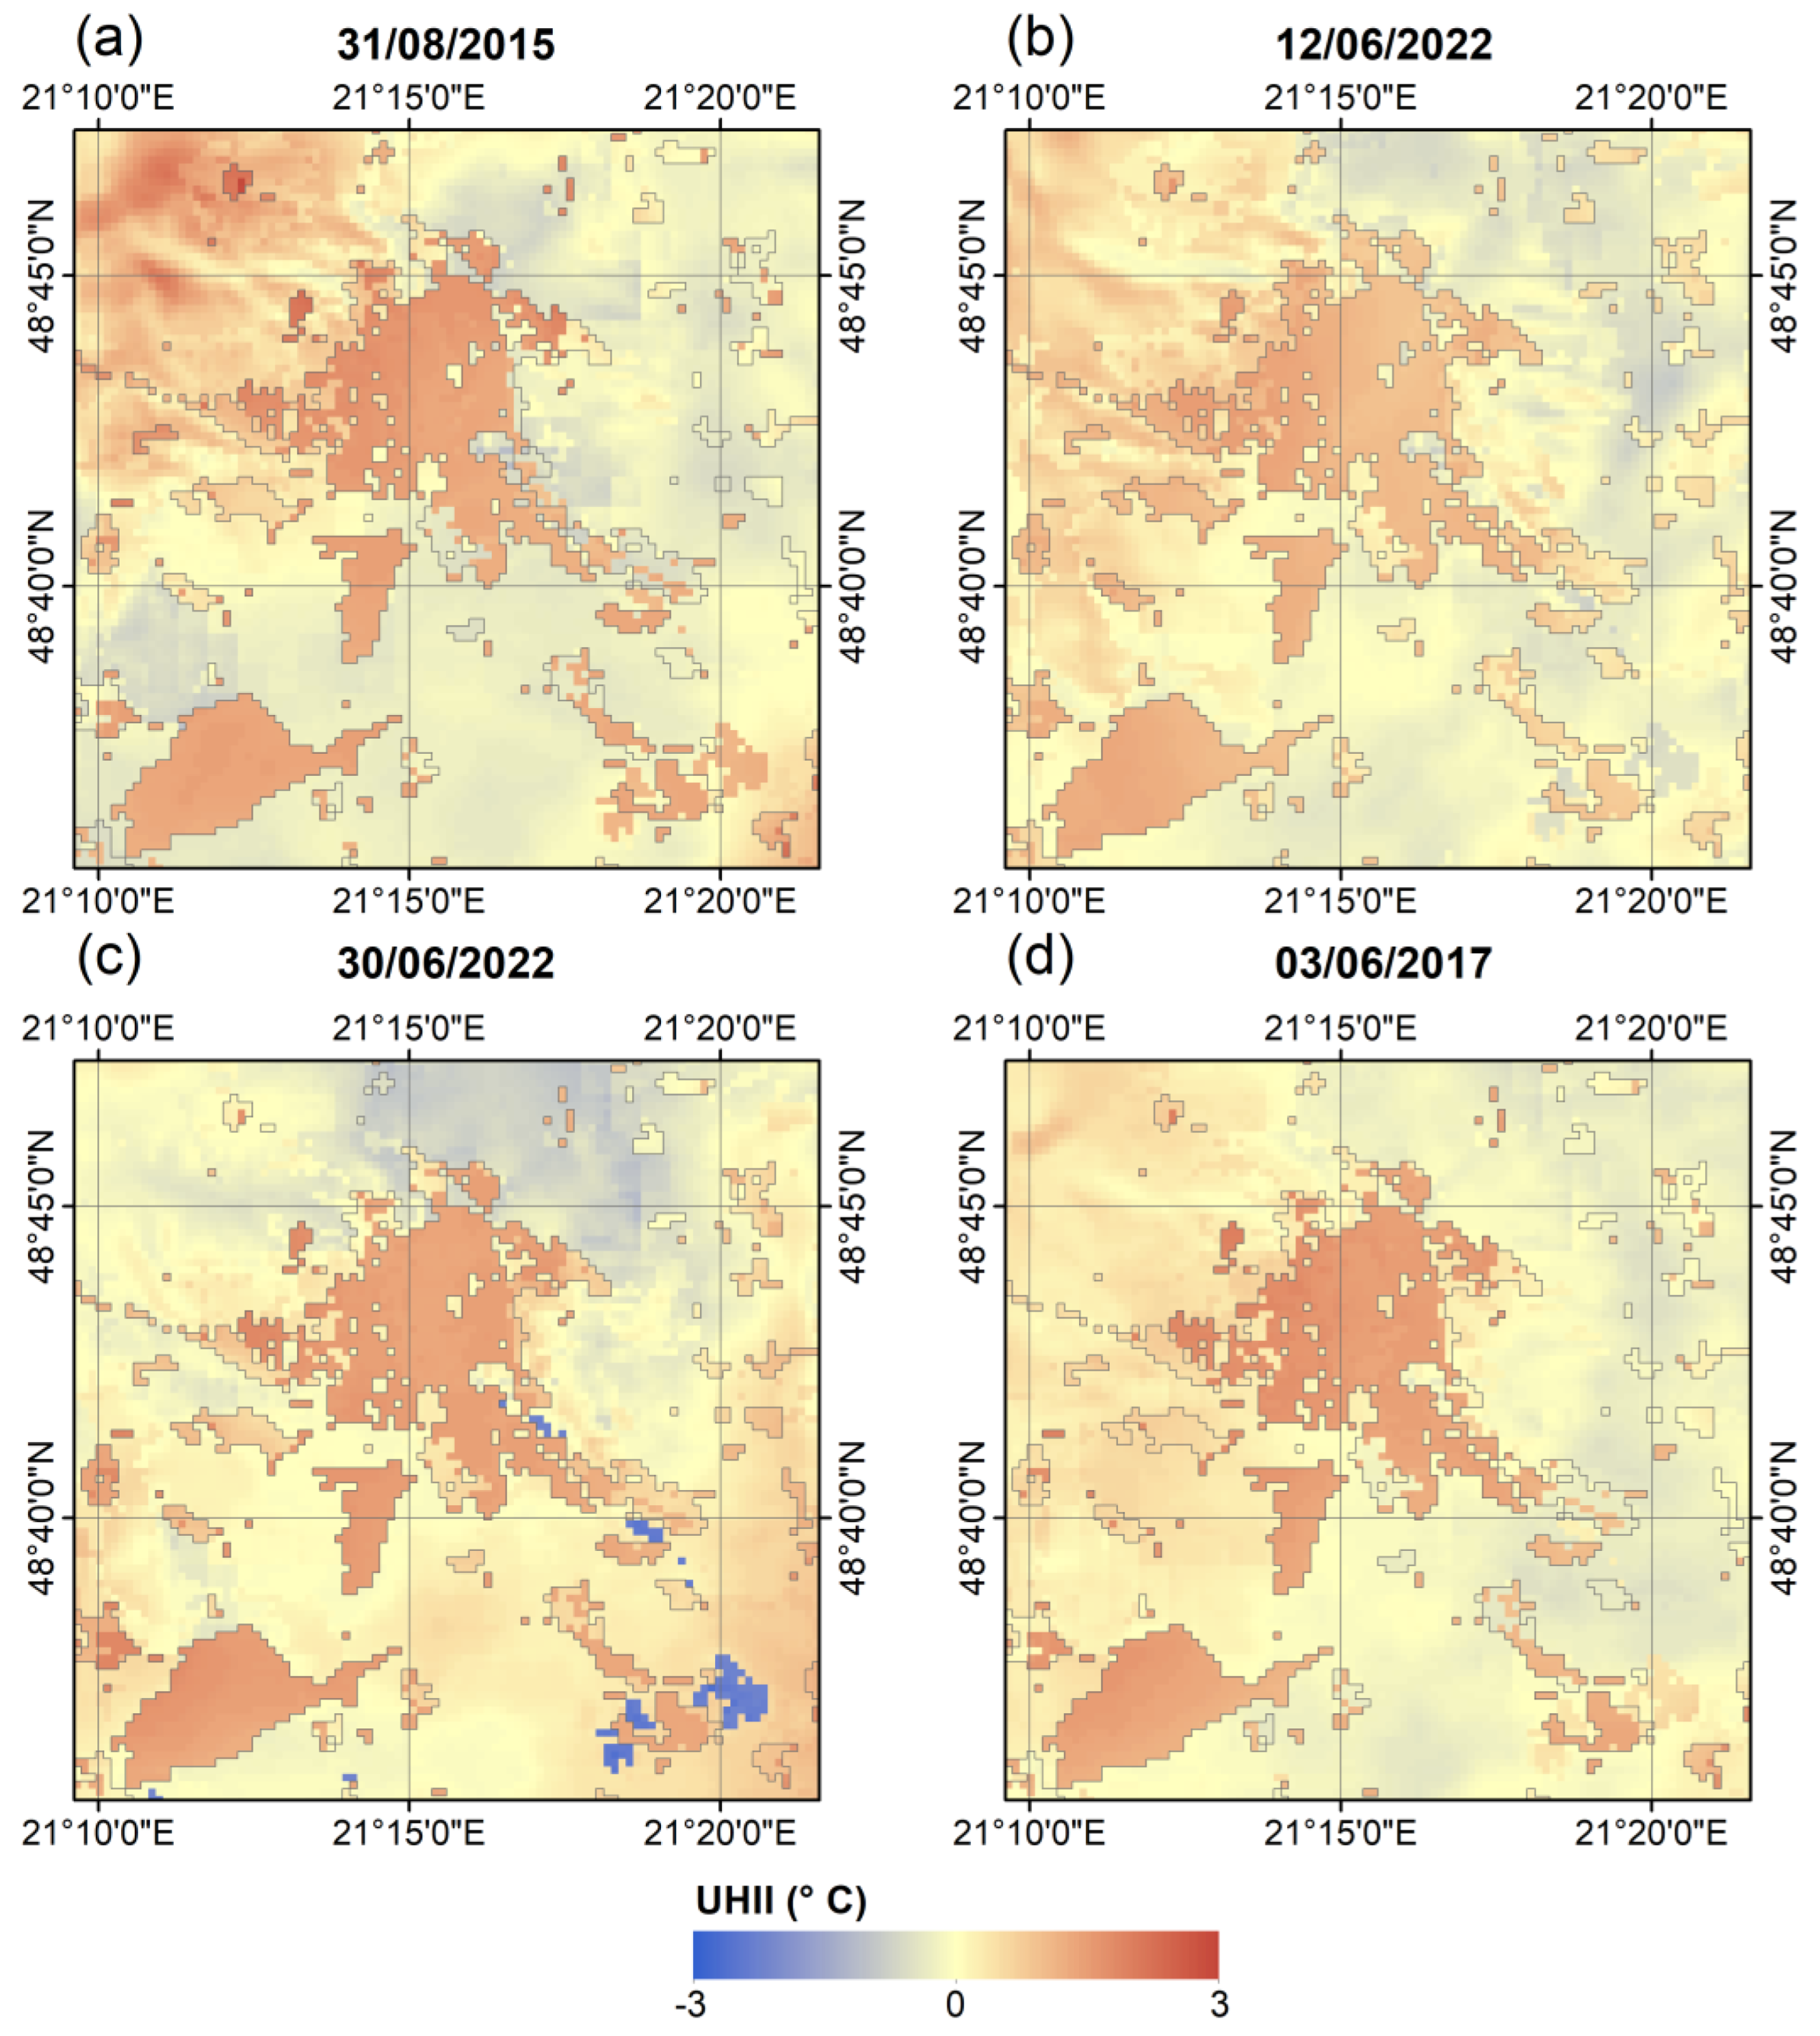
The results of the model run output are shown in Figure 6, combining the daily average temperature and wind speed vectors. All model scenarios show clearly a well-defined UHI within the marked urban region, yet with different character of its intensity (Figure 7). Figure 8 shows the ⟨UHII⟩ distributed during the day over the urban region represented in a boxplot for better description of the intensity values. The boxplot shows ⟨UHII⟩ amplitude, mean and median values calculated from the corrected 2 m temperature from the model output saved in a 10-min timestep.
The warm dynamic scenario of 31 August 2015 in Figure 6 represents conditions with an average daily temperature over the third domain of 27.7 °C and predominant wind from the south with a daily average wind speed of 2.6 m/s. The UHI is more diffuse due to advecting air, especially in the eastern parts of the city and in the smaller or less dense built-up areas. The ⟨UHII⟩ ranges from 2.5 °C to −0.5 °C with an average value of 1.05 °C. The warm dynamic situation with relatively strong and warm south to south-west flow in lower levels is causing uneven vertical temperature profiles over the high terrain located over the north-western part of the domain. The temperatures after the lapse rate correction are thus, in this scenario, slightly higher over the high terrain than over the other rural areas. In the warm non-dynamic situation during the typical heat-wave event of 30 June 2022, in which the daily average temperature reached 29.6 °C and daily average wind speed 2.4 m/s, the UHI is much more defined and is clearly visible even over less densely built-up areas. In this scenario, the ⟨UHII⟩ reaches the overall maximum intensity of 4.2 °C with a minimum value of −0.5 °C and average of 1.18 °C. The cold dynamic situation of 12 June 2022 shows a much more diffuse UHI than the warm dynamic situation, primarily because of significantly stronger wind, reaching a daily average wind speed of 5.8 m/s. The daily average temperature during that day was only 21 °C, yet ⟨UHII⟩ reached a maximum of 2.9 °C and minimum of −0.3 °C. The daily average ⟨UHII⟩ was, however, the lowest among all four scenarios, with a value of only 0.96 °C. The UHII ¯ is uneven across the urban area and values in the eastern part of the city are slightly lower in comparison to the western part. The western part is located leeward in this situation which is also projected in lower wind speed, while the eastern part is in open space with higher wind speed and with stronger mixing and advection taking place. The last scenario reflects the cold non-dynamic situation of 3 June 2017. This situation is represented with a very low wind speed, with a daily average of only 1.7 m/s and average temperature of 21.2 °C. It is also characterized by low air humidity, which is prone to faster temperature changes caused by the radiative processes. In this scenario, the ⟨UHII⟩ reached a quite large amplitude with a maximum of 3.3 °C and lowest minimum of the intensity of −1.3 °C, while the average ⟨UHII⟩ was 1.05 °C. The high amplitude and low, negative ⟨UHII⟩ can be interpreted as an effect of low humidity causing the rural area with lower heat capacity to react faster than urban areas to radiative heating and cooling, which also supports the time series in Figure 9. For the same reason, low density built-up areas are, in this scenario, on average, indistinctly depicted in comparison with dense built-up urban and industrial areas.

3.3. Development of UHII in Time

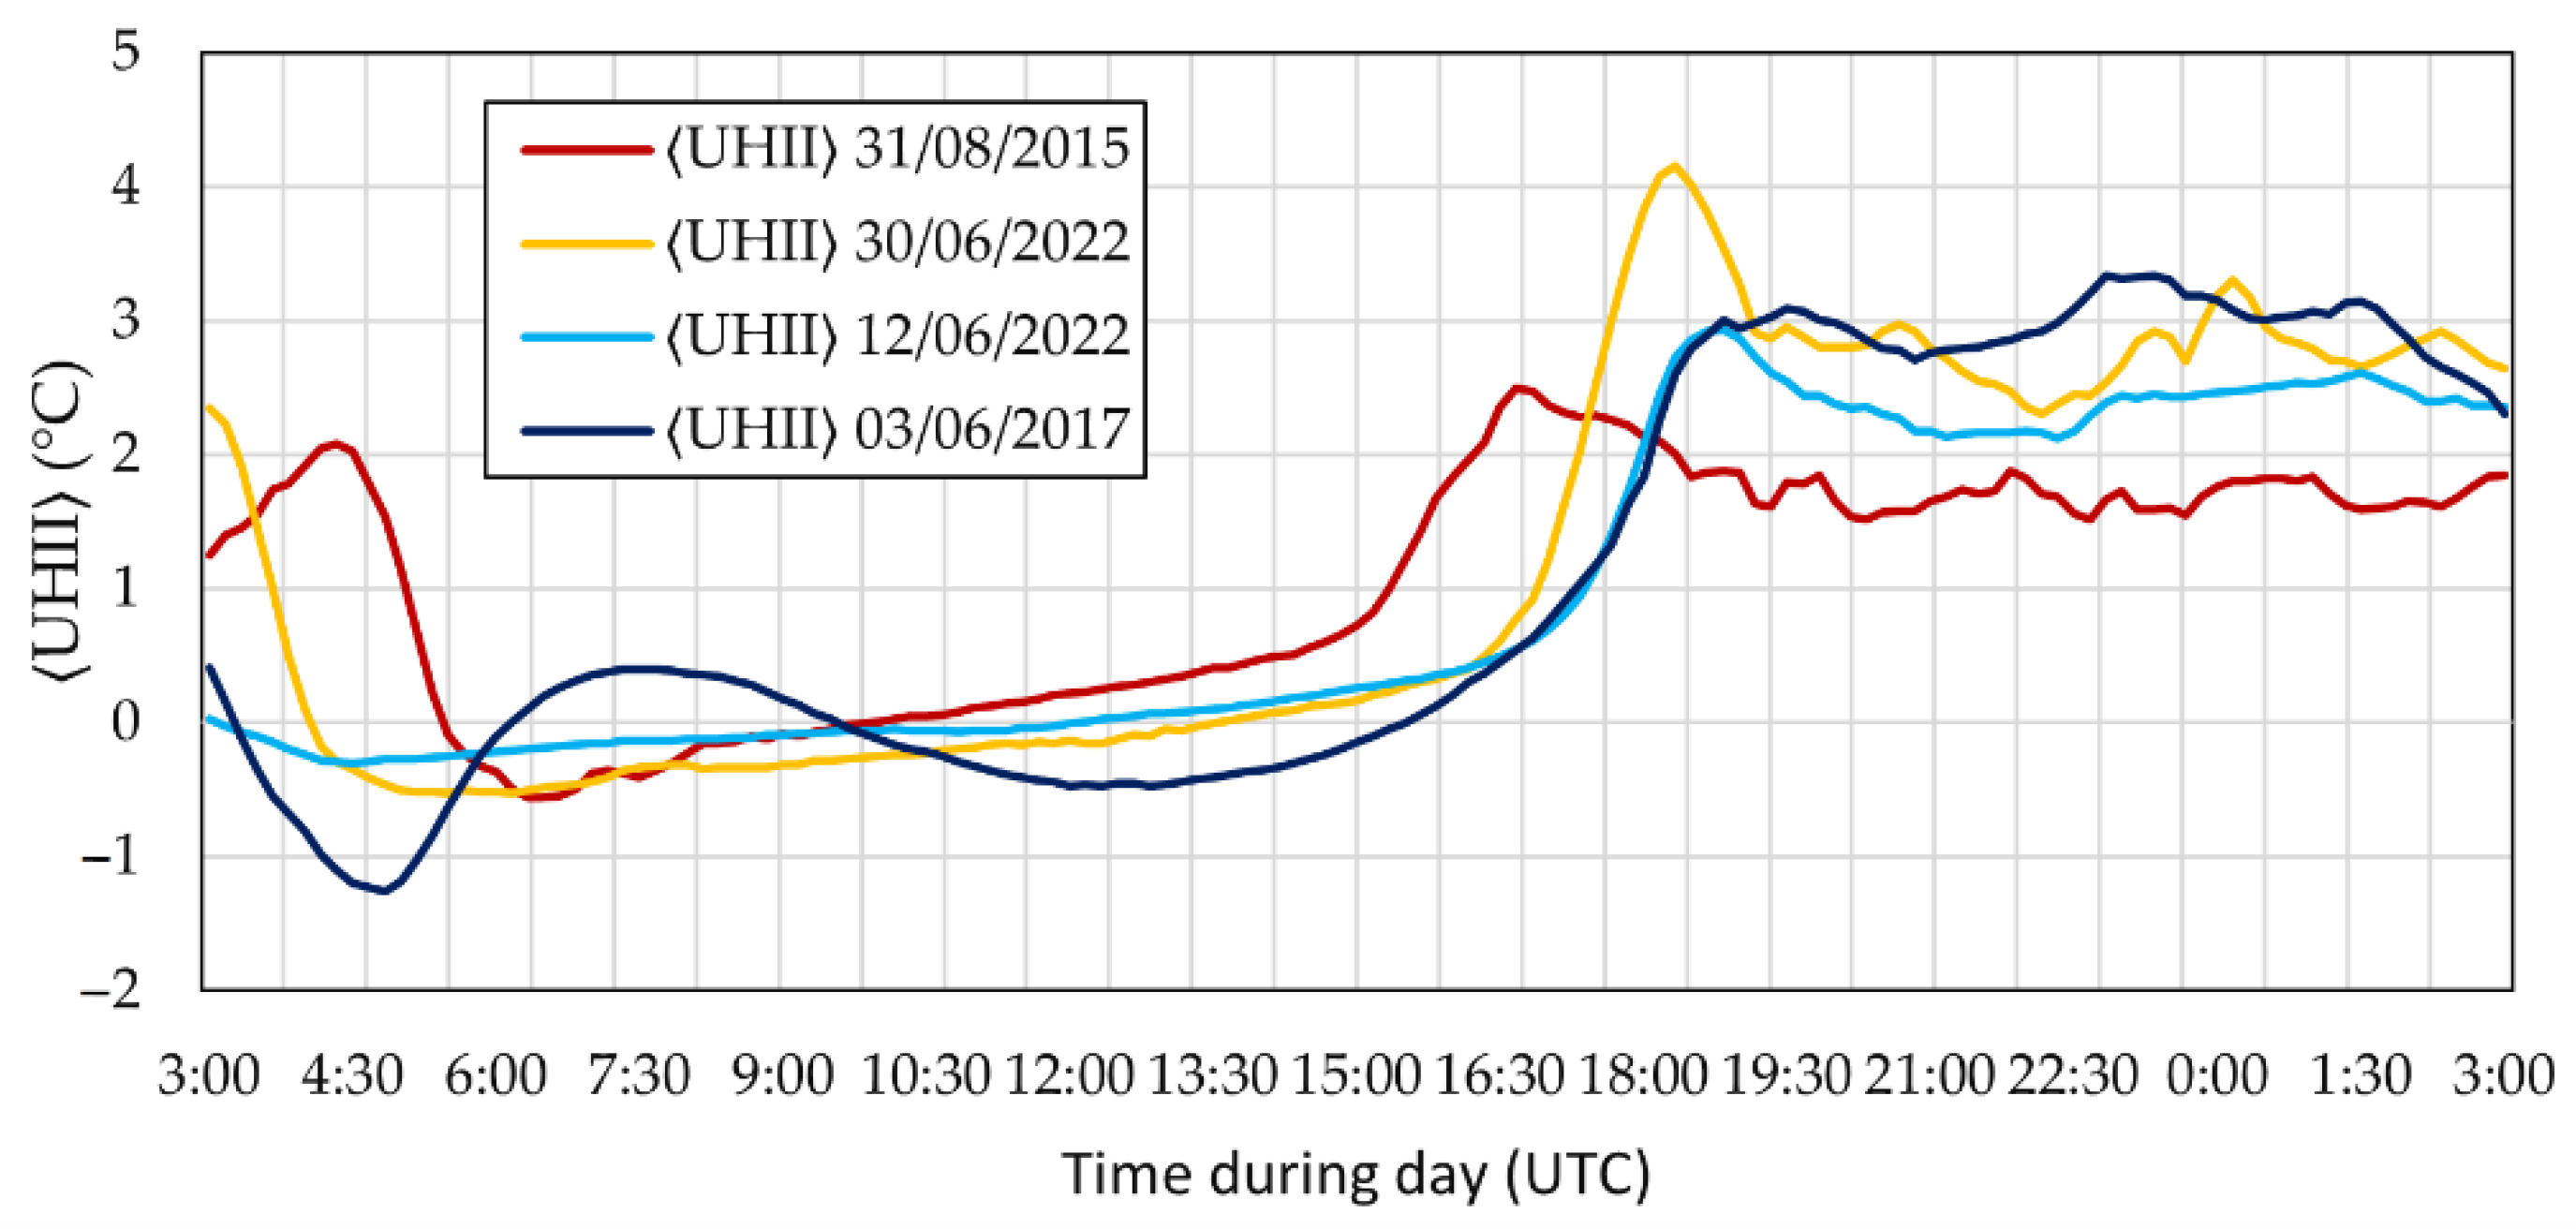
Figure 9 represents a diurnal cycle of the corrected ⟨UHII⟩ over an urban region in a 10 min timestep. Overall, the typical course of the UHI during the radiative type of weather [67] can be seen with low, and even negative, intensity during the morning when radiative heating is taking place. In the afternoon, with decreasing intensity of the heating, the rural region starts to cool down quickly, while in the urban region, the heat remains trapped and UHII ¯ is most prominent. However, there are several differences visible in dynamics of the UHI among all four model scenarios.
For the situation of 31 August 2015, a shorter duration of day can be seen, which is also projected in the longer duration of ⟨UHII⟩ during the night in comparison with the other situations in June. At first, high ⟨UHII⟩ can be seen during the morning, which was associated with low wind speed and quicker radiative cooling of the rural area. Shortly after the sunrise, the rural region starts to heat up more quickly, and for a short period of time, the ⟨UHII⟩ became negative, however, during the day, lower albedo and high heat capacity of built-up areas accumulate more heat than rural areas, and ⟨UHII⟩ gradually builds up and eventually spikes up just before sunset. However, in this scenario, a vertical mixing and advection between the urban and rural region is taking place and the temperature is more evenly distributed, which can be seen as the highest ⟨UHII⟩ during the radiative heating and with the lowest ⟨UHII⟩ peak after sunset. The situation of 30 June 2022 follows a similar pattern at the beginning of the day and even shortly after the sunrise follows the same values of ⟨UHII⟩ as the warm dynamic scenario, since during the morning in both scenarios, little to no wind was present, yet during the afternoon, ⟨UHII⟩ remains low, mostly around zero, as only weak mixing and advection are taking place. During sunset, the rural region starts to cool down quickly and ⟨UHII⟩ sharply peaks up above 4 °C and remains high in the 3 °C range even during the night. Overall, the situation with warm non-dynamic conditions led to the highest ⟨UHII⟩ of all four scenarios. However, the ⟨UHII⟩ of the cold scenarios was also prominent and, in specific situations, higher than the situation of 30 June 2022. The cold dynamic situation of 12 June 2022 had typically more diffuse characteristics of UHI, with a strong mixing and heat exchange ongoing between the urban and rural areas. The temperature is also more evenly distributed in time, though the ⟨UHII⟩ peak can be seen during sunset, as in other scenarios, yet a bit weaker, reaching a maximum of 2.9 °C. After sunset, with still significant wind ongoing, the ⟨UHII⟩ starts to decrease and reach close to 2 °C. Shortly before midnight, the wind dropped down to near zero speed, the mixing and advection weakened and the rural area started to radiatively cool faster than urban area, causing the ⟨UHII⟩ to increase in the 2.5 °C range. In contrast, the cold non-dynamic scenario is much more prone to radiatively induced heat change, especially because of the driest air and weakest wind speed of all four scenarios. After sunrise, the rural area heated up quickly, causing the negative spike in ⟨UHII⟩, reaching −1.3 °C. Later in the morning, however, a brief wind speed increase caused the air to mix and temporarily increased the ⟨UHII⟩ to positive values. After the morning, the wind speed remained very low with near-zero values and the difference between urban and quickly heating rural area became clearly visible, with ⟨UHII⟩ dropping during the radiative heating to the lowest values of all four scenarios. During sunset, the ⟨UHII⟩ spiked up and followed a similar pattern as in cold dynamic scenario of 12 June 2022. The peak of the UHII, however, reached greater values and was relatively constant in the 3 °C range during the whole night, even briefly overcoming the intensity of the warm non-dynamic situation of the 30 June 2022 heatwave.

4. Discussion

In this paper, the WRF model was used to run high-resolution real case simulations with nested domains over Košice city under different atmospheric conditions. Four scenarios with different conditions, representing warm and cold conditions with high and low wind speed, were compared over the course of a 24-h period with emphasis on urban heat island intensity. The results of the study show a comparable diurnal cycle of the UHI during the heatwave, as found by Nicholson [43] and Kong et al. [38], with an urban cool island (UCI) forming during the daytime radiative heating, strong nocturnal UHI and a mitigating effect of wind speed on UHII. The spatial distribution of the UHI also shows as similar pattern as that investigated by Li et al. [68] and Jin et al. [69] over Berlin with high intensity built-up areas being prone to heating, while the low density built-up and rural residential areas scored an overall lower UHII. However, clear differences in UHI spatiotemporal characteristics and intensity can be seen when comparing various atmospheric conditions. Heatwaves apparently amplify UHII, although the effect is only short lasting, with a sharp peak in UHII during sunset, and with comparable or even lower values during the night, as in colder and dryer scenarios. The highest peak in intensity may be linked to an overall greater heat deposition in the built-up area during the day than in other scenarios. The UHII during the situations with colder and especially dryer air with a typical radiative type of weather is greater during the night, which is caused primarily by faster radiative cooling over the rural area caused by dryer air and, at the same time, high heat capacity and heat retention of built-up areas [70]. Vertical temperature and wind profile also play a significant role in heat exchange and influence the PBL height and overall characteristics of the UHI, as found by Seaman et al. [71]. In warm scenarios, the temperature change caused by vertical mixing of the near-surface level with lower levels is smaller, while in scenarios with cold lower levels it is greater. Here, the wind speed is the main factor in defining the magnitude of mixing. Wind speed also significantly affects the 2 m temperature by advection between urban and rural areas, lowering the UHII, which also confirms Li et al. [68] and Basset et al. [72]. This proves that, along with wind speed, overall UHII is also significantly influenced by available air humidity and temperature exchange between near-surface air temperature and lower levels of the troposphere.
Considering the results, theoretically, the weather conditions with clear sky, weak wind and dry warm air in lower levels (e.g., within the subsidence region of high-pressure areas) have the greatest potential for strong UHI formation. However, it still needs to be noted that the results point out UHI dynamics and their intensity in relation to the rural area, not the magnitude of heat stress in urban areas. From such a point of view, potentially the strongest heat events may occur during the heatwaves with high air humidity, which is also confirmed by Basara et al. [73], with considerably longer duration of high humidex values in urban area in comparison to rural surroundings. The conditions with humid air which cause a greenhouse effect and reemission of long-wave radiation slows down the radiative cooling during the night and retains more heat over both rural and urban areas [74], which may, in contrast, lead to lower UHII, but still more significant amplification of heat stress in urban areas. High air humidity may also reduce the evaporative cooling which could potentially reduce the mitigating effects of urban greenery as proposed by Zhang et al. [75]. Future research focused on the comparison of heatwave events with an emphasis on air humidity effects on UHII and overall heat stress in urban areas is desirable. Additionally, higher overall model resolution with a better urban area representation and more detailed parameterization of the urban environment combined with multilayer urban models involving the effects of anthropogenic heat and evapotranspiration would lead to more detailed results. The use of multilayer BEP/BEM containing the parameterization of anthropogenic heat would be appropriate in future research for more accurate results, as presented by Ribeiro et al. [76] and Sharma et al. [77]. Adjustment of drag coefficient also has a considerable influence on wind speed and temperature in urban areas, especially during dynamic conditions, as Hendricks and Knievel [78] have investigated in a situation with a strong cold front passage. Other methods of UHII evaluation and definition of urban/rural areas are also considered for future work, such as the virtual rural reference proposed by Vogel and Afshari [65], which would give more appropriate results in case of evaluating the UHI in cities surrounded by rural areas with a high elevation range and a fragmented built-up landcover.

5. Conclusions

We have presented, in this paper, a series of numerical weather experiments using a WRF-UCM model focused on an urban heat island under various atmospheric conditions over Košice city in Eastern Slovakia. The case study scenarios were selected for a 24-h period, with emphasis on synoptic situation, airmass characteristics and windspeed. Overall, four clear-sky scenarios were identified with different airmass temperatures, humidity and windspeed, significantly influencing the characteristics of the urban heat island. The scenarios consisted of a warm non-dynamic situation during a typical heatwave, a warm dynamic situation in the warm sector close to the advancing cold front, a cold non-dynamic situation within the cold high pressure and a cold dynamic situation with strong cold advection ongoing behind the cold front. The model parameterization was set to use an urban canopy model together with updated elevation and landcover data. The model runs were carried out with good accuracy and scored a relatively small error with respect to the measured values. However, the most significant factor influencing the model accuracy was the land cover data. The anthropogenic land cover classes from the Urban Atlas were, in most cases, delimitated according to the functionality of the area, not the physical characteristics of the surface. The largest differences can be seen over Košice airport, which is defined as a built-up area, although large parts of the airport are actually covered by grass, including the observation site, which was the main cause of the higher temperature in model runs during the night in all scenarios.
The urban heat island was evaluated using the urban heat island intensity calculated from the 2 m temperature for the interpretation of spatial distribution and time development. The results show the amplifying effects of heatwaves and higher humidity on the urban heat island. High windspeed, however, reduced the urban heat island intensity by vertical mixing and advection from rural areas in both warm and cold scenarios. This also proved the spatial interpretation of the urban heat island in Figure 7b, where the intensity of the urban heat island is stronger in the parts of the city located leeward, with weaker modelled windspeed. Dry and cold air is causing high temperature amplitudes during radiative weather which is projected in high urban heat island intensity during the evening, but also in the well-defined urban cool island during the afternoon when the rural region is heating faster than the urban area.
Suggested future research should include use of higher resolution model simulations with better representation of land cover classes. The use of microscale urban models paired with mesoscale numerical weather prediction models for the inclusion of weather conditions from a wider area is also advised. Future research should focus further on the effects of humidity and its potentially limiting factors on mitigating the effects of urban greenery, as well as the quantification of overall heat stress on populations in urban areas.

Author Contributions

Conceptualization, T.F. and J.H.; methodology, T.F.; software, T.F.; validation, T.F.; formal analysis, T.F. and J.H.; investigation, T.F.; resources, T.F.; data curation, T.F.; writing—original draft preparation, T.F. and J.H.; writing—review and editing, T.F. and J.H.; visualization, T.F.; supervision, J.H.; project administration, J.H.; funding acquisition, J.H. All authors have read and agreed to the published version of the manuscript.

Funding

This research was funded by the Slovak Research and Development Agency (APVV) under the contract No. APVV-18-0044 and by the Scientific Grant Agency of the Ministry of Education, Science, Research and Sport of the Slovak Republic under the contract KEGA 016UPJŠ-4/2021.

Institutional Review Board Statement

Not applicable.

Informed Consent Statement

Not applicable.

Data Availability Statement

The data presented in this study are available on request from the corresponding author.

Acknowledgments

We would like to acknowledge the WRF & MPAS support forum community for providing valuable information about the model parameterization and input data preparation.

Conflicts of Interest

The authors declare no conflict of interest.

Abbreviations

The following abbreviations are used in this manuscript:
ARWAdvanced Research WRF
BEMBuilding Energy Model
BEPBuilding Effect Paramaterization
CLCCorine Land Cover
GDASGlobal Data Asimilation System
GISGeographic Information System
GRASSGeographic Resources Analysis Support System
JAXAJapanese Aerospace Agency
MAEMean absolute error
NCEPNational Center for Environmental Forecasts
NMMNon-hydrostatic Mesoscale Model
NWPNumerical Weather Prediction
PBLPlanetary boundary layer
RMSERoot mean square error
RRTMRapid Radiative Transfer Model
SYNOPSurface Synoptic Observations
TKETurbulent Kinetic Energy
UAUrban Atlas
UCIUrban cool island
UCMUrban Canopy Model
UHIUrban heat island
UHIIUrban heat island intensity
USGSUnited States Geological Survey
WRFWeather Research and Forecasting

Appendix A

Table A1. Reclassification of Urban Atlas (UA) classes to United States Geological Survey (USGS) classes.
UA ClassUA Class DescriptionUSGS ClassUSGS Class Description
1Isolated structures1Urban and built-up land
2Continuous urban fabric (>80% built up)32High Intensity residential (80–100% built-up)
3Pastures3Irrigated cropland or pastures
4Arable land (annual crops)3Irrigated cropland or pastures
5Industrial, commercial, public, military and private units33Commercial/Industrial/Transportation
6Discontinuous dense urban fabric (50–80% built-up)31Low Intensity residential (30–80% built-up)
7Other roads and associated land33Commercial/Industrial/Transportation
8Discontinuous medium density urban fabric (30–50% built-up)31Low Intensity residential (30–80% built-up)
9Land without current use19Barren or sparsely vegetated
10Discontinuous low density urban fabric (10–30% built-up)31Low Intensity residential (30–80% built-up)
11Railways and associated land33Commercial/Industrial/Transportation
12Mineral extraction and dump sites19Barren or sparsely vegetated
13Green urban areas9Mixed shrubland/cropland
14Sports and leisure facilities9Mixed shrubland/cropland
15Forests15Mixed forest
16Discontinuous very low density urban fabric (<10% built-up)9Mixed shrubland/cropland
17Herbaceous vegetation associations (natural grassland, moors...)7Grassland
18Airports33Commercial/Industrial/Transportation
19Water16Water bodies
20Construction sites33Commercial/Industrial/Transportation
21Wetlands17Herbacous wetland
22Fast transit roads and associated land33Commercial/Industrial/Transportation
Table A2. Reclassification of Corine Land Cover 2018 (CLC) classes to United States Geological Survey (USGS) classes.
CLC ClassCLC Class DescriptionUSGS ClassUSGS Class Description
111Continuous urban fabric32High Intensity residential (80–100% built-up)
112Discontinuous urban fabric31Low Intensity residential (30–80% built-up)
121Industrial or commercial units33Commercial/Industrial/Transportation
122Road and rail networks33Commercial/Industrial/Transportation
123Port areas33Commercial/Industrial/Transportation
124Airports33Commercial/Industrial/Transportation
131Mineral extraction sites19Barren or sparsely vegetated
132Dump sites19Barren or sparsely vegetated
133Construction sites33Commercial/Industrial/Transportation
141Green urban areas9Mixed shrubland/cropland
142Sport and leisure facilities9Mixed shrubland/cropland
211Non-irrigated arable land3Irrigated cropland or pastures
212Permanently irrigated land3Irrigated cropland or pastures
213Rice fields17Herbacous wetland
221Vineyards9Mixed shrubland/cropland
222Fruit trees and berry plantations6Cropland/woodland mosaic
231Pastures3Irrigated cropland or pastures
241Annual crops associated with permanent crops3Irrigated cropland or pastures
242Complex cultivation patterns3Irrigated cropland or pastures
243Land principally occupied by agriculture, with significant areas of natural vegetation3Irrigated cropland or pastures
311Broad-leaved forest11Deciduous broadleaf forest
312Coniferous forest14Evergreen needleleaf forest
313Mixed forest15Mixed forest
321Natural grasslands7Grassland
322Moors and heathland17Herbacous wetland
324Transitional woodland-shrub6Cropland/woodland mosaic
331Beaches, dunes, sands19Barren or sparsely vegetated
332Bare rocks19Barren or sparsely vegetated
333Sparsely vegetated areas19Barren or sparsely vegetated
334Burnt areas19Barren or sparsely vegetated
411Inland marshes17Herbacous wetland
412Peat bogs17Herbacous wetland
511Water courses16Water bodies
512Water bodies16Water bodies

References

  1. Arnfield, A.J. Two decades of urban climate research: A review of turbulence, exchanges of energy and water, and the urban heat island. Int. J. Climatol. 2003, 23, 1–26. [Google Scholar] [CrossRef]
  2. Danchovski, V.; Dimitrova, R.; Vladimirov, E.; Egova, E.; Ivanov, D. Comparison of urban mixing layer height from ceilometer, radiosonde and WRF model. In AIP Conference Proceedings; AIP Publishing LLC: Sofia, Bulgaria, 2019; Volume 2075. [Google Scholar]
  3. Pal, S.; Xueref-Remy, I.; Ammoura, L.; Charette, P.; Gibert, F.; Royer, P.; Dieudonné, E.; Dupont, J.-C.; Haeffelin, M.; Lac, C.; et al. Spatio-temporal variability of the atmospheric boundary layer depth over the Paris agglomeration: An assessment of the impact of the urban heat island intensity. Atmos. Environ. 2012, 63, 261–275. [Google Scholar] [CrossRef]
  4. Oke, T.R. The energetic basis of the urban heat island. Q. J. R. Meteorol. Soc. 1982, 108, 1–24. [Google Scholar] [CrossRef]
  5. Branea, A.M.; Danciu, M.I.; Gaman, M.S.; Badescu, S. Challenges regarding the study of urban heat islands. Ruleset for Researchers. In Proceedings of the Risk Reduction for Resilient Cities, Bucharest, Romania, 3–4 November 2016. [Google Scholar]
  6. Howard, L. The Climate of London; International Association for Urban Climate: London, UK, 1818. [Google Scholar]
  7. Theeuwes, N.E.; Barlow, J.F.; Teuling, A.J.; Grimmond, C.S.B.; Kotthaus, S. Persistent cloud cover over mega-cities linked to surface heat release. NPJ Clim. Atmos. Sci. 2019, 2, 15. [Google Scholar] [CrossRef] [Green Version]
  8. Williams, A.P.; Schwartz, R.E.; Iacobellis, S.; Seager, R.; Cook, B.I.; Still, C.J.; Husak, G.; Michaelsen, J. Urbanization causes increased cloud base height and decreased fog in coastal Southern California. Geophys. Res. Lett. 2015, 42, 1527–1536. [Google Scholar] [CrossRef] [Green Version]
  9. Lau, N.C.; Nath, M.J. A model study of heat waves over north America: Meteorological aspects and projections for the twenty-first century. J. Clim. 2012, 25, 4761–4784. [Google Scholar] [CrossRef]
  10. Zschenderlein, P.; Fink, A.H.; Pfahl, S.; Wernli, H. Processes determining heat waves across different European climates. Q. J. R. Meteorol. Soc. 2019, 145, 2973–2989. [Google Scholar] [CrossRef] [Green Version]
  11. Li, D.; Bou-Zeid, E. Synergistic interactions between urban heat islands and heat waves: The impact in cities is larger than the sum of its parts. J. Appl. Meteorol. Climatol. 2013, 52, 2051–2064. [Google Scholar] [CrossRef] [Green Version]
  12. Norton, B. Planning for a Cooler Future: Green Infrastructure to Reduce Urban Heat; Victorian Centre for Climate Change Adaptation Research: Melbourne, Australia, 2013. [Google Scholar] [CrossRef]
  13. Výberčí, D.; Švec, M.; Faško, P.; Savinová, H.; Trizna, M.; Mičietová, E. The effects of the 1996–2012 summer heat events on human mortality in Slovakia. Morav. Geogr. Rep. 2015, 23, 57–69. [Google Scholar] [CrossRef]
  14. Gago, E.J.; Roldan, J.; Pachecco-Torres, R.; Ordonez, J. The city and urban heat islands: A review of strategies to mitigate adverse effects. Renew. Sustain. Energy Rev. 2013, 25, 749–758. [Google Scholar] [CrossRef]
  15. Hofierka, J.; Gallay, M.; Onačillová, K.; Hofierka, J., Jr. Physically based land surface temperature modeling in urban areas using a 3-D city model and multispectral satellite data. Urban Clim. 2020, 31, 100566. [Google Scholar] [CrossRef]
  16. Onačillová, K.; Gallay, M. Spatio-temporal analysis of surface urban heat island based on LANDSAT ETM+ and OLI/TIRS imagery in the city of Košice, Slovakia. Carpathian J. Earth Environ. Sci. 2018, 13, 395–408. [Google Scholar] [CrossRef]
  17. Shi, Y.; Zhang, Y. Remote sensing retrieval of urban land surface temperature in hot-humid region. Urban Clim. 2018, 24, 299–310. [Google Scholar] [CrossRef]
  18. Onačillová, K.; Gallay, M.; Paluba, D.; Péliová, A.; Tokarčík, O.; Laubertová, D. Combining Landsat 8 and Sentinel-2 Data in Google Earth Engine to Derive Higher Resolution Land Surface Temperature Maps in Urban Environment. Remote Sens. 2022, 14, 4076. [Google Scholar] [CrossRef]
  19. Li, Z.; Erb, A.; Sun, Q.; Liu, Y.; Shuai, Y.; Wang, Z.; Boucher, P.; Schaaf, C. Preliminary assessment of 20-m surface albedo retrievals from sentinel-2A surface reflectance and MODIS/VIIRS surface anisotropy measures. Remote Sens. Environ. 2018, 217, 352–365. [Google Scholar] [CrossRef]
  20. Hofierka, J.; Onačillová, K. Estimating Visible Band Albedo from Aerial Orthophotographs in Urban Areas. Remote Sens. 2022, 14, 164. [Google Scholar] [CrossRef]
  21. Zheng, G.; Moskal, L.M. Retrieving Leaf Area Index (LAI) Using Remote Sensing: Theories, Methods and Sensors. Sensors 2009, 9, 2719–2745. [Google Scholar] [CrossRef] [Green Version]
  22. Hofierka, J.; Zlocha, M. A New 3-D Solar Radiation Model for 3-D City Models. Trans. GIS 2012, 16, 681–690. [Google Scholar] [CrossRef]
  23. Hofierka, J.; Bogľarský, J.; Kolečanský, Š.; Enderová, A. Modeling Diurnal Changes in Land Surface Temperature in Urban Areas under Cloudy Conditions. ISPRS Int. J. Geo.-Inf. 2020, 9, 534. [Google Scholar] [CrossRef]
  24. Bueno, B.; Norford, L.; Hidalgo, J.; Pigeon, G. The urban weather generator. J. Build. Perform. Simul. 2013, 6, 269–281. [Google Scholar] [CrossRef]
  25. Wang, X.; Li, Y. Predicting Urban Heat Island Circulation Using CFD. Build. Environ. 2016, 99, 82–97. [Google Scholar] [CrossRef]
  26. Maronga, B.; Banzhaf, S.; Burmeister, C.; Esch, T.; Forkel, R.; Fröhlich, D.; Fuka, V.; Gehrke, K.F.; Geletič, J.; Giersch, S.; et al. Overview of the PALM model system 6.0. Geosci. Model Dev. 2020, 13, 1335–1372. [Google Scholar] [CrossRef]
  27. Deutsche Wetterdienst. Microscale Urban Climate Model MUKLIMO_3. Available online: https://www.dwd.de/EN/ourservices/muklimo_basic/muklimo_3_basic_version_en.pdf (accessed on 29 October 2022).
  28. Salim, M.H.; Schlünzen, K.H.; Grawe, D.; Boettcher, M.; Gierisch, A.M.U.; Fock, B.H. The microscale obstacle-resolving meteorological model MITRAS v2.0: Model theory. Geosci. Model Dev. 2018, 11, 3427–3445. [Google Scholar] [CrossRef] [Green Version]
  29. Consortium for Small-Scale Modeling. COSMO and ICON NWP Models. Available online: https://www.cosmo-model.org/ (accessed on 26 November 2022).
  30. Skamarock, W.C.; Klemp, J.B.; Dudhia, J.; Gill, D.O.; Liu, Z.; Berner, J.; Wang, W.; Powers, J.G.; Duda, M.G.; Barker, D.; et al. A Description of the Advanced Research WRF Model Version 4; Technical Report NCAR/TN-556+STR; UCAR; NCAR: Boulder, CO, USA, 2019. [Google Scholar] [CrossRef]
  31. Dudha, J. Overview of WRF Physics. Basic WRF Tutorial. 2015. Available online: http://homepages.see.leeds.ac.uk/~lecag/wiser/sample_wiser_files.dir/Physics_Dudhia.ppt.pdf (accessed on 7 October 2022).
  32. Tewari, M.; Chen, F.; Kusaka, H.; Miao, S. Coupled WRF/Unified Noah/Urban-Canopy Modeling System. Available online: https://ral.ucar.edu/sites/default/files/public/product-tool/WRF-LSM-Urban.pdf (accessed on 7 October 2022).
  33. Chen, F. The Noah Land Surface Model in WRF: A Short Tutorial. LSM Group Meeting. 17 April 2007. Available online: https://www.atmos.illinois.edu/~snesbitt/ATMS597R/notes/noahLSM-tutorial.pdf (accessed on 7 October 2022).
  34. Bhati, S.; Mohan, M. WRF-urban canopy model evaluation for the assessment of heat island and thermal comfort over an urban airshed in India under varying land use/land cover conditions. Geosci. Lett. 2018, 5, 27. [Google Scholar] [CrossRef] [Green Version]
  35. Bhati, S.; Mohan, M. The impact of land use/land cover on WRF model performance in a subtropical urban environment. In Proceedings of the 9th International Conference on Urban Climate, Toulouse, France, 20–24 July 2015; Available online: http://www.meteo.fr/icuc9/LongAbstracts/nomtm11_@28cont@29-2-6991307_a.pdf (accessed on 14 November 2022).
  36. Fedor, T.; Hofierka, J. Increasing the accuracy of the WRF-ARW numerical weather prediction model using Corine Land Cover and JAXA data. Geogr. Cassoviensis 2021, 15, 218–232. [Google Scholar] [CrossRef]
  37. Vladimirov, E.; Dimitrivova, R.; Danchovski, V. Sensitivity of WRF Model Results to Topography and Land Cover: Study for the Sofia Region. Annu. Sofia 2018, 111, 87–101. Available online: https://www.phys.uni-sofia.bg/annual/archive/111/full/GSU-Fizika-111_07_color.pdf (accessed on 24 September 2022).
  38. Kong, J.; Zhao, Y.; Carmeliet, J.; Lei, C. Urban Heat Island and Its Interaction with Heatwaves: A Review of Studies on Mesoscale. Sustainability 2021, 13, 10923. [Google Scholar] [CrossRef]
  39. Jiang, S.; Lee, X.; Wang, J.; Wang, K. Amplified Urban Heat Islands during Heat Wave Periods. J. Geophys. Res. Atmos. 2019, 124, 7797–7812. [Google Scholar] [CrossRef] [Green Version]
  40. Tewari, M.; Yang, J.; Kusaka, H.; Salamanca, F.; Watson, C.; Treinish, C. Interaction of urban heat islands and heat waves under current and future climate conditions and their mitigation using green and cool roofs in New York City and Phoenix, Arizona. Environ. Res. Lett. 2019, 14, 034002. [Google Scholar] [CrossRef]
  41. Adachi, S.A.; Kimura, F.; Kusaka, H.; Inoue, T.; Ueda, H. Comparison of the Impact of Global Climate Changes and Urbanization on Summertime Future Climate in the Tokyo Metropolitan Area. J. Appl. Meteorol. Climatol. 2012, 15, 1441–1454. [Google Scholar] [CrossRef]
  42. Lauwaet, D.; De Ridder, K.; Saeed, S.; Brisson, E.; Chatterjee, F.; van Lipzig, N.M.P.; Maiheu, B.; Hooyberghs, H. Assessing the current and future urban heat island of Brussels. Urban Clim. 2016, 15, 1–15. [Google Scholar] [CrossRef] [Green Version]
  43. Nicholson, A. Analysis of the diurnal cycle of air temperature between rural Berkshire and the University of Reading: Possible role of the urban heat island. Weather 2020, 75, 235–241. [Google Scholar] [CrossRef]
  44. Oliveira, A.; Lopes, A.; Correia, E.; Niza, S.; Soares, A. Heatwaves and Summer Urban Heat Islands: A Daily Cycle Approach to Unveil the Urban Thermal Signal Changes in Lisbon, Portugal. Atmosphere 2021, 12, 292. [Google Scholar] [CrossRef]
  45. Al-Obaidi, I.; Rayburg, S.; Półrolniczak, M.; Neave, M. Assessing the Impact of Wind Conditions on Urban Heat Islands in Large Australian Cities. J. Ecol. Eng. 2021, 22, 1–15. [Google Scholar] [CrossRef]
  46. Halios, C.H.; Barlow, J.F. Observations of the Morning Development of the Urban Boundary Layer Over London, UK, Taken During the ACTUAL Project. Bound.-Layer Meteorol. 2018, 166, 395–422. [Google Scholar] [CrossRef]
  47. Zhao, L.; Lee, X.; Smith, R.B.; Oleson, K. Strong contributions of local background climate to urban heat islands. Nature 2014, 511, 216–219. [Google Scholar] [CrossRef]
  48. Wang, W.; Gill, D. WRF Nesting; Mesoscale & Microscale Meteorological Division; NCAR: Sao Paulo, Brazil, 2012. Available online: https://ruc.noaa.gov/wrf/wrf-chem/wrf_tutorial_2012_brazil/WRF_nesting.pdf (accessed on 27 September 2022).
  49. Jiménez-Estéve, B.; Udina, M.; Soler, M.R.; Pepin, N.; Miró, J.R. Land Use and Topography Influence in a Complex Terrain Area: A High Resolution Mesoscale Modelling Study over the Eastern Pyrenees using the WRF Model. Atmos. Res. 2017, 202, 49–62. [Google Scholar] [CrossRef] [Green Version]
  50. National Centers for Environmental Prediction; National Weather Service; NOAA; U.S. Department of Commerce. NCEP GDAS/FNL 0.25 degree global tropospheric analyses and forecast grids. In Research Data Archive at the National Center for Atmospheric Research, Computational and Information Systems Laboratory; NOAA: Silver Spring, MD, USA, 2022. [Google Scholar] [CrossRef]
  51. Mitchell, K. The Community Noah Land Surface Model. User’s Guide. 9 February 2005. Available online: https://scholar.google.sk/scholar_url?url=https://www.academia.edu/download/42046380/THE_COMMUNITY_Noah_LAND-SURFACE_MODEL_L20160204-7785-1jpbaav.pdf&hl=sk&sa=X&ei=bogbY90v5JfL1g_7lr-ABQ&scisig=AAGBfm0Yj7ndH9W_Z7aiuaMmhSjKR-t2VQ&oi=scholarr (accessed on 15 October 2022).
  52. Dudhia, J. Numerical study of convection observed during the Winter Monsoon Experiment using a mesoscale two–dimensional model. J. Atmos. Sci. 1989, 46, 3077–3107. [Google Scholar] [CrossRef]
  53. Mlawer, E.J.; Steven, J.T.; Patrick, D.B.; Lacono, M.J.; Clough, S.A. Radiative transfer for inhomogeneous atmospheres: RRTM, a validated correlated–k model for the longwave. J. Geophys. Res. 1997, 102, 16663–16682. [Google Scholar] [CrossRef] [Green Version]
  54. Chen, S.H.; Sun, W.Y. A One-dimensional Time Dependent Cloud Model. J. Meteorol. Soc. Japan 2002, 80, 99–118. [Google Scholar] [CrossRef] [Green Version]
  55. Kain, J.S. The Kain–Fritsch Convective Parameterization: An Update. J. Appl. Meteorol. Climatol. 2004, 43, 171–181. [Google Scholar] [CrossRef]
  56. Bougeault, P.; Lacarrere, P. Parameterization of Orography-Induced Turbulence in a Mesobeta-Scale Model. Mon. Weather Rev. 1989, 117, 1872–1890. [Google Scholar] [CrossRef]
  57. University of Wyoming. Vertical Profiles Data Visualization from Gánovce Areological Center. 2022. Available online: http://weather.uwyo.edu/upperair/sounding.html (accessed on 8 October 2022).
  58. Air Weather Service Scott AFB Il. The Use of the Skew T, Log P Diagram in Analysis and Forecasting. Defense Technical Information Center. 1990. Available online: https://cpb-us-w2.wpmucdn.com/sites.uwm.edu/dist/8/663/files/2019/05/SkewTDocumentation.pdf (accessed on 15 November 2022).
  59. European Environmental Agency CORINE Land Cover 2018. Copernicus Land Monitoring Service. 2022. Available online: https://land.copernicus.eu/pan-european/corine-land-cover/clc2018 (accessed on 27 September 2022).
  60. European Environmental Agency Urban Atlas 2018. Copernicus Land Monitoring Service. 2022. Available online: https://land.copernicus.eu/local/urban-atlas (accessed on 27 September 2022).
  61. Siewert, J.; Kroszczynski, K. GIS Data as a Valuable Source of Information for Increasing Resolution of the WRF Model for Warsaw. Remote Sens. 2020, 12, 1881. [Google Scholar] [CrossRef]
  62. Chai, T.; Draxler, R.R. Root mean square error (RMSE) or mean absolute error (MAE)?—Arguments against avoiding RMSE in the literature. Geosci. Model Dev. 2014, 7, 1247–1250. [Google Scholar] [CrossRef] [Green Version]
  63. Wilks, D.S. Statistical Methods in the Atmospheric Sciences, 2nd ed.; Elsevier: San Diego, CA, USA, 2006; pp. 232–255. Available online: https://sunandclimate.files.wordpress.com/2009/05/statistical-methods-in-the-atmospheric-sciences-0127519661.pdf (accessed on 30 September 2022).
  64. Lee, K.; Kim, Y.; Sung, H.C.; Ryu, J.; Jeon, S.W. Trend Analysis of Urban Heat Island Intensity According to Urban Area Change in Asian Mega Cities. Sustainability 2020, 12, 112. [Google Scholar] [CrossRef] [Green Version]
  65. Vogel, J.; Afshari, A. Comparison of Urban Heat Island Intensity Estimation Methods Using Urbanized WRF in Berlin, Germany. Atmosphere 2020, 11, 1338. [Google Scholar] [CrossRef]
  66. Sheridan, P.; Smith, S.; Brown, A.; Vosper, S. A simple height-based correction for temperature downscaling in complex terrain. Meteorol. Appl. 2010, 17, 329–339. [Google Scholar] [CrossRef]
  67. Bokwa, A.; Wypych, A.; Hajto, M.J. Role of Fog in Urban Heat Island Modification in Kraków, Poland. Aerosol Air Qual. Res. 2018, 18, 178–187. [Google Scholar] [CrossRef]
  68. Li, H.; Michael, W.; Xun, W.; Sahar, S. Impact of land cover data on the simulation of urban heat island for Berlin using WRF coupled with bulk approach of Noah-LSM. Theor. Appl. Climatol. 2018, 134, 67–81. Available online: https://link.springer.com/article/10.1007/s00704-017-2253-z (accessed on 15 November 2022). [CrossRef]
  69. Jin, L.; Suchert, S.; Fenner, D.; Meier, F. Integration of a Building Energy Model in an Urban Climate Model and its Application. Bound.-Layer Meteorol. 2021, 178, 249–281. Available online: https://link.springer.com/article/10.1007/s10546-020-00569-y (accessed on 15 November 2022). [CrossRef]
  70. Mohajerani, A.; Bakaric, J. The urban heat island effect, its causes, and mitigation, with reference to the thermal properties of asphalt concrete. J. Environ. Manag. 2017, 197, 502–538. [Google Scholar] [CrossRef] [PubMed]
  71. Seam, N.L.; Ludwig, F.L.; Donall, E.G.; Warner, T.; Bhumralkar, C.M. Numerical studies of urban planetary boundary-layer structure under realistic synoptic conditions. J. Appl. Meteorol. 1989, 28, 760–781. [Google Scholar] [CrossRef]
  72. Basset, R.; Cai, X.; Chapman, L.; Haeviside, C.; Thornes, J.E.; Muller, C.E.; Young, D.I.; Warren, E.L. Observations of urban heat island advection from a high-density monitoring network. Q. J. R. Meteorol. Soc. 2016, 142, 2434–2441. [Google Scholar] [CrossRef]
  73. Basara, J.B.; Basara, H.G.; Ilston, B.G.; Crawford, K.C. The Impact of the Urban Heat Island during an Intense Heat Wave in Oklahoma City. Adv. Meteorol. 2010, 2010, 230365. [Google Scholar] [CrossRef] [Green Version]
  74. Li, J.; Zhou, M.; Lenschow, D.H.; Cheng, Z.; Dou, Y. Observed Relationships Between the Urban Heat Island, Urban Pollution Island, and Downward Longwave Radiation in the Beijing Area. Earth Space Sci. 2020, 7, e2020EA001100. [Google Scholar] [CrossRef]
  75. Zhang, Z.; Paschalis, A.; Mijic, A.; Meili, N.; Manoli, G.; Reeuwijk, M.; Fatichi, S. A mechanistic assessment of urban heat island intensities and drivers across climates. Urban Clim. 2022, 44, 101215. [Google Scholar] [CrossRef]
  76. Ribeiro, I.; Martilli, A.; Falls, M.; Zonato, A.; Villalba, C. Highly resolved WRF-BEP/BEM simulations over Barcelona urban area with LCZ. Atmos. Res. 2021, 248, 105220. [Google Scholar] [CrossRef]
  77. Sharma, A.; Fernando, H.J.; Hellmann, J.; Chen, F. Sensitivity of WRF model to urban parameterizations, with applications to Chicago metropolitan urban heat island. In Proceedings of the ASME 2014 4th Joint US-European Fluids Engineering Division Summer Meeting, Chicago, IL, USA, 3–7 August 2014. [Google Scholar] [CrossRef]
  78. Hendricks, E.A.; Knievel, J.C. Evaluation of Urban Canopy Models against Near-Surface Measurements in Houston during a Strong Frontal Passage. Atmosphere 2022, 13, 1548. [Google Scholar] [CrossRef]
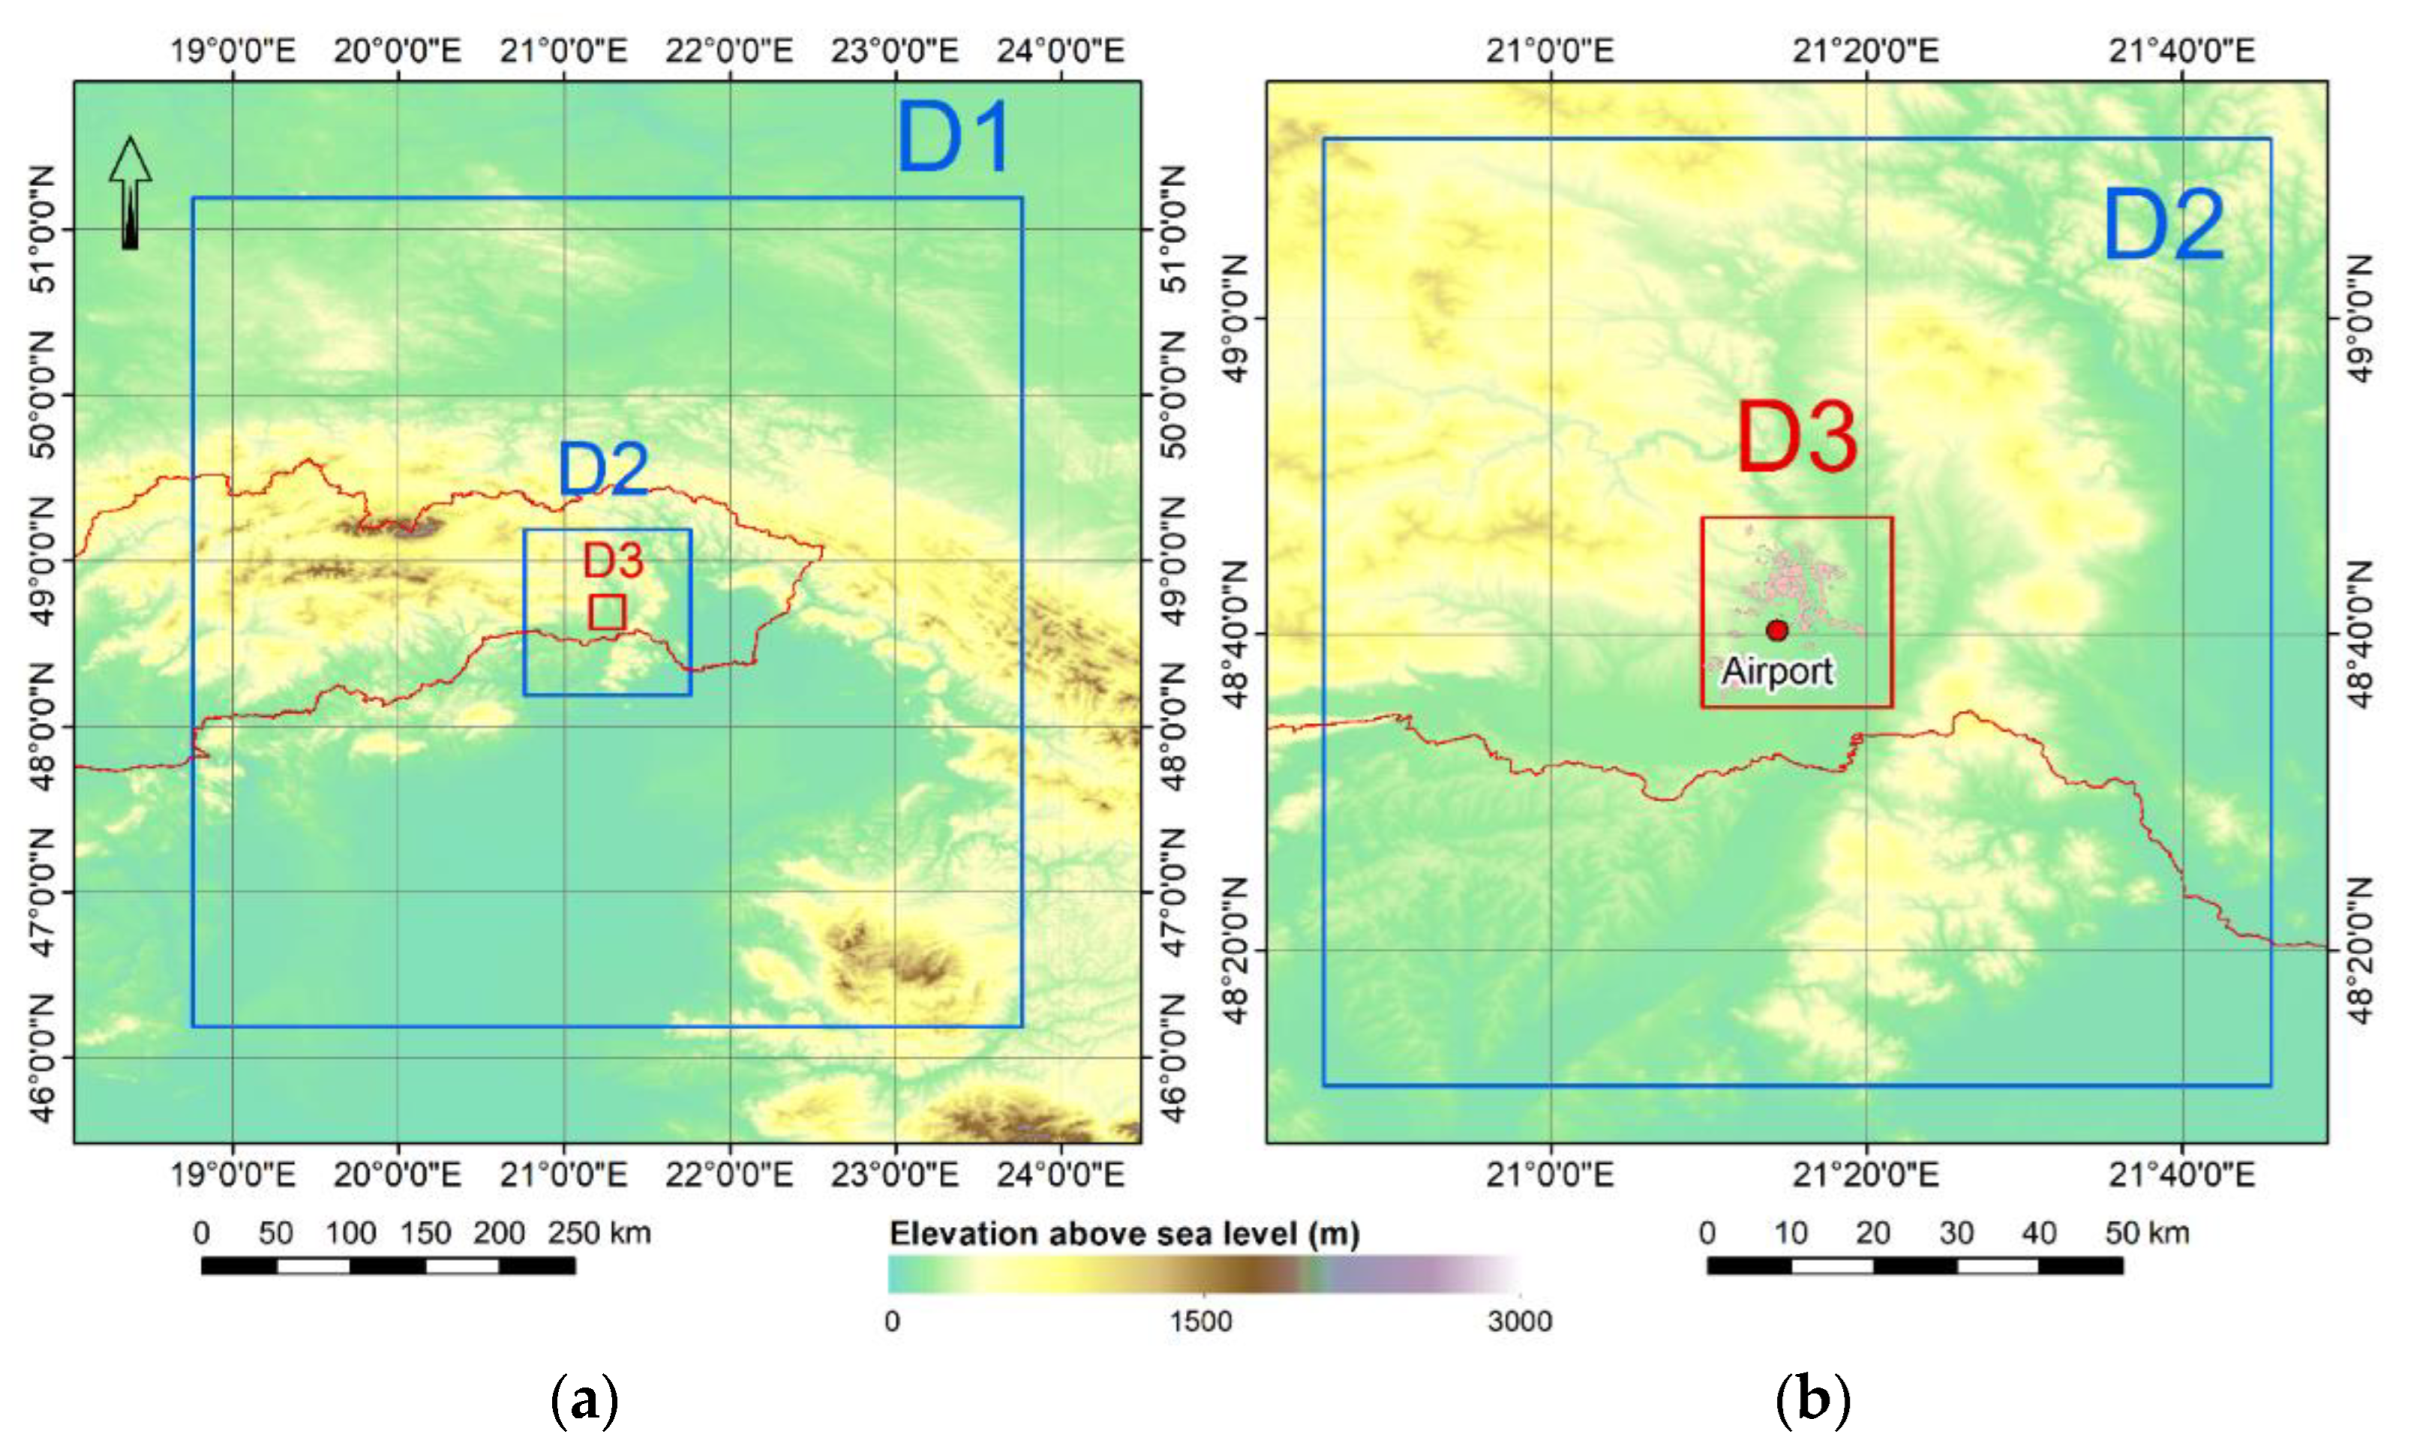
Figure 1. Position of model domains (a) and urban area of Košice with airport (b).
Atmosphere 13 02057 g001
Figure 2. Skew-t vertical profiles from the Gánovce areological center representing the vertical distribution of humidity (dewpoint, left black line), temperature (right black line) and windspeed (windbarbs on the right) for (a) 31 August 2015 12:00 UTC, (b) 12 June 2022 12:00 UTC, (c) 30 June 2022 12:00 UTC and (d) 3 June 2017 12:00 UTC.
Atmosphere 13 02057 g002
Figure 3. Reclassified land cover classes; key to land cover classes is in Table A1 and Table A2.
Atmosphere 13 02057 g003
Figure 4. Comparison of predicted (WRF) and observed (SYNOP) 2 m temperature at the airport.
Atmosphere 13 02057 g004
Figure 5. Comparison of predicted (WRF) and observed (SYNOP) 10 m wind speed at the airport.
Atmosphere 13 02057 g005
Figure 6. The average temperature at 2 m and average 10 m wind vectors from the third model domain (D3) with marked built-up areas during the (a) warm dynamic situation of 31 August 2015, (b) cold dynamic situation of 12 June 2022, (c) warm non-dynamic situation of 30 June 2022 and (d) cold non-dynamic situation of 3 June 2017.
Atmosphere 13 02057 g006
Figure 7. The corrected UHII ¯   calculated from the 2 m temperature of the third model domain (D3) with marked built-up areas during the (a) warm dynamic situation of 31 August 2015, (b) cold dynamic situation of 12 June 2022, (c) warm non-dynamic situation of 30 June 2022 and (d) cold non-dynamic situation of 3 June 2017.
Atmosphere 13 02057 g007
Figure 8. Boxplot comparison of the daily corrected ⟨UHII⟩ amplitude, range, and distribution for all four scenarios calculated from the 10-min timestep.
Atmosphere 13 02057 g008
Figure 9. The development of the corrected ⟨UHII⟩ in time for all four scenarios in 10 min timestep.
Atmosphere 13 02057 g009
Table 1. WRF-ARW model configuration for nest and parent domains.
ParameterNest (D3)Parent (D1, D2)
Time step (s)1.26, 30
Grid resolution100 × 100100 × 100, 100 × 100
Grid size (°)0.0020.01, 0.05
Vertical levels100100
Shortwave radiationDudhia Shortwave SchemeDudhia Shortwave Scheme
Longwave radiationRRTM Longwave SchemeRRTM Longwave Scheme
MicrophysicsPurdue Lin SchemePurdue Lin Scheme
Cumulus physics-Kain–Fritsch Scheme
Boundary layerBougeault–Lacarrere Scheme Bougeault–Lacarrere Scheme
Surface layerRevised MM5 SchemeRevised MM5 Scheme
Land surfaceUnified Noah LSMUnified Noah LSM
Urban physicsUrban Canopy ModelUrban Canopy Model
Table 2. Solar insolation hours measured at the airport for all four scenarios.
Date31 August 201530 June 202212 June 20223 June 2017
Solar insolation (hours)11.613.714.414
Table 3. 2 m temperature (T2m) and 10 m wind speed (W10m) accuracy evaluation.
T2m31 August 201530 June 202212 June 20223 June 2017W10m31 August 201530 June 202212 June 20223 June 2017
MBE1.7310.7260.0371.059MBE−0.251−0.2100.304−0.003
MAE2.5442.2211.0942.548MAE1.5361.1570.9580.791
RMSE3.0902.6351.4113.070RMSE2.8282.2021.6470.991
Publisher’s Note: MDPI stays neutral with regard to jurisdictional claims in published maps and institutional affiliations.