Abstract
With recycling and reuse in mind, this study explores the possibility of the utilization of waste generated during the plasma cutting operations to produce aluminum products in a commercial friction material formulation for car braking applications. The as-received waste, analyzed in the form of a powder, was subjected to various characterization techniques to obtain its composition and phase constituents. The friction, wear, and emission analyses were organized in two ways: the first part focused on the selection of the most suitable waste content in the friction material formulation—10, 15, and 20 wt.%—tested in the form of pins, using a pin-on-disc tribometer. The second part evaluated the most suitable content in the formulation in the form of coupons on a subscale dynamometer to comprehend its friction and emission characteristics in a more complex scenario. Through the pin-on-disc analysis, it was seen that the 10 wt.% of waste in the formulation provided permissible friction and wear behavior, and similar emission magnitude and secondary plateau characteristics were seen, as compared to the reference composition. Similar results were recorded on the subscale dynamometer at mild braking conditions. At ‘severe’ testing conditions, a different trend was observed. Through this analysis, the possibility of the addition of this kind of waste in friction material composition has been evaluated deeply, paving a path for further analysis and possible implementation.
1. Introduction
Excessive negative environmental issues are observed to steadily increase with the advent of industrialization. This trend has led to many studies focusing on an economy, wherein, ‘cross-industry’ networks alter the supply chain in a typical industrial system. Previously, the ‘loop closing’ technique in production steps along one supply chain system (consisting of just administration decisions through vertically integrated systems) was employed to achieve sustainability in the industry. However, since the early 2000s, the trends have involved cross-industry systems across numerous supply chains produced through a circular economy [1,2,3]. The concept of a circular economy is fast gaining importance politically, economically, and academically, as it helps the current ‘take-make-dispose’ model convert to a wholesome circular model. The updated model considers waste as a resource brought back to gain importance through recycling and reuse. The circular economy model is extremely enticing as it helps to reach economic and environmental targets by reducing resource utilization and boosting economic growth simultaneously [2,4].
One such possibility of the utilization of wastes is currently being explored in the friction material industries for automotive braking applications [5]. To effectively engage the culture of circular economy and reduce manufacturing costs, numerous brake pad manufacturers are rigorously seeking alternatives to potentially replace a few brake pad constituents with more environmentally friendly solutions. Currently, the wastes utilized in these studies are divided into two categories: agricultural and industrial wastes. The agricultural wastes have focused on areas including rice husk [6,7], palm kernel fibers and shells [8,9], mussel shells [10,11], and periwinkle shells [12,13]. On the other hand, industrial wastes constitute a wide variety of options such as metallurgical slags [14,15], red mud [5,16], fly ash [17,18], slate powder [19], and brick dust [20]. Depending on the waste composition, they can take up the role of an abrasive, lubricant, or filler [21,22].
During the plasma cutting operation to obtain various products, a significant amount of waste, in the form of powder, is produced every year, which requires appropriate disposal options. When the wastes are generated while cutting aluminum sheets/products/parts, the corresponding composition is expected to also contain variations of Al oxides [23]. Alumina is a well-known abrasive employed widely and frequently in automotive brake pads. Alumina is known to elevate and stabilize the friction coefficient (CoF) traces and magnitude, help in the formation of a smooth, compacted, and extended secondary contact plateau rich in Fe oxides, and help in the effective removal of the carbonaceous layer from the counterface surface [24,25,26].
Keeping this in mind, this paper provides a novel and extensive analysis on the characterization and utilization of the waste generated during the plasma cutting process of aluminum products at Valcom’s S.p.A, Italy. The waste, collected in the form of powder, was characterized using X-ray diffraction (XRD) and the scanning electron microscope (SEM) technique to understand the composition and the phase constituents. Following this, the waste was subjected to friction, wear, and emission studies by adding it in a commercial friction material formulation. Emission analysis and its subsequent control is an immediate concern as the rapid implementation of numerous legislations around the world requires reduced/low emission generation during braking processes [27,28,29,30,31,32]. Seeing this urgent need, it becomes necessary for studies to also explore the emissions behavior of any added waste to truly label it as ‘environmentally friendly’. The selected friction material formulation is a highly optimized, commercially employed composition, currently being used in car braking applications. This formulation was chosen as it would provide for a ‘real world’ analysis. Initially, the waste was added to the formulation at varying quantities and subjected to friction and emission analysis on a pin-on-disc tribometer to understand the most desirable waste addition. Following this step, the formulation with the most suitable waste content was then tested on a subscale dynamometer to assess the brake performance with an actual standard procedure for a further confirmation of the applicability of plasma powder in friction materials. The test also included a section to have a screening of the emission behavior of the friction material in order to fulfill this new and paramount requirement. The study provides a detailed one-of-a-kind insight into the real-world application of the utilization of this rarely incorporated but abundantly produced waste in an already commercially viable friction material formulation, shedding light on its friction, wear, and emission properties using different equipment. Through this analysis, the possibility of the inclusion of the waste in future analyses is evaluated in detail.
2. Materials and Methods
2.1. Materials
In this study, waste generated from the plasma cutting of aluminum products at Valcom S.p.A, Italy, were added in a commercial friction material formulation for friction and emission studies on two kinds of testing equipment. The wastes were produced while cutting products made of Al5083 alloy grade; the corresponding nominal composition is shown in Table 1.

Table 1.
Nominal composition of Al5083 alloy [33,34].
The wastes collected after the plasma cutting (titled plasma powder, PP) were not subjected to any pre-treatments or a sieving process. The powder was used as-produced/as-received.
The friction material formulation utilized in this study was an extensively tested, highly analyzed, and optimized friction material formulation (named CFM). The CFM is currently being used in brake pads in cars. The full composition is kept confidential. However, few of the constituents are shown in Table 2.
Table 2.
Selected constituents of the commercial formulation with their corresponding function (in wt.%) [23].
The analysis in this paper is categorized into two parts: the first part focuses on the selection of the most suitable PP waste addition in the CFM formulation. Four different CFM compositions were tested: reference CFM (no PP addition), CFM with 10 wt.% of PP (CFM + 10 PP), CFM with 15 wt.% of PP (CFM + 15 PP), and CFM with 20 wt.% of PP (CFM + 20 PP). The CFM constitution remained the same, irrespective of the PP addition.
All CFMs and the respective waste additions were tested in the form of in-house produced pins. The different combinations were carefully weighed and mixed in a TURBULA® mixer for 60 min to establish homogeneous mixing. The mixture was then subjected to a hot press process. A tool steel cylindrical mold was filled with the mixture and hot pressed on a BUEHLER® Pneumet I hot mounting press at 100 MPa, 150 °C, for a holding time of 10 min [15,21]. The green body produced was cured in a generic furnace at 200 °C for 4 h. The average height and diameter of the pins were 10 mm.
The second part of the analysis was based on the friction and emission testing of the most suitable PP addition in the CFM formulation on a subscale dynamometer to replicate complex braking conditions and to compare their characteristics with the reference CFM composition. In this part of study, coupons containing the most suitable PP addition and reference CFM were produced using the same conditions as employed to produce the pins. The only difference between the two procedures was the shape of the dies utilized. The final coupons were rectangular in shape, with a of width 12 mm, length of 30 mm, and thickness of 17 mm.
Irrespective of the type of equipment used, the pins/coupons were tested against a pearlitic grey cast iron counterface in the form of discs. In the case of the pin-on-disc, the diameter and thickness of the discs were 60 mm and 6 mm, respectively. On the other hand, for the subscale dynamometer, the diameter and thickness were 120 mm and 6 mm, respectively. The counterface material properties are given in Table 3.
Table 3.
Properties and composition of the pearlitic grey cast iron counterface [23].
2.2. Testing Conditions and Methods
2.2.1. Pin-on-Disc (PoD) Tests—First Part of Analysis
In the first part of the analysis, the waste in varying content was added in the CFM formulation, paired with the pearlitic grey cast iron counterface discs, and subjected to dry sliding friction, wear, and emission analysis on a pin-on-disc (PoD, make: Ducom, India) tribometer. The aim of this analysis was to select the most suitable PP waste content in the CFM. The discs were subjected to pre-treatment before the beginning of the tests—polished with a 180 SiC grit abrasive paper for 3–5 min and repeatedly cleaned with acetone/ethanol to remove dust, grease, and other impurities from the surface. A fresh, unused disc was always utilized for a new trial. The testing conditions employed were a contact pressure of 1 MPa (79 N) and a sliding velocity of 1.51 m/s. For a wear track diameter of 48 mm, the sliding speed was 600 rpm. The testing condition was chosen to replicate ‘mild braking’ conditions. This condition was deemed appropriate to observe not only the friction and emission trends, but also to evaluate the characteristics (composition, extension, and smoothness) of the deposited secondary contact plateaus on the worn surfaces, which would have been difficult in ‘severe’ conditions [35,36]. All tests were conducted at ambient/room temperature. The relative humidity of the laboratory was not controlled but regularly checked, which always varied between 40 and 45%. To maintain a similar relative humidity, all trials and their repetitions were conducted within the span of 10 days. All tests with the reference CFM and with the waste additions were conducted four times each to obtain repeatability in the results.
To achieve an appropriate evaluation of friction, wear, and emission characteristics, a proper conformance between the pin and disc surface is necessary. To obtain this, before the actual testing duration, a ‘run-in’ was performed for 30 min. Following this procedure, the tests were conducted for 90 min. This duration assures the attainment of a steady state in friction and emission trends, and the proper establishment of a smooth, compacted, and extended secondary contact plateaus for further evaluation [23,37].
Figure 1 presents the schematic of the PoD testing equipment with the attached particle collection system. The air from the laboratory is taken in at (A) by the means of a fan (B). Following this, to remove any dust and impurities, the air is passed through a High-Efficiency Particulate Air (HEPA) filter (C), followed by the introduction of clean air inside the PoD chamber (D). The air velocity is maintained at 11.5 m/s and the air cleanliness at 1 #/cm3 (the magnitudes were derived from previous studies [38,39]). A TSI® Optical Particle Sizer Spectrometer (OPS, model 3330, TSI Incorporated, Shoreview, USA) was connected to D at the point F in Figure 1. The OPS is employed to inspect and evaluate the particle number concentration for sizes between 0.3 and 10 µm. The OPS is divided into 16 channels with 1 Hz of sampling frequency. The equipment measures particle concentration up to 3000 #/cm3 with a self-controlled sampling flow rate of 1 l/min.
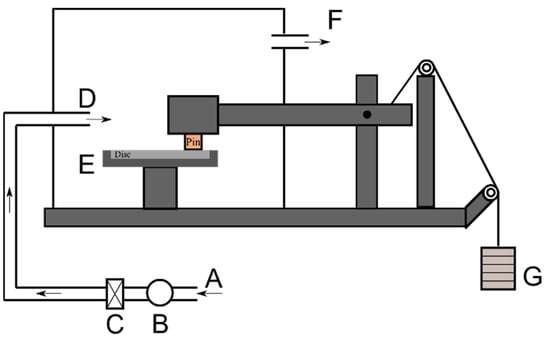
Figure 1.
Testing apparatus setup. A: Ambient air; B: Fan; C: HEPA filter; D: Air introduced in the chamber; E: Disc/Counterface; F: Air outlet to the OPS; G: Weights.
The coefficient of friction (CoF) and the emitted particle concentration from the OPS were recorded directly from the program attached to the PoD and the OPS, respectively. Alternatively, the pin wear or the specific wear coefficient of the pin were calculated by weighing the pins before and after each tests using an analytical balance with a precision of 10−4 g, and computing through the following equation:
where:
V: wear volume loss; F: load applied; d: sliding distance (~8145 m).
2.2.2. Subscale Dynamometric Tests—Second Part of Analysis
The second part of the analysis focused on the friction and emission analysis of the CFM with the most desirable PP waste addition on a subscale dynamometer (LINK model 1200) to assess information related to complex braking scenarios. Through this analysis, an overall evaluation of the suitability of the utilization of PP waste in the CFM was explored. Two coupons were utilized to obtain a combined area of 7.2 cm2 and mounted with a spacing of 180°. For all the optimum combinations, three trials were conducted to obtain repeatability in the results. The subscale dynamometer applies a mechanical similitude to guarantee the same contact pressure, sliding speed, and specific energy with a reference vehicle (for further details refer to [40]). These tests simulated the braking events of a D-segment passenger car. The experimental setup is shown in Figure 2.

Figure 2.
Scheme of the experimental setup. F: fan; H: HEPA filter; C: Chamber; D: disc; P: pad; DL: diluter, SLs: sampling lines; OPS: TSI® OPS.
The analysis followed a specifically modified version of the standard AK-Master procedure (SAE J2522). The SAE J2522 braking cycle [41] is widely used for the characterization of the effectiveness of braking systems. This standard procedure consists of several sections to analyze different characteristics of the friction behavior of a brake couple. A brief description of the braking parameters of the sections of interest is as follows: speed-pressure (s-p) sensitivity sections test the sensitivity of the brake couple to different pressures and velocities at relatively low temperatures (the initial speed temperature is 100 °C); whereas, to characterize friction behavior at high disc temperature, Fade-1, increasing temperature 500 °C and pressure line 500 °C, sections were used. In the s-p sensitivity sections, the brake stops started at an initial disc temperature of 100 °C. The pressure ranged from 10 to 80 bar and the initial velocity from 40 to 200 km/h. In the Fade sections, the temperatures ranged from 100 to 350 °C. For the tests, two modifications were applied to this standard procedure to assess a broader evaluation of the friction materials under study. The first modification was related to the bedding procedure. As known from the literature [42,43], the emission behavior of brake couples requires longer bedding than the frictional behavior. Thus, the number of brake stops was increased to a total of 196 and the emissions were evaluated in the following 96 brake stops. The braking parameters were the following: simulated brake pressure 15–46 bar, vehicle speed 80–30 km/h, and initial disc temperature 100 °C. The second modification consisted of testing only the simulated brake pressures of 10, 20, 40, and 80 bar in the speed/pressure sensitivity sections and the section pressure line of 500 °C. The third modification regarded the substitution of the Fade 2 section with 6 brake stops under more severe braking conditions to increase the stress level on the material, eventually observing a more marked decrease in the friction coefficient—the so-called fade effect. In the first 5 brake stops, the vehicle speed ranged from 225 to 80 km/h, with a braking deceleration of 0.7 g, while the sixth brake stop had a vehicle speed ranging from 225 to 0 km/h, with a braking deceleration of 1.1 g. In this brake stop, the initial disc temperature increased from 60 to 520 °C, where the highest temperature exceeded 700 °C.
The emitted airborne particles were measured in terms the of number with the same TSI® Optical Particle Sizer (OPS, shown in Figure 2) used for the PoD tests. The evolution of particles emitted was obtained after synchronizing the dynamometer data with those from the OPS using a Matlab® script. The representative values for emissions were considered as the mean concentration per each brake. At its inlet, the OPS is connected to a diluter of factor 10 to guarantee measurements within the limit of the OPS. The airflow was set at 0.8 m3/min; for further details on the system for emission measurements refer to [43].
2.2.3. Characterization of the Waste and the Worn Mated Surfaces
To understand the composition of the PP waste in detail, different characterization techniques were adopted. The X-ray diffraction (XRD, Italstructures IPD3000 diffractometer with an Inel CPS120 detector, Riva del Garda, TN, Italy) technique was used to analyze the phase constituents of the waste. The scanning electron microscope (SEM, make: JEOL IT300), also equipped with energy-dispersive X-ray spectroscopy (EDXS, make: Bruker), was used to obtain the morphology and the composition of different PP waste particles. The SEM and EDXS analyses were also used to analyze the worn pin and disc surfaces to understand the secondary contact plateau characteristics: smoothness, extension, and composition. The maps of worn surfaces for selected elements were also obtained to understand the distribution of alloying elements. A total of 6 maps at different locations on different pins were collected to obtain repeatability in the results.
3. Results
3.1. Characterization of the Waste Derived from the Plasma Cutting of Aluminum Products
Figure 3 presents the typical XRD pattern collected from the PP waste. Despite numerous trials on different batches of waste powders, only one phase was recorded, namely a spinel with composition MgAl2O4 (magnesium aluminate). This spinel is known to have high hardness [44].
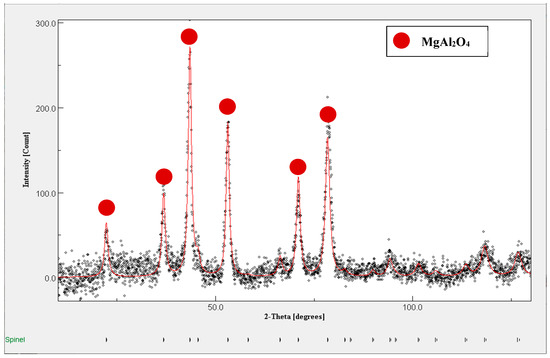
Figure 3.
XRD patterns of the PP waste. From the data, the PP waste is observed to contain only one phase: spinel.
Figure 4 provides the details on the morphology of two different categories of PP waste particles. In Figure 4a,b, both particles are quite flat and have flakes attached onto their surfaces. An average analysis of the point EDXS analysis conducted on different sites of different PP waste particles are presented in Table 4. Irrespective of the flakes or the flat region, the particles predominantly contain Al, O and Mg, confirming that they are mainly constituted by Mg aluminate. Traces of Fe and Mn are also present (as compared to Table 1).

Figure 4.
(a,b) SEM images of the morphologies of different PP waste particles.
Table 4.
Point EDXS analysis on PP waste particles.
Lastly, the density variation of pin specimens with the addition of PP waste is shown in Figure 5. A gradual decrease in the density is observed with the increase in the PP waste content, the least demonstrated by CFM with a 20 wt.% of PP.
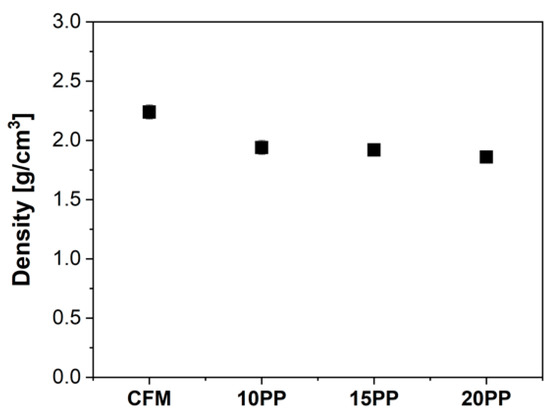
Figure 5.
Density of reference CFM and with PP waste additions.
3.2. Determination of the Most Suitable PP Waste Content in the CFM Formulation
Figure 6 shows the typical CoF and emission traces for CFM and with PP additions. Figure 6a shows the CoF trace. The reference CFM trace, shown in black, observes an initial ‘run-in’ condition, followed by ‘steady-state’ attainment beyond 2500 s. The fluctuations are seen to be at a minimum. The CFM with the 10 PP, 15 PP, and 20 PP additions are shown in red, blue, and green, respectively. In the case of 10 PP (red trace), an increase in the CoF magnitude is recorded, followed by a decrease, and the subsequent steady state attainment. On the other hand, the 15 PP and 20 PP show a gradual increase in the friction trace, followed by the steady state attainment. It must be noted that the steady state CoF magnitude for all three PP waste addition specimens are highly similar to each other. Figure 6b shows the emission trends. The reference CFM trends, shown in black, achieve a steady state right from the beginning of the test. The fluctuations observed in the traces are characteristic to any emission graph. The emission magnitude of CFM with the 10 PP, 15 PP, and 20 PP additions are shown in red, blue, and green, respectively. In the case of 10 PP, the emission magnitude is similar to the reference CFM. On the other hand, the CFM additions with 15 PP and 20 PP are observed to increase gradually with the increase in the waste content, where the CFM with 20 PP has the relatively highest emission magnitude. Additionally, in the case of the CFM with 20 PP, considerable ‘instability’ in the traces were observed. This instability could be attributed to the high PP presence, which is expected to behave as an abrasive. The PP could potentially create and remove deposited wear debris on the worn surfaces, leading to this observation.

Figure 6.
(a) CoF traces; (b) emission traces of reference CFM and with PP waste addition.
Figure 7 compares the steady state CoF magnitude, specific wear coefficient of pins, and average particle concentration (emissions) of reference CFM, and with the PP additions. The steady state CoF magnitude comparison is shown in Figure 7a. The PP waste addition at 10 PP, 15 PP, and 20 PP results in an increase in the CoF magnitude, when compared to the reference CFM. Interestingly, irrespective of the waste content, the CFM with 10 PP, 15 PP, and 20 PP have similar steady state CoFs (0.51–0.52). Figure 7b shows the pin wear. With the increase in the waste addition, the pin wear is also seen to increase, when compared to the reference CFM. The CFM with 10 PP and 15 PP additions have similar pin wear magnitude. The CFM with 20 PP addition has the relatively highest pin wear. Nevertheless, for all four classes of specimens, the pin wear was categorized into the mild to severe wear regimen (above 2 × 10⁻¹⁴ m2/N and below 10−13 m2/N) [21]. The average emission magnitude is shown in Figure 7c. The emission magnitude of 10 PP is similar to the reference CFM. With the increase of the waste addition to the CFM with 15 PP and 20 PP, a gradual increase in the emission magnitude is observed. Nevertheless, all the emission magnitudes are well below 800 #/cm3.

Figure 7.
Comparison of (a) steady state CoF trends; (b) specific wear coefficient of pin; and (c) emission characteristics.
From the friction, wear, and emission characteristics, it can be seen that the CFM with 10 PP additions shows trends similar or closer to the reference CFM. The CFM with 10 PP has the same CoF as other waste additions, lowest pin wear as compared to other waste-containing specimens, and similar emission trends to the reference CFM. The CFM with 15 PP has a permissible CoF magnitude and pin wear. However, a slight increase in emissions is observed with respect to the reference CFM, accompanied by a rather large and unacceptable scatter in the data. Hence, from preliminary analysis, the CFM with 10 PP waste addition was considered to be the most suitable/desirable alternative compared to the others.
3.3. Subscale Dynamometric Analysis
Figure 8 depicts the typical overall CoF trend, with respect to the speed-pressure sensitivity sections of SAE J2522 for the reference CFM and with the addition of 10 PP waste. As seen from Figure 8, both formulations displayed a decrease in CoF with pressure for all tested velocities. From the brake pressures of 10 to 40 bar and the velocity from 40 to 120 km/h, the CFM with 10 PP exhibited a higher friction coefficient, as compared to the original CFM, whereas, at the highest pressure of 80 bar, the friction coefficient is comparable. At a velocity of 160 km/h, the two formulations displayed almost the same friction coefficient at each tested pressure. On the other hand, for a further increase in velocity (to 200 km/h), both formulations displayed an increase in the friction coefficient. However, for this velocity, the trend is opposite: the friction coefficient of CFM with 10 PP is lower than the base CFM. This means that as the increase was more marked between 160 and 200 km/h, the CFM material had a higher sensitivity to the velocity. The velocity sensitivity is, in general, comparable, whereas the sensitivity to pressure of the CFM with 10 PP is higher than that for the CFM: the variation from low to high pressure is higher than that for the CFM at the velocities from 40 to 120 km/h. As mentioned, the initial disc temperature in these sections was 100 °C. The maximum (or peak) temperature achieved during braking is often useful for the interpretation of the results. It increased with the pressure and mainly the speed. For instance, the peak temperatures are below 125, 180, 230, and 270 °C at 40, 80, 120, and 200 km/h, respectively, of the initial speed.

Figure 8.
Typical behavior of the friction coefficient at different pressure and velocity during the speed-pressure sensitivity sections of SAE J2522 for the tested friction materials of CFM and CFM with 10 PP waste addition.
In the Fade-1 and Increasing Temperature 500 °C sections, the CFM showed a stable behavior and a monotonous increase in the friction coefficient respectively. To consider Figure 9, on the other hand, in the two sections, the friction coefficient for the CFM with 10 PP displayed fluctuations. However, for both formulations, the values of the friction coefficient are relatively high and acceptable. In the section pressure line 500 °C, the two formulations displayed similar behaviors. The most severe braking conditions were tested in the section Modified Fade-2. A clear decrease of the friction coefficient is observed with repeated brake stops; hence higher disc temperatures are used. The two formulations showed the same trend. However, the friction of the CFM with 10 PP displayed lower values. The CFM with 10 PP showed a slightly less stable (Fade-1 and Increasing Temperature) and lower (Modified Fade-2) friction coefficient, respectively, but the values were always above 0.35 and are considered acceptable for the application.

Figure 9.
Typical behavior of the friction coefficient during the Fade-1, Increasing Temperature and Pressure line 500 °C of SAE J2522, and Modified-Fade-2 for the tested friction materials CFM and CFM with 10 PP.
The total mass losses of the friction materials and the disc measured at the end of the brake cycle are shown in Figure 10 for both brake couples. The brake couple of the CFM with 10 PP displayed higher loss masses for both the friction material and the disc compared to the reference CFM brake couple. This result agrees with the PoD results.

Figure 10.
Mass losses for the CFM, CFM with 10 PP, and the respective discs.
Regarding the emissions, the evaluation is related to a specific section after the bedding procedure when a certain degree of stability is attained. Figure 11 shows the cumulative distribution of mean concentrations related to this specific section, which consists of 96 brake stops in the bedding conditions (80 → 30 km/h for the range of speed, 15–46 bar of brake pressure, and an initial disc velocity of 100 °C). For the CFM, the average value is in the range of 950 ± 150 #/cm3, whereas the CFM with 10 PP displays values in the range of 1150 ± 250 #/cm3. From the cumulative distribution in Figure 11, approx. 20% of the values exceed the maximum values recorded for the original CFM. Although the emissions on the CFM with 10 PP are only slightly higher than the original formulation, the comparable emission behavior can be considered as a promising result.

Figure 11.
Cumulative distribution of mean emission concentrations of CFM and CFM with 10 PP in the specific section.
3.4. Characterization of Worn Pin Surfaces
Figure 12 shows the worn reference CFM pin surface characteristics and the corresponding EDXS maps of selected elements. Figure 12a shows the backscattered SEM image. The surface is seen to contain differently colored regions. The white regions are the steel fibers, corroborated by the Fe maps. Beside these steel fibers, light gray areas can be observed. These gray areas are compacted and tend to stay in and around the vicinity of the steel fibers. These are secondary contact plateaus, which are formed by the compaction of wear debris generated from the mated surfaces during the dry sliding tests. These secondary contact plateaus are extremely pivotal as they are known to govern friction, wear, and emission characteristics [21,22,45]. From the EDXS maps, the plateaus are made of Fe and O (through the elements’ presence in the region where the plateaus are established). An overlapping of these Fe and O maps infers the presence of Fe oxides as the main constituent. The other region includes the graphite, which is denoted by the black color and the C map. Alternatively, the dark gray regions are attributed to the presence of vermiculite.

Figure 12.
(a) worn CFM pin surface; (b) corresponding EDXS maps of selected elements.
Figure 13 shows the worn pin surface characteristics and the corresponding selected EDXS maps of CFM with different PP waste additions. Like Figure 12, the worn surface comprises steel fibers, secondary contact plateaus, and graphitic regions. Additionally, the secondary contact plateau composition remains similar to Figure 12a. Visually, it can be noticed that the extension of the secondary contact plateaus is higher with the PP-containing specimens (Figure 13a,g,m), as compared to the reference CFM (Figure 12a).

Figure 13.
Worn top surfaces of CFM with waste: (a–f) 10 PP; (g–l) 15 PP; (m–r) 20 PP.
To further understand the composition of secondary contact plateaus, Table 5 provides the average of point EDXS analysis conducted on ten different secondary contact plateau sites on multiple worn pin surfaces. As seen from the maps in Figure 12 and Figure 13, the secondary contact plateaus mainly constitute Fe and O, symbolizing Fe oxides. The Fe and O content in the CFM and with PP waste additions are similar. It should be noted that the Al content is observed to increase with an increase in the PP content, when compared to the reference CFM. This signifies the presence of PP in the secondary contact plateaus. The other minor elements present in the secondary contact plateaus are Mg, Si, Ca, Cr, Zn, and Sn.
Table 5.
Average of point EDXS analysis on the secondary contact plateaus deposited on pins.
The observations with the CFM and CFM with 10 PP coupons are similar to the worn pin surfaces (concerning the composition and extension of the worn surfaces and secondary contact plateaus, respectively). Hence, the analysis is not repeated here.
3.5. Characterization of Worn Disc Surfaces Paired with Pins
Figure 14 presents the worn disc surface characteristics paired with the reference CFM pins and with PP additions. Figure 14a shows the worn disc surface tested with the reference CFM pin. The sliding direction can be clearly appreciated. The surface is covered by few scratches, signifying abrasive action. Figure 14b–d show the worn disc surfaces paired with the CFM pin with 10 PP, CFM pin with 15 PP, and CFM pin with 20 PP, respectively. In all cases, the number of scratches on the worn surfaces is more than the reference CFM in Figure 14a. Additionally, the intensity of abrasions/scratches on the worn surface is seen to increase as we pass from the CFM with 10 PP to CFM with 15 PP and 20 PP, inferring the relatively highest abrasive action being on the worn disc surface tested with the CFM with 20 PP waste addition. Similar observations were also recorded for discs paired with CFM and CFM with 10 PP coupons. Hence, the analysis is not repeated here.

Figure 14.
Worn surfaces of discs (a) CFM; (b) CFM with 10 PP; (c) CFM with 15 PP; and (d) CFM with 20 PP.
4. Discussion
The PP waste analyzed in this study was tested as-received or as-produced. This means that the waste was not subjected to any sort of pre-treatment (heat treatment or sieving) by any parties. In a previous study conducted on waste generated during an aluminum anodizing process [23], wastes containing particles with a size of less than 90 µm and void of any moisture were seen to be feasible additions in any kind of friction material formulation. In this case, the PP wastes fit all the criteria without any additional processes.
As mentioned previously, the CFM formulation is a highly tested and optimized composition, which is already being used in car braking applications. Any change in the composition, however small it maybe, will create variations in the well-balanced friction, wear, and emission characteristics of the system. Hence, in this study, the PP waste did not replace any constituent of the CFM formulation, but was accommodated by reducing the CFM content as a whole. This study focuses on the preliminary addition of the PP waste in this kind of formulation. After positive evaluation, the next step is to incorporate the waste as an alternative constituent in the CFM.
- Determination of the Most Suitable PP Content in the CFM formulation
In this paper, four different formulations were evaluated. The CFM with 10 wt.% PP addition was termed to be the most suitable addition. It is already established that the PP constitutes magnesium aluminate. All PP waste additions provided similar CoF magnitudes between 0.51 and 0.52, compared to the reference CFM magnitude of 0.45. As seen in Figure 13 and Table 5, the Al content is seen to be present and increases in the secondary plateaus for PP-containing specimens. This shows that the PP waste particles enter the secondary contact plateaus, causing abrasive action on the mating surfaces, thereby increasing the CoF. The CoF with the PP additions remains unchanged due to the waste content. In a study mentioned previously [23], the wastes were added at 12, 24, and 32 wt.% content. A drastic increase in the CoF magnitude was observed only beyond 30 wt.%. The CoF was similar at 12 and 24 wt.% addition. Hence, also in this case, it could be noted that an increase in the PP content to 30 wt.% could fetch higher CoF magnitudes. The abrasive nature of the PP waste particles can be further established using the worn disc surface characteristics in Figure 14. As the PP waste content increased, the scratches/abrasions on the disc surface increased, when compared to the reference CFM. This led to the greater removal of disc material, resulting in the higher extension of the secondary plateaus on the PP-containing specimens (Figure 13).
Concerning pin wear, in general, the wear is higher with the addition of PP waste when compared to the reference CFM. The relatively highest pin wear is presented by CFM with 20 PP. Owing to the PP being abrasive in nature, as its content increases, the abrasivity of the system also increases. However, with a very high PP content, though the extension increases, the compactness of the secondary contact plateaus decreases. The PP, along with already present abrasives, in the CFM restrict/disturb the formation of very compact secondary plateaus. Figure 15 provides high magnification images of the secondary contact plateaus deposited on the CFM with 20 PP. The loosely compacted secondary contact plateaus for 20 PP can be clearly observed and are marked for reference. Additionally, as mentioned previously, with the increase in the PP addition, the CFM constituents decrease, which also include lubricants. As lubricants help in the effective compaction of secondary contact plateaus, a significant decrease below a certain threshold can affect the compaction of secondary contact plateaus. [23].

Figure 15.
High magnification of the worn CFM with 20 PP pin surface image. The uncompacted secondary contact plateaus are marked in the Figure.
The particulate matter emissions were observed to increase with an increase in the PP content. These two parameters are interlinked with each other. The higher the material/uncompacted debris removed from the surface, the greater the pin wear and number of particles captured by the OPS.
- Observations on the Comparison of the PoD and Subscale Dynamometric Studies
With the addition of 10 wt.% of PP in the CFM formulation, and after being studied using two pieces of equipment, it is important to note that the results with the two methods are highly similar to each other.
The higher wear of the material with plasma powder additions were confirmed in both pieces of equipment; this is ascribable to the abrasive character of the plasma powder towards the disc counterface. This abrasive character also has two important consequences on the friction behavior: first, a direct contribution to the friction coefficient is due to the disc abrasion; second, the extension of the secondary plateaus is promoted by the higher, but still controlled, disc wear. SEM analysis after PoD tests (Figure 13) confirmed that the CFM with 10 PP featured secondary plateaus larger in number and extension compared to the base material. A higher coverage by the secondary plateaus means a larger area of contact, hence a higher friction coefficient according to the theory of adhesion [46]. The sliding velocity in the PoD was 1.51 m/s and the average sliding speed ranged from 2 to 10 m/s in the s-p sensitivity blocks at 40, 80 and 120 km/h of initial vehicle speed, respectively (Figure 8). For this range of velocity, the wear is controlled, and the stable secondary plateaus determine the friction coefficient featuring the typical decreasing trend with pressure and velocity [47,48]. Usually, the friction coefficient deceases with the applied pressure because of a disproportional and lower increase in the contact area [49,50]. The trend with the velocity is also decreasing as it involves the weakening of the secondary plateaus [51] and a lower work of adhesion due to higher temperatures [52].
The decrease in the friction coefficient with velocity was observed up to 160 km/h, where the two materials showed almost identical results. However, at 200 km/h, the friction increased for both materials and the base CFM, contrary to that observed at lower velocities, and a higher friction coefficient than the CFM with 10 PP was observed. High velocities, and consequently relatively high temperatures in the range of 200 to 260 °C, can promote high wear rates involving a high coverage of the surface due to the large amount of poorly compacted wear particles collecting on the surface. The higher coverage is often associated with unexpectedly high values of the friction coefficient [53]. This variation in the wear mechanism is considered to be responsible for the variation of the trend with the velocity, passing from 160 to 200 km/h (Figure 9). In the reference CFM, this behavior is more marked: we observed a higher increase and higher values of the friction coefficient compared to the CFM with 10 PP, contrary to that observed between 40 and 120 km/h. This behavior could be attributed to the better degree of compaction and higher extension of the secondary plateaus featured by the CFM with 10 PP, compared to the reference material, as shown after the PoD tests (Figure 13). The capability of the tribosystem to prevent excessive wear and control the friction coefficient is strictly correlated with the compactness and extension of the secondary plateaus as they improve the lubrication of the system and, thus, the accommodation of the shear stresses [50,54]. This means that the better lubrication in the CFM with 10 PP mitigated the increase in the friction coefficient induced to the higher wear rate.
At lower velocities, the wear is lower and the secondary plateaus are stable and less extended. For this reason, the system’s lubrication has a lower influence: the friction coefficient is controlled by the secondary plateaus, the abrasive character and greater extensions.
With the addition of 10 wt.% of plasma powder into the formulation, a fraction of the solid lubricants and other ingredients were reduced. Solid lubricants play an important role in controlling the friction coefficient at high temperatures. From the considered blocks at high temperatures (Figure 9), we can state that the addition of 10 wt.% of plasma powder displayed a response comparable to the base CFM. The CFM with 10 PP maintains good lubrication at the most severe braking conditions (Modified Fade-2, Figure 9), showing a higher decrease, still adequate for safe braking actions, of the friction coefficient compared to the base material.
Regarding the emissions, in both pieces of equipment, the material with the plasma powder addition displayed slightly higher values, but they are still in the comparable range. This is in broad agreement with the more abrasive character of the friction materials and to the more extended secondary plateaus [38].
From the exhaustive analysis conducted, positive results were recorded with 10 wt.% PP addition in the CFM. The next part of this work includes the replacement of few abrasives in the CFM by the PP waste and its subsequent testing and evaluation.
5. Conclusions
In this study, wastes derived during the plasma cutting of aluminum products made of Al5083 were added in a commercial friction material formulation and evaluated to understand its feasibility of use for car braking applications.
- The waste, titled PP, constituted only a single phase: Spinel (MgAl2O4). The SEM analysis revealed the particles to be flat with flakes attached onto their surfaces. The EDXS analysis revealed a high Al, Mg, and O content.
- The study was divided into two parts. The first part was dedicated to understanding the most feasible PP content in the commercial friction material (CFM) formulation, with 10, 15, and 20 wt.% addition (in the form of pins). The analysis was conducted on a PoD tribometer. It was revealed that the analysis with the PP content presented a higher CoF and pin wear compared to the reference CFM, which was attributed to the abrasive nature of the waste. All PP-containing CFM revealed similar CoFs. As the PP content increased, the emissions increased with it due to the increase in the pin wear. The secondary contact plateaus of worn PP surfaces had a similar composition, characteristics, and higher extension when compared to the reference CFM. The 10 wt.% PP was selected as the most suitable content as it displayed permissible CoFs and pin wear, and had similar emission and secondary contact plateau trends to the reference CFM.
- In the second part of the study, the reference CFM and CFM with 10 wt.% PP were tested on a subscale dynamometer according to a modified version of SAE J 2522 to include the evaluation of the emissions. The analysis confirmed that the CFM with 10 PP has an adequate friction coefficient at both moderate and severe braking conditions. In agreement with the PoD tests, the friction coefficient for the CFM with 10 PP showed higher values than the base materials at low and intermediate velocities. In addition, the wear of the CFM with 10 PP is in agreement with the results obtained with the PoD tests: they were slightly higher, still permissible, with wear of both of the disc and friction material. Finally, the emissions for the CFM with 10 PP were also slightly more comparable to the base CFM.
- Through this study, the positive aspect of the addition of PP waste was evaluated thoroughly, prompting further studies and implementation in other kinds of friction material formulation, and the possible replacement of a few abrasives in the CFM composition by the waste.
Author Contributions
Conceptualization, G.S., P.J., and S.C.; methodology, P.J., G.S., and S.C.; validation, G.S., M.L., and C.F.; formal analysis, P.J., and S.C.; investigation, P.J., S.C., and G.S.; resources, C.F.; writing—original draft preparation, P.J., and S.C.; writing—review and editing, G.S., M.L., and C.F.; visualization, G.S.; supervision, G.S.; project administration, P.J.; funding acquisition, G.S. All authors have read and agreed to the published version of the manuscript.
Funding
The publication was created with the co-financing of the European Union-FSE-REACT-EU, PON Research and Innovation 2014–2020 DM1062/2021.
Data Availability Statement
Data will be made available upon request to the corresponding author.
Conflicts of Interest
The authors declare no conflict of interest.
Abbreviation
| Abbreviation | Description |
| CFM | Commercial friction material formulation |
| CoF | Coefficient of friction |
| EDXS | Energy dispersive X-ray spectroscopy |
| OPS | Optical particle sizer spectrometer |
| PoD | Pin-on-disc testing equipment |
| PP | Plasma powder |
| SEM | Scanning electron microscopy |
| XRD | X-ray diffraction |
References
- Tseng, M.L.; Tan, R.R.; Chiu, A.S.F.; Chien, C.F.; Kuo, T.C. Circular economy meets industry 4.0: Can big data drive industrial symbiosis? Resour. Conserv. Recycl. 2018, 131, 146–147. [Google Scholar] [CrossRef]
- Domenech, T.; Bleischwitz, R.; Doranova, A.; Panayotopoulos, D.; Roman, L. Mapping Industrial Symbiosis Development in Europe_ typologies of networks, characteristics, performance and contribution to the Circular Economy. Resour. Conserv. Recycl. 2019, 141, 76–98. [Google Scholar] [CrossRef]
- Baldassarre, B.; Schepers, M.; Bocken, N.; Cuppen, E.; Korevaar, G.; Calabretta, G. Industrial Symbiosis: Towards a design process for eco-industrial clusters by integrating Circular Economy and Industrial Ecology perspectives. J. Clean. Prod. 2019, 216, 446–460. [Google Scholar] [CrossRef]
- Gregson, N.; Crang, M.; Fuller, S.; Holmes, H. Interrogating the circular economy: The moral economy of resource recovery in the EU. Econ. Soc. 2015, 44, 218–243. [Google Scholar] [CrossRef]
- Gangwar, S.; Pathak, V.K. A critical review on tribological properties, thermal behavior, and different applications of industrial waste reinforcement for composites. Proc. Inst. Mech. Eng. Part L J. Mater. Des. Appl. 2021, 235, 684–706. [Google Scholar] [CrossRef]
- Gehlen, G.S.; Neis, P.D.; Barros, L.Y.; Poletto, J.C.; Ferreira, N.F.; Amico, S.C. Tribological performance of eco-friendly friction materials with rice husk. Wear 2022, 500–501, 204374. [Google Scholar] [CrossRef]
- Nogueira, A.P.G.; da Silva Gehlen, G.; Neis, P.D.; Ferreira, N.F.; Gialanella, S.; Straffelini, G. Rice husk as a natural ingredient for brake friction material: A pin-on-disc investigation. Wear 2022, 494–495, 204272. [Google Scholar] [CrossRef]
- Mgbemena, C.O.; Mgbemena, C.E.; Okwu, M.O. Thermal stability of pulverized palm kernel shell (PKS) based friction lining material locally developed from spent waste. ChemXpres 2014, 5, 115–122. [Google Scholar]
- Ikpambese, K.K.; Gundu, D.T.; Tuleun, L.T. Evaluation of palm kernel fibers (PKFs) for production of asbestos-free automotive brake pads. J. King Saud Univ.-Eng. Sci. 2016, 28, 110–118. [Google Scholar] [CrossRef]
- Sahin, A.E.; Cetin, B.; Sinmazcelik, T. Effect of mussel shell reinforcement on mechanical and tribological behavior of polyphenylene sulfide composites. J. Thermoplast. Compos. Mater. 2020, 35. [Google Scholar] [CrossRef]
- Dwiwedi, S.K.; Srivastava, A.K.; Chopkar, M. Fabrication and dry sliding wear study of Al6061/mussel-shell particulate composites. SN Appl. Sci. 2019, 1, 721. [Google Scholar] [CrossRef]
- Aku, S.Y.; Yawas, D.S.; Madakson, P.B.; Amaren, S.G. Characterization of Periwinkle Shell as Asbestos-Free Brake Pad Materials. Pac. J. Sci. Technol. 2012, 13, 57–63. [Google Scholar]
- Elakhame, Z.U.; Olotu, O.O.; Abiodun, Y.O.; Akubueze, E.U.; Akinsanya, O.O.; Kaffo, P.O.; Oladele, O.E. Production of Asbestos Free Brake Pad Using Periwinkle Shell as Filler Material. Int. J. Sci. Eng. Res. 2017, 8, 1728–1735. [Google Scholar]
- Wang, Z.; Hou, G.; Yang, Z.; Jiang, Q.; Zhang, F.; Xie, M.; Yao, Z.J. Influence of slag weight fraction on mechanical, thermal and tribological properties of polymer based friction materials. Mater. Des. 2016, 90, 76–83. [Google Scholar] [CrossRef]
- Mat, V.; Jayashree, P.; Leonardi, M.; Vl, J.; Sabov, T. Utilization of Metallurgical Slags in Cu-Free Friction Material Formulations. Lubricants 2022, 10, 219. [Google Scholar] [CrossRef]
- Prasad, N. Dry Sliding Wear Behavior of Aluminium Matrix Composite Using Red Mud an Industrial Waste. Int. Res. J. Pure Appl. Chem. 2013, 3, 59–74. [Google Scholar] [CrossRef]
- Dinaharan, I.; Nelson, R.; Vijay, S.J.; Akinlabi, E.T. Microstructure and wear characterization of aluminum matrix composites reinforced with industrial waste fly ash particulates synthesized by friction stir processing. Mater. Charact. 2016, 118, 149–158. [Google Scholar] [CrossRef]
- Kumar, H.; Prasad, R.; Srivastava, A.; Vashista, M.; Khan, M.Z. Utilisation of industrial waste (Fly ash) in synthesis of copper based surface composite through friction stir processing route for wear applications. J. Clean. Prod. 2018, 196, 460–468. [Google Scholar] [CrossRef]
- Binda, F.F.; De Alvarenga Oliveira, V.; Fortulan, C.A.; Palhares, L.B.; Dos Santos, C.G. Friction elements based on phenolic resin and slate powder. J. Mater. Res. Technol. 2020, 9, 3378–3383. [Google Scholar] [CrossRef]
- Kinuthia, J.M.; Nidzam, R.M. Towards zero industrial waste: Utilisation of brick dust waste in sustainable construction. Waste Manag. 2011, 31, 1867–1878. [Google Scholar] [CrossRef]
- Jayashree, P.; Matějka, V.; Foniok, K.; Straffelini, G. Comparative Studies on the Dry Sliding Behavior of a Low-Metallic Friction Material with the Addition of Graphite and Exfoliated g-C3N4. Lubricants 2022, 10, 27. [Google Scholar] [CrossRef]
- Menapace, C.; Leonardi, M.; Matějka, V.; Gialanella, S.; Straffelini, G. Dry sliding behavior and friction layer formation in copper-free barite containing friction materials. Wear 2018, 398–399, 191–200. [Google Scholar] [CrossRef]
- Jayashree, P.; Straffelini, G. The Influence of the Addition of Aluminum Anodizing Waste on the Friction and Emission Behavior of Different Kinds of Friction Material Formulations. Tribol. Int. 2022, 173, 107676. [Google Scholar] [CrossRef]
- Boz, M.; Kurt, A. The effect of Al2O3 on the friction performance of automotive brake friction materials. Tribol. Int. 2007, 40, 1161–1169. [Google Scholar] [CrossRef]
- Tomášek, V.; Kratošová, G.; Yun, R.; Fan, Y.; Lu, Y. Effects of alumina in nonmetallic brake friction materials on friction performance. J. Mater. Sci. 2009, 44, 266–273. [Google Scholar] [CrossRef]
- Sugözü, B.; Dağhan, B.; Akdemir, A. Effect of the size on the friction characteristics of brake friction materials: A case study with Al2O3. Ind. Lubr. Tribol. 2018, 70, 1020–1024. [Google Scholar] [CrossRef]
- Straffelini, G.; Gialanella, S. Airborne particulate matter from brake systems: An assessment of the relevant tribological formation mechanisms. Wear 2021, 478–479, 203883. [Google Scholar] [CrossRef]
- Grigoratos, T.; Martini, G. Brake wear particle emissions: A review. Environ. Sci. Pollut. Res. 2015, 22, 2491–2504. [Google Scholar] [CrossRef]
- Amato, F.; Cassee, F.R.; Denier van der Gon, H.A.C.; Gehrig, R.; Gustafsson, M.; Hafner, W.; Harrison, R.M.; Jozwicka, M.; Kelly, F.J.; Moreno, T.; et al. Urban air quality: The challenge of traffic non-exhaust emissions. J. Hazard. Mater. 2014, 275, 31–36. [Google Scholar] [CrossRef]
- Menapace, C.; Mancini, A.; Federici, M.; Straffelini, G.; Gialanella, S. Characterization of airborne wear debris produced by brake pads pressed against HVOF-coated discs. Friction 2020, 8, 421–432. [Google Scholar] [CrossRef]
- Kwak, J.H.; Kim, H.; Lee, J.; Lee, S. Characterization of non-exhaust coarse and fine particles from on-road driving and laboratory measurements. Sci. Total Environ. 2013, 458–460, 273–282. [Google Scholar] [CrossRef] [PubMed]
- Piscitello, A.; Bianco, C.; Casasso, A.; Sethi, R. Non-exhaust traffic emissions: Sources, characterization, and mitigation measures. Sci. Total Environ. 2021, 766, 144440. [Google Scholar] [CrossRef] [PubMed]
- Lucadamo, G.; Yang, N.Y.C.; Marchi, C.S.; Lavernia, E.J. Microstructure characterization in cryomilled Al 5083. Mater. Sci. Eng. A 2006, 430, 230–241. [Google Scholar] [CrossRef]
- Zhou, C.; Yang, X.; Luan, G. Fatigue properties of friction stir welds in Al 5083 alloy. Scr. Mater. 2005, 53, 1187–1191. [Google Scholar] [CrossRef]
- Jayashree, P.; Rustighi, E.; Straffelini, G. OPEN A novel study on the reduction of non-exhaust particulate matter emissions through system vibration control. Sci. Rep. 2022, 12, 7478. [Google Scholar] [CrossRef]
- Leonardi, M.; Alemani, M.; Straffelini, G.; Gialanella, S. A pin-on-disc study on the dry sliding behavior of a Cu-free friction material containing different types of natural graphite. Wear 2020, 442–443, 203157. [Google Scholar] [CrossRef]
- Matějka, V.; Leonardi, M.; Praus, P.; Straffelini, G.; Gialanella, S. The Role of Graphitic Carbon Nitride in the Formulation of Copper-Free Friction Composites Designed for Automotive Brake Pads. Metals 2022, 12, 123. [Google Scholar] [CrossRef]
- Nogueira, A.P.G.; Carlevaris, D.; Menapace, C.; Straffelini, G. Tribological and emission behavior of novel friction materials. Atmosphere 2020, 11, 1050. [Google Scholar] [CrossRef]
- Jayashree, P.; Sinha, A.; Gialanella, S.; Straffelini, G. Dry Sliding Behavior and Particulate Emissions of a SiC-Graphite Composite Friction Material Paired with HVOF-Coated Counterface. Atmosphere 2022, 13, 296. [Google Scholar] [CrossRef]
- Candeo, S.; Federici, M.; Leonardi, M.; Straffelini, G. Brake Performance Maps for a Cu-Free Friction Material with Different Scorching Conditions. Tribol. Trans. 2021, 64, 540–550. [Google Scholar] [CrossRef]
- Commercial, H.; Vehicles, G.; Dynamics, C.F. Vehicle Recommended Aerospace. In Dynamometer Global Brake Effectiveness; SAE Paper No. J252; SAE: Warrendale, PA, USA, 2014. [Google Scholar]
- Matějka, V.; Metinöz, I.; Wahlström, J.; Alemani, M.; Perricone, G. On the running-in of brake pads and discs for dyno bench tests. Tribol. Int. 2017, 115, 424–431. [Google Scholar] [CrossRef]
- Candeo, S.; Nogueira, A.P.; Leonardi, M.; Straffelini, G. A study of friction, wear and particulate emissions during the bedding stage of a Cu-free friction material. Wear 2021, 486–487, 204095. [Google Scholar] [CrossRef]
- Sickafus, K.E.; Wills, J.M.; Grimes, N.W. Structure of spinel. J. Am. Ceram. Soc. 1999, 82, 3279–3292. [Google Scholar] [CrossRef]
- Federici, M.; Straffelini, G.; Gialanella, S. Pin-on-Disc Testing of Low-Metallic Friction Material Sliding Against HVOF Coated Cast Iron: Modelling of the Contact Temperature Evolution. Tribol. Lett. 2017, 65, 121. [Google Scholar] [CrossRef]
- Straffelini, G. Friction and Wear: Methodologies for Design and Control; Springer: Cham, Switzerland, 2015; ISBN 978-3-319-05894-8. [Google Scholar]
- Chan, D.; Stachowiak, G.W. Review of automotive brake friction materials. Proc. Inst. Mech. Eng. Part D J. Automob. Eng. 2004, 218, 953–966. [Google Scholar] [CrossRef]
- Filip, P.; Kovarik, L.; Wright, M.A. Automotive brake lining characterization. SAE Tech. Pap. 1997. [CrossRef]
- Kumar, M.; Bijwe, J. Role of different metallic fillers in non-asbestos organic (NAO) friction composites for controlling sensitivity of coefficient of friction to load and speed. Tribol. Int. 2010, 43, 965–974. [Google Scholar] [CrossRef]
- ÖZtüRk, B.; Arslan, F.; Öztürk, S. Effects of different kinds of fibers on mechanical and tribological properties of brake friction materials. Tribol. Trans. 2013, 56, 536–545. [Google Scholar] [CrossRef]
- Kim, J.W.; Joo, B.S.; Jang, H. The effect of contact area on velocity weakening of the friction coefficient and friction instability: A case study on brake friction materials. Tribol. Int. 2019, 135, 38–45. [Google Scholar] [CrossRef]
- Straffelini, G. A simplified approach to the adhesive theory of friction. Wear 2001, 249, 78–84. [Google Scholar] [CrossRef]
- Ricciardi, V.; Travagliati, A.; Schreiber, V.; Klomp, M.; Ivanov, V.; Augsburg, K.; Faria, C. A novel semi-empirical dynamic brake model for automotive applications. Tribol. Int. 2020, 146, 106223. [Google Scholar] [CrossRef]
- Stott, F.H. The role of oxidation in the wear of alloys. Tribol. Int. 1998, 31, 61–71. [Google Scholar] [CrossRef]
Publisher’s Note: MDPI stays neutral with regard to jurisdictional claims in published maps and institutional affiliations. |
© 2022 by the authors. Licensee MDPI, Basel, Switzerland. This article is an open access article distributed under the terms and conditions of the Creative Commons Attribution (CC BY) license (https://creativecommons.org/licenses/by/4.0/).