1. Introduction
With 100% of the demand for cooling services in the building sector provided by electricity, cooling electricity use is the fastest-growing end-use sector, with global air conditioning (AC) ownership expected to be about 4 billion units in 2050 and global annual cooling electricity use about 3.0 trillion kWh, nearly a threefold increase from 2018 [
1]. Building cooling energy consumption is influenced by a warming climate and the growing use of AC systems, which undoubtedly overshadows the positive effects of the increasing energy efficiency of AC systems. In particular, buildings in cities will also face strong disturbances from urban heat islands [
2]. Thus, the path to energy-efficient buildings or full implementation of nearly zero energy buildings (nZEBs) seems long.
The quest to reduce primary energy demand for buildings’ AC has spurred researchers and companies to investigate innovative energy systems and passive technologies to improve the thermal performance of building envelopes [
3]. An important passive solution is to improve the performance of windows since the window component accounts for 45–60% of the energy consumption caused by the envelope [
4,
5]. The main factors of exterior windows affecting building energy consumption are the heat transfer coefficient (U), solar heat gain coefficient (SHGC), and window-to-wall ratio (WWR). Studies have shown that the energy-saving effect of reducing solar heat gain from exterior windows is more evident in some regions [
6,
7]. Therefore, the shading and WWR significantly impact the indoor thermal environment and the building’s energy consumption, which merit further investigation and discussion by researchers.
Shading devices for buildings are crucial in effectively protecting interior spaces from direct solar radiation through openings, windows, and large glazed surfaces [
8]. Nielsen et al. [
9] studied three types of façades (no shading, fixed shading, and dynamic shading), and the simulation results showed the potential of shading to reduce energy consumption significantly. Dutta et al. [
10] used the validated TRNSYS model to estimate buildings’ energy consumption and similarly demonstrated the significant energy-saving potential of shading. In the past standards [
11], the shading coefficient was used to measure shading effectiveness, but the SHGC replaced it in the latest standards [
12,
13]. De Gastines and Pattini [
6] concluded that a lower SHGC has more energy-saving potential than a lower heat transfer coefficient in Argentina’s mild winter climate. Lai et al. [
14] discussed the relationship between SHGC and latitude and showed that the optimal SHGC was 1.0 in high-latitude cities and 0.0 in low-latitude cities in China. In addition, the optimal SHGC is closely related to the season, so seasonal dynamic shading shows advantages in terms of energy, thermal environment, and light environment [
9,
15]. However, it should be pointed out that the total energy consumption, light, or thermal comfort without shading is not the worst compared to windows with shading. Thus, choosing inappropriate shading control strategies and design forms is not as good as having no shading [
16]. Therefore, the suitability of shading should be studied specifically for each design case, and the combined effect should also be studied in combination with other passive measures. Lai et al. [
14] also pointed out that the WWR is closely related to the total building load.
The WWR is considered to be another critical factor affecting indoor solar gain from the outdoors. Elghamry and Hassan [
17] studied the effect of the WWR on the heating and cooling loads and total energy consumption of an office building and noted that an increase in window size increases the solar heat gain indoors. The building’s cooling load is much heavier in low latitudes than in other regions, multiplying with an increasing WWR [
18]. Goia [
19] found that although there are optimal WWRs for each climate and orientation, most of the optimal values are found in a relatively narrow range (0.30 < WWR < 0.45) and minimize the total energy use in the four European climates.
The use of a lower WWR seems beneficial for reducing indoor cooling loads due to reducing direct solar heat gain. However, the reduction of window area undoubtedly has adverse effects on natural ventilation cooling. Elghamry and Hassan [
17] pointed out that the WWR has a strong relationship with indoor ventilation, and a larger WWR improves indoor airflow conditions. Wang et al. [
20] studied the impact of the WWR on indoor thermal comfort and found that the window’s opening should not be less than 20%. Liu et al. [
21] developed a smart glazing control strategy including shading, natural ventilation, and night-time cooling, and the simulation results showed that this smart glazing reduced building energy consumption by 60% compared to static glazing. Still, Liu [
21] failed to consider other factors affecting natural ventilation and only reflected it with a fixed flow rate. Besides, it is more meaningful to study the effect of the openable area of windows on ventilation than the WWR because it is the open area that determines the indoor cooling effect during ventilation. Furthermore, it should be noted that although building shading and natural ventilation are important strategies for passive cooling, their application in different modes (continuous or mixed-mode) of HVAC equipment operation has failed to attract extensive attention from researchers.
Mixed-mode (MM) ventilation approaches are becoming increasingly popular as a more energy-efficient alternative to conventional HVAC solutions. A mixed-mode building can achieve comfortable indoor environments by integrating natural ventilation and mechanical cooling strategies while minimizing reliance on energy-intensive HVAC systems [
22]. In addition, the occupants are also often highly rated for their satisfaction with the thermal environment [
23]. Despite the many advantages of MM buildings, however, there is no consensus on assessing occupants’ thermal comfort in MM buildings [
24]. Therefore, further research on the HVAC equipment’s start/stop and ventilation control strategies is needed.
Liu et al. [
25] proposed a controlling method of natural ventilation and AC coupling operation (mixed-mode) with outdoor temperatures as the control variable. They recommended that AC be operated when the outdoor temperature rises to 28.5 °C in Qionghai, with the AC operation temperature set at 28 °C. However, a thermal environment in free-running buildings defined by the evaluation standard [
26] should be evaluated using the adaptive expected mean vote (APMV). The upper limit of the operative temperature in the thermal environment category I is 28 °C. Thus, the AC operation temperature in Liu’s study did not correspond to this. Identical thermal environmental conditions that were deemed acceptable when the building was operating in the natural ventilation mode were found to be unacceptable by the same occupants in the same building during AC periods [
27]. For occupants of an AC building, thermal history comprises consistently cool, constant, uniform conditions, creating more stringent comfort criteria while biasing expectations towards constant HVAC setpoints [
28]. While occupants in naturally ventilated buildings can tolerate a more dramatic temperature fluctuation [
29], occupants in AC buildings will express dissatisfaction with small temperature fluctuations [
30]. The different operation modes obviously have an impact on the thermal comfort model that should be used [
31]. Therefore, the MM building should be divided into two different operation modes, free operation and air-conditioned operation, because the occupants experience different thermal sensations in them [
32].
Therefore, the technical standard for near-zero energy buildings recommends a controlling method for MM buildings, where the HVAC system should be operating to keep the indoor temperature from rising above 26 °C when the outdoor temperature is above 28 °C or other outdoor conditions are not suitable for natural ventilation [
13]. It means that AC’s target temperature in MM buildings is 26 °C, the same as in AC buildings. However, there are a lack of studies on indoor thermal comfort and building energy consumption under this mode.
In order to investigate the potential for energy savings and comfort improvements resulting from the interconversion between natural ventilation and air conditioning, this study proposes a new hybrid model based on the operational regulation method of MM buildings recommended by the standard [
13]. Then, a residential building in the hot summer and cold winter region of China was chosen as a typical model. Simulation methods were used to investigate how energy savings and indoor thermal comfort can be improved by the optimization of window opening area ratios and shading. It is hoped that this study will provide a reference for further research into energy-efficient design methods for buildings in the mixed-mode in this region.
2. Methods
A typical residential building in Chongqing, which is in China’s hot summer and cold winter region, was selected as the mock object. DesignBuilder software was used to construct a model based on the actual building. The building’s indoor thermal environment and energy consumption under different modes were simulated and analyzed.
2.1. Verification
It was considered essential to validate the software’s accuracy before starting a formal simulation study, though the adequacy of DesignBuilder software for the simulation of natural ventilation and energy consumption in buildings has been proved in some studies [
33,
34,
35]. The model used for validation was derived from a single-story building in Shanghai, China. The building had four rooms (
Figure 1a), each with an area of approximately 23 m
2. The detailed structural parameters of the verification model in DesignBuilder were consistent with the actual building, and please refer to the literature [
36] for detailed structural parameters. The test results of Room 2 were selected as the reference data for the simulation verification.
To make the simulated environment consistent with the measured environment, one day was selected from typical meteorological data, and the solar radiation and dry-bulb air temperature at that time were close to those measured in the field, and then, the dry-bulb air temperature was replaced by the measured temperature.
The simulated indoor air temperature and internal surface temperature of the roof were compared with the measurements. The comparative results are depicted in
Figure 1b. It can be concluded that the simulated results largely match the actual temperature of the studied building. The coefficient of variance of the root mean square error (CV (RMSE)) of the indoor air temperature and internal surface temperature were determined to be 1.47% and 0.53%, respectively. Additionally, the normalized mean bias error (NMBE) was determined to be 1.46% and −0.22%, respectively.
ASHRAE Guideline 14 [
37] specifies that the CV (RMSE) and the NMBE values should not be more than 30% and ±10%, respectively, for hourly calibration. Therefore, it indicates that the DesignBuilder was calibrated, which could be reliably used to evaluate furtherly.
2.2. Building Model and Meteorological Data
The real building properties were used for making the simulation model. It was oriented from north to south with five floors, each with a height of 3.0 m. The building envelope structure met the current energy-saving standards for residential buildings in Chongqing [
12]. The thermal parameters of the envelope structures are presented in
Table 1.
The west side of the top floor of the building (dotted line in
Figure 2), with three bedrooms, two living rooms, and two bathrooms, was selected for analysis. The unit area was 120.0 m
2.
The meteorological data source used for simulation was Chinese Standard Weather Data (CSWD), compiled by the National Meteorological Information Centre of China Meteorological Administration (CMA) in collaboration with Tsinghua University. It provides hourly meteorological data for 8760 h throughout the year, including hourly data on ambient dry-bulb temperature, wet-bulb temperature, relative humidity, wind speed and direction, and solar radiation [
38], which significantly contributes to the development of energy efficiency in Chinese buildings.
2.3. Simulation Parameters
Typical meteorological data from Chongqing were used in this study. Only the bedrooms and living rooms used the heating and cooling system, which ran 24 h a day if needed (continuous mode operating conditions) [
13]. The AC running time was from 1 June to 30 September, and the heating running time was from 1 December to 28 February. The indoor design temperature of the AC rooms was 26 °C, and that of the rooms provided with heating was 18 °C. The average indoor heat gain for the room was set to 4 W/m
2, and the air change rate was set to 1 ach to ensure the air quality in the room [
11].
The thermal parameters of the envelopes were set according to the actual building, and the ground temperature was set to the soil temperature at 0.5 m depth. The window-to-wall ratio of the simulated building was fixed.
2.4. Passive Measures
In addition to the building envelopes’ thermal insulation performance, passive measures that affect the indoor thermal environment and energy consumption of the building usually include natural ventilation, shading, and heat storage [
11]. Ventilation is mainly used in summer by opening windows, and it can achieve indoor comfort most of the time when the outdoor temperature is low, but the indoor temperature is high. However, shading has different requirements in winter and summer. Thus, adjustable shading is more beneficial for energy saving and indoor thermal comfort. Shading and ventilation are particularly more extensive in the hot summer and cold winter regions [
39,
40].
The effects of ventilation and shading were determined by setting two parameters. One was the effective ventilation opening area ratio (REV), which is the ratio of the actual opening area of the window for ventilation to the external wall area. The other was the solar transmittance of the glass of windows (ST). REV is varied by adjusting the opening area of the external windows, representing different ventilation effects, and ST represents different shading effects.
2.5. Operation Schedule
The differences in energy consumption in buildings in mixed and continuous modes are noteworthy to analyze and compare in detail. Moreover, the impact of the different modes combined with passive measures on the indoor thermal environment and energy consumption should not be ignored. Therefore, the simulated operating modes are divided into three categories: free-running conditions (only ventilation, shading, or combination of the two), mixed-mode operating conditions, and HVAC operating conditions.
Under mixed-mode, the indoor thermal environment evaluation standard uses the operative temperature as a reference parameter, so whether the equipment is operated or not is determined by the operative temperature. In addition, whether the windows are open or not is determined by the difference between the operative temperature and the outdoor air temperature.
According to the evaluation standard [
26], the thermal environment can be divided into three categories. Thermal environment category I is the best, about which 90% of the occupants feel satisfied. It is required that the indoor operative temperature should be between 18 °C and 28 °C when an HVAC system is not used. Therefore, the operative temperature of 28 °C was used as the tolerable upper limit temperature for the residents, equipment operation, and window opening schedule, as presented in
Table 2.
In free-running conditions, the AC system was not used in the summer. The window was opened for natural ventilation when the indoor operative temperature was less than 28 °C but higher than the outdoor air temperature; otherwise, the window was closed, and there is no ventilation. In mixed-mode, as shown in
Figure 3, natural ventilation was preferred. The window was opened when the operative temperature was less than 28 °C but higher than the outdoor air temperature. The AC system was operated when natural ventilation cooling could not keep the operative temperature below 28 °C, and the target air temperature was 26 °C; otherwise, the AC system was turned off. In HVAC mode, the AC system was turned on when the indoor operative temperature was higher than 26°C; otherwise, it was turned off; however, the window was not opened at any time. During the heating days, windows were not opened in both the mixed-mode and the continuous mode. When the operative temperature was lower than 18 °C, the HVAC system was turned on, and the target air temperature was 18 °C.
3. Results
After constructing the building model and selecting its outdoor climatic conditions from Chongqing’s typical meteorological data, the simulation was performed using DesignBuilder software. Then, the energy consumption and the indoor thermal environment in the three modes were analyzed.
3.1. Free-Running Mode
Figure 4 and
Figure 5 show the cumulative frequency (ratio of the hours above a certain temperature to the total hours in the calculation period) of outdoor temperature and operative temperature of different rooms in winter and summer, respectively. Of note, this is under free-running conditions (ST is 0.2 and R
EV is 25%).
It can be observed from
Figure 4 that during the heating period, the operative temperature of all the rooms in winter is lower than 18 °C, indicating that continuous heating is required. However, in summer, it can be observed from
Figure 5 that only a part of the indoor operative temperature is higher than 28 °C because natural ventilation was employed. The results show that hours below 28 °C account for approximately 73% of the summer’s total hours. Therefore, the mixed-mode is more adaptable to the local climate in summer.
Figure 4 and
Figure 5 show that the cumulative frequency of the operative temperatures of the four rooms are very close, indicating that the thermal environment of each room is similar. Therefore, the thermal environment of the master bedroom (B1) was selected for analysis; the relationship between the passive measures and the cumulative number of overheating hours is shown in
Figure 6.
In the free-running model, the cumulative number of hours of the operative temperature above 28 °C is positively correlated with ST and inversely related to the REV. When the REV is less than 15%, the effect of ST (shading) is more significant. When the REV exceeds 15%, however, the cumulative number of overheating hours does not vary significantly with variation in ST, which is stable at 800–1000 h; when ST is 0.4, the number of uncomfortable hours decreases by about 500 h as the REV increases from 5% to 15%.
The relationship between the cumulative hours of the operative temperature above 28 °C (
H), ST, and the R
EV of the master bedroom was fitted using R software as follows:
Obviously, increasing the REV of the buildings is a significant effective passive measure to improve the indoor thermal environment. The best indoor environment (the number of uncomfortable hours <900 h) can only be achieved when the REV exceeds 18%.
3.2. Mixed-Mode
According to the previous analysis, it is necessary to employ continuous heating to ensure a comfortable indoor environment in winter. In contrast, no more than 27% of the time requires AC in summer. The relationship between different R
EV values and the total cooling energy consumption of the rooms when ST is 0.2 is shown in
Figure 7 based on the AC operation schedule (
Table 2).
Bedroom 2 (B2) had the lowest energy consumption, followed by the living room. This is because the dominant wind direction in Chongqing is southwest; thus, rooms with south-facing windows had better ventilation conditions (the master bedroom (B1) was affected by further westward solar radiation), resulting in lower cooling energy consumption. Thus, it indicates that the effect of natural ventilation on cooling energy consumption is significant, and reasonable window opening can significantly reduce the building energy consumption.
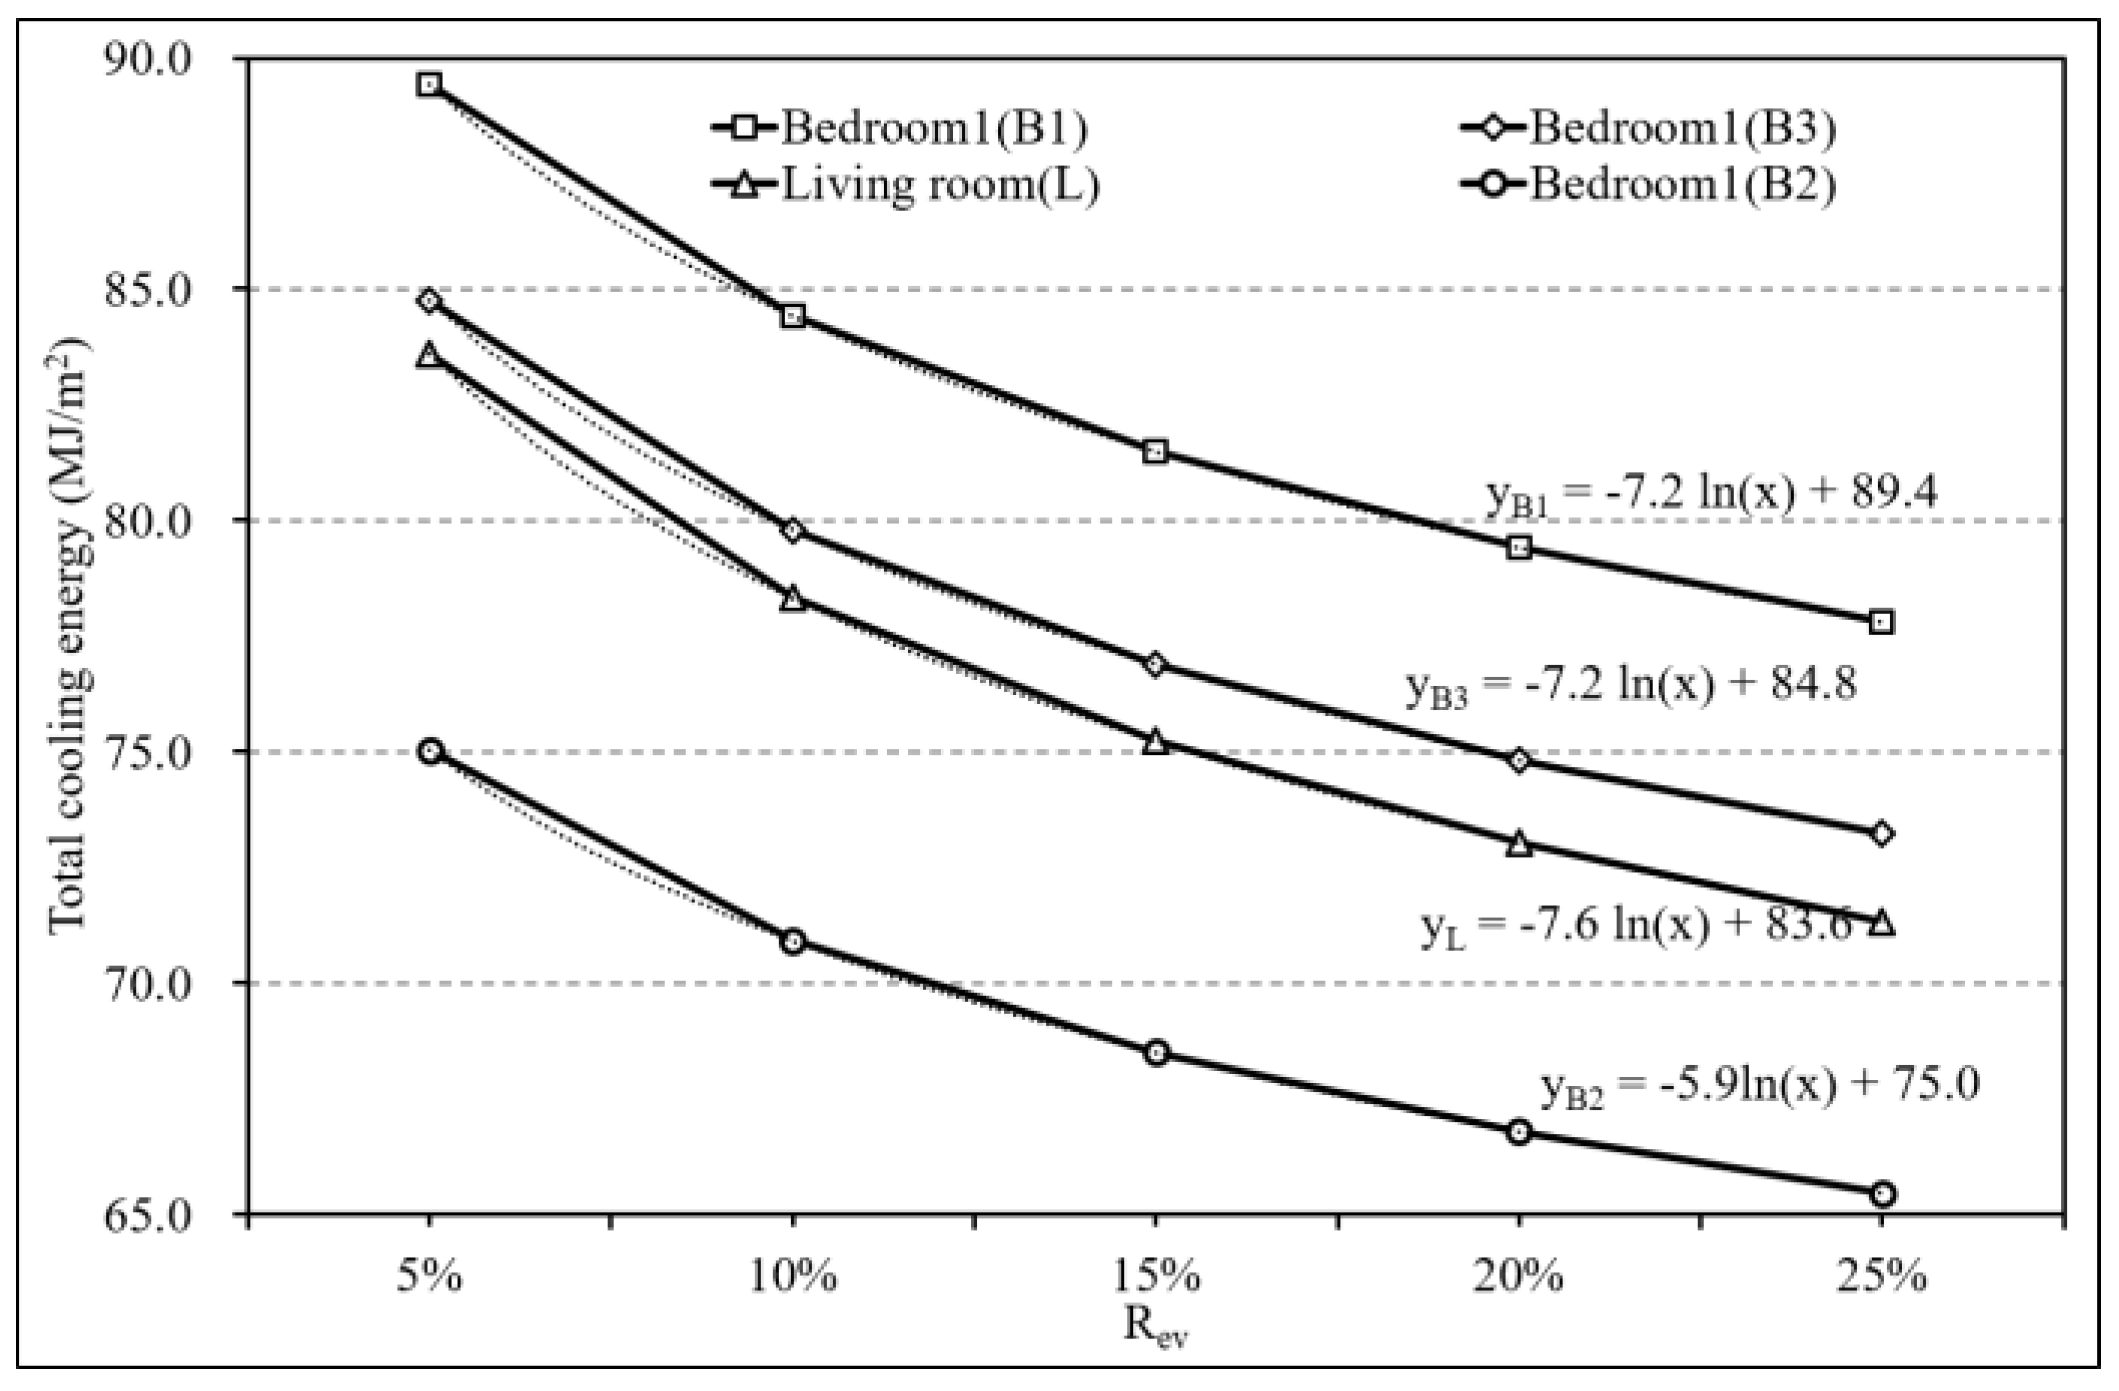
In the mixed-mode, ventilation is often used to reduce indoor air temperature and cooling energy consumption. Similarly, the master bedroom (B1) was selected for subsequent analysis as it was more exposed to the outdoor ambient environment. The relationship between the two passive techniques and energy consumption is shown in
Figure 8.
It can be observed that the total cooling consumption is less than 90 MJ/m2 when the REV exceeds 11%, regardless of whether ST changes or not. For example, when ST is 0.4, the total cooling consumption decreases by 9 MJ/m2, and the REV increases from 5% to 15%. Similarly, when ST decreases from 0.6 to 0.2, the total cooling consumption decreases by 6.1 MJ/m2, and the REV is 10%.
The relationship between the total cooling energy consumption (
Ec), ST, and R
EV of bedroom B1 was fitted using R software as follows:
Regression Formula (2) can predict that the total cooling consumption is lower than 79.2 MJ/m2 only when the REV exceeds 21% or the ST is lower than 0.275.
3.3. HVAC Operating Mode
In this mode, closed windows indicate no ventilation, and the entire household simulation was performed for one year. As a result, the relationship between ST and energy consumption was obtained in
Figure 9.
Obviously, the total cooling consumption is positively correlated with ST. When ST increased from 0.2 to 0.6, the total cooling consumption increased from 108.4 MJ/m2 to 125.3 MJ/m2. In contrast, heating energy consumption is negatively correlated with ST. The heating energy consumption decreased by 1.8 MJ/m2 (5%) when ST increased from 0.2 to 0.6. Thus, shading is observed to have minimal impact on heating energy consumption under this mode.
Under the HVAC operating mode, the solar transmittance significantly impacts total cooling consumption, supporting that better shading results in less total cooling consumption. Therefore, although the heating energy consumption increased slightly, its effect on the total energy consumption is small.
3.4. Impact of Passive Measures on the Indoor Thermal Environment
It can be observed from the previous analysis that passive measures positively affect the indoor thermal environment and reduce the number of uncomfortable hours. Furthermore, under natural ventilation in summer, comfortable hours are proportional to ST but inversely proportional to the REV. Therefore, high-efficiency shading measures in summer are conducive to shortening indoor overheating time, and proper use of natural ventilation is also necessary to improve indoor comfort.
The analysis of the number of uncomfortable hours and passive measures indicates that when the ST of the master bedroom is fixed at 0.4 and the REV is at 5%, the cumulative number of overheating hours in summer is as high as 1454 h. In contrast, it is only 811 h when the REV increases to 25%, indicating a reduction of approximately 45%. Similarly, when the REV is fixed at 10%, the cumulative number of overheating hours in summer corresponding to an ST of 0.6 is 1226 h, whereas when the ST is 0.2, the value decreases to 1089 h, indicating a reduction of approximately 11%. However, when the REV is above 18% and the value of ST is varied, the number of uncomfortable hours is essentially in the range of 900–1000 h.
In general, natural ventilation can significantly shorten the number of uncomfortable hours in summer in Chongqing. However, the effect of natural ventilation largely depends on the REV. For most residential buildings, the REV never exceeds 25% due to the window-to-wall ratio limitation and the type of window opening. According to the above analysis, when the REV increased from 5% to 25%, the cumulative number of overheating hours decreased by approximately 650 h on average. In contrast, when the REV increased to 18%, the cumulative overheating hours decreased by about 550 h on average, approximately 85% of the previous value. Therefore, a REV > 18% seems more suitable for residential buildings in Chongqing.
3.5. Impact of Passive Measures on Building Energy Consumption
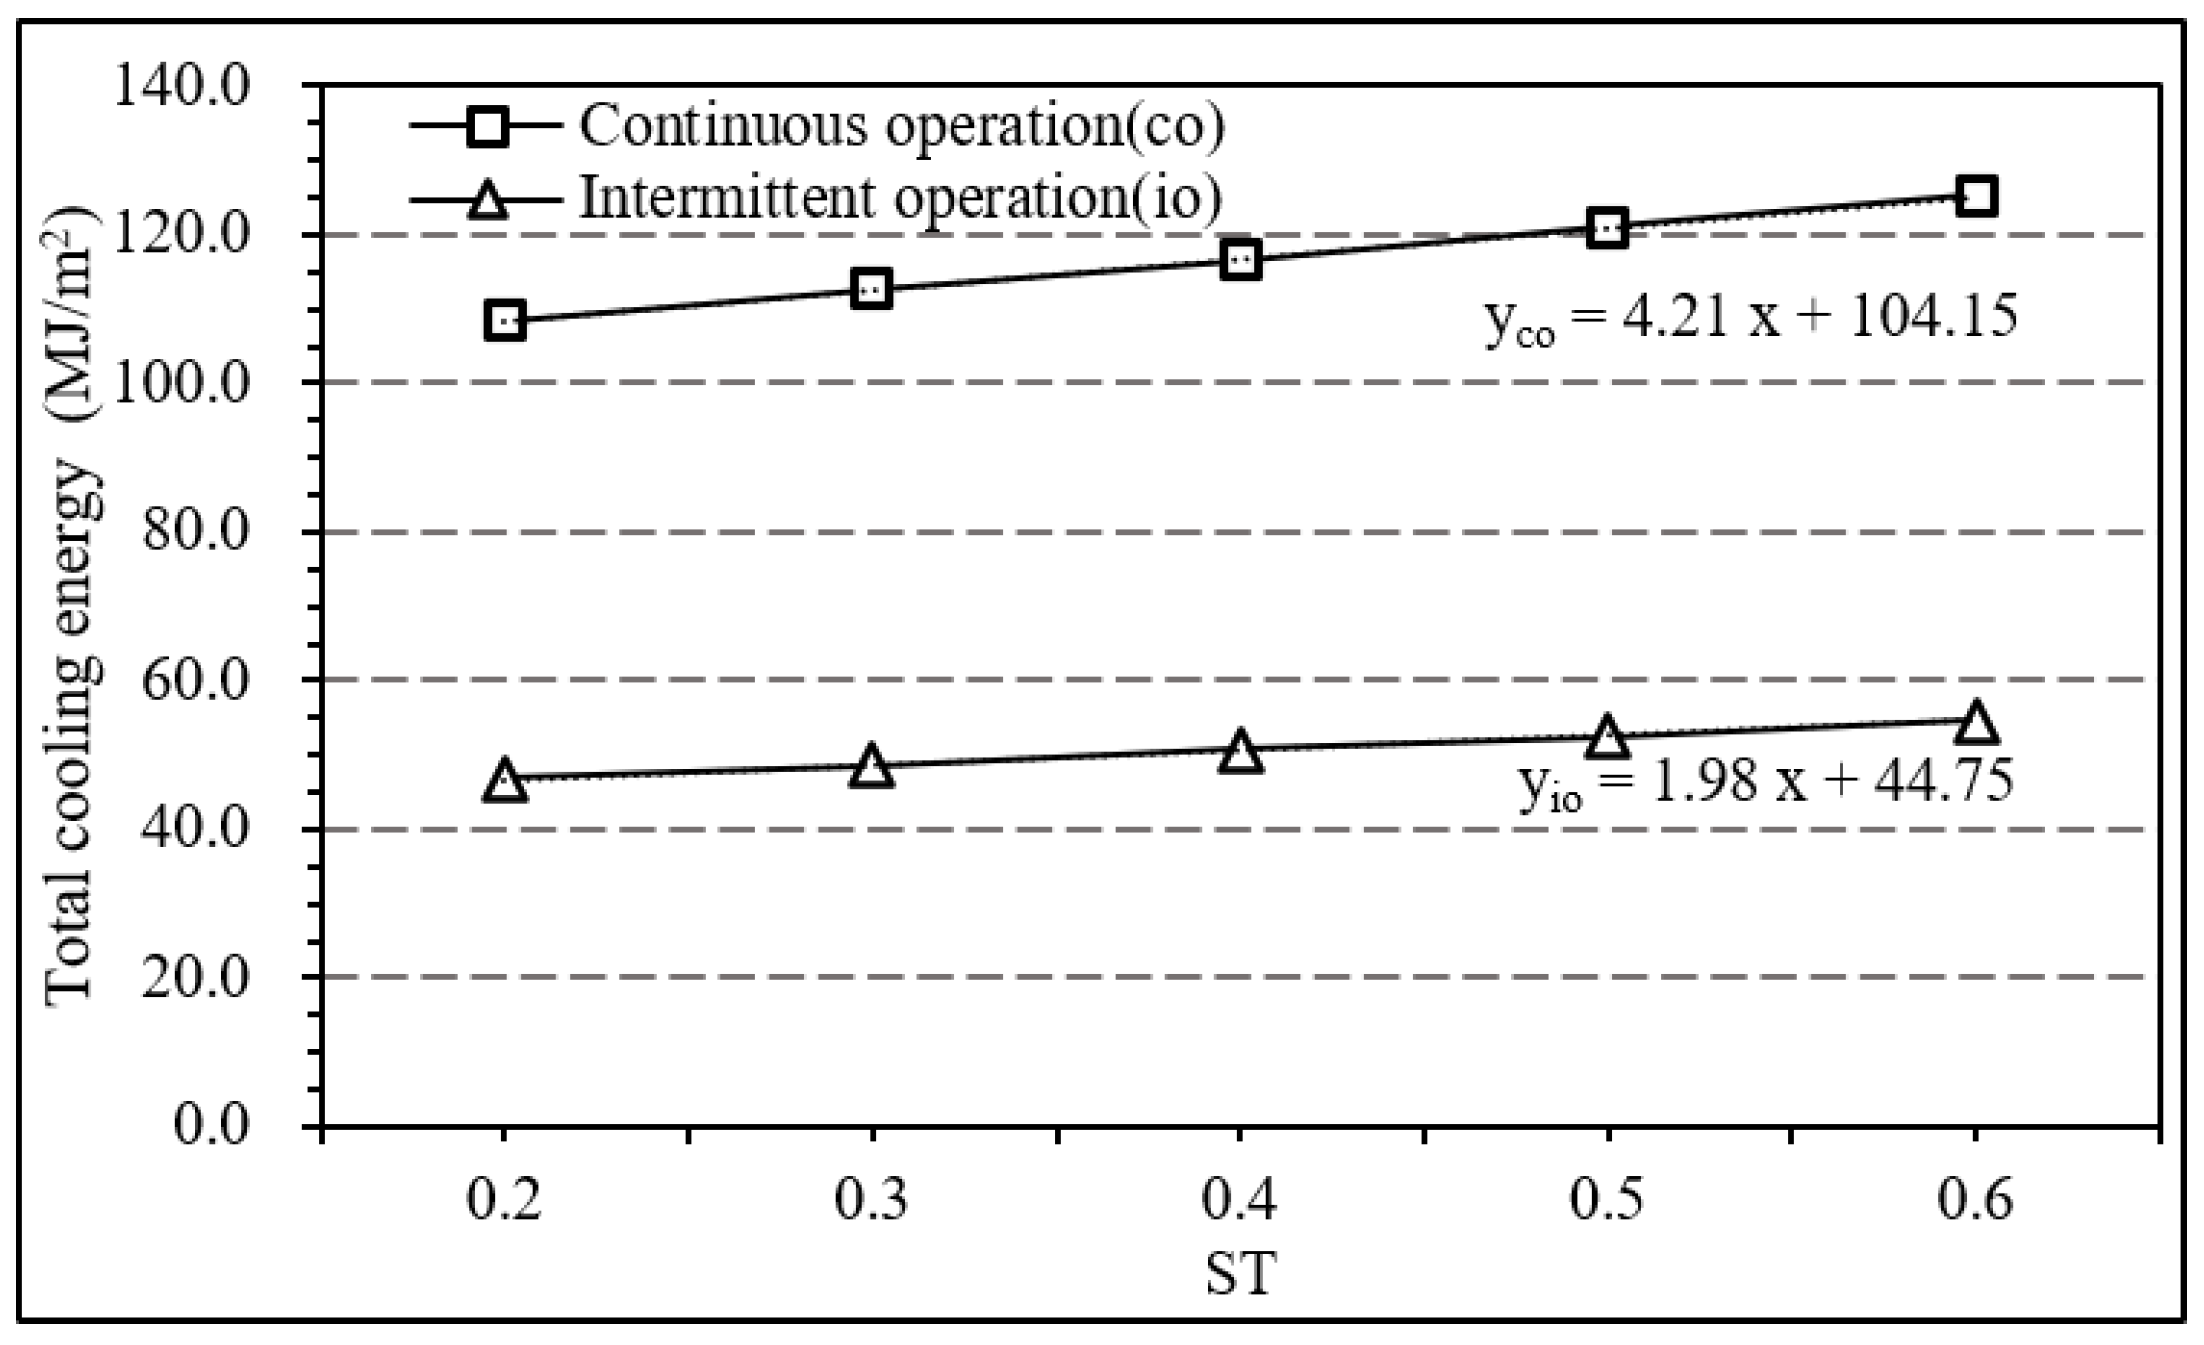
When AC is used, passive measures can shorten the running time of the equipment. The relationship between ST and energy consumption under two operating conditions in summer is shown in
Figure 10. It can be observed that in summer, the energy consumption of mixed-mode operating conditions decreased by more than 50% compared with that of continuous operating conditions. In addition, ST has a more significant effect on energy consumption when the AC system is continuously used, almost twice that of intermittent use.
Fixed shading reduced the energy consumption for cooling in summer but inevitably increased heating energy consumption in winter. Therefore, the use of adjustable shading can better meet the different needs of the building in winter and summer, which is more conducive to improving building energy efficiency. The annual building energy consumption for fixed shading (replaced with a fixed ST) and adjustable shading (replaced with different ST values) is shown in
Figure 11. When the ST values are 0.2 in summer and 0.6 in winter, the annual building energy consumption is 7.9 MJ/m
2 lower than that of the fixed transmittance of 0.6. This approach can reduce energy consumption by nearly 50% compared with buildings without these two passive measures.
3.6. Application in the Case
The current Chinese standard (GB 50352-2019) [
41] stipulates that the effective area of ventilation openings in rooms with direct natural ventilation should comply with the following provisions: The effective area of ventilation openings in living and working rooms should not be less than 1/20 of the floor area of the room. Therefore, the effective opening area of external windows is not less than 5% of the room’s floor area, which is the minimum requirement for ventilation openings in civil buildings. Furthermore, the design standard for energy efficiency (JGJ134-2010) [
11] stipulates that the openable area of external windows should not be less than 5% of the room’s floor area to avoid the phenomenon of “large windows with small openings.” The Chongqing engineering construction standard (DBJ50-071-2016) [
12] specified that the openable area of external windows should not be less than 8% of the room’s floor area to ventilate for cooling and improve air quality in summer and transitional seasons.
This paper recommends that the REV of residential buildings in Chongqing is larger than 18%, which is calculated to be about 10% of the openable area of external windows to the room’s floor axis area. Therefore, to fully use natural ventilation for cooling, we recommend that the openable area of external windows in residential buildings in Chongqing suitably be more than 10% of the room’s floor axis in which the external windows are located.
4. Conclusions
In this study, indoor cooling energy consumption and indoor thermal environment were simulated and compared under three conditions: free-running, HVAC, and mixed-mode, using a residential building model in Chongqing. It should be noted that, in the mixed-mode, the temperature of opening the AC was maximized, yet ensuring the indoor ambiance in thermal environment category I. The mixed-mode that considers comfort and energy saving is more in line with the occupants’ actual use mode. This study used ST and the REV as variables to analyze the effects of two passive techniques, namely shading and ventilation, on building energy consumption in a typical year.
The results show that the combination of shading and ventilation in summer can significantly reduce the overheating hours and prolong the non-AC period, especially in the hybrid mode proposed in this paper, which reduced the number of hours of AC operation by approximately 50%. Thus, by taking full advantage of these two passive techniques, the energy consumption of residential buildings (65% energy-saving has been achieved) can be reduced by approximately 50%. Additionally, it is suggested that architects carefully consider the type of windows in the design of residential buildings in Chongqing, such that the effective ventilation opening area ratio is not less than 10% of the room’s floor axis.
Overall, this study proposes a new mixed-mode operation based on the relevant standards’ recommendations and confirms its energy-saving potential in residential buildings. The method proposed in this paper can also be used to optimize the coupled operation of natural ventilation and air conditioning in other regions or countries, especially when dealing with the different thermal comfort of occupants in the air conditioning mode and the free-running mode. It also highlights the impact of shading and ventilation on energy consumption and thermal comfort under this mode. However, it is only a preliminary exploration of the viability of this mode combining shading and ventilation to meet thermal comfort and energy savings. Therefore, the following is recommended to be investigated or considered in the future work/research agenda.
Further work is recommended to elaborate on the impact of shading, focusing on shading components or shading design, such as louver shading, dynamic shading components, etc. The smart window, which has performed well in energy efficiency and visual performance, would also be worthy of further study and discussion.
The energy performance of other cities deserves to be re-evaluated. In particular, in northern cities, since it is possible to achieve near-zero or ultra-low energy goals in reference buildings just by using the mixed-mode, further work based on this would help promote the development of zero-carbon or zero-energy technologies.


