1. Introduction
Located in the semiarid and arid parts of Southwest Asia in the Middle East, Iran often faces intense droughts. According to meteorological station datasets, the average annual precipitation in this country is 252 mm/year and the standard deviation of 44.68, which is far lower than the global average [
1]. The very low precipitation amounts in Iran are also unevenly distributed as the Caspian Sea coast receives more than 1000 mm/year of annual precipitation, whereas large parts of central Iran receive less than 100 mm/year of annual precipitation [
1,
2]. In addition to the uneven spatial distribution of precipitation, the temporal distribution of precipitation has also been observed. The hydrological year in Iran is classified into a dry (May to October) and wet (November to April) period according to previous studies [
3,
4,
5]. This is owing to variations in the air masses that influence the country throughout the year. During the wet period, Iran is mainly influenced by various air masses, including maritime polar, continental polar, Mediterranean, and continental tropical air masses [
2,
6,
7]. However, during the dry period, only maritime tropical air masses influence the south-western part of the country [
1,
7,
8]. The maritime tropical air mass causes intense sudden monsoon precipitation, mainly in the south-western part of Iran. Numerous studies have been conducted on the variations in the precipitation across Iran including [
1,
3,
5,
9,
10], whereas only a few of these, such as [
1,
4,
6,
7,
8,
11], have addressed the moisture sources of precipitation in Iran. This may be because of the highly complicated processes and software packages that are needed to monitor the moisture sources of precipitation. Studies on the primary moisture sources in Iran were first conducted using climatological maps, including atmospheric pressure, wind speed, and wind direction [
12]. In addition to climatological maps, the Lagrangian particle dispersion model (The FLEXible PARTicle dispersion model (FLEXPART)) [
13,
14] and the Hybrid Single-Particle Lagrangian Integrated Trajectory model (HYSPLIT) [
15] have been used to determine the major moisture sources for precipitation in Iran [
6,
7].
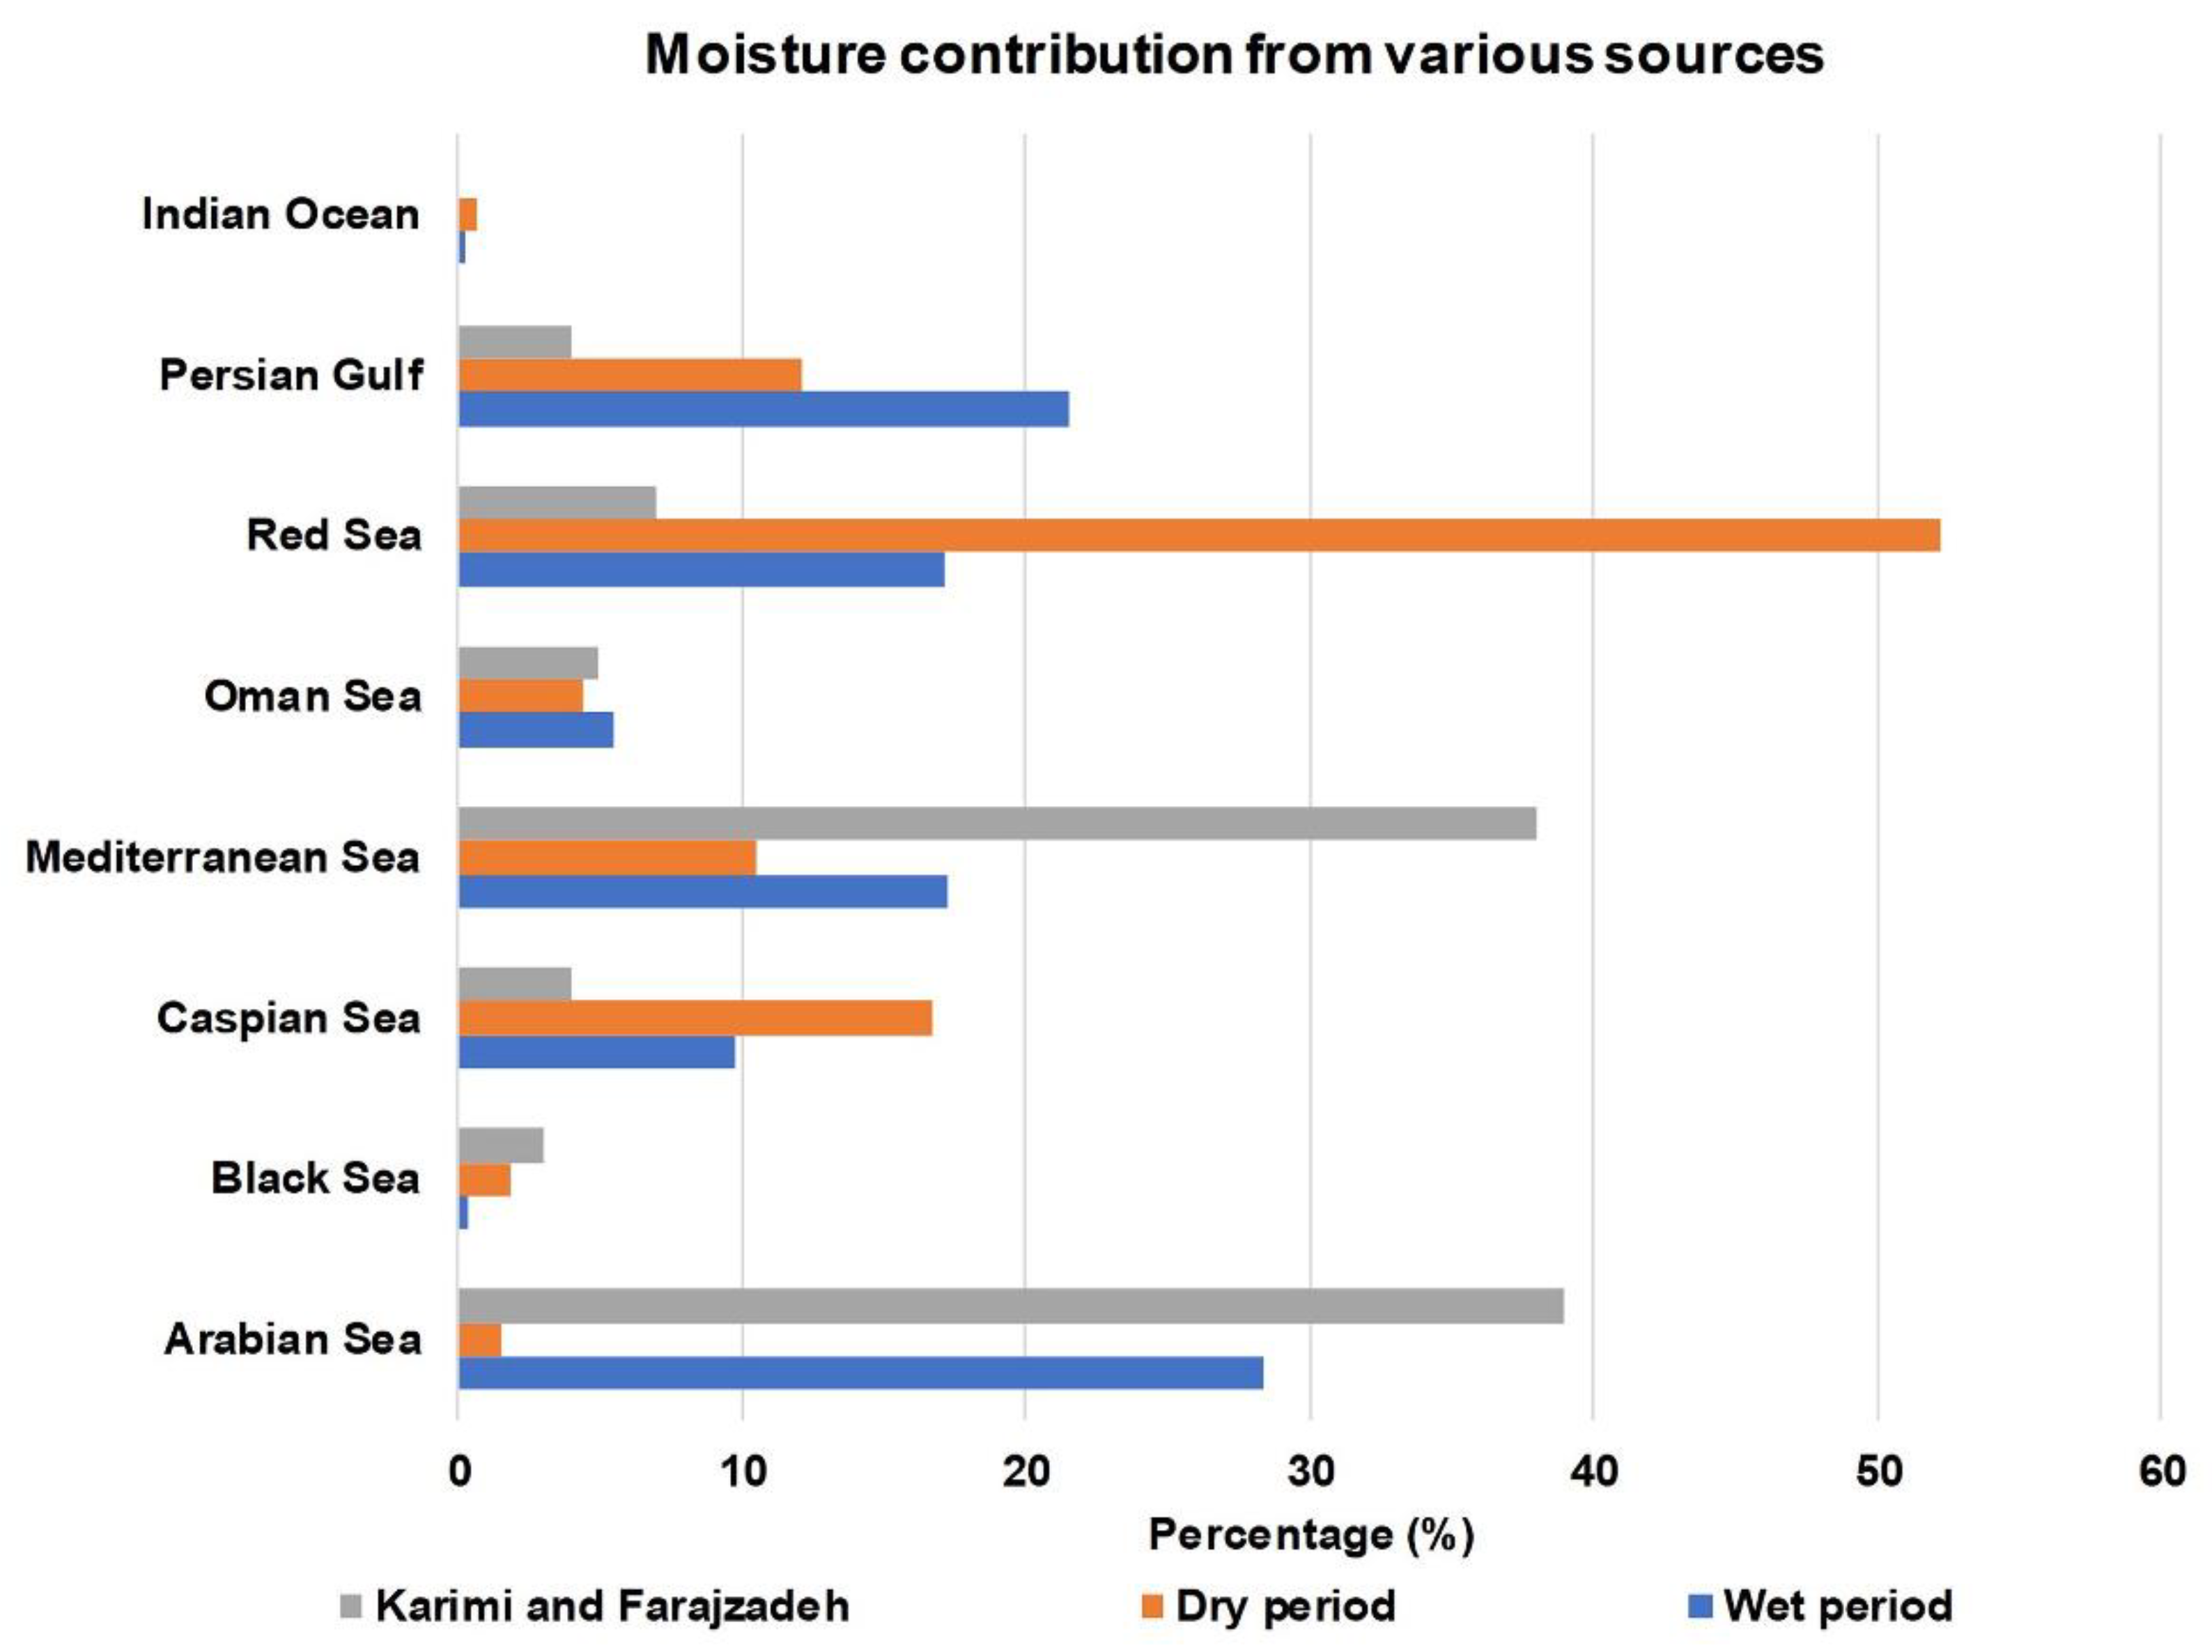
Karimi and Farajzadeh [
12] reported that the Arabian and Mediterranean seas, with a share of 39% and 38% of total moisture uptake, are the primary moisture providers for precipitation in Iran. However, in the study by Heydarizad et al. [
7], the FLEXPART model outputs showed that the Arabian Sea, with a share of 28.3% of the total moisture uptake, is the dominant moisture source for precipitation in Iran during a wet period. The Arabian sea anticyclone (AAC) exists over the Arabian Sea and the Arabian Peninsula in the lower and middle levels of the atmosphere has a significant influence on Iran’s precipitation by transferring the Arabian Sea moisture to Iran’s plateau [
1]. According to the study of Karimi et al. [
16], the maximum number of AAC centers (41.6%) on rainy days with low to moderate precipitation events (up to 30 mm) existed in the north-western part of the Arabian Sea and the east coast of the Arabian Peninsula in the lower levels of the troposphere. Furthermore, the significant numbers of AAC centers causing low to moderate precipitation events were also observed over the Gulf of Aden at the 500 and 700 hpa troposphere level. For heavy precipitation events (>30mm), AAC centers were observed mainly over the western part of the Arabian Sea and the east coast of the Arabian Peninsula at three different atmospheric levels of 500, 700, and 850 hpa [
16]. In addition to the AAC, the Mediterranean Sea cyclones also have a dominant role in precipitation across Iran by transferring the Mediterranean Sea moisture over this country, mainly to the western parts. The main cyclogenesis centers over the Mediterranean Sea are the east part of the Mediterranean Sea, south of Italy, Cyprus, and the Gulf of Genoa [
17]. Increase (decrease) of the sea surface pressure in cyclogenesis centers causes a decrease (increase) in the annual frequency of cyclones in the Mediterranean region. The increase (decrease) of cyclones is followed by the increase (decrease) in the precipitation amount across Iran, mainly the western part [
17]. In addition, whenever SST in the Mediterranean Sea is colder (warmer) than usual, the number of cyclones in the Mediterranean region also increases (decreases) [
18].
In contrast to the wet period, during the dry period, the Red Sea plays a dominant role, accounting for 52.2% of the total moisture uptake [
7]. Dry period precipitation mainly in the south-eastern part of Iran is mostly under the influence of the Indian monsoon [
19]. According to Saligheh and Sayadi [
20], the summer precipitation in Iran is mainly dependent on some phenomena, including the increase of sea surface temperature (SST) in the water bodies in the southern part of Iran, monsoon jet stream, and the divergence and the convergence of the wind in the south-eastern part of the Arabian Peninsula, and the south-eastern part of Iran, respectively. The early summer precipitation mainly in June was mostly affected by the SST of the ocean, while mid-summer (August) precipitation events were influenced by the eastern jet streams [
20].
The differences observed between Karimi and Farajzadeh [
12] and Heydarizad et al.’s [
7] studies (
Figure 1) were owing to the methods used to determine the moisture uptake sources as well as the period of their studies. Karami and Farajzadeh [
12] considered the moisture uptake sources for Iran during the rainy season (November to April), whereas Heydarizad et al. [
7] considered moisture uptake sources for both the dry and wet periods.
Although moisture uptake from the various sources in the dry period is similar or even higher than that in the wet period, the precipitation amount reduces markedly across Iran in the dry period (with an average of 36.7 mm/year and the standard deviation of 14.67) compared to the wet period (with an average of 173.4 mm/year and the standard deviation of 38.89). This is because the Azores subtropical high-pressure system causes intense atmospheric stability over a large part of Iran during the dry period [
2,
7,
8]. Atmospheric stability occurs owing to the intense surface temperature of the Earth and prevents the occurrence of precipitation by disrupting the air uplifting mechanism [
2,
7]. In a stable atmosphere, if a parcel of air is blown upward by an updraft or lifted over a mountain, the lifted air will sink back down because the air parcel is much cooler than the air parcels around it [
7,
8]. The Omega (ω) Equation (1) is normally used to determine asymmetric stability:
This equation is the partial differential form of the vertical velocity equation, where d/dt represents a material derivative. Positive values of ω indicate stable atmospheric conditions. However, negative ω values indicate atmospheric instability [
7,
21].
To depict the influence of atmospheric stability on precipitation variations clearly, the spatial variations in monthly omega (ω) values as well as monthly precipitation amounts over Iran are shown for the dry and wet periods in
Figure 2. The monthly precipitation often decreases with an increase in atmospheric stability (higher values of ω) and vice versa in both the dry and wet periods.
Although obtaining the contribution of each moisture source compared with the total moisture uptake using methods such as HYSPLIT and FLEXPART is extremely important, understanding the fractional importance of each moisture source that influences the amount of precipitation is also necessary. This is crucial because it can help scientists understand which moisture sources (water bodies) predominantly control the variations in precipitation amount and cause climatological droughts. Various methods, including the analytical hierarchy process (AHP) and machine learning (ML) methods have been used to study the fractional importance of individual moisture sources that influence the precipitation amount.
Since Thomas L. Saaty developed the AHP method in the 1970s [
24], it has been applied in numerous studies to organize and analyse complicated scenarios. In addition to AHP, ML methods can be applied to investigate the fractional importance of individual moisture source affecting the amount of precipitation in Iran. Although the application of ML methods in different aspects of the hydrological and climatological sciences, such as in [
25,
26,
27,
28,
29,
30,
31,
32,
33], has increased substantially during the last few years, comprehensive studies on the application of ML methods in moisture source investigations are lacking.
The aim of this study was to determine the fractional importance of various moisture sources influencing precipitation amounts across Iran using AHP and ML methods. In addition, the amount of precipitation across Iran was simulated using ML methods, and the accuracy of the developed models was validated.
2. Materials and Methods
Figure 3 presents the outline of this study briefly. In the first step of the present study, the moisture sources of precipitation in Iran were identified using global outputs from FLEXPART v9.0 (Norsk Institutt for luftforskning (NILU), Oslo, Norway) [
14,
34] for the period 1981-2015. In the modeling procedure, FLEXPART considers the atmosphere as divided into approximately 2 million parcels with a resolution of 1°, and input data for every 6 h at 61 vertical levels of the atmosphere from the ERA-Interim Reanalysis project [
35] is used to drive the model. Air masses residing over Iran were tracked backward in time, and the changes in specific humidity (
dq) were computed every 6 h (
dt) in air parcels according to Equation (2):
where
m represents the constant mass value of each parcel, and
e and
p are the evaporation and precipitation, respectively. By integrating the (
e −
p) values for all parcels in a vertical column over an area, we obtained an approximation of the surface freshwater flux (
E −
P). This budget was computed by considering the optimal number of days proposed in [
36].
Thus, in a backward experiment, regions with (
E −
P) > 0 indicate moisture gain by the air masses, and those with (
E −
P) < 0 indicate moisture loss. Regions with positive values of the budget are considered sources of moisture, whereas negative regions as moisture sinks. In the present study, only regions that acted as moisture sources were used. The approach for identifying moisture sources has been widely utilized in recent studies at global [
37,
38] and regional [
39] scales.
Furthermore, a statistical stepwise model has also been applied to investigate the simultaneous effect of each marine moisture source on Iran’s average precipitation in the R programing language. The stepwise model was utilized to fit a linear equation between moisture uptake values from different sources (independent variables), and a dependent variable (precipitation amount) as demonstrated in Equation (3) [
40]:
where Y is the target variable, X
1 to X
n are the parameters affecting Iran’s average precipitation (independent variables), β
0 to β
n are the partial regression coefficients, and ε is the error term showing the variability of the target variable, which is impossible to be explained by the stepwise model. The independent variables were added to the stepwise model one by one to determine their importance and to clarify whether they should stay or be removed from the final model. The independent variables with
p-values of more than 0.05 were omitted from the model, while the rest of the independent variables were kept in it [
41].
Monthly (
E −
P) values calculated for each moisture source for the period 1981–2015 were applied as the sole predictor variables to forecast the average monthly precipitation amount in Iran (target variable) as well as to determine the fractional importance of various moisture sources that influence precipitation amount. The (
E −
P) values calculated for each moisture source were identified using FLEXPART v9.0 outputs, and the amount of monthly precipitation were derived from datasets of the Climatic Research Unit (CRU3.23TS) [
23].
These datasets (CRU3.23TS) are available monthly on high-resolution (0.5 × 0.5 degree) grids which have been produced by the Climatic Research Unit (CRU) at the University of East Anglia in Norwich, Britain.
The predictor and target variables were then used as inputs to the simple AHP and fuzzy AHP techniques to determine the fractional importance of various moisture sources that influence precipitation amount using super decision software version 3.2. In addition to AHP techniques, the ML methods were also used to determine the fractional importance of various moisture sources that influence precipitation as well as to simulate monthly precipitation amounts across Iran.
To apply the ML techniques, the (
E −
P) values for each moisture source as well as annual precipitation datasets for Iran were divided into three subsets—training, testing, and verifying using the rsample package [
42] in the R programming language [
43]. After determining the fractional importance of each moisture source influencing the precipitation amount, the (
E −
P) values in each source were also used to train various ML methods to simulate the precipitation amount using packages in R. The ML methods applied included the artificial neural network (ANN) and deep neural networks (DNN). The DNN is a branch of the ANN model that consists of multiple layers between inputs and outputs. A DNN is concerned with a number of layers of bounded size, which permits optimized implementation [
33]. In addition to neural networks, other ML methods such as Decision Trees, Random Forest (RF), gradient boosting (GBoost), and eXtreme gradient boosting (XGBoost) were used in this study. Decision Trees are popular tools in supervised learning ML models and are commonly applied in decision analysis to achieve the final goals of the study. The Decision Tree model is well known for its simplicity and intelligibility [
44]. The RF is a supervised ML model which is extremely user-friendly and flexible. It is a classification technique which consists of numerous Decision Trees trained using the bagging method [
45]. In addition to the above ML techniques, ensemble ML methods, including GBoost and XGBoost, were also applied in the present study. GBoost is an ML model which is used in both classification and regression tasks. This model presents the anticipation of target values in the form of an ensemble of weak Decision Tree models [
46]. Although the GBoost model has several advantages, such as its simplicity, it also has two main disadvantages: anticipation weakness and obstacles in the analysis of large trees [
47]. The XGBoost method was developed to address these shortcomings, mainly in the training procedure, to construct more accurate and faster models [
48,
49]. XGBoost is one of the most important and popular ML methods first developed by Tianqi Chen in the C++ language [
50]. The XGBoost is designed to expand the ML algorithms’ capability to omit the computation limits which have been observed in other ML models and achieve a more accurate, portable, and scalable algorithm. XGBoost utilizes a more regularized model formalization to control and reduce over-fitting, which gives this model more accuracy. In addition to a much better prediction performance which has been observed normally in this model compared to other ML models, the XGboost also conducts the tasks at an extremely higher speed (more than 10 times faster) compared to the available GBoost algorithms like CatBoost, AdaBoost, and GBoost. This is because the XGBoost conducts parallel computation tasks in which numerous processes and calculations are conducted simultaneously [
49].
Finally, the accuracy of the developed ML models was evaluated by comparing the real and simulated precipitation amount values using the coefficient of determination (R
2) (Equation (4)) and root mean square error (RMSE) [
51,
52] as follows (Equation (5)):
where
is the average,
yi is the
i-th measured data, and
ŷ is the corresponding predicted data;
where N is the number of data, actual (i) is the i-th measured data, and predicted (i) is the corresponding predicted data.
3. Results and Discussion
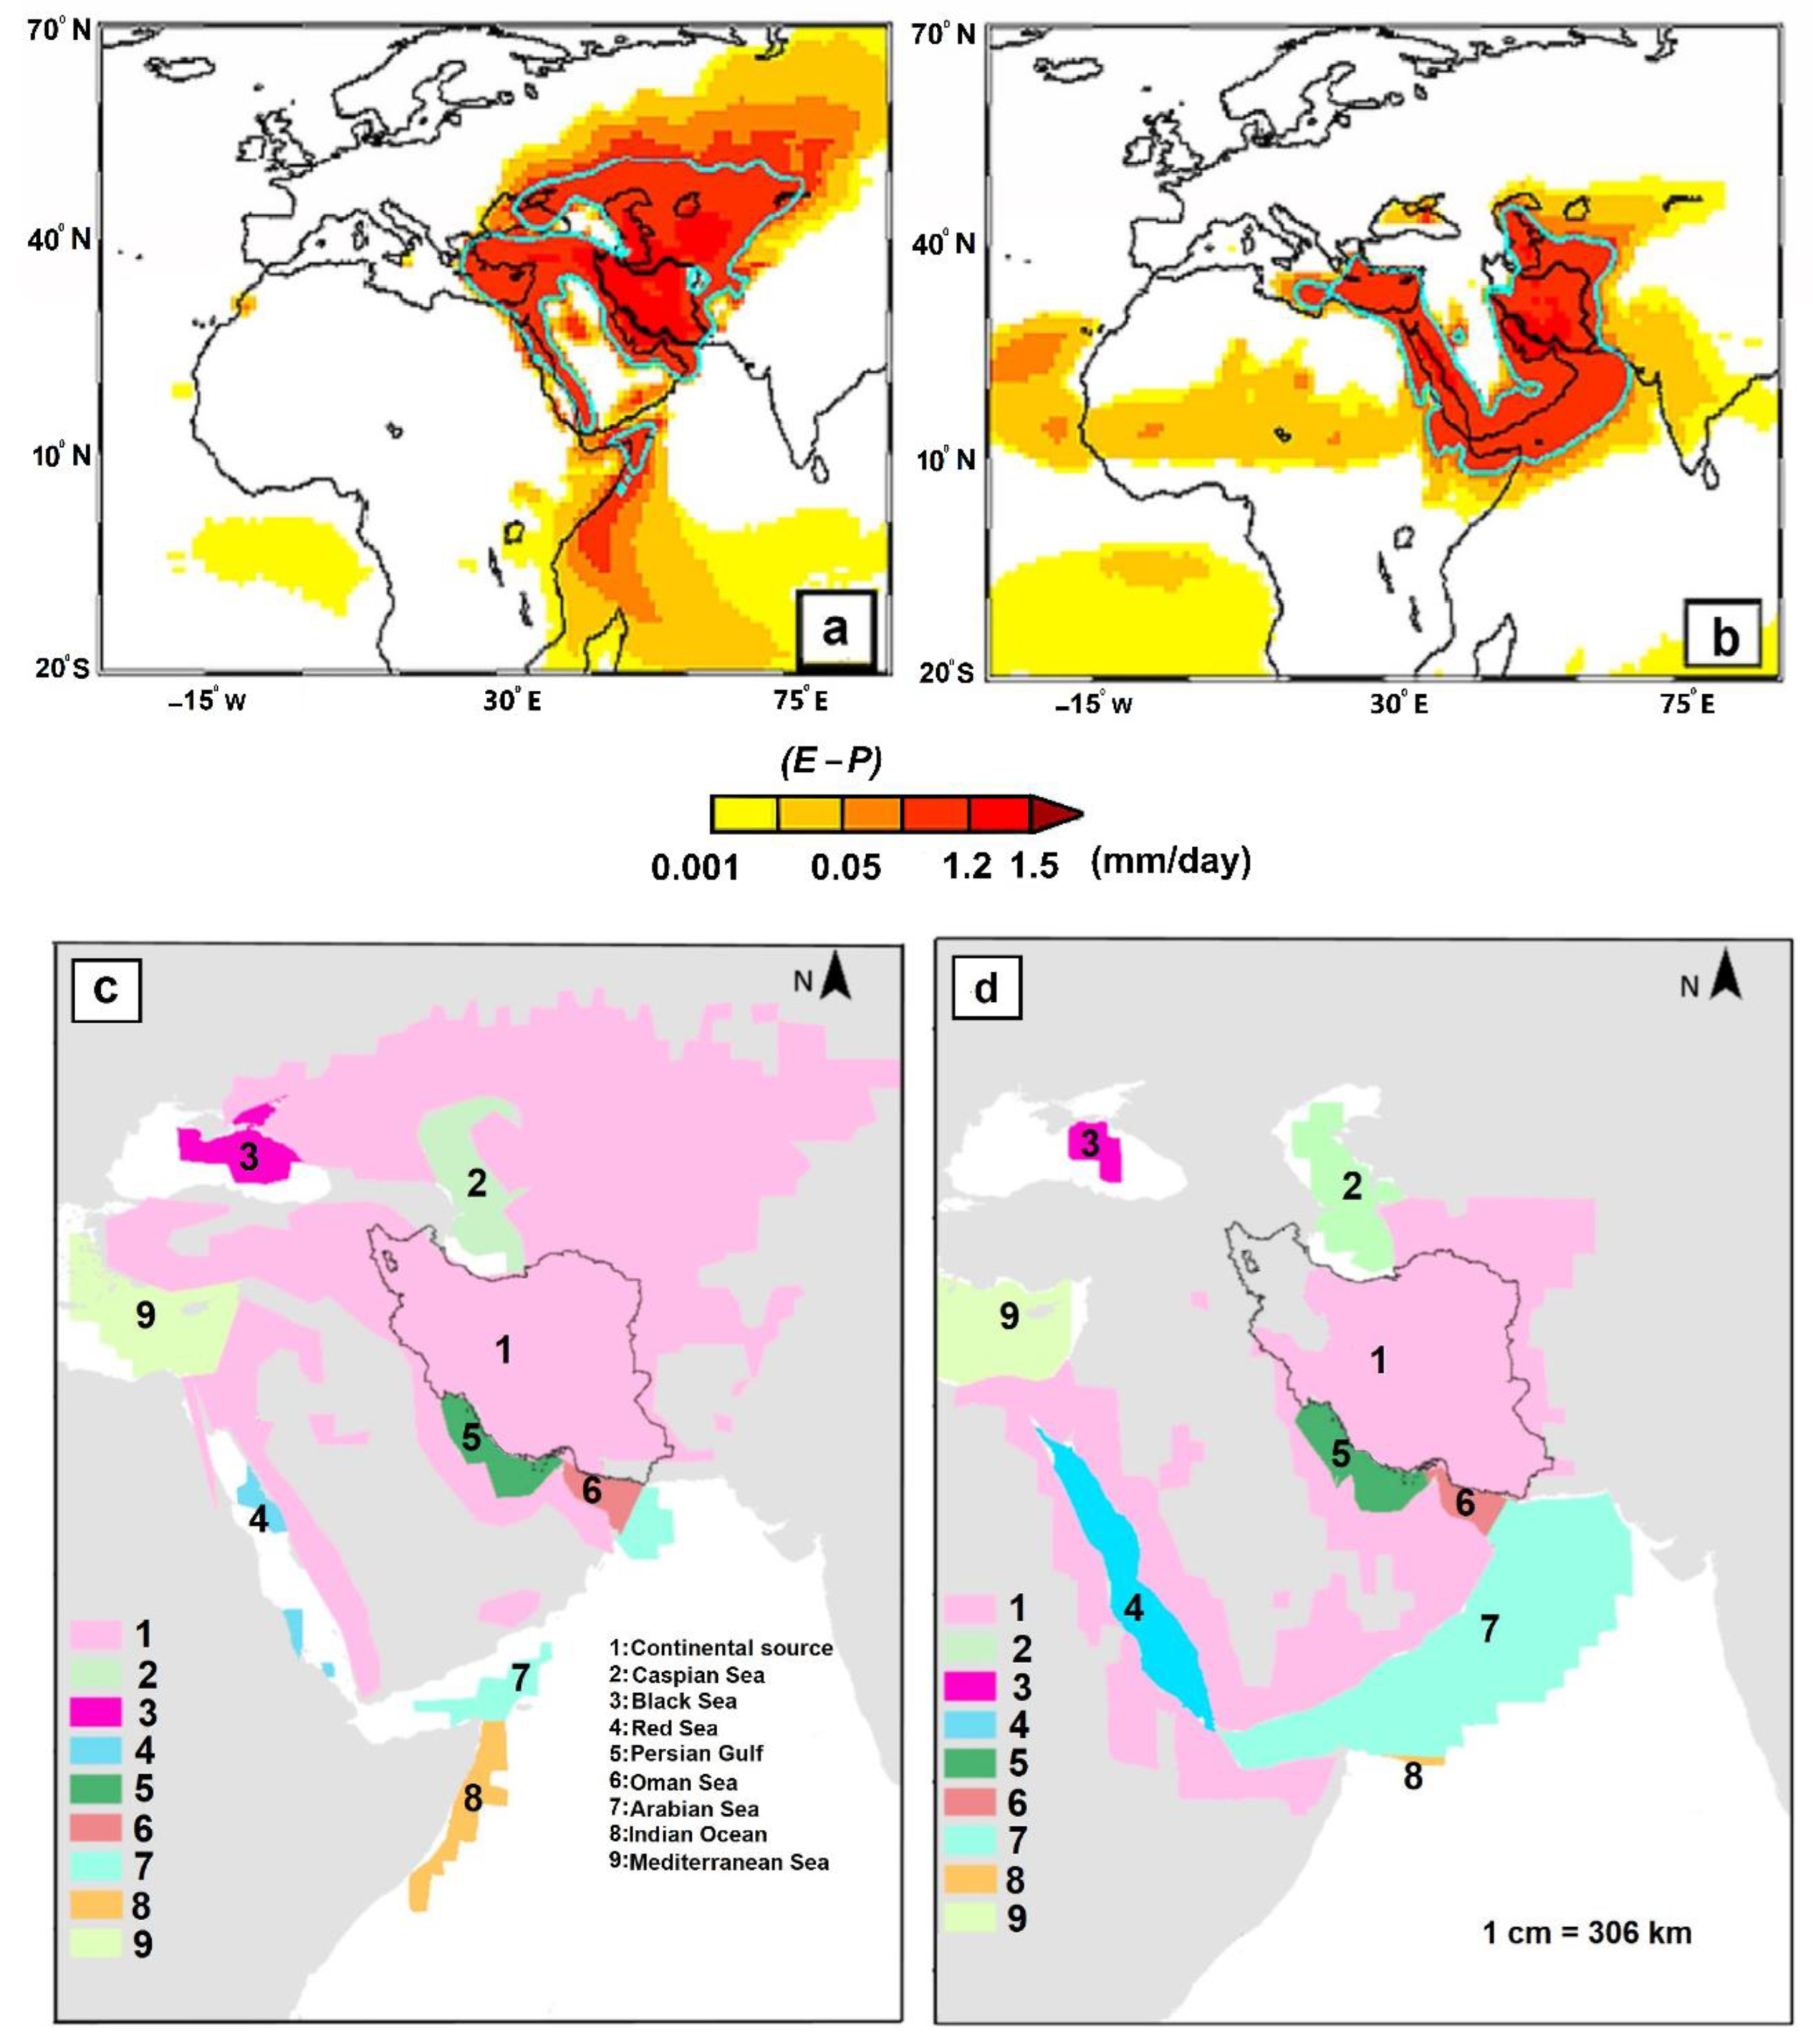
The (
E −
P) > 0 values obtained by backward trajectory analysis of air masses arriving over Iran illustrate the spatial distribution of the main moisture uptake sources and changes in spatial extension between the dry and wet periods (
Figure 4a,b) [
7]. The blue line in
Figure 4a,b, shows 95% of the (
E −
P) > 0 annual values, and the 5% area, which is located inside the blue line, represents the (
E −
P) > 0 values of 0.15 mm/day and 0.12 mm/day for the dry and wet periods, respectively. Furthermore, the dominant moisture uptake sources have also been shown for the dry and wet periods (
Figure 4c,d).
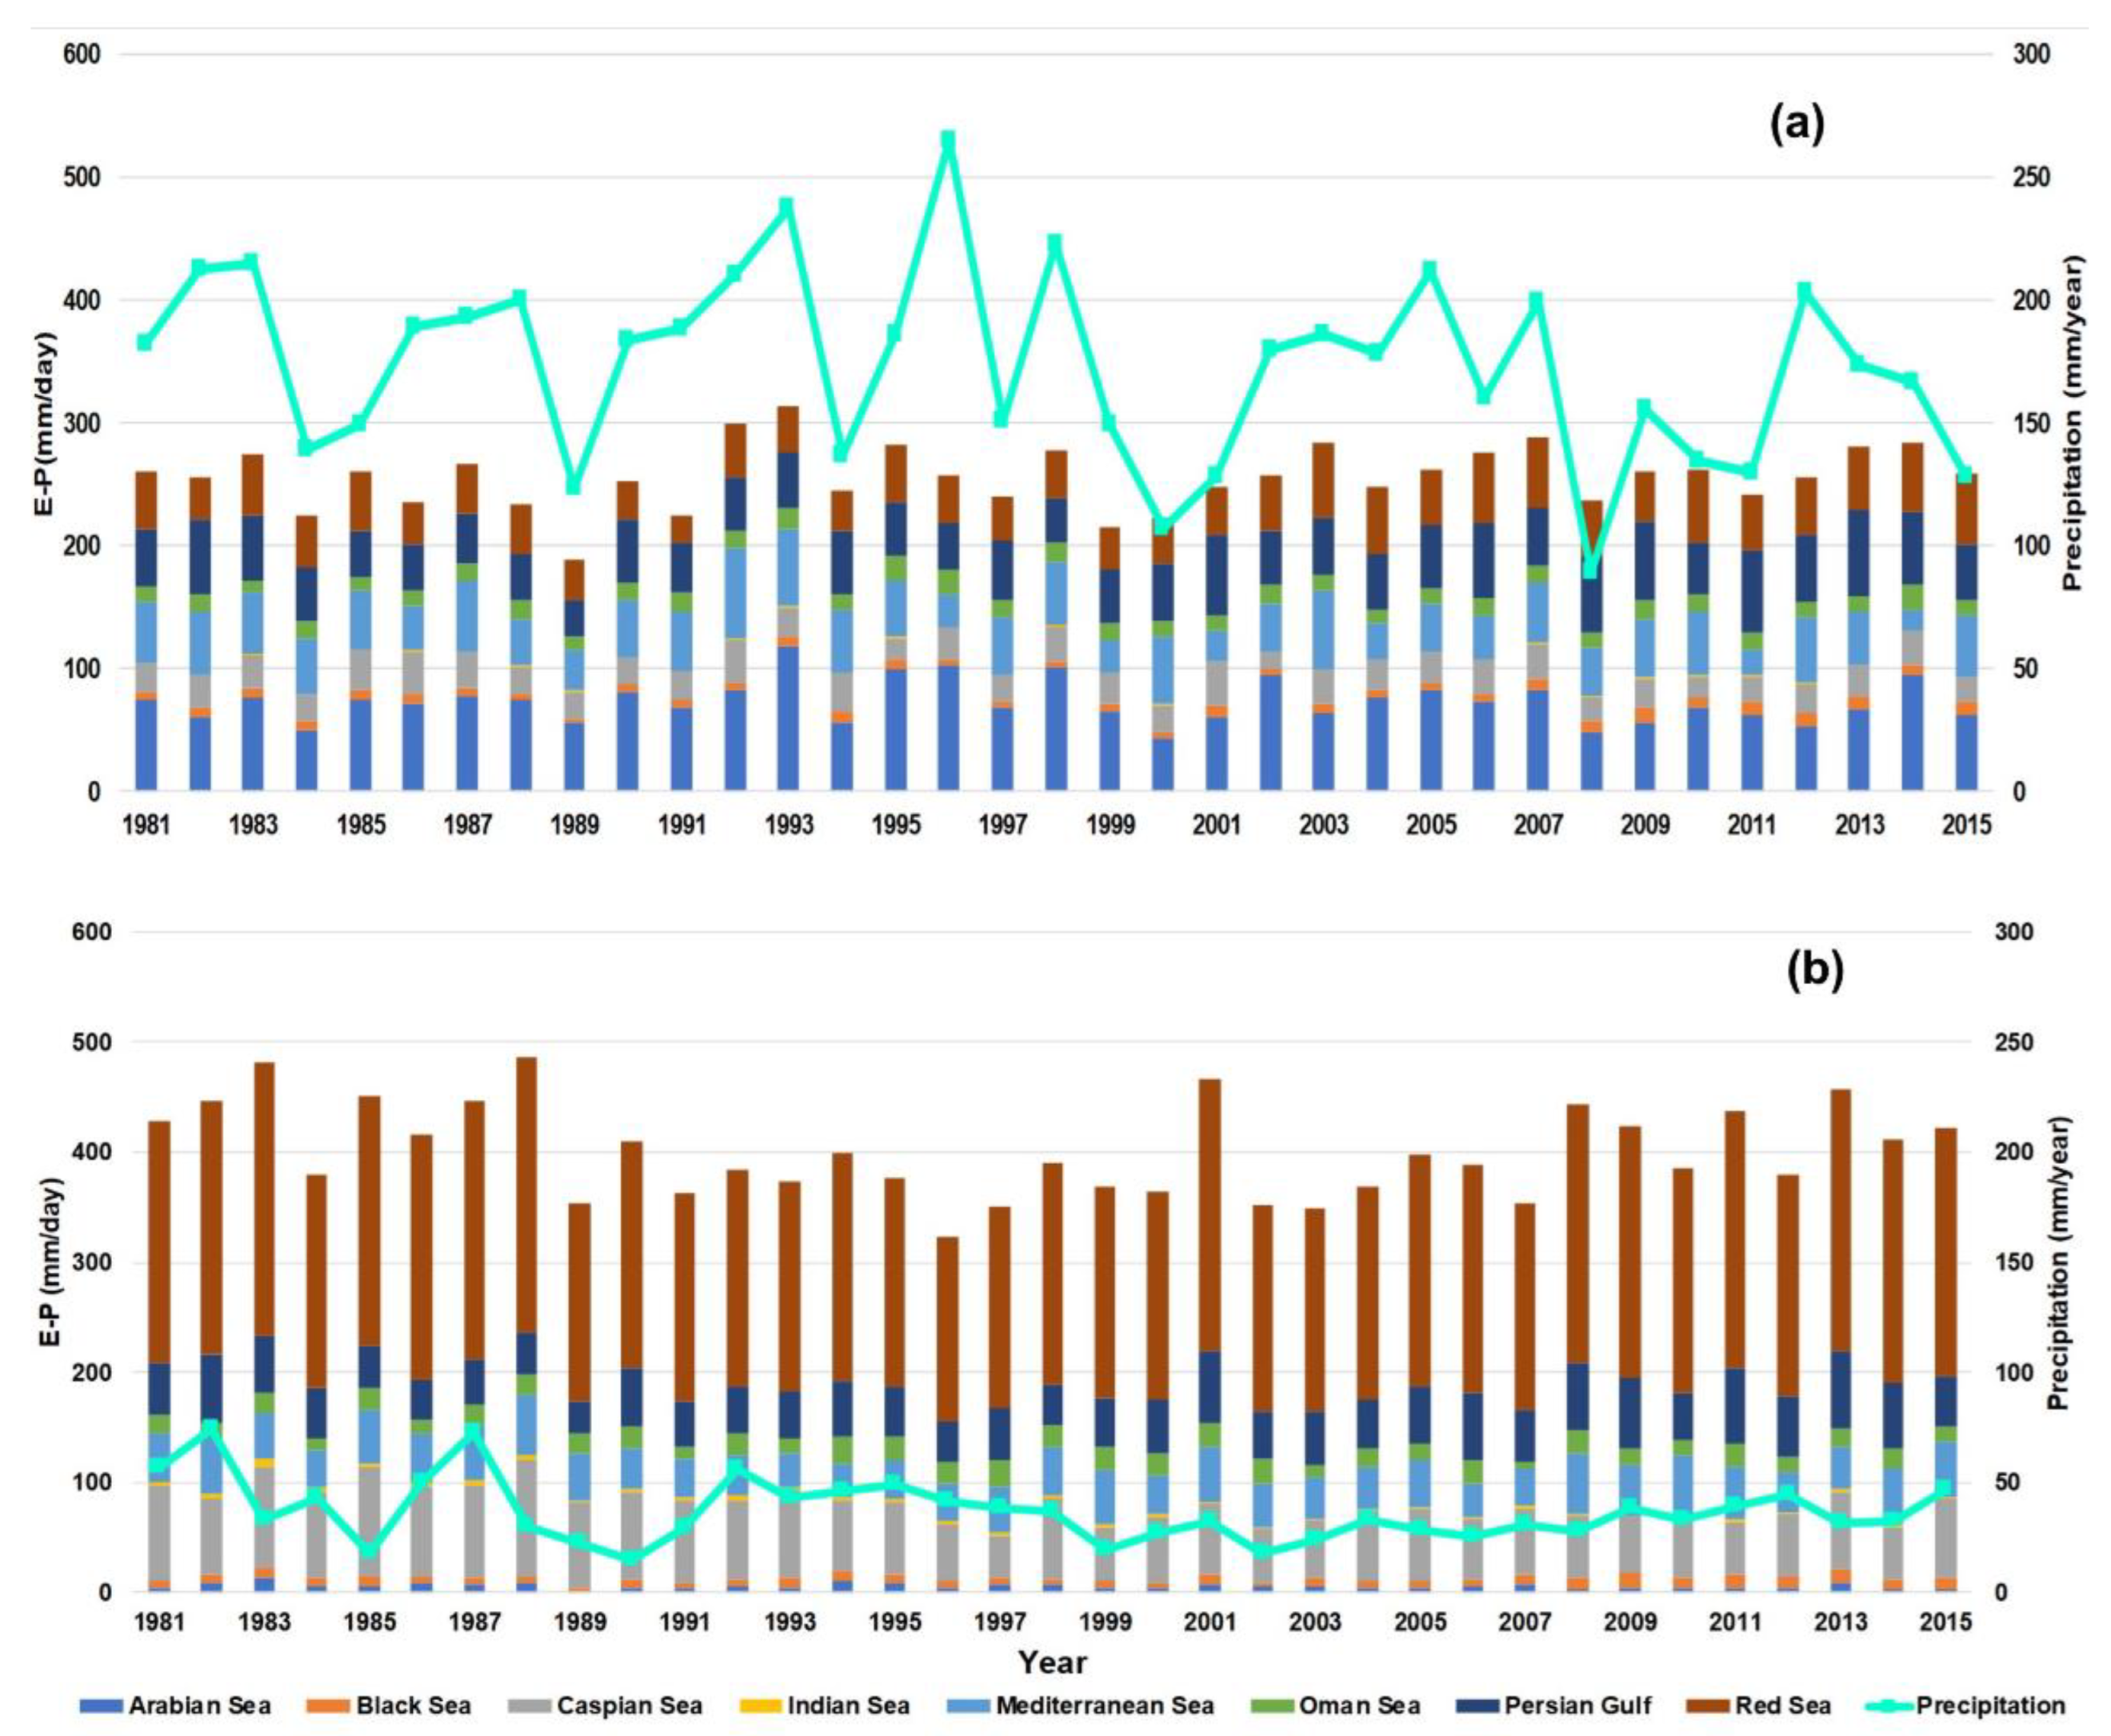
The temporal variations of moisture uptake rate from various sources in Iran and Iran’s average precipitation amount have been demonstrated in
Figure 5. During the wet period, Iran’s average precipitation often follows approximately the same trend as the moisture uptake rate (
Figure 5a). This is due to the fact that Iran’s average precipitation amounts are dominantly controlled and supplied by the mentioned moisture sources, while the role of local small-scale parameters is negligible. During the dry period, Iran’s average precipitation does not demonstrate the same trend as the moisture uptake rates (
Figure 5b). This is due to the severe atmospheric stability caused by the Azores subtropical high-pressure system over most parts of Iran from which prevents precipitation occurring during the dry period. The role of local and small-scale parameters in controlling infrequent precipitation events is notable during the dry period in most parts of Iran except for the south-eastern part of the country where the mT airmass is active.
To study the variations of (E − P) in the Mediterranean and the Arabian Seas (the dominant moisture uptake sources during the wet periods) and mechanisms controlling precipitation amount in the dry (1984, 1989, 1994, 2000, 2001, 2008, 2010, 2011, and 2015), as well as wet years (1993, 1996, and 1998) in the study period, geopotential height data has been applied. Geopotential height data were derived from the ERA-Interim gridded data series in 850, 700, and 500 hpa to study the anticyclone and cyclone locations responsible for precipitation.
Negative (positive) frequency of cyclones as well as positive (negative) sea-level pressure anomalies were observed over the Mediterranean Sea during dry (wet) years. The negative anomaly of relative humidity over the Mediterranean Sea as well as negative anomalies in the meridional and zonal winds was also observed during the dry years which resulted in a decrease in moisture flux from the Mediterranean Sea and a precipitation amount decrease over Iran, mainly in the western part of the country. In addition, studying the variations of the Arabian Sea anticyclone (AAC) showed an obvious increase (decrease) in the number of anticyclones mainly over the East coast of the Arabian Peninsula and the western part of the Arabian Sea at the 500 and 750 hpa troposphere level during the wet (dry) years.
Studying (E-P) values of the main moisture sources during the dry period did not show a meaningful correlation between any of the moisture sources and precipitation in most of the study period. However, mild correlation has been observed between the Indian Ocean and amount of precipitation. The previous studies [
19,
20] also confirmed the dominant role of the Indian Ocean in summer (dry period) precipitation mainly in the south-eastern part of Iran. During dry (wet) years, the Indian Ocean SST often shows negative (positive) anomalies.
According to the stepwise model outputs, among the moisture sources that influence Iran during the wet period, the moisture originating from the Arabian Sea, the Mediterranean Sea, and the Persian Gulf directly influenced the precipitation in Iran, and the stepwise model shows a high R2 = 0.79. These water bodies are the dominant moisture-providing sources of precipitation across Iran during the wet period. In contrast, during the dry period, the Red Sea only has a weak correlation with the precipitation amount, while other moisture sources have a negligible correlation with the precipitation amount. The stepwise model developed for the dry period shows a very weak R2 = 0.11. Although moisture uptake during the dry period is also notable, this huge amount of moisture rarely turns to precipitation due to numerous phenomena such as extremely high air temperatures over large parts of Iran. This reinforces the Azores subtropical high-pressure system which causes atmospheric stability over large parts of Iran and leads to an extreme decrease in precipitation.
As mentioned earlier, although (E − P) values from each moisture source were almost the same during both periods, the precipitation significantly decreased during the dry period compared to that in the wet period. The (E − P) values of each moisture source demonstrate the moisture uptake from each source and do not completely clarify the correlation between moisture sources and precipitation amount in Iran. Therefore, it is important to determine the fractional importance of various moisture sources that influence precipitation across Iran.
3.1. Importance of Moisture Sources (Predictor Variables) That Influence Precipitation Amount (Target Variable) Determined Using the Ahp and Ml Methods
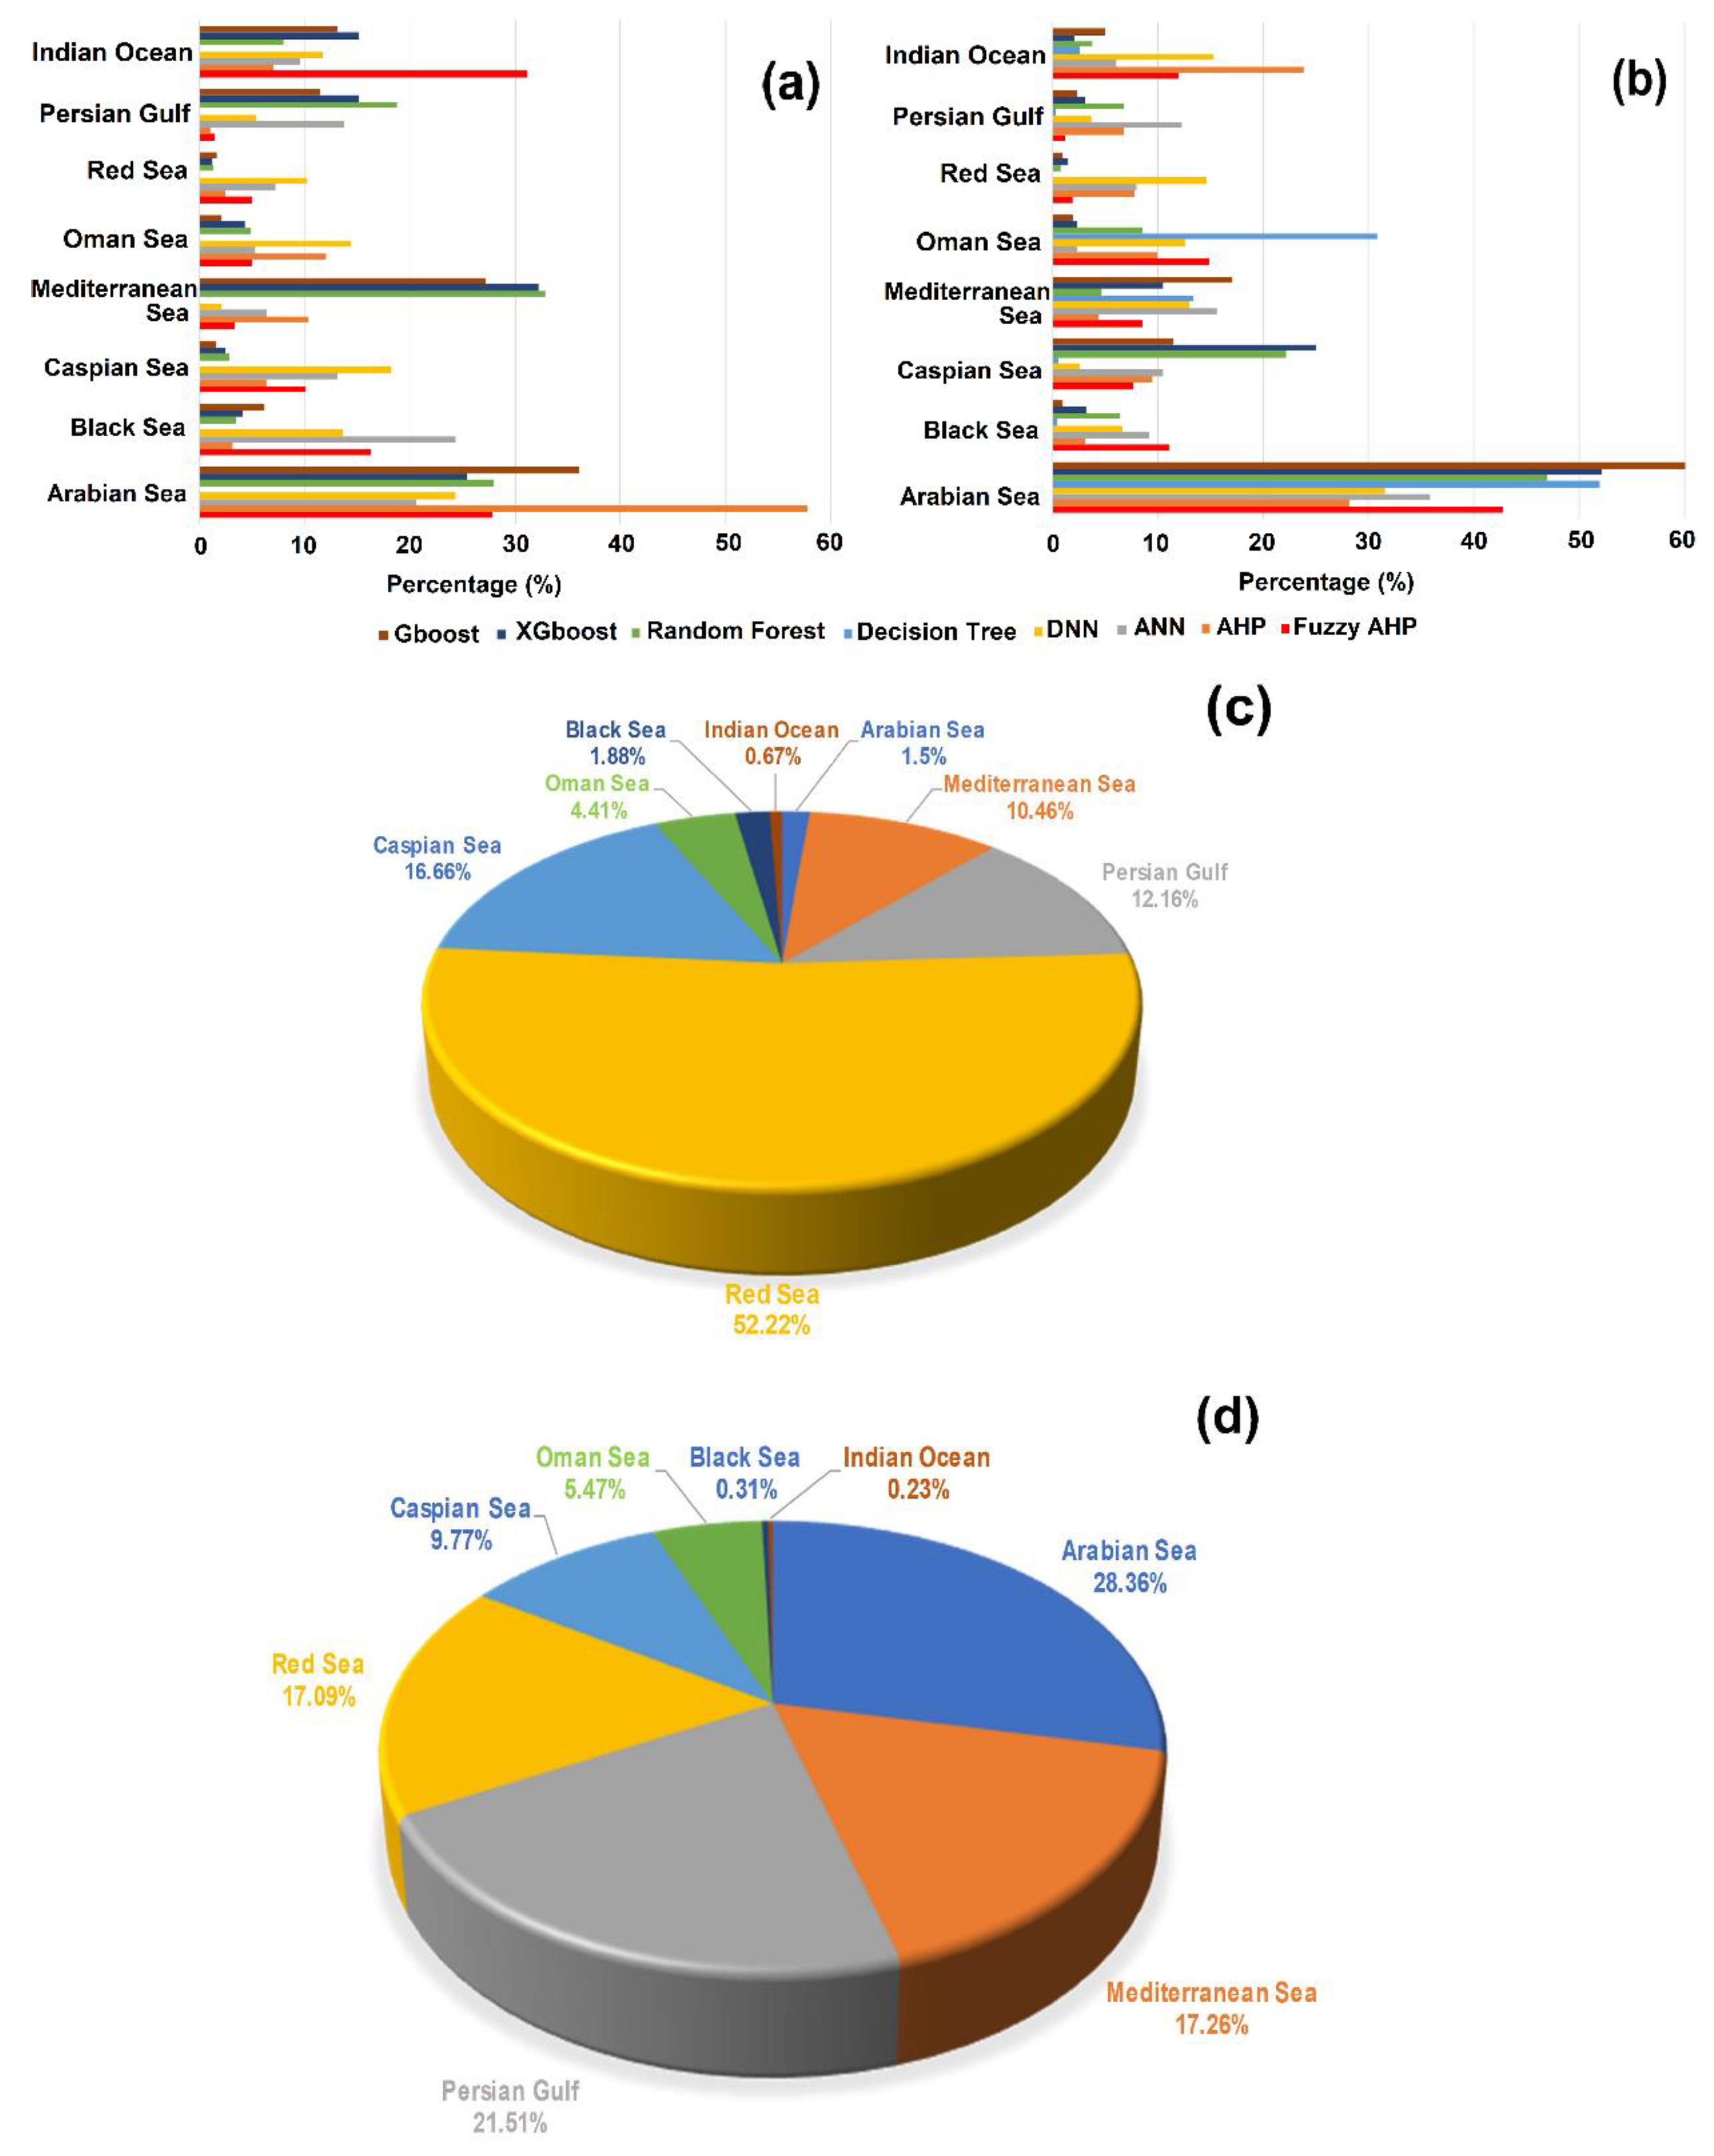
To study the fractional importance of various moisture sources that influence precipitation in Iran, AHP (simple and fuzzy AHP) methods were used first. During the wet period (
Figure 6a), when most of the precipitation occurs in Iran, the Arabian Sea had a dominant fractional importance in influencing the amount of precipitation in Iran according to results of both AHP models. The results of the ML models also verified the dominant effect of the Arabian Sea. The Arabian Sea, as the dominant moisture provider for Iran with a share of 28.3%, was verified as the predominant influence on precipitation amounts (the fractional importance of this moisture source varied from 28.1% in AHP to 60.1% in the Gboost models). However, the Red Sea and Persian Gulf, with high contributions toward moisture with shares of 17.1% and 21.5%, respectively, had a weak influence on the amount of precipitation. The fractional importance of the Red Sea varied from 0.0% in Decision Tree to 14.6 in DNN models, whereas that of the Persian Gulf varied from 0.2% to 12.3%, respectively. In contrast, the Black Sea and Indian Ocean, which make a very weak contribution to moisture provision for Iran with shares of 0.31% and 0.23%, respectively, had a stronger role in influencing the precipitation amount. The fractional importance of the Black Sea varied from 0.46% in Decision Tree to 11.08% in fuzzy AHP models, whereas for the Persian Gulf, it varied from 2.1% in XGboost to 23.9% in AHP models. These differences between the moisture contribution and fractional importance of the moisture source that influences precipitation in Iran are because of local parameters. These local factors influence atmospheric moisture and cause precipitation. For instance, moisture from the Red Sea and Persian Gulf normally cannot be transferred deep inside the Iran Plateau, and these sources normally influence low-elevation regions in the southern part of the Zagros Mountains [
7]. In this region, climatology is not appropriate for precipitation to occur [
2]. However, moisture from the Black Sea is transferred to Iran via a maritime polar air mass which mainly influences the north-western part of the country. The climatic conditions for moisture from the Black Sea to transform into precipitation are entirely appropriate in this part of Iran.
During the dry period (
Figure 6b), the situation was even more complicated, as the role of local parameters was even stronger than that of the wet period. In the dry period, various moisture sources exhibited dominant fractional importance, influencing the precipitation amount according to the studied ML methods. For instance, according to the Gboost, DNN, and AHP models, the Arabian Sea was the dominant fraction. According to the ANN model, the Black Sea exhibited dominant fractional importance, whereas according to the fuzzy AHP model, it was the Indian Ocean. Finally, according to the RF and XGboost models, the Mediterranean Sea had a dominant fractional influence on precipitation. A significant difference in the various moisture sources between moisture contribution and fractional importance was also observed during the dry period. For instance, the Red Sea with a dominant role as a moisture provider for Iran with a share of 52.2%, had a very weak influence on precipitation amount (with fractional importance varying from 1.2% in Gboost to 10.2% in DNN models). This is owing to intense atmospheric stability within the Iran plateau, mainly in the southern part of the country, where moisture from this source enters Iran [
2]. Unlike the Red Sea, the contribution of the moisture uptake from the Black Sea and Indian Ocean was very scarce, with shares of 1.9% and 0.7%, respectively; however, their fractional importance had a higher influence on precipitation in Iran. The fractional importance of the Black Sea varied from 3.1% in Gboost to 24.3% in ANN models, whereas that of the Indian Ocean varied from 7.0% in AHP to 31.19% in fuzzy AHP models. Regarding moisture from the Black Sea during the dry period, its influence zone inside Iran in the north-western part of the country was less affected by atmospheric stability which makes the situation more suitable for precipitation to occur. Regarding the Indian Ocean, the moisture from this water body is transferred via a maritime tropical air mass and causes intense monsoon precipitation in the south-eastern part of the country. Similar to the Black Sea, the moisture influence zone of the Indian Ocean within Iran was not affected by atmospheric stability, and suitable conditions existed for air parcels to move upward by an updraft and precipitation to occur.
3.2. Simulation of the Precipitation Amount Based on (E − P) Values of Various Moisture Sources Using ML Models and Validation of the Accuracy of the Developed Models
In addition to evaluating the fractional importance of various moisture sources that influence the precipitation amount across Iran, the precipitation amount was also simulated using various ML techniques. The (
E −
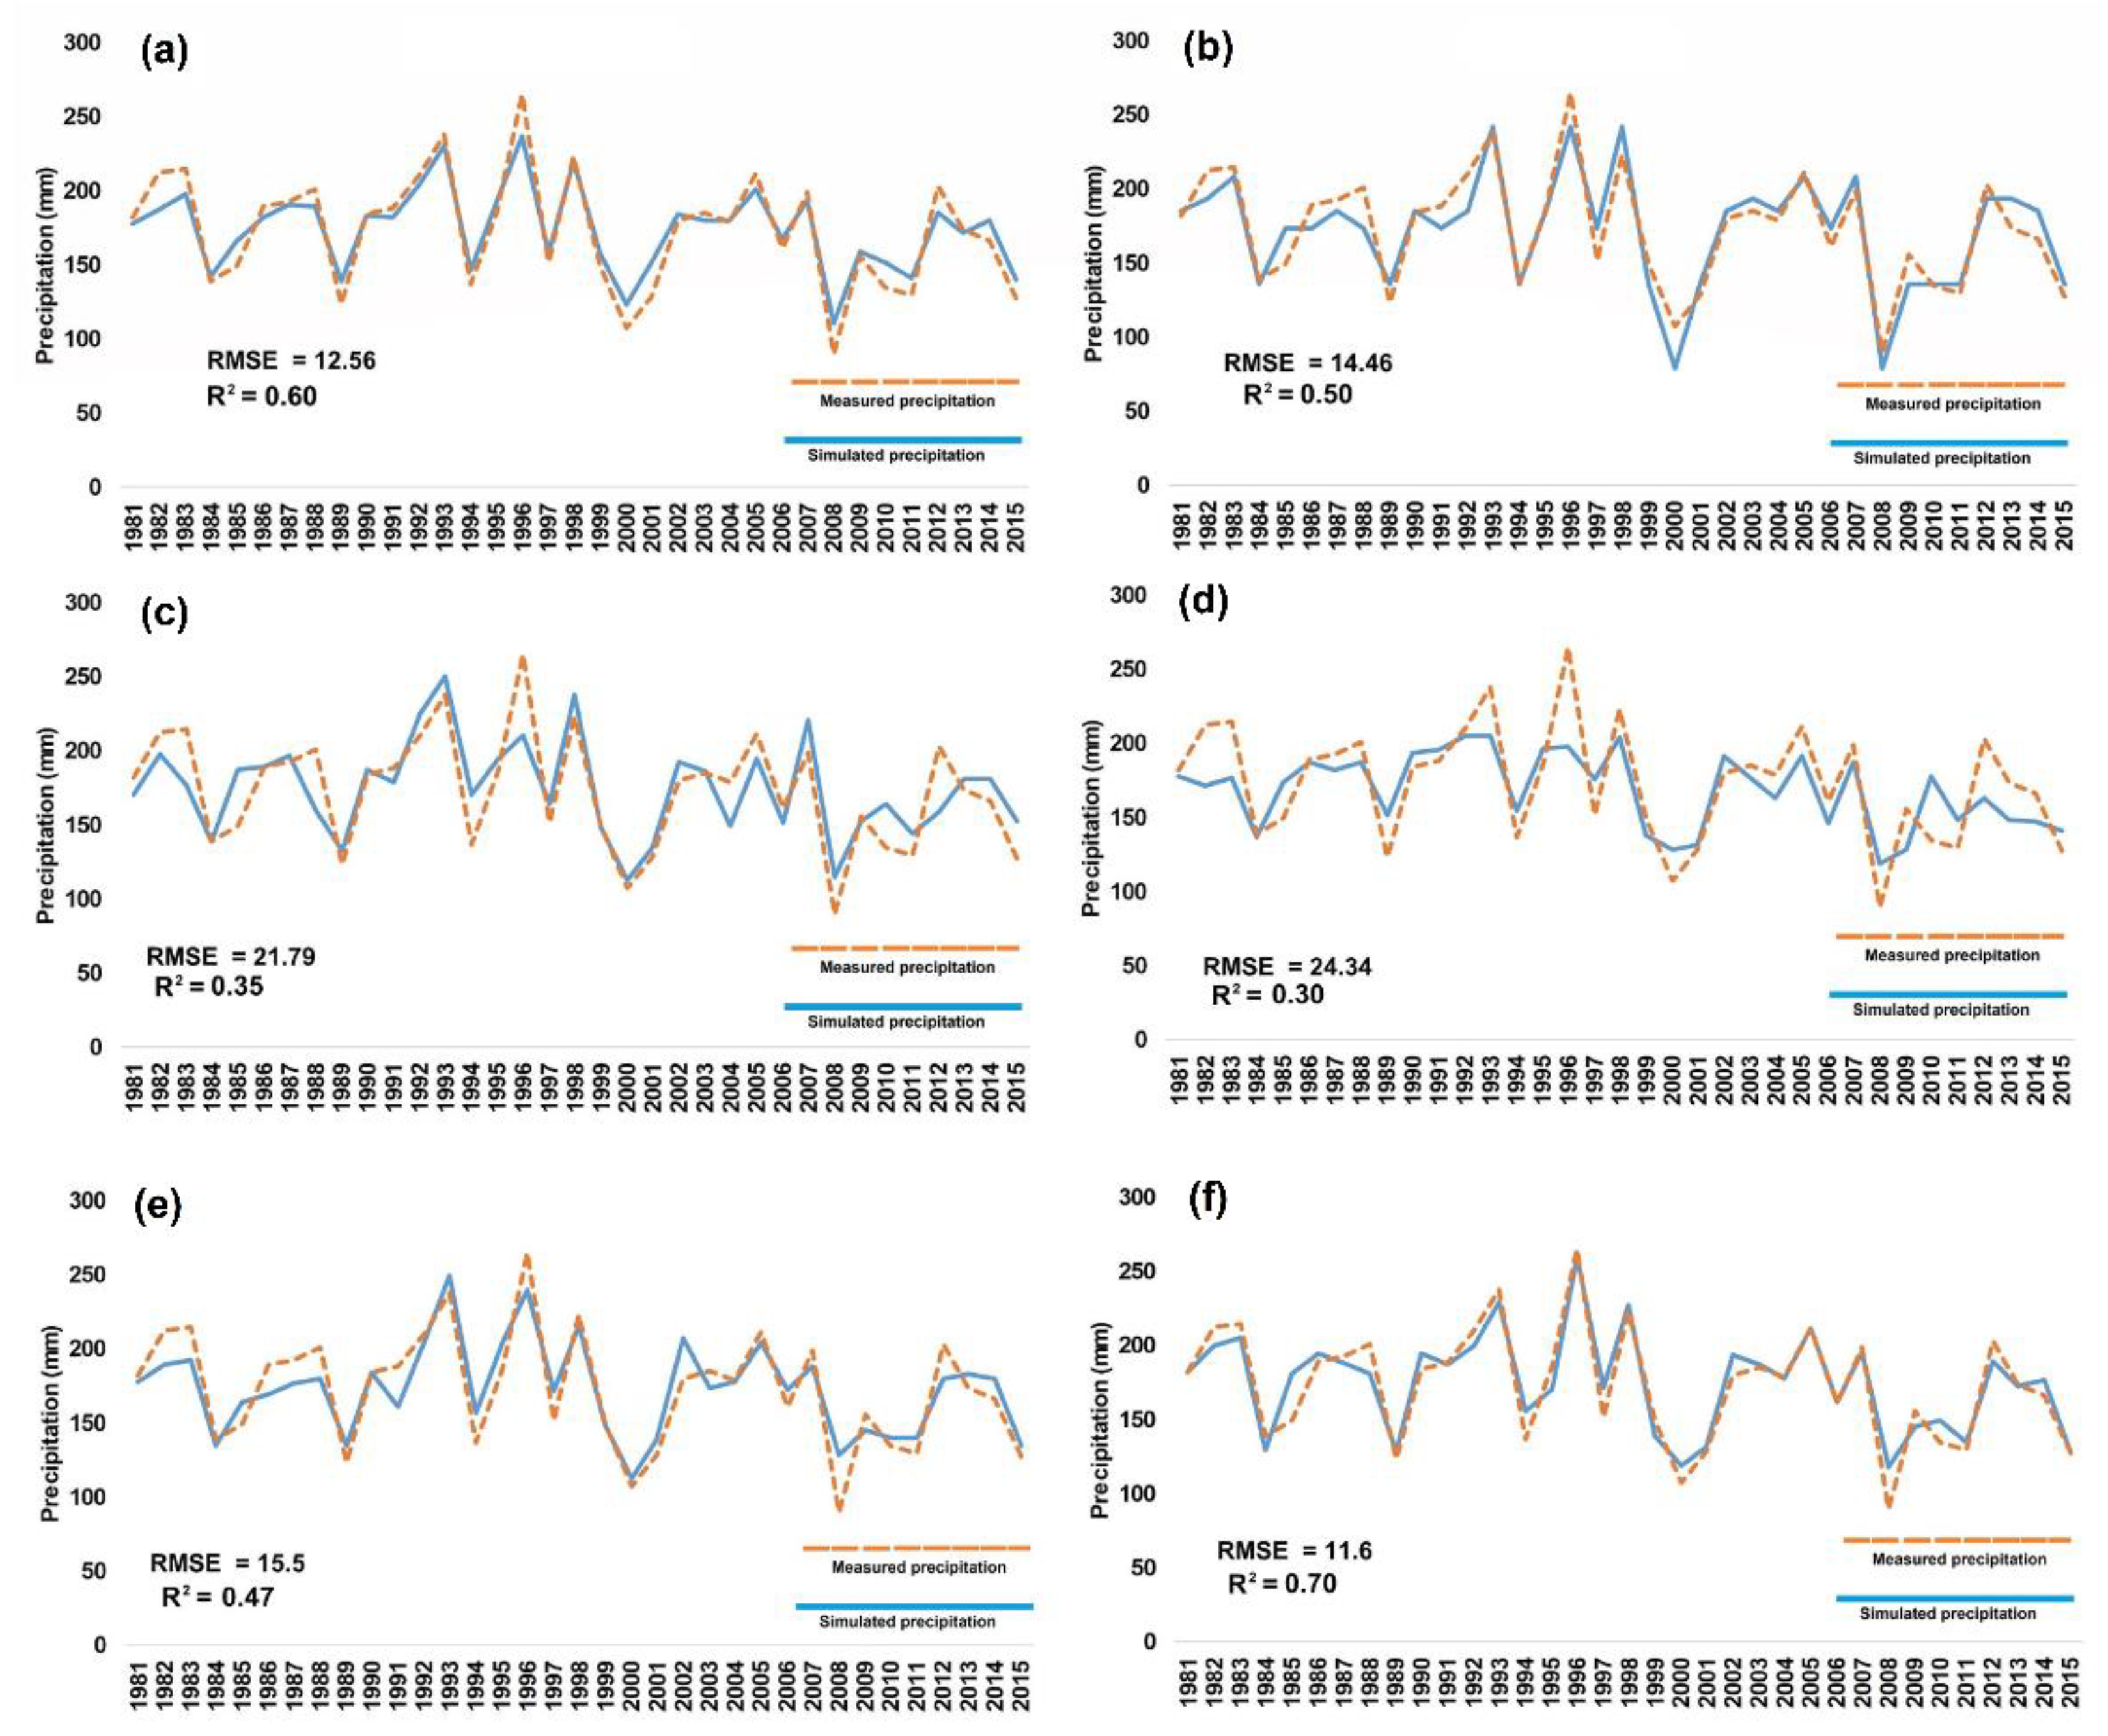
P) values for each moisture source were used as predictor variables and the precipitation amount was used as a target variable in the ML model simulations. The results for the wet period (
Figure 7) show that the ANN and DNN models cannot simulate precipitation amounts accurately according to the very high RMSE values of 21.79 and 24.34 as well as very low R
2 values of 0.35 and 0.30, respectively. Among the evaluated ML models, XGboost was determined to be the most accurate model as it showed the lowest RMSE (11.6) and the highest R
2 (0.70) values.
In contrast to the wet period, the model developed for the dry period (
Figure 8) was not reliable and could not accurately predict the precipitation amount. Among the ML models developed for the dry period, XGboost showed the lowest RMSE (4.97) and the highest R
2 (0.35) values, and it could predict precipitation more accurately compared to the other models. The low accuracy of the ML models is because the dry period precipitation in Iran is not dominant related to the amount of moisture transferred to this country, and is mainly related to local and small-scale climatological conditions as well as the severe atmospheric stability mentioned earlier in this study.
