Article

Research on Outdoor Thermal Comfort of Children’s Activity Space in High-Density Urban Residential Areas of Chongqing in Summer

College of Architecture and Urban Planning, Chongqing Jiaotong University, No. 66 Xuefu Rd., Chongqing 400074, China
*
Author to whom correspondence should be addressed.
Atmosphere 2022, 13(12), 2016; https://doi.org/10.3390/atmos13122016
Submission received: 28 October 2022 / Revised: 25 November 2022 / Accepted: 26 November 2022 / Published: 30 November 2022
(This article belongs to the Section Biometeorology and Bioclimatology)

Abstract

:
Children’s activity spaces in communities designed for children’s recreation are related to children’s safety and physical health. Outdoor thermal comfort of children’s activity spaces in high-density urban residential areas is the key to children’s use in summer. To this end, meteorological measurements and questionnaires were conducted to better understand children’s outdoor thermal comfort in summer, and children’s outdoor thermal comfort was evaluated using the universal thermal climate index (UTCI) for children’s activity spaces in high-density residential areas of Chongqing, China. We draw four conclusions: (1) Different landscape types of children’s activity spaces have different effects on outdoor thermal comfort, and gender differences also affect outdoor thermal comfort in the same type of children’s activity space. (2) Global radiation (G) and air temperature (Ta) were the primary meteorological factors influencing children’s thermal sensations. (3) Outdoor thermal comfort of children’s activity spaces in high-density urban residential areas was inferior overall. (4) Neutral UTCI (NUTCI) for male and female children in Chongqing were 22.2 °C and 21.8 °C, NUTCI ranges (NUTCIR) were 18.4–26.1 °C (male) and 16.2–27.3 °C (female), and acceptable UTCI ranged from 23.2 to 39.1 °C (male) and 22.8 to 40.3 °C (female). The results provide guidance for landscape architects and urban planners in the Chongqing area to create comfortable outdoor spaces for children, improve their physical activity levels, and promote their physical and mental health.

1. Introduction

The global urbanization process is expected to reach a new stage by 2030, with cities housing more than 60% of the world’s population [1]. Rapid urban population growth encourages high-density development, reshapes the city’s natural underlying surface, alters the balance of radiation energy, and causes a slew of climate and environmental issues, such as the heat island effect, deterioration of urban air quality, and enhanced greenhouse effect [2]. Meanwhile, the uncontrolled expansion of urban buildings in vertical space affects the surface energy balance and air convection in local areas of the city, which changes the internal urban thermal environment and may aggravate the urban heat island effect [3]. High-density urban residential areas are located in the core areas of cities, which are densely populated areas and are most severely affected by the heat island effect, and increased temperatures will have a severe impact on the health of urban residents [4]. Studies have shown that high temperatures can easily lead to heat stroke, heat-related diseases (coronary heart disease, cerebrovascular disease, heart disease, etc.), and even life-threatening conditions [5]. As the basic unit of a city, urban settlements are also essential places for urban residents to carry out their daily activities [6]. Therefore, improving the outdoor thermal environment of high-density urban residential areas plays a vital role in alleviating the urban heat island effect and improving the health of residents.
Thermal comfort refers to “the psychological state that expresses satisfaction with the thermal environment through a subjective assessment” [7]. Outdoor thermal comfort is the most critical factor affecting residents’ outdoor activities. Urban residential community spaces for children provide access to nature and recreation, and these natural and artificial design elements support children’s health and safety [8]. However, the design of children’s activity spaces in high-density urban residential areas lacks natural elements. Although they all meet safe design guidelines, the landscape elements and amenities within the activity spaces can lead to uncomfortable thermal environments (e.g., solar radiation, high temperatures, and air pollution) [9]. In order to encourage more physical activity in children, we need to fully consider the incidence of heat, heat stroke, sunburn, and other respiratory illnesses (such as asthma) in the hot summer months while also providing outdoor spaces designed for the safety and recreation of children [10,11]. Improving children’s thermal comfort in summer outdoor activities to minimize extended exposure to the hot sun and heat is critical for the pre-stage landscape design.
In recent years, outdoor thermal comfort for children has been extensively discussed in the worldwide research literature on human thermal comfort [12]. There are significant physiological differences between children and adults, leading to differences in their ability to regulate heat storage and dissipation [13]. Children are more susceptible to hot weather than adults in the summer, so they are also sensitive to hot conditions [14]. Under the same conditions, children showed higher levels of physical activity compared to other age groups in thermal sensation vote (TSV) [13]. In addition, studies have shown that children and adults have different comfort temperature ranges, which are related to differences in physical condition, basal metabolic rate, and thermal resistance of clothing [15]. Children are more sensitive to their environment based on their unique physiological and psychological characteristics. Physically, children spend more time outdoors than adults; Psychologically, however, children are susceptible to experiences, perceptions, personal preferences and feedback mechanisms associated with hot environments [16]. Finally, a series of studies and experimental results proved that the heat load experienced by the body is related to the local climate as well as to the design of the residential communities. Therefore, design interventions can be used to improve the thermal environment of the communities and create play spaces that are conducive for children to engage in outdoor activities, which will help children thrive in safe and hot conditions for extended periods even in the hot summer [17].
In this study, three representative children’s activity spaces in high-density urban residential areas in Chongqing were selected to study the children’s outdoor thermal comfort (OTC) in summer through meteorological measurements and questionnaires. The purposes of this study are as follows: (1) to investigate the interaction between meteorological parameters and human thermal comfort; (2) to determine the neutral temperature and neutral temperature range of children’s outdoor thermal comfort in high-density urban residential areas; and (3) to provide a scientific basis for urban planners and landscape architects to plan and design residential areas.

2. Methods

2.1. Study Area

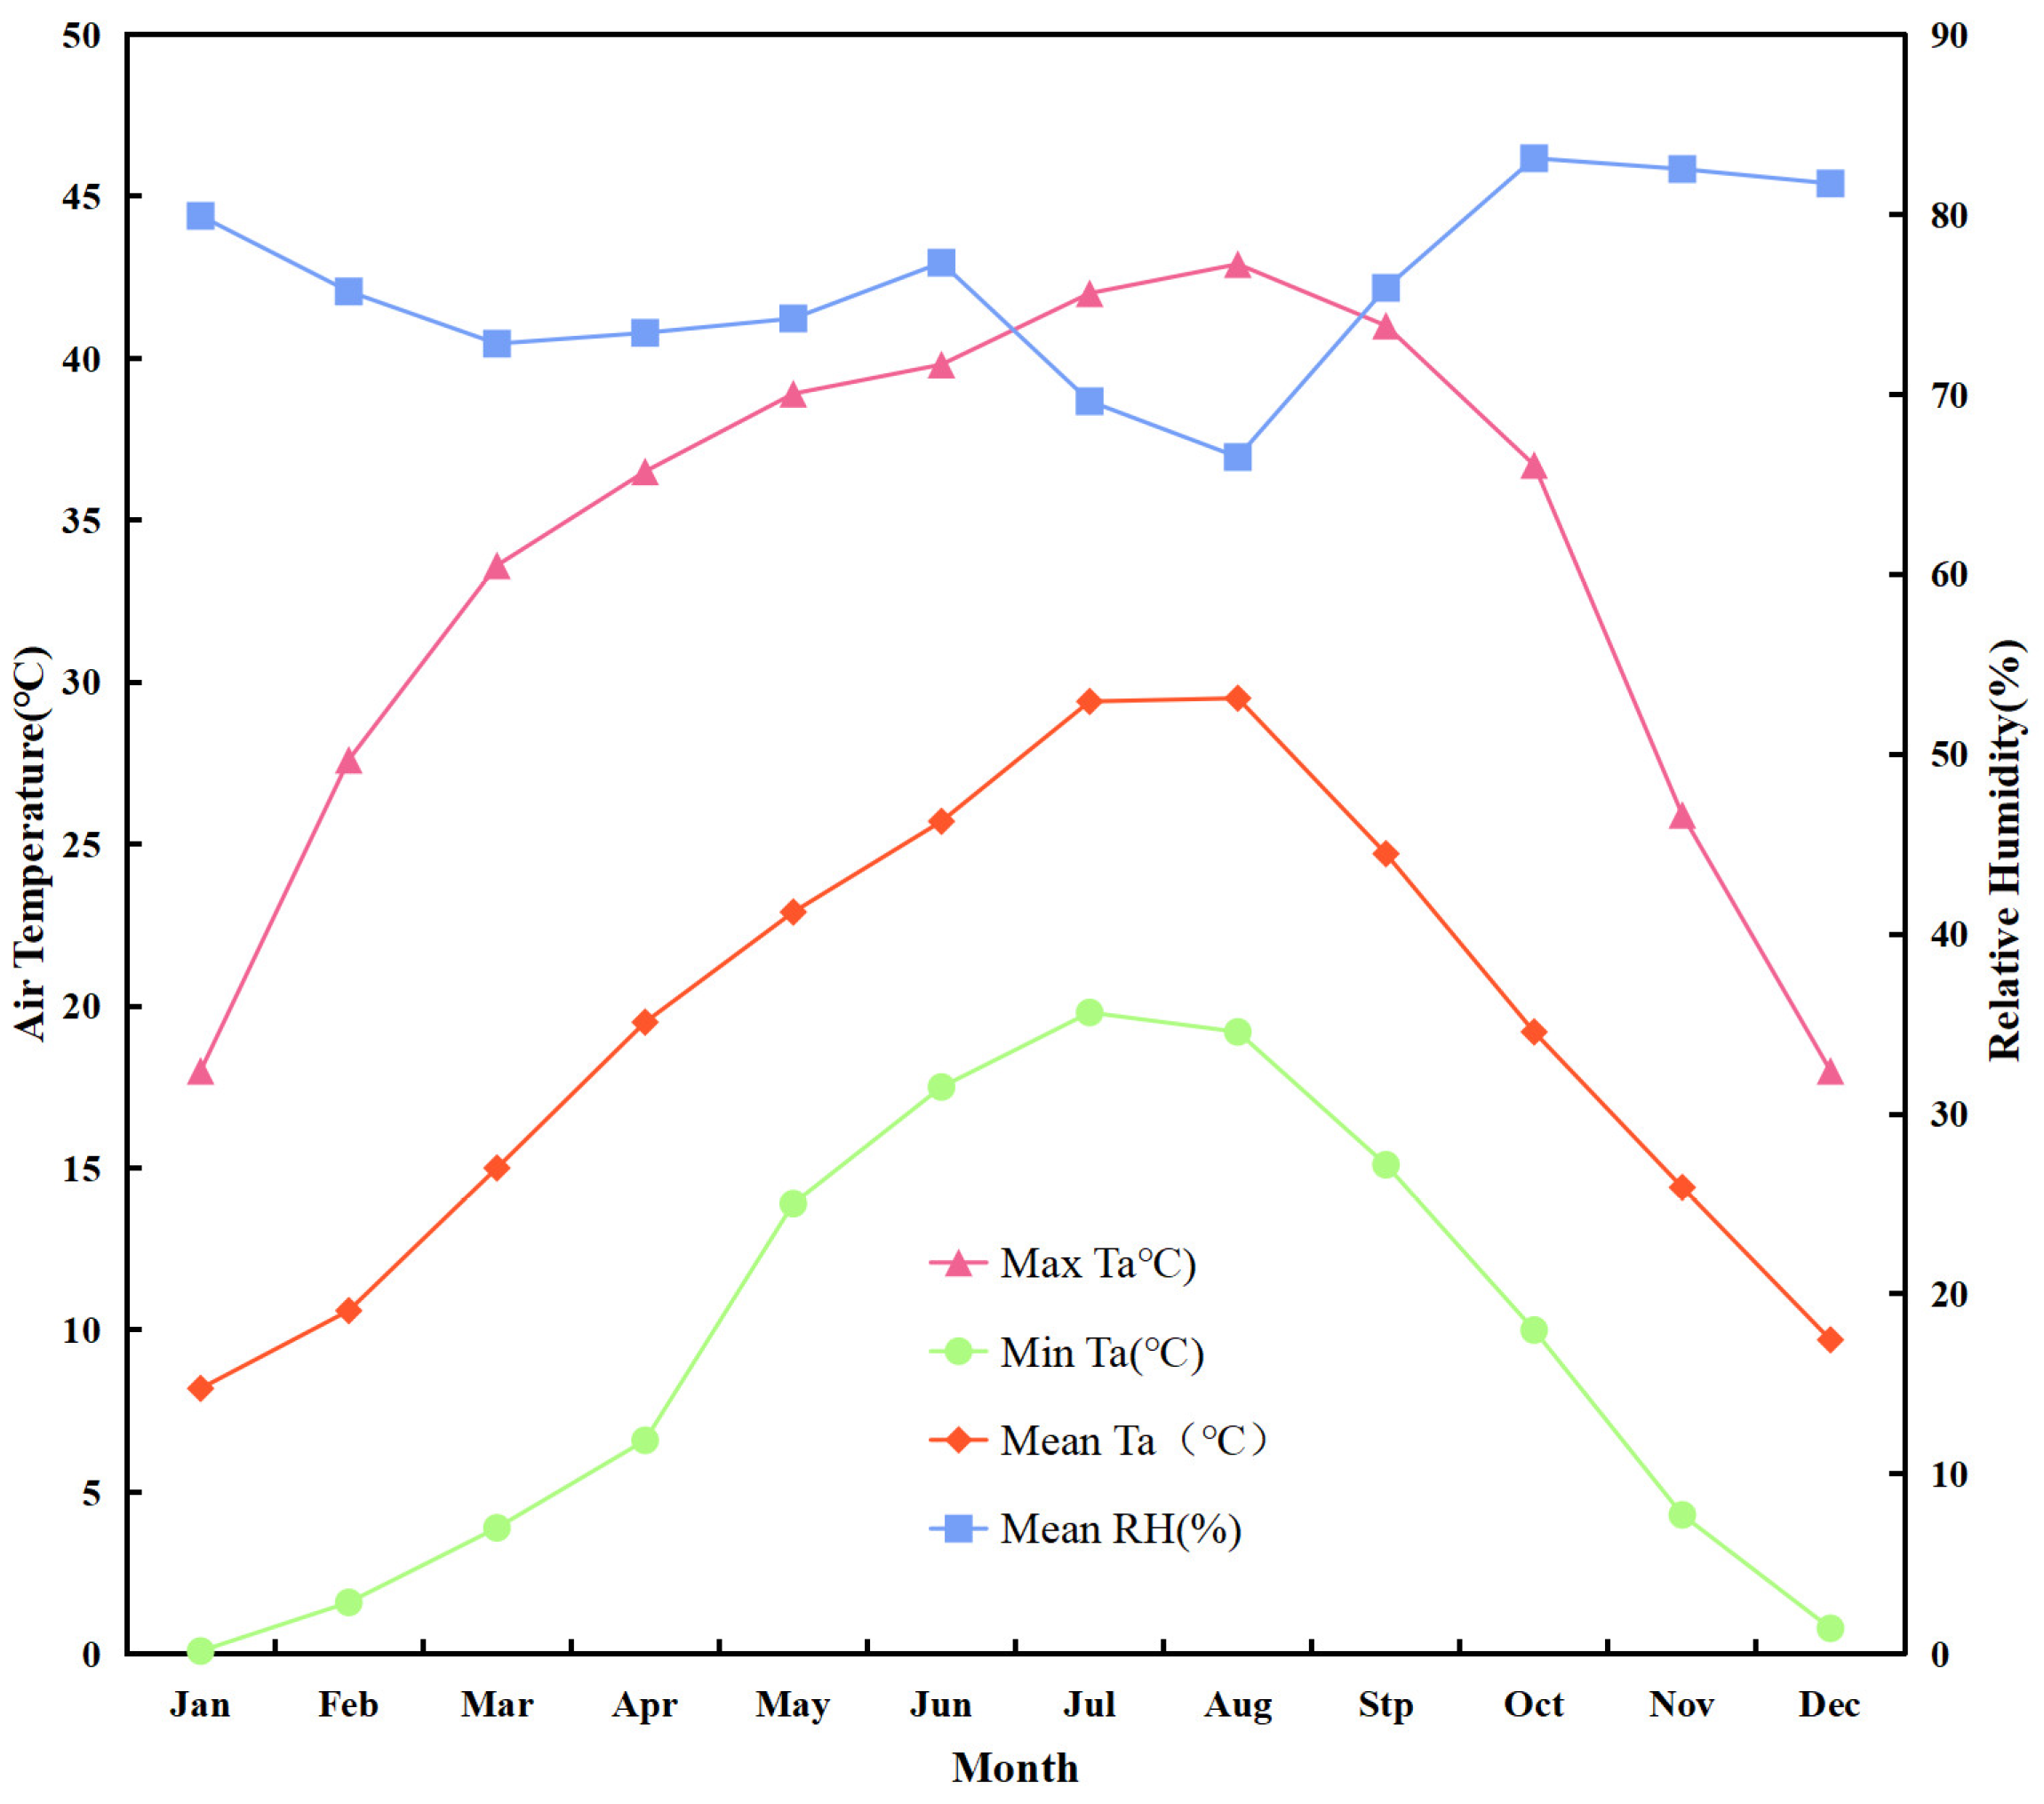
Chongqing is located in the southwest of China and the upper reaches of the Yangtze River. It is directly under the Central Government of the People’s Republic of China and a national central city, between longitude 105°11′~110°11′ E and latitude 28°10′~32°13′ N (Figure 1). The Köppen climate classification of Chongqing is the subtropical monsoonal humid climate (Cwa) [18], according to the Code for Thermal Design of Civil Buildings climate classification is a hot summer and cold winter zone [19], with hot summer and drought, and wet and foggy winter. The annual average temperature of Chongqing is above 18 °C. The highest temperature is in July and August, with the average daily temperature above 33 °C and the extremely high temperature of up to 43 °C. The mean monthly temperature is 27 °C–38 °C (Figure 2). The temperature in Chongqing has increased significantly over the past 20 years, about 1.6 times higher than the global warming trend. Especially after 2010, Chongqing has an average of more than 20 days of extreme heat per year in summer (Tmax > 35 °C) [20]. Chongqing is known as a “stove city”, with long-lasting summers and high average temperatures. However, a higher air temperature is often associated with a higher building density and the urban heat island effect, which is strongest in Chongqing in summer, with the maximum heat island intensity occurring around 24:00 and can be as high as 2.5 °C [21]. Therefore, this paper focuses on the children’s outdoor thermal comfort in Chongqing in summer.
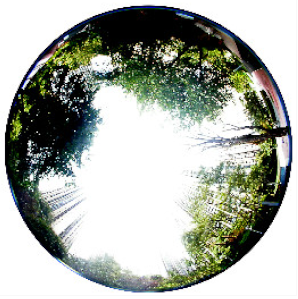
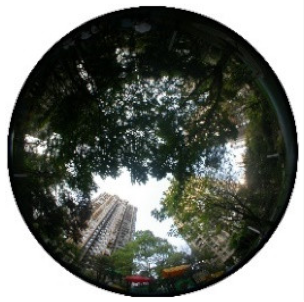
For the study of children’s outdoor thermal comfort in summer in high-density urban residential areas of Chongqing, the selected neighborhoods need to follow the following principles: 1. The residential communities are built between 2011–2021, have suitable living environments, and have diverse and representative internal open space landscape elements. 2. The residents have a high occupancy rate, which can ensure an adequate sample for the questionnaire survey. 3. Finally, there are clear children’s activity spaces and abundant activity facilities. After careful consideration, three residential communities with different landscape types, i.e., R1, R2, and R3, were selected as the outdoor thermal environment testing sites for children’s activity spaces Table 1. The fisheye photos were taken with a Nikon Coolpix 4500 camera and a Samyang fisheye lens (AE 12 mm F2.8), and sky view factors (SVF) were calculated by RayMan (2.1).

2.2. Measurement Campaign

The meteorological measurements for this study were conducted in sunny weather during 28 July to 6 August 2022, and the measurement time was 9:00–19:30. The measurement date corresponded to the hottest month in Chongqing city [22]. The measurement time was based on the most common time for residents’ activities to ensure that the survey could cover most school-age children in the residential community. The field trial consisted of three main parts: weather parameter testing, questionnaire survey, and activity recording.
The trial is based on the main test parameters of the outdoor thermal comfort evaluation index, including air temperature (Ta), relative humidity (RH), wind speed (V), global radiation (G), and mean radiation temperature (Tmrt). Air temperature, relative humidity, wind speed, and global solar radiation can be directly measured by corresponding professional instruments. However, the mean radiation temperature needs to be calculated by substituting the three parameters of black globe temperature, air temperature, and wind speed into the equation (Equation (1)), so the five main thermal environment parameters can be directly measured by professional equipment in this study, namely, air temperature (Ta), relative humidity (RH), wind speed (V), global radiation (G), and black globe temperature (Tg). Mean radiation temperature (Tmrt) can be obtained by calculating [23]:
T m r t = T g + 273 4 + 1.10 × 10 8 V a 0.6 ε D 0.4 × T g T a 1 4 273
where D is the spherical diameter (D = 50 mm in this study) and ε is the globe emissivity (ε = 0.95).
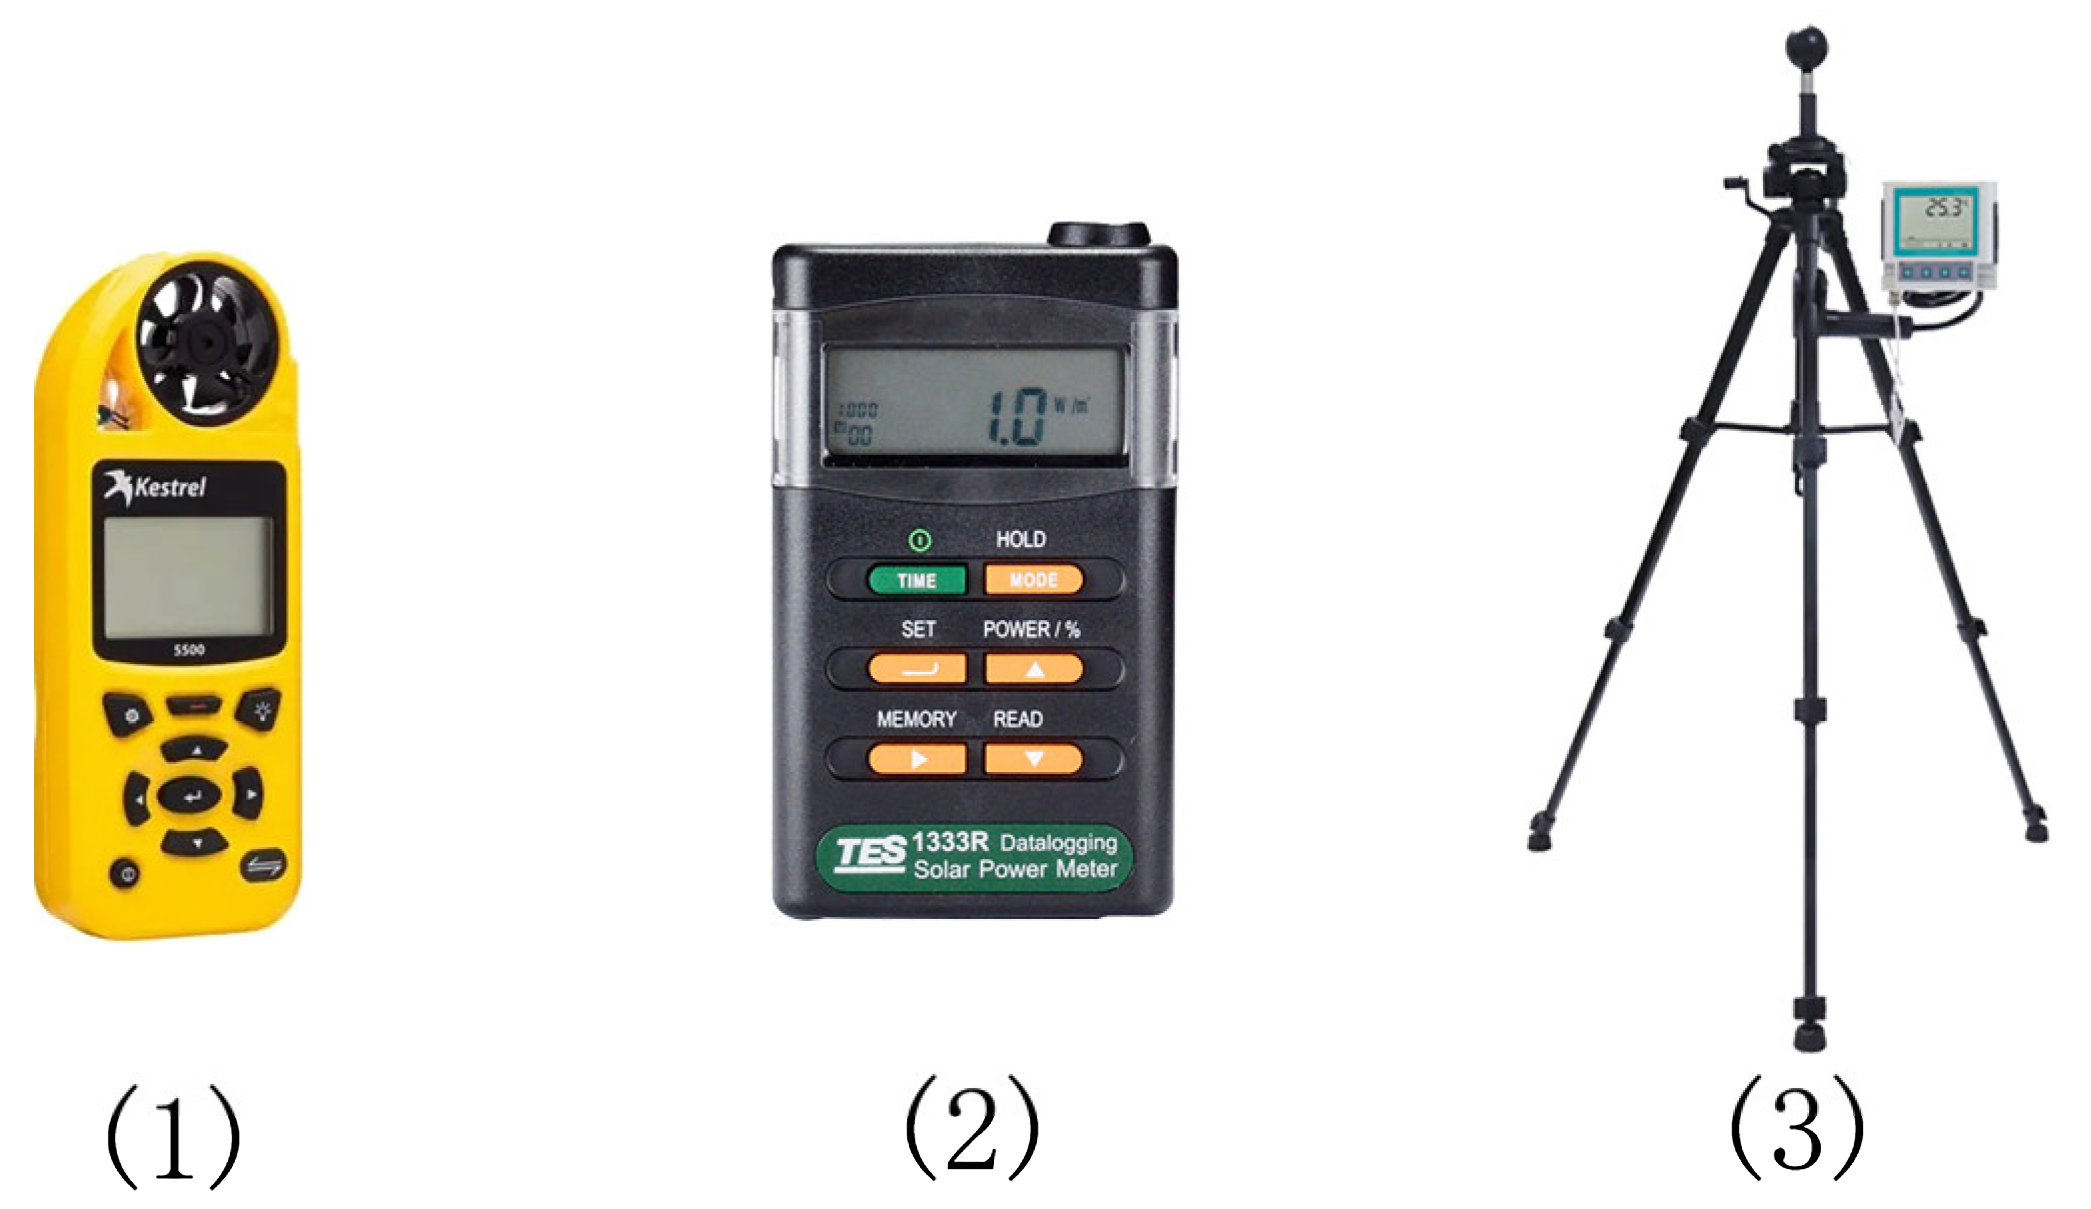
Table 2 shows the basic information about the measuring instrument, such as its accuracy and scope. Air temperature (Ta), relative humidity (RH), and wind speed (V) were recorded using the Kestrel 5500 handheld weather instrument (Nielsen-Kellerman Co., Boothwyn, PA, USA). Global Radiation (G) was recorded through the TES-1333 Solar Radiometer (TES Electric Co., Taiwan, China). Black global temperature (Tg) was recorded using the RS-HQ black global temperature recorder (Renke Control Technology Co., Shandong, China). All were installed at a distance of 1 m from the ground and set to record data every 2 min automatically. All measuring instruments (Figure 3) were compliant with ISO 7762 standard [23].

2.3. Questionnaire Survey

The height, weight, age, and gender of child respondents can influence human subjective thermal sensation. Therefore, when selecting the subjective questionnaire respondents, we should avoid differences in a single factor so as not to influence the experiment results [24]. To ensure an even distribution of physical characteristics among child respondents, the age of respondents should be in the 5–12 years range. At the time of the questionnaire survey, we guaranteed that each participating child stayed around the monitoring site for more than 20 min to ensure that the subjective thermal sensation of the respondents could be representative [8]. A total of 304 questionnaires were distributed, and 296 valid questionnaires were collected. Based on the field meteorological measurements and subjective questionnaires, the data collected were analyzed and organized, and the results related to children’s outdoor thermal comfort were obtained. The questionnaire was presented in Chinese (Appendix A).
The first part is the background information of the questionnaire interview, including the date, time, and place of the research and the status of the respondent, which the researcher fills in. The time and place of the research corresponded to the time and place of the meteorological parameter measurement. The respondent status was used to verify whether it corresponded to the thermal sensation in the third part to prove the validity of the questionnaire.
The second part was to collect basic information about the child respondents. We collected gender, age, height, weight, clothing, residence history, and primary activity level in the last 20 min. Children were not accurately expressing their weight and height, and the guardians and child respondents did this part. Children’s physical information, dress, and outdoor activity level were used to calculate the UTCI. Residence history was used to exclude respondents who lived temporarily in Chongqing from participating in the questionnaire interview to ensure that all respondents in this study had lived in Chongqing for more than two years.
The third part was to investigate children’s transient thermal perception (e.g., thermal sensation, thermal comfort, and acceptability) and thermal adaptive behavior, with the addition of brightly colored cartoon pictures in this section to facilitate an easier understanding of the questionnaire content [25]. Thermal sensation vote (TSV) was expressed by the ASHRAE 7-point scale (Cold (−3), Cool (−2), Slightly cool (−1), Neutral (0), Slightly warm (+1), Warm(+2), Hot (+3)) [7,26]. Since children’s concepts of thermal comfort are ambiguous, the thermal comfort vote (TCV) was recorded on a 3-point scale (comfortable (+1), neutral (0), uncomfortable (−1)). Thermal acceptability vote (TAV) was recorded on a 2-point scale (acceptable (+1), unacceptable (−1)). In the survey of thermal environment parameter preferences, because children are less able to perceive humidity, all meteorological parameter preference choices in the questionnaire were expressed on a 3-point scale (lower (−1), unchanged (0), higher (+1)). Finally, we provided five options for the choice of thermal adaptation behavior.

2.4. Clothing Insulation and Metabolic Rate

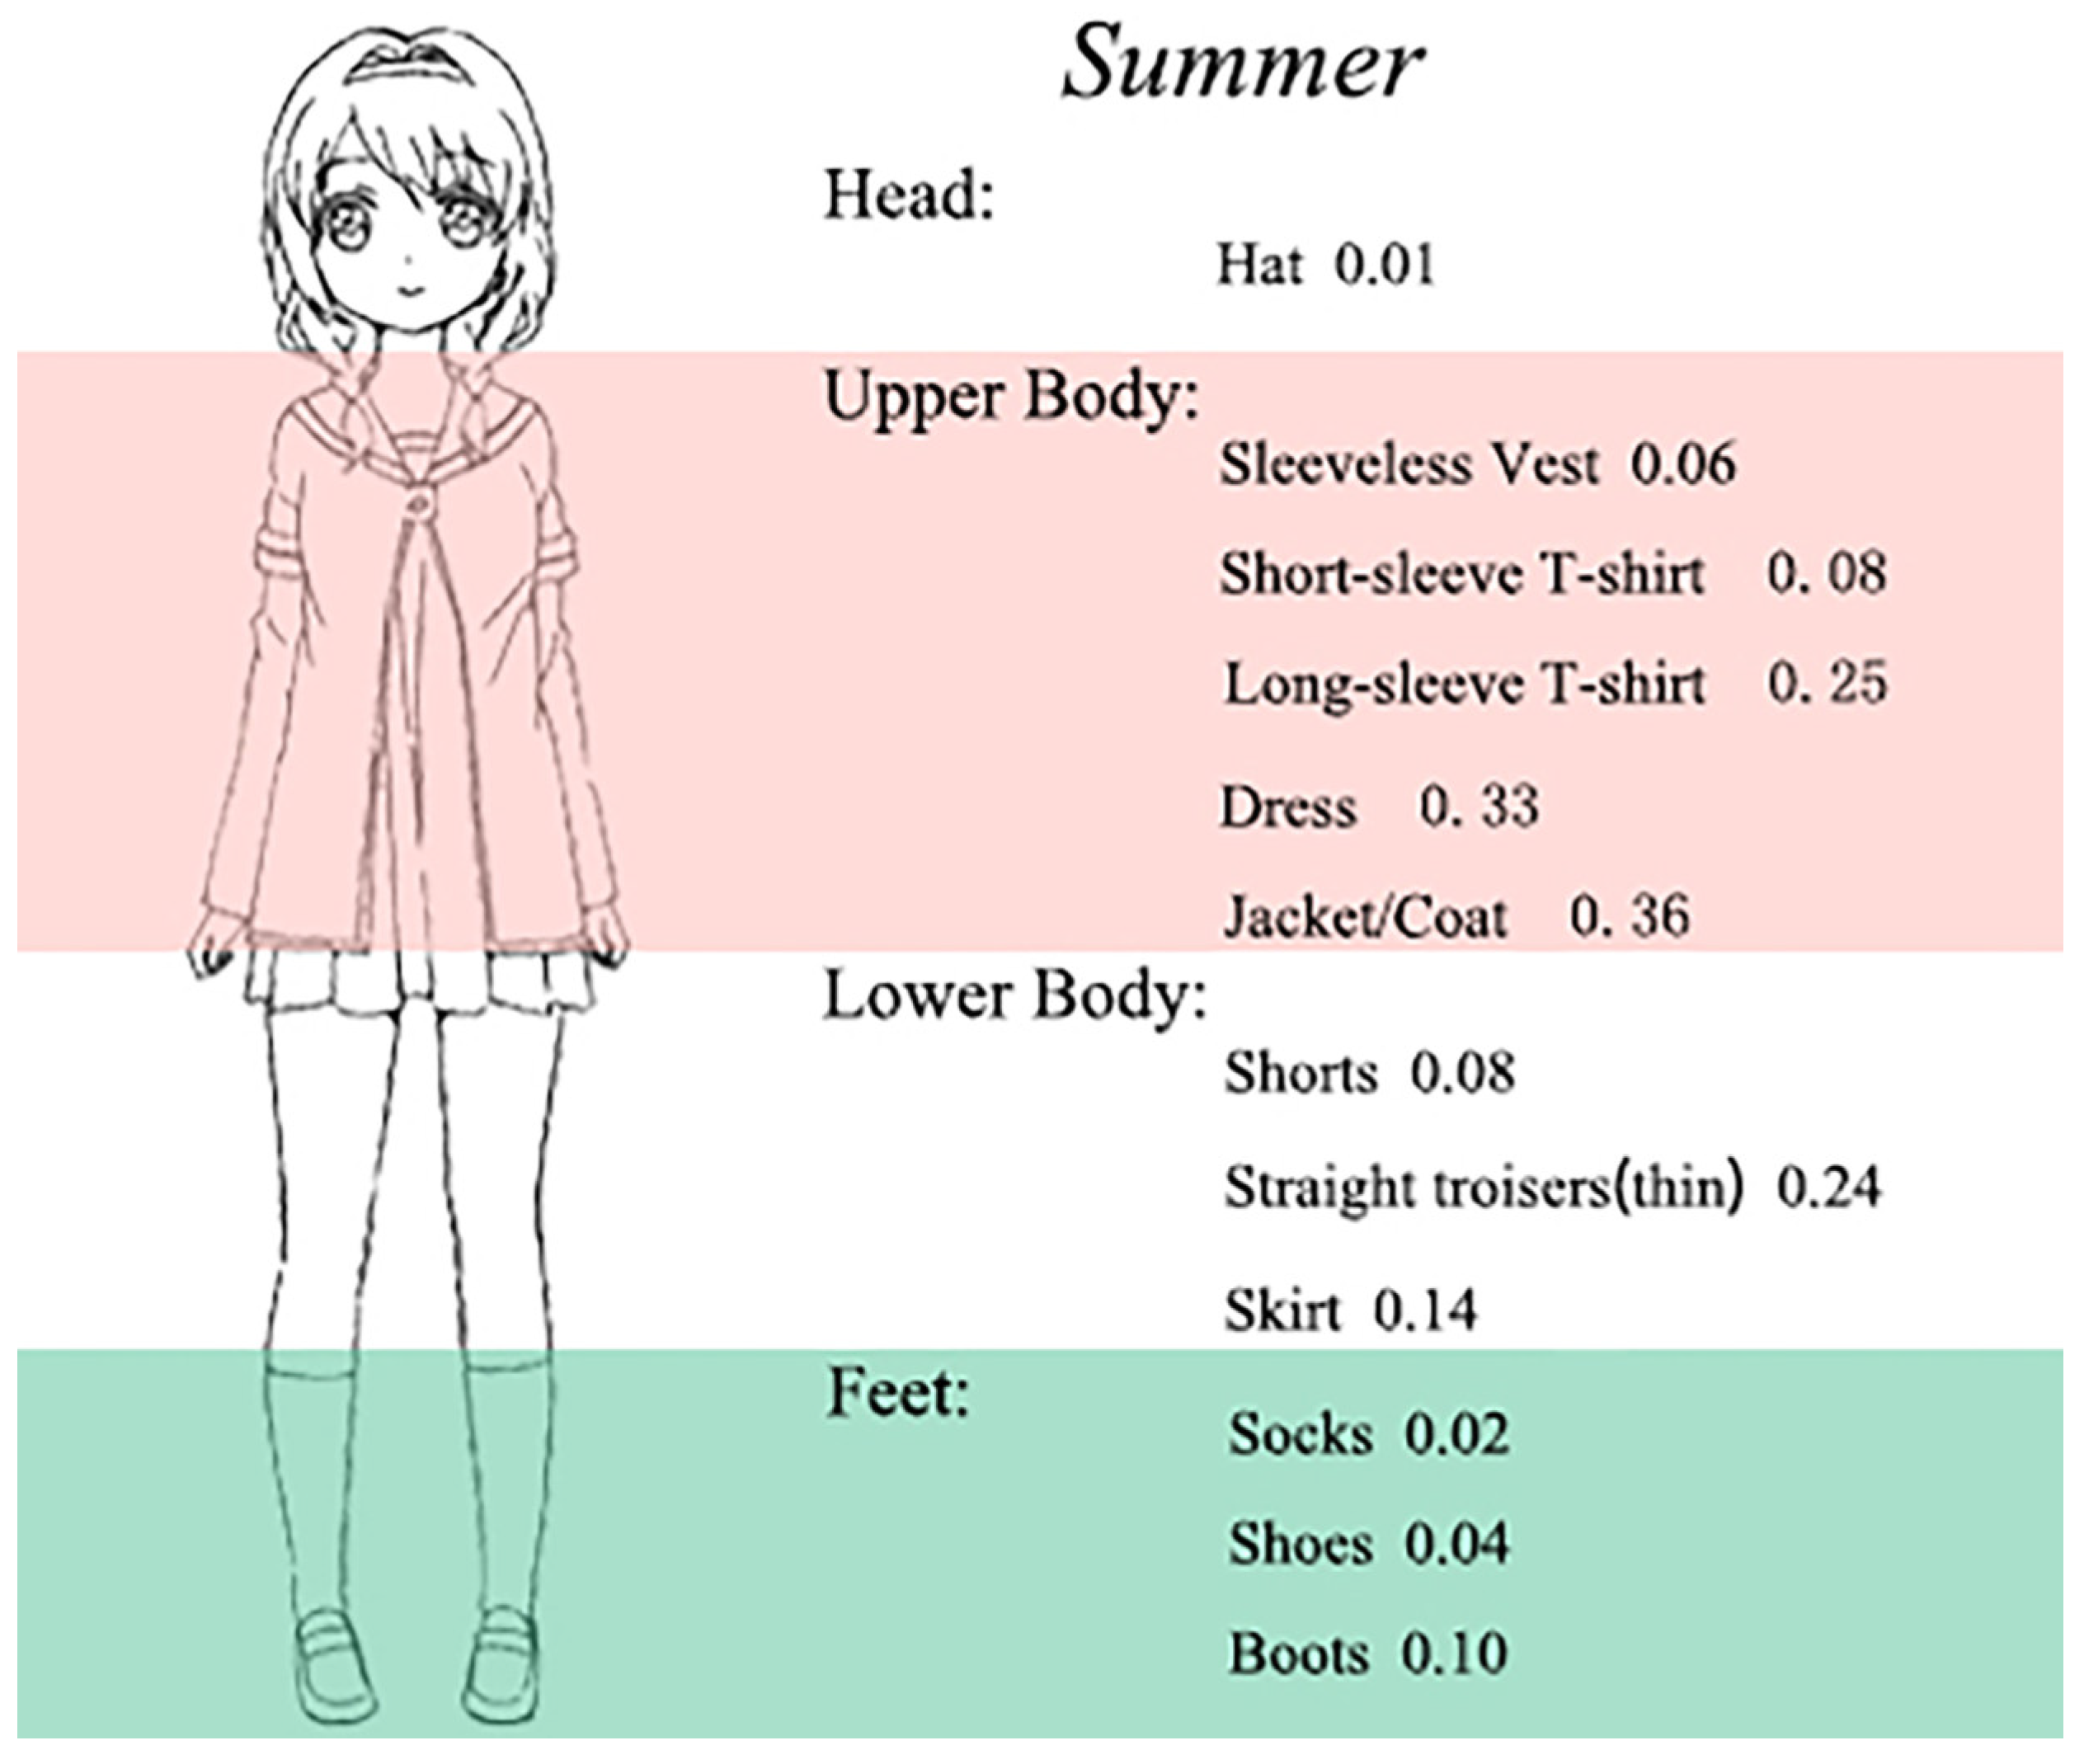
Some studies have found that children’s clothing differs little from adults in the same season [27]. We calculated the thermal resistance of children’s clothing based on the standard thermal resistance of adults’ clothing (Figure 4) [26,28]. For the calculation of resting metabolic rate (RMR), the difference between the resting metabolic rate of children and adults is significant, and the international standard is based on the measurement of adults [26]. It cannot be directly applied to children. In this study, we used a corrected mean RMR of 48.8 W/m2 for children (7–11 years), consistent with the Xi’an and Texas A&M University studies [8,14,26]. Then, based on the ISO 7730 standard [26] and the modified RMR, a quick table of metabolic rates for children at different activity intensities was calculated (Table 3).

2.5. Thermal Comfort Indices

In human thermal comfort research, more than 165 thermal indices have been developed [29]. Currently, Outdoor Standard Effective Temperature (OUT-SET), Physiological Equivalent Temperature (PET), Universal Thermal Climate Index (UTCI), and Predicted Mean Vote (PMV) are the most extensively used indices [30]. UTCI was widely used in outdoor thermal comfort studies and can be applied to different weather, seasonal and spatial scales [31]. UTCI is based on the “Fiala” multi-node human physiological model, which integrates the effects of thermoregulation and thermal resistance of clothing on outdoor activities [32]. In this study, UTCI was used as a thermal comfort evaluation index, and the RayMan model calculated the thermal stress of UTCI. Table 4 shows that the scale of thermal stress evaluation given by the physiological simulation of UTCI developers was 10 scale from extreme cold stress to extreme thermal stress [33]. The purpose of the RayMan model is to calculate the mean radiation temperature (Tmrt) and different thermal indices to quantify the thermal conditions (thermal comfort, thermal stress, and cold stress) [34]. By inputting meteorological parameters, such as air temperature (Ta), relative humidity (RH), wind speed (V), mean radiation temperature (Tmrt), and respondent attributes (height, weight, age, gender, etc.), the corresponding thermal indices (e.g., PET, UTCI, PMV, etc.) can be directly obtained to evaluate the thermal comfort of the environment.

3. Results

3.1. Experimental Results

Table 5 summarizes the characteristics of meteorological parameters of children’s activity spaces in three high-density urban residential areas in summer. The highest mean air temperature (Mean Ta) was 36.0 °C at the R2 site. The reason for this is that three artificial lakes surround the R2 site, and the water body has a high specific heat capacity, which stores heat and releases it slowly. Hence, the mean air temperature at the R2 site is the highest. The mean temperature (35.0 °C) and the maximum temperature (41.7 °C) at the R3 site are the lowest among the three sites. Moreover, the average daily solar radiation (130.0 W/m2) at the R3 site was the lowest among the three sites. The reason for this is that the R3 site has the lowest SVF (0.05), receives less direct solar radiation, and has a lower temperature. The minimum air temperature in the three sites differed very little, indicating that the minimum air temperature in the children’s activity space in high-density urban residential areas is less influenced by spatial landscape differences. Regarding relative humidity (RH), the mean RH at the R2 site (47.3%) and the R3 site (52.4%) were slightly higher than the mean RH at the R1 site (43.8%). The reason is that the R2 site is close to the artificial lake, which can increase the air humidity; the R3 site is covered with plants, the transpiration of plants is intense, and the air humidity is high. The mean wind speed of 0.4 m/s and the maximum wind speed of 2.6 m/s at the R1 site was the highest among the three sites. Because the SVF at the R1 site was the highest among the three sites, and the space was the most exposed for air circulation. However, all three sites are located in residential communities in the urban core, where the wind speed is low in summer. The change in black globe temperature (Tg) is affected by solar radiation. The stronger the solar radiation, the higher the black globe temperature. R1 site has the highest black globe temperature and solar radiation intensity (G); its maximum black globe temperature is 49.7 °C, and the mean black globe temperature (Mean Tg) is 39.3 °C. The reason for this is that site R1 lacks the coverage of tall trees and has solid solar radiation in summer.
In summary, influenced by landscape elements, the meteorological parameters of the three sites exhibited differences. Among them, the differences in air temperature (Ta), relative humidity (RH), and wind speed (V) are slight and the differences in solar radiation (G) are the largest. Because of the influence of the sky view factor (SVF), the smaller the sky view factor, the stronger the solar radiation received. Other meteorological parameters are mainly influenced by the spatial environment, such as space enclosure, plant arrangement, water landscape, etc. Therefore, in planning and designing children’s activity spaces in high-density residential areas, we should reasonably use plants and other materials to improve the spatial thermal environment.

3.2. Questionnaire Survey Results

The gender of child respondents in this study was evenly distributed, with 52.7% of males and 47.3% of females. The average height was 128.5 cm for males and 124.9 cm for females; the average weight was 30.6 kg for males and 27.4 kg for females. The basic information of the child respondents is shown in Table 6. All child respondents’ average clothing thermal resistance in summer was 0.26 ± 0.1 clo. Meanwhile, the RMR corresponding to the main activity types of children in the past 20 min was calculated according to Table 3, and the average RMR of all children was 114.46 ± 30.97 W/m2. All questionnaire respondents were satisfied that they had lived in the central city of Chongqing for more than 2 years and could adapt to the local climate [35,36].
Table 7 summarizes the data from the respondents on the thermal comfort questionnaire; the highest number of children voted for “warm” (63.2%), followed by “slightly warm” (28.0%). The number of votes for “neutral” was the lowest (2.0%). In the air temperature (Ta) preference vote, the vast majority (93.9%) of children wanted the air temperature to decrease, while 6.1% wanted it to stay the same. The children incorrectly understood the concept of relative humidity (RH) and were not counted in the questionnaire. In the wind speed (V) preference vote, 89.1% of the children wanted the wind speed to increase. In the global solar radiation (G) preference vote, more than half (60.1%) of the children wanted solar radiation to become weaker. On the contrary, 39.5% of the children wanted that solar radiation should be increased. In the thermal comfort vote (TCV), 66.5% of children considered thermal comfort to be “neutral,” while only 7.7% considered thermal comfort to be “comfortable.” In addition, 85.4% of the children reported that their current thermal environment was acceptable. The results show that children generally feel hot and want the thermal environment of the their activity spaces to be improved when conducting activities in high-density urban residential areas.

3.3. Thermal Sensation Vote (TSV)

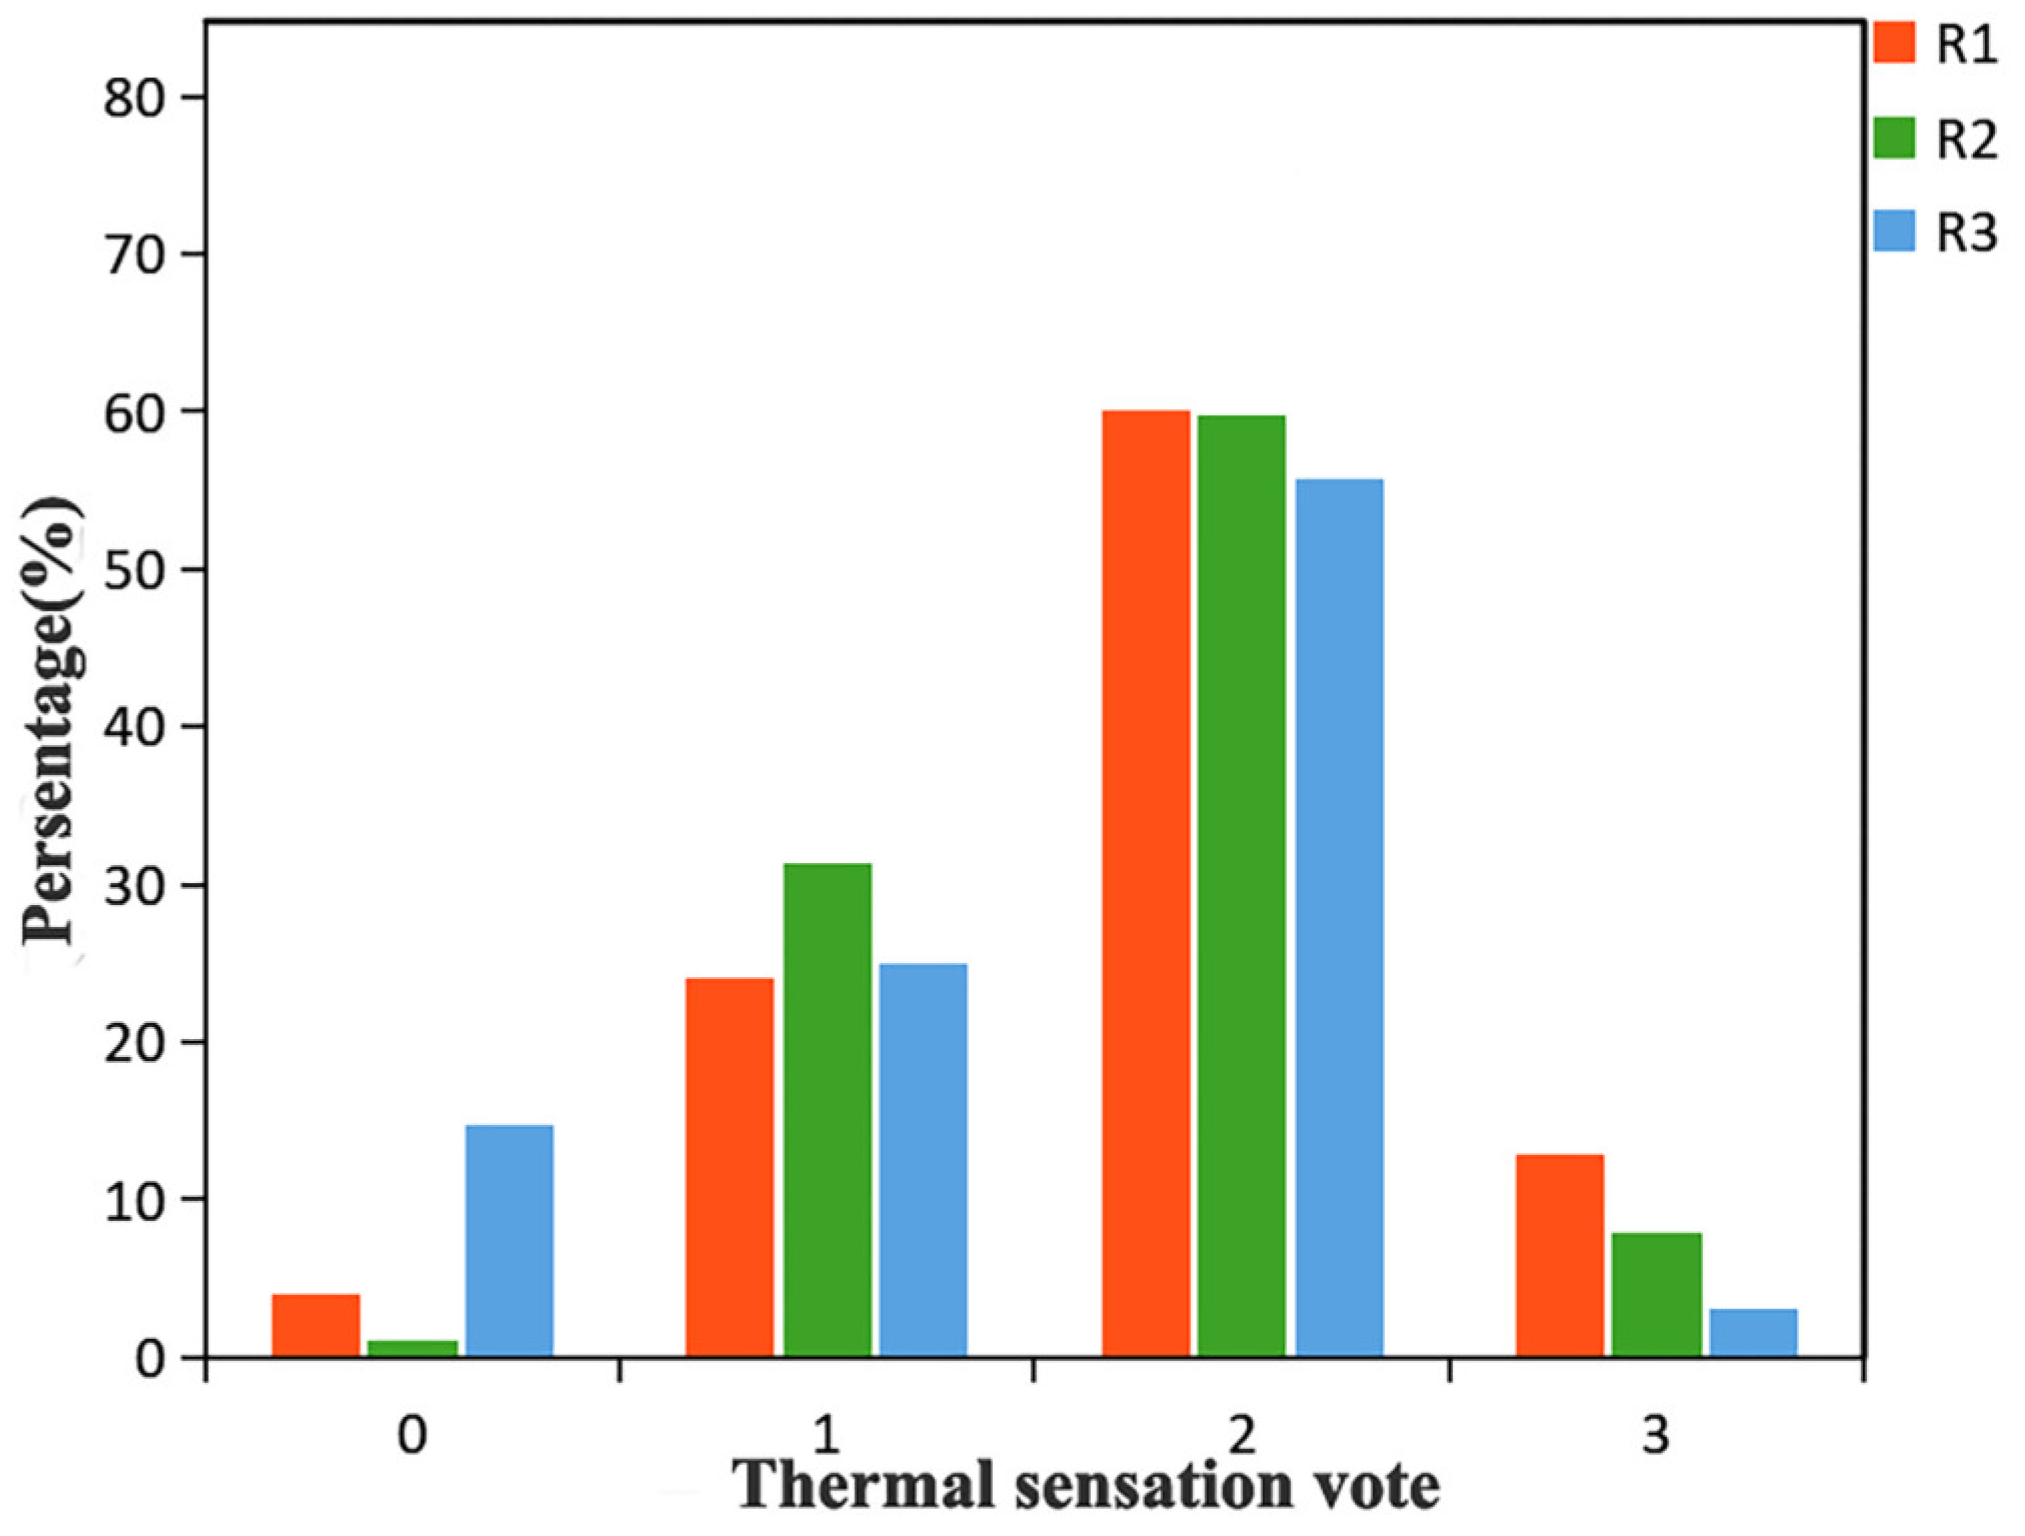
In order to explore the influence of different landscape elements on children’s thermal comfort in children’s activity spaces in high-density residential areas, we analyzed the thermal sensation vote data of child respondents. Figure 5 shows thermal sensation voting of children’s activity spaces in three high-density urban residential areas, with the TSV mainly distributed between “slightly warm (TSV = 1) “and “warm (TSV = 2)”. This indicates that children are dissatisfied with the thermal environment of all three children’s activity spaces. The highest percentage of children (14.8%) had a TSV of “neutral (TSV = 0)” at site R3, so outdoor thermal comfort level at site R3 was the highest. 58.7% of children had a TSV of “warm (TSV = 2)” at site R2. “, and another 30.3% of children thought the TSV at this site was “slightly warm (TSV = 1)”. In site R1, 60.0% of children had a TSV of “warm (TSV = 2)” and 13.0% had a TSV of “hot (TSV = 3)”, indicating that site R1 had the lowest level of thermal comfort for children’s activity space. This is because the children’s activity space at site R1 lacks shade from plants and is exposed to direct sunlight for a long time. Finally, the three children’s activity spaces are ranked R3 > R2 > R1 for summer thermal comfort. The results show that there are also differences in the effects of children’s activity spaces on human thermal comfort in different high-density residential areas.

3.4. Meteorological Factors Preference Vote

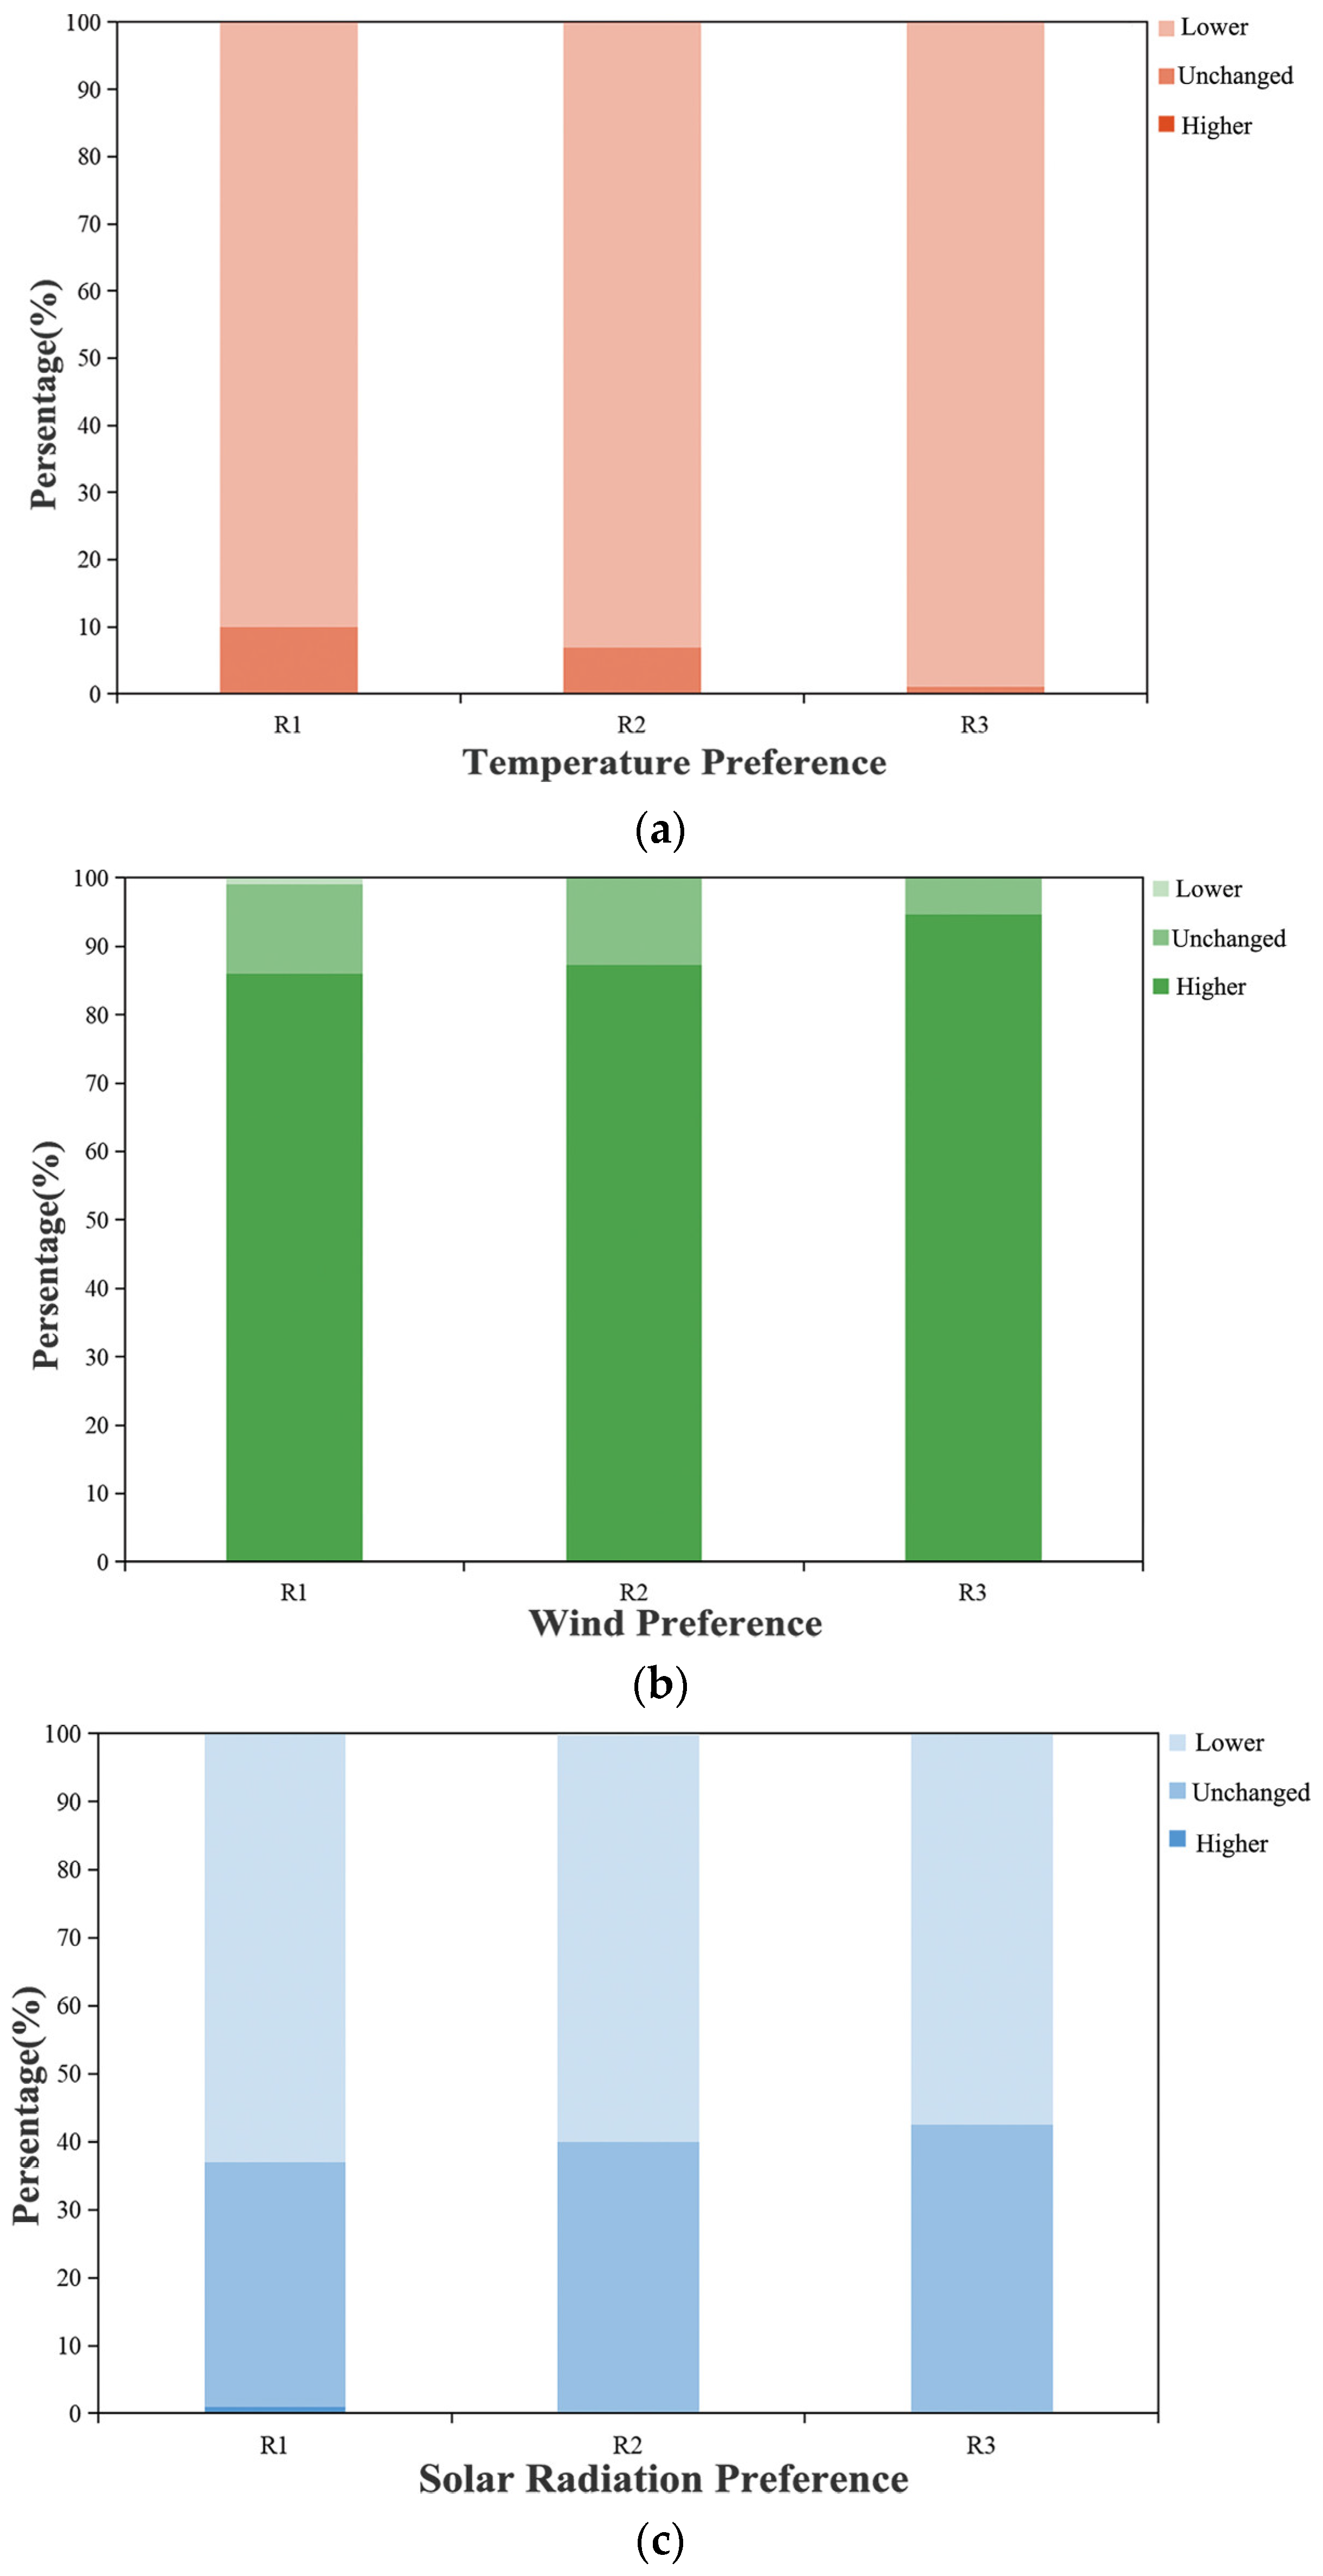
In the air temperature preference poll (Figure 6a), 98.9% of children at site R3 wanted the air temperature to be “lower,” the highest percentage of all sites. The ranking of sites with “lower” air temperature expectations was R3 (98.9%) > R2 (93.1%) > R1 (90.0%). The ranking results are the opposite of overall thermal comfort voting (OTCV) results, demonstrating a strong association between air temperature and thermal comfort. In the analysis of wind speed preference voting (Figure 6b), children in all three sites wanted the wind speed to be “higher,” and the highest percentage of wind speed preference voting was 94.3% in site R3. This is because in the high temperature and high humidity climate of Chongqing, human skin sweat evaporates slowly, and heat exchange with the environment is also slow, so human thermal comfort is poor. Increasing the wind speed can effectively increase the evaporation rate of skin sweat, speed up the heat exchange with the environment, and improve human thermal comfort. The global solar radiation preference vote (Figure 6c) shows that all three sites voted for “lower” solar radiation. In particular, the percentage of support for “lower” at site R1 is 63.0%, strongly related to the most exposed space and lack of plant shade at site R1. The vote results on children’s meteorological parameter preferences indicate that temperature and wind speed are key factors influencing the thermal comfort of children’s activity spaces in high-density residential areas in summer. Most children prefer higher wind speed and lower solar radiation intensity to improve outdoor thermal comfort.

3.5. Overall Thermal Comfort Vote (OTCV)

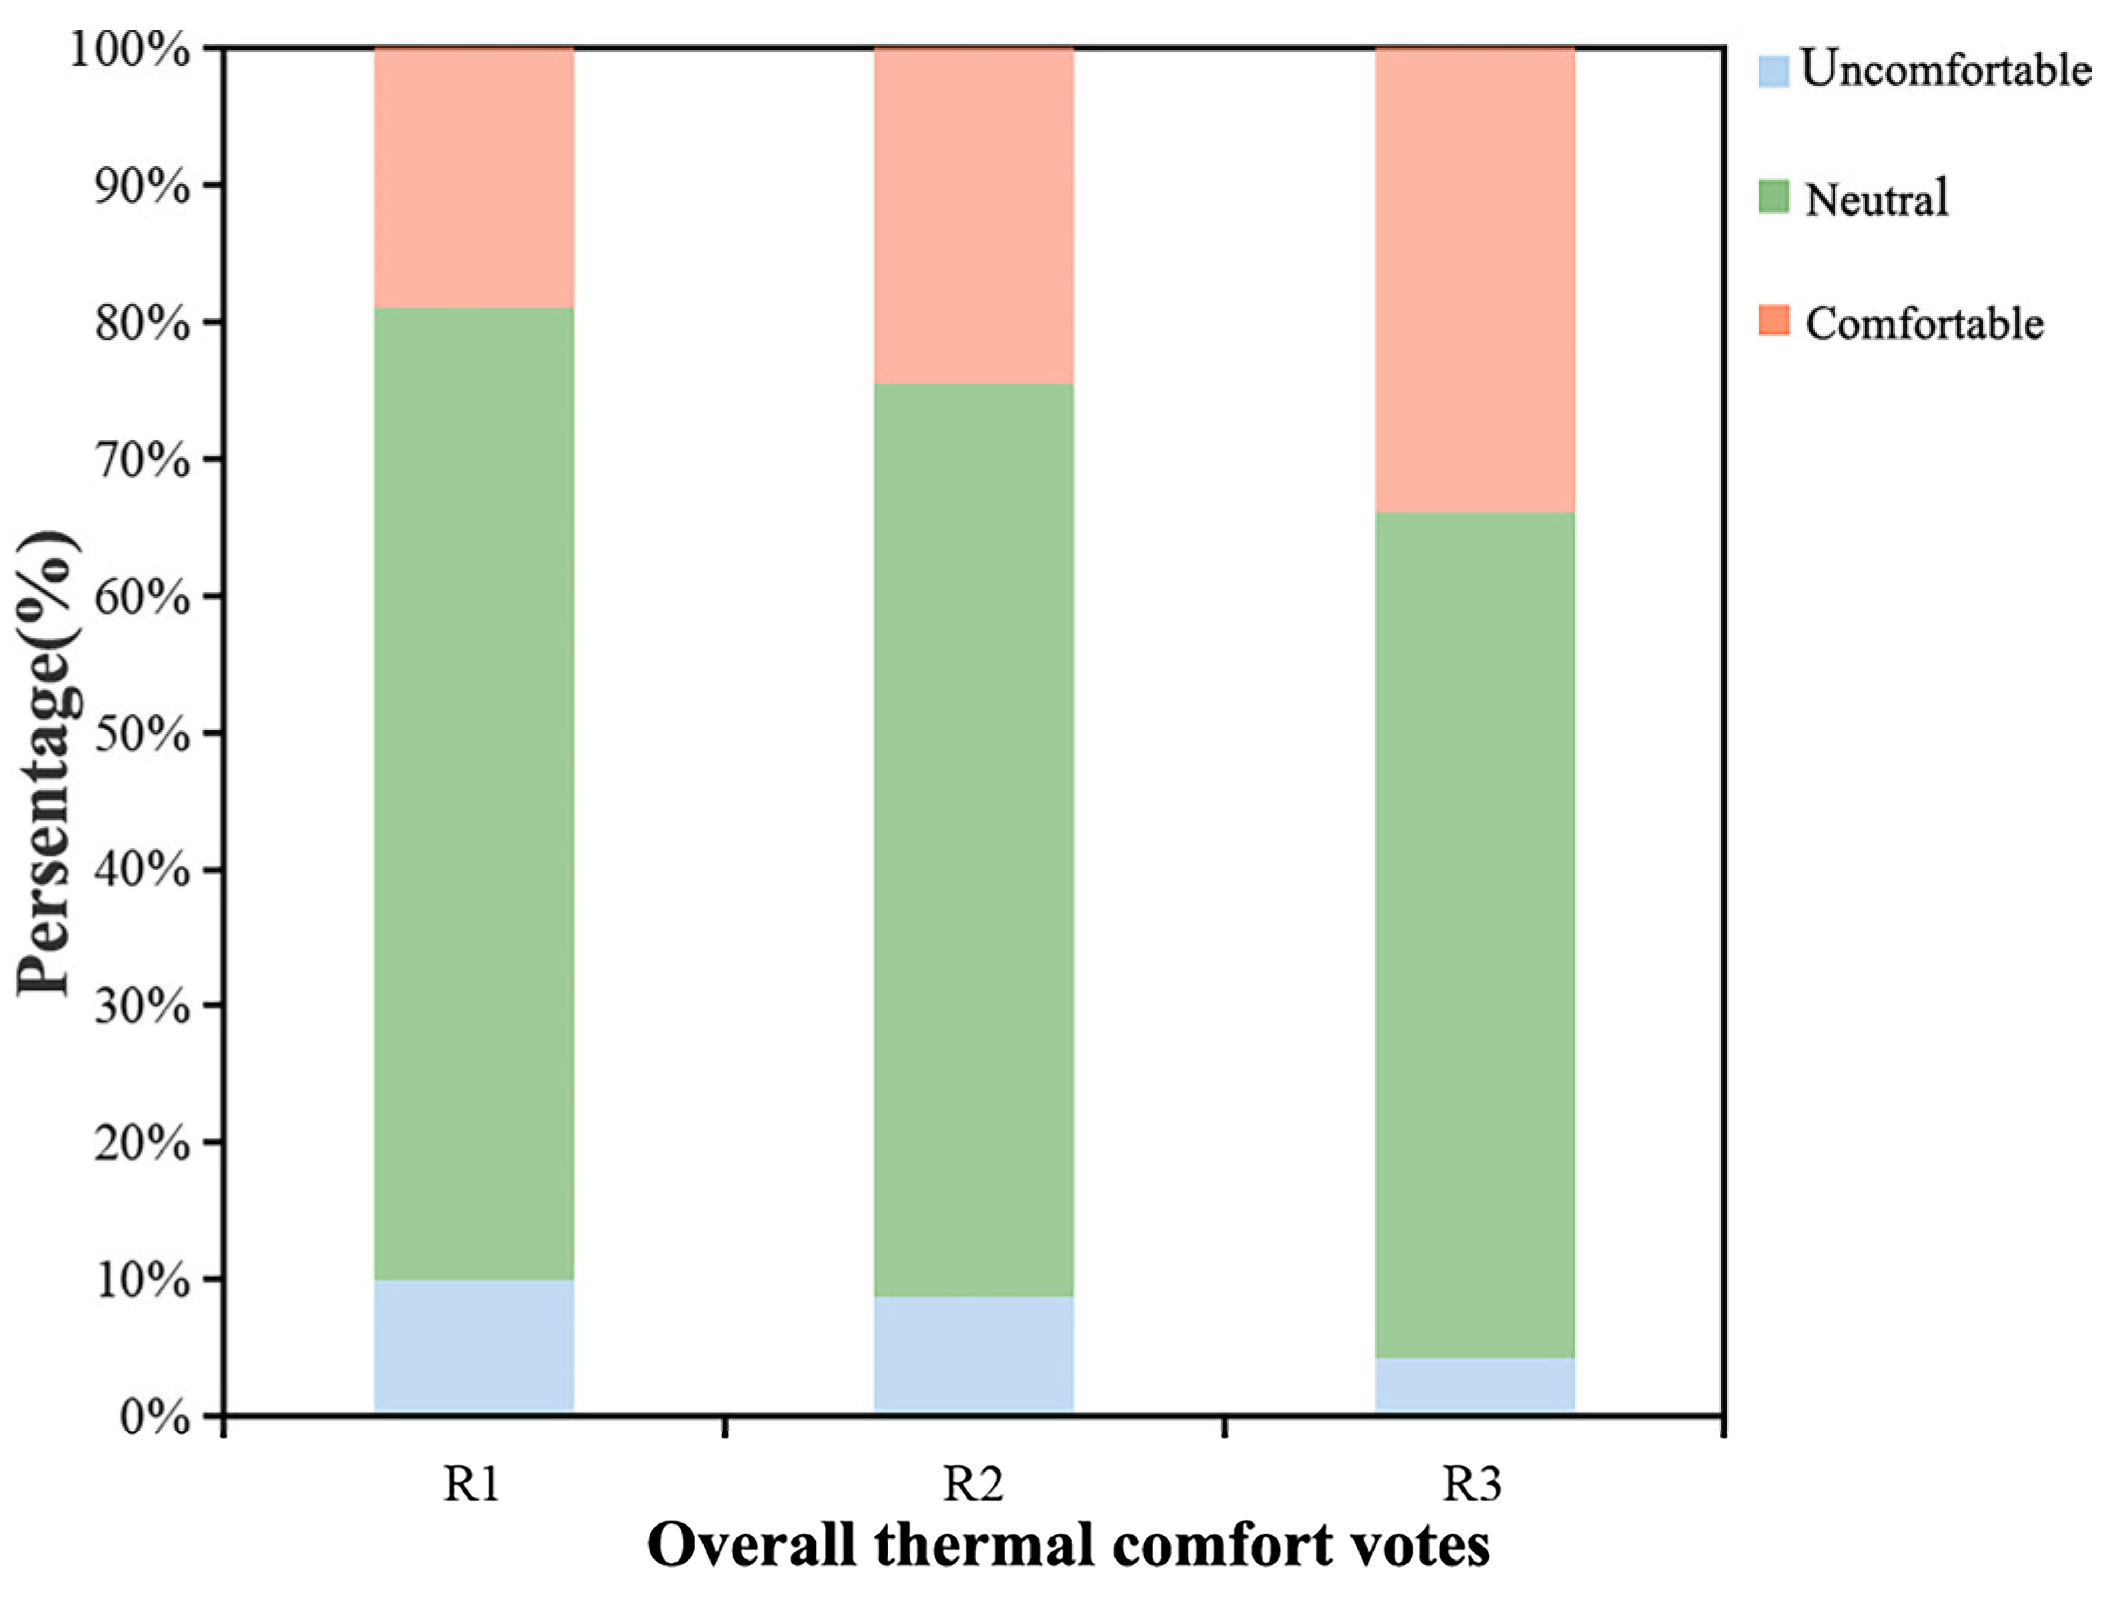
The purpose of overall thermal comfort voting (OTCV) is to validate the reasonableness of thermal sensation voting. Figure 7 shows the percentage of children’s overall thermal comfort voting in the summer in the children’s activity spaces in high-density residential areas. It can be seen that 71.0% of children in site R1 considered the current thermal environment “neutral”, and only 10.0% considered the thermal environment in this space to be “comfortable”. For the “comfortable” vote, 34.0% for site R3 and 24.5% for site R2. The results of thermal comfort voting are consistent with the results of thermal sensation voting, indicating a strong positive relationship between overall thermal comfort and thermal sensation.

3.6. Thermal Acceptability Vote (TAV)

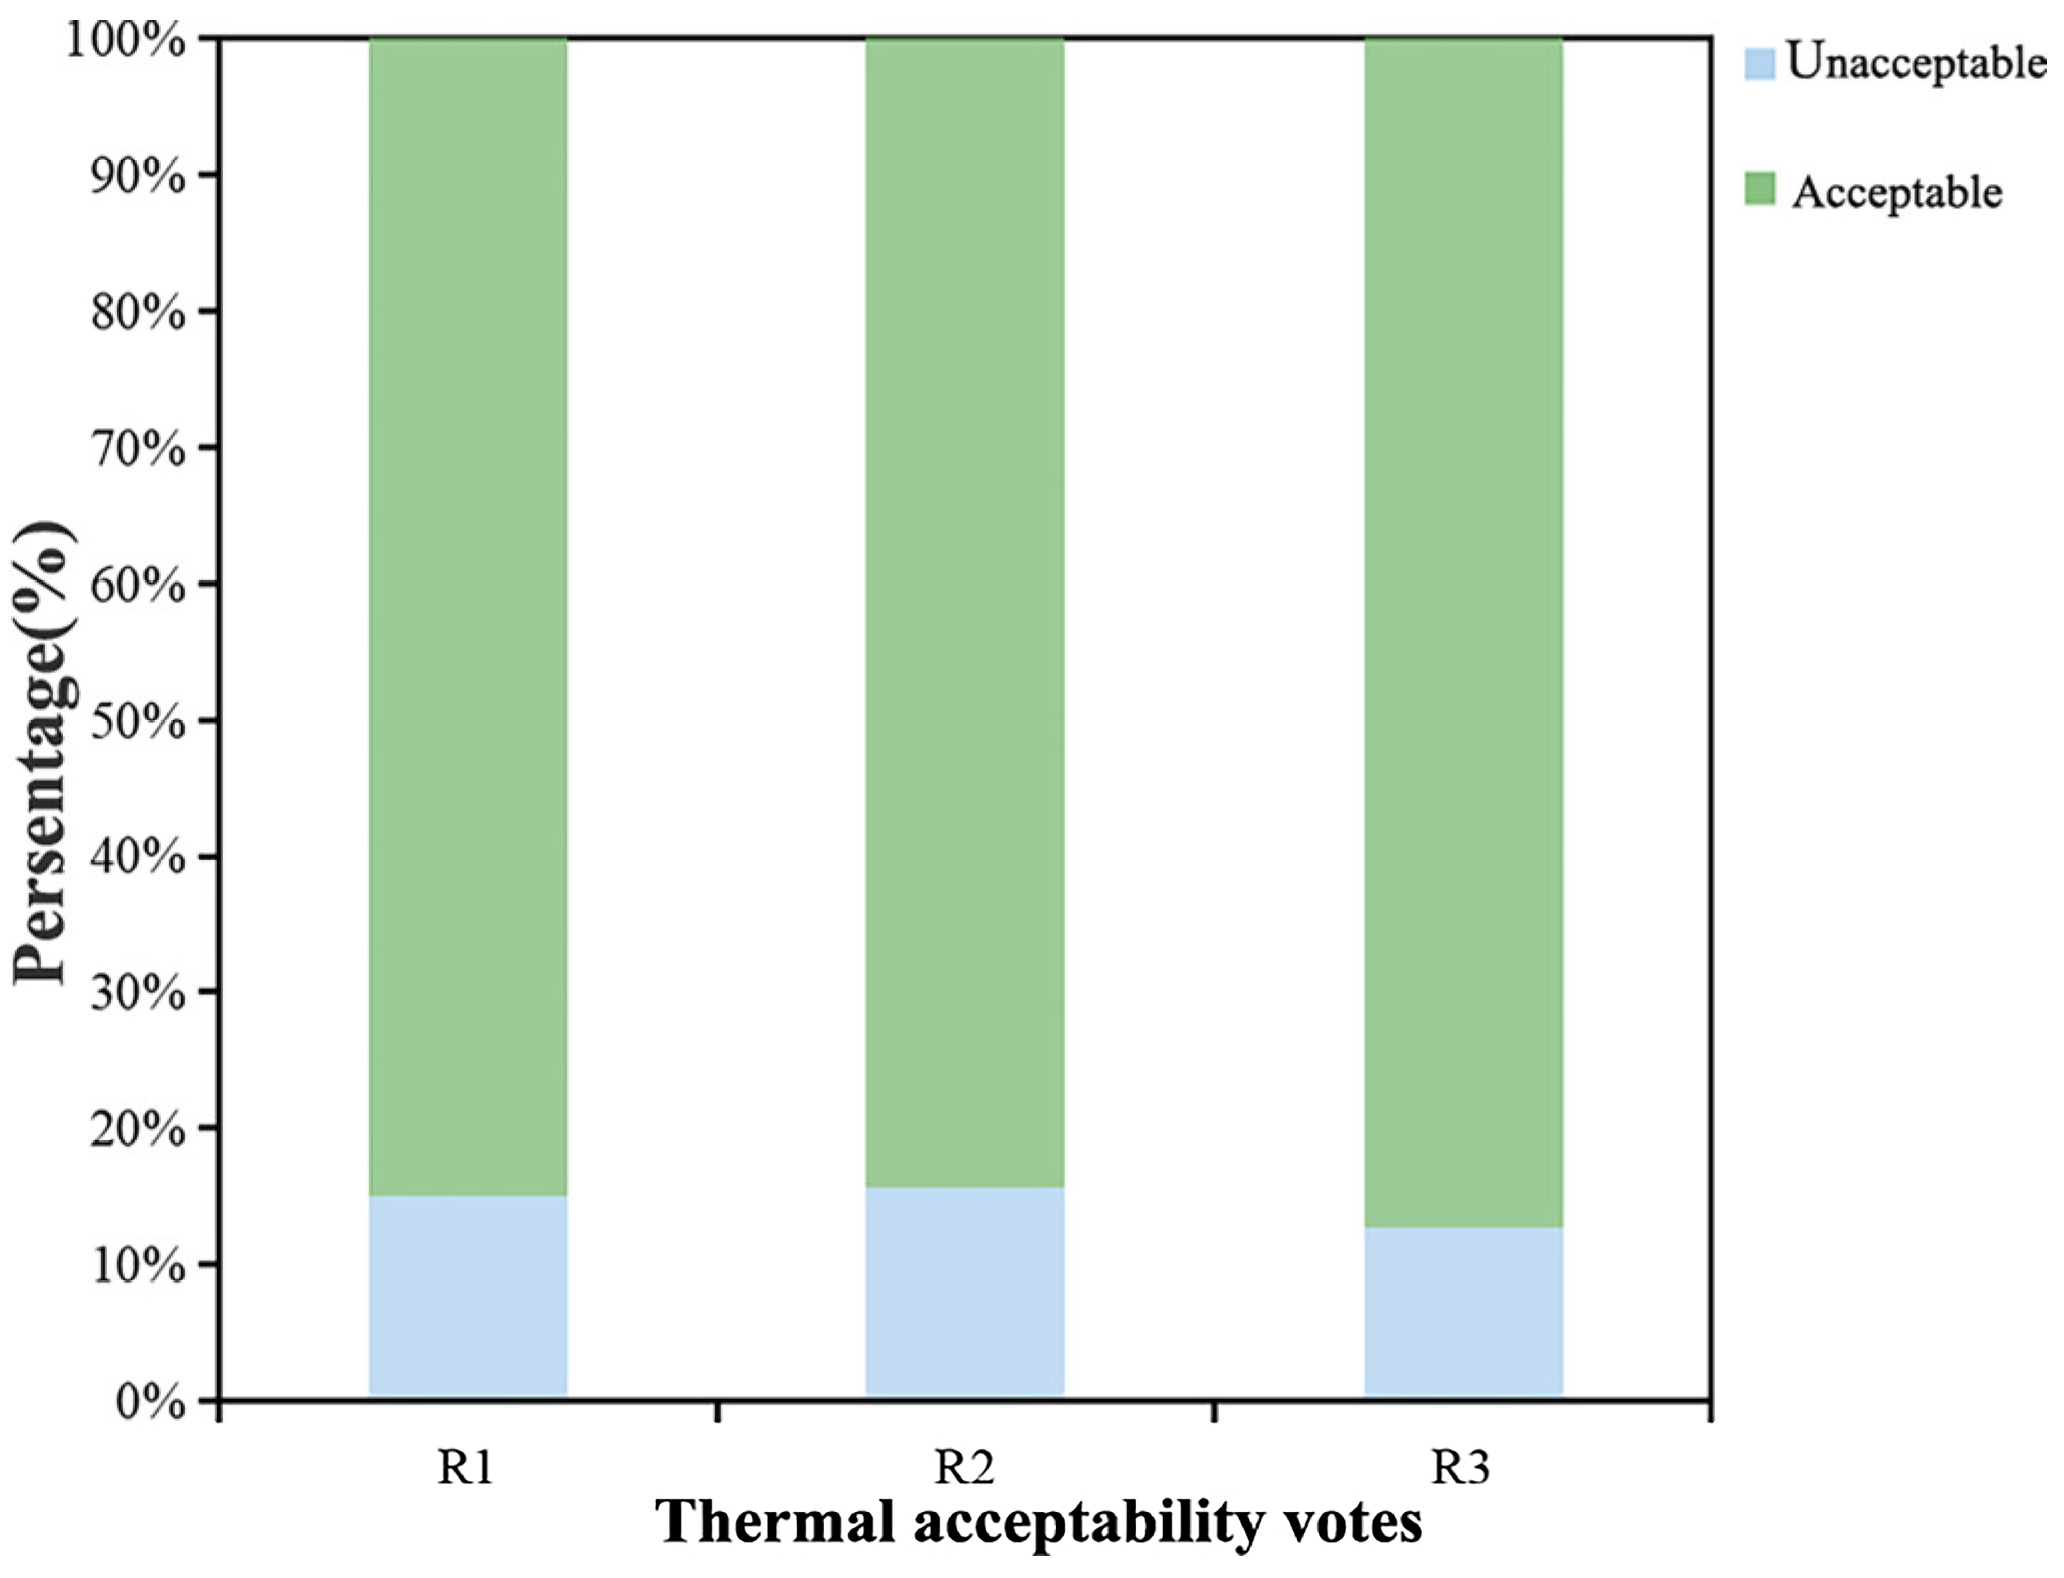
According to ASHRAE Standard 55, developed by the American Society of Heating, Refrigerating and Air-Conditioning Engineers (ASHRAE), a thermal environment is acceptable under the conditions indicated by at least 80% of respondents who indicated that the current thermal environment was acceptable [7]. In the questionnaire, child respondents were asked to vote on the thermal acceptability of the current thermal environment. Figure 8 shows the percentage of “acceptable” votes for the three sites, 84% for site R1, 85.3% for site R2, and 87.2% for site R3, with the thermal acceptability votes ranked R3 > R2 > R1. The voting results indicate that the thermal environment is acceptable under these conditions. This ranking result is consistent with overall thermal comfort voting and thermal sensation voting, which justifies the thermal sensation voting results of the study.

3.7. Universal Thermal Climate Index (UTCI)

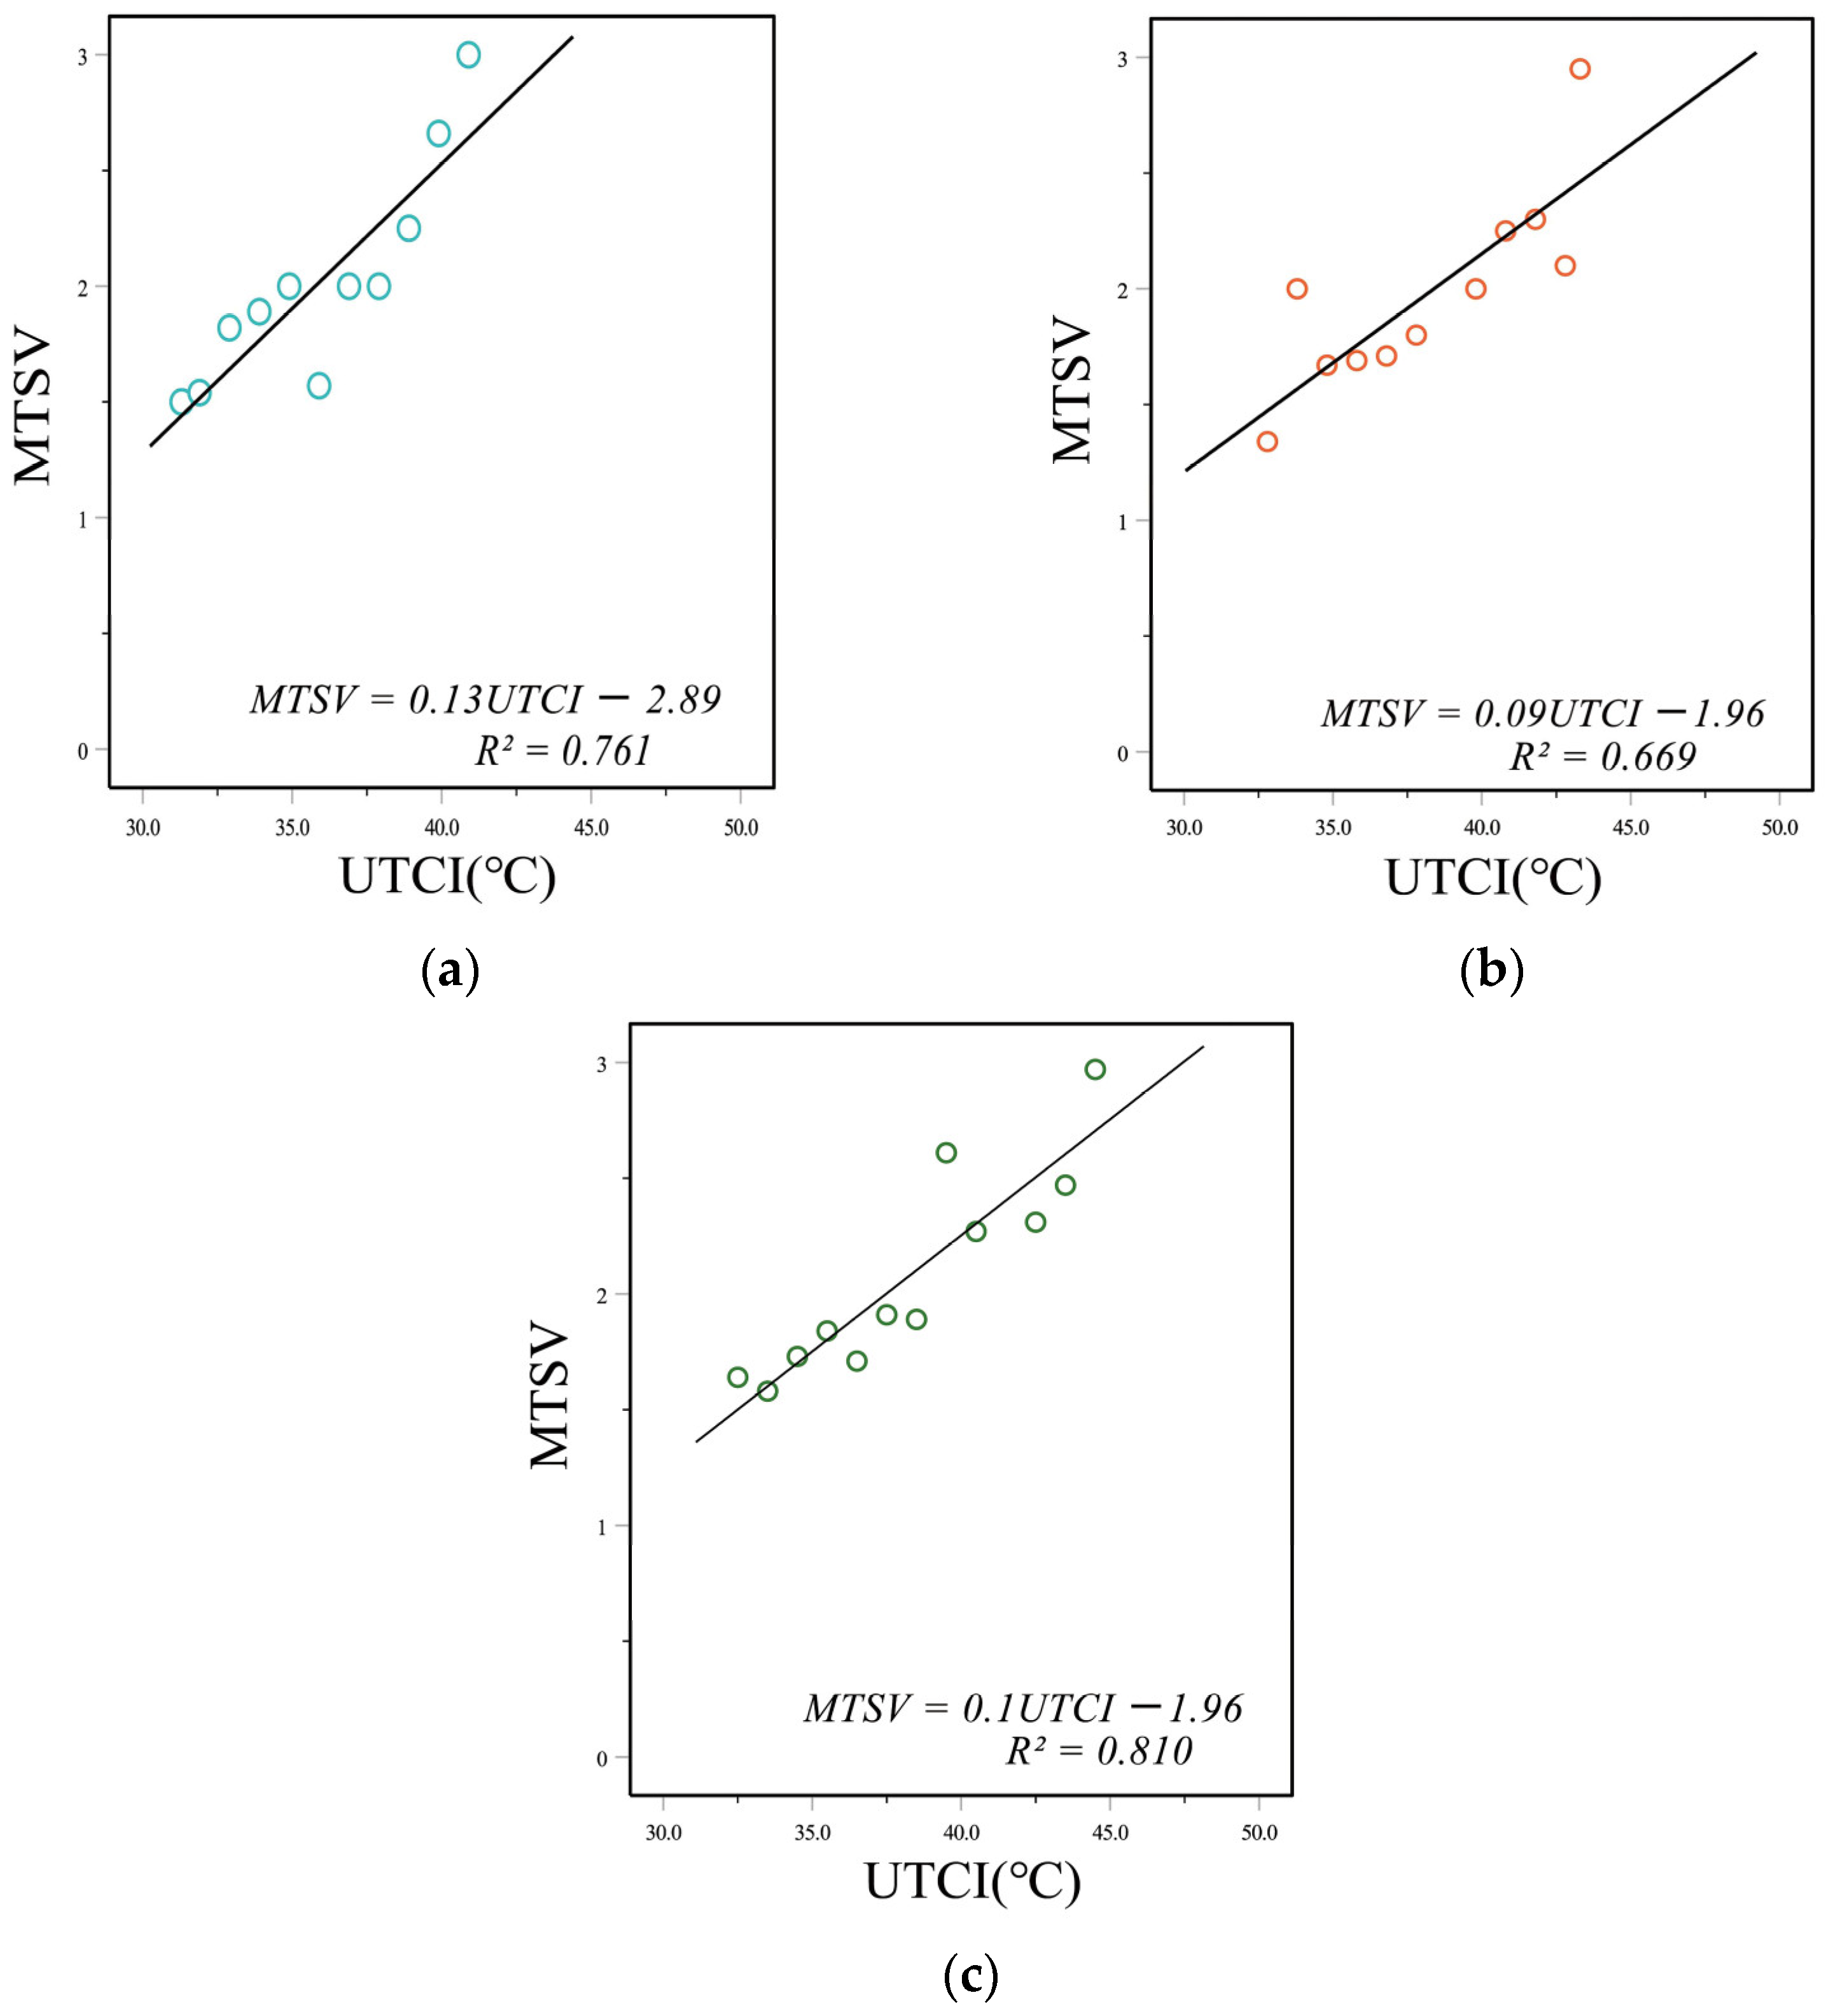
Thermal comfort is expressed as a person’s subjective feeling, which is influenced by a combination of environmental and personal factors [35]. To accurately assess children’s thermal sensations, thermal comfort thresholds for children were determined. In this study, we did a weighted mean of the TSV for every 1 °C UTCI interval to calculate the MTSV (Mean TSV, MTSV) for every 1 °C UTCI interval and then performed a linear fit of the UTCI to the MTSV for males and females, respectively [37]. The slope of this regression line for males was 0.13, corresponding to 7.7 °C UTCI/MTSV (Figure 9a). The slope of the regression line for females was 0.09, corresponding to 11.1 °C UTCI/MTSV (Figure 9b). The slope of this regression line for all child respondents was 0.1, corresponding to 10.0 °C UTCI/MTSV (Figure 9c). The following linear equation was obtained (Equations (2)–(4)):
MTSV = 0.13UTCI − 2.89 (R2 = 0.761) (Male)
MTSV = 0.09UTCI − 1.96 (R2 = 0.669) (Female)
MTSV = 0.1UTCI − 1.96 (R2 = 0.810) (All Respondents)
Neutral temperature refers to the temperature at which people feel neither hot nor cold [38]. When MTVS = 0, the corresponding UTCI is the group’s neutral UTCI (NUTCI). Substituting MTSV = 0 into the equation separately, the NUTCI was calculated to be 22.2 °C for males, 21.8 °C for females, and 19.6 °C for all child respondents. The closing results showed a slight gender difference. The neutral temperature range (NUTCIR) refers to the range in which the neutral UTCI is determined when the MTSV is between −0.5 and 0.5 (both −0.5 and 0.5). Based on the linear regression equation, the NUTCIR can be calculated as 18.4–26.1 °C for males, 16.2–27.3 °C for females, and 14.6–24.6 °C for all child respondents in summer. Compared with male, the upper limit of NUTCIR for female was 0.7 °C higher, and the lower limit was 2.8 °C lower, indicating that female in high-density urban residential areas in summer had lower thermal sensitivity than male.

3.8. Thermal Accptable Range (TAR)

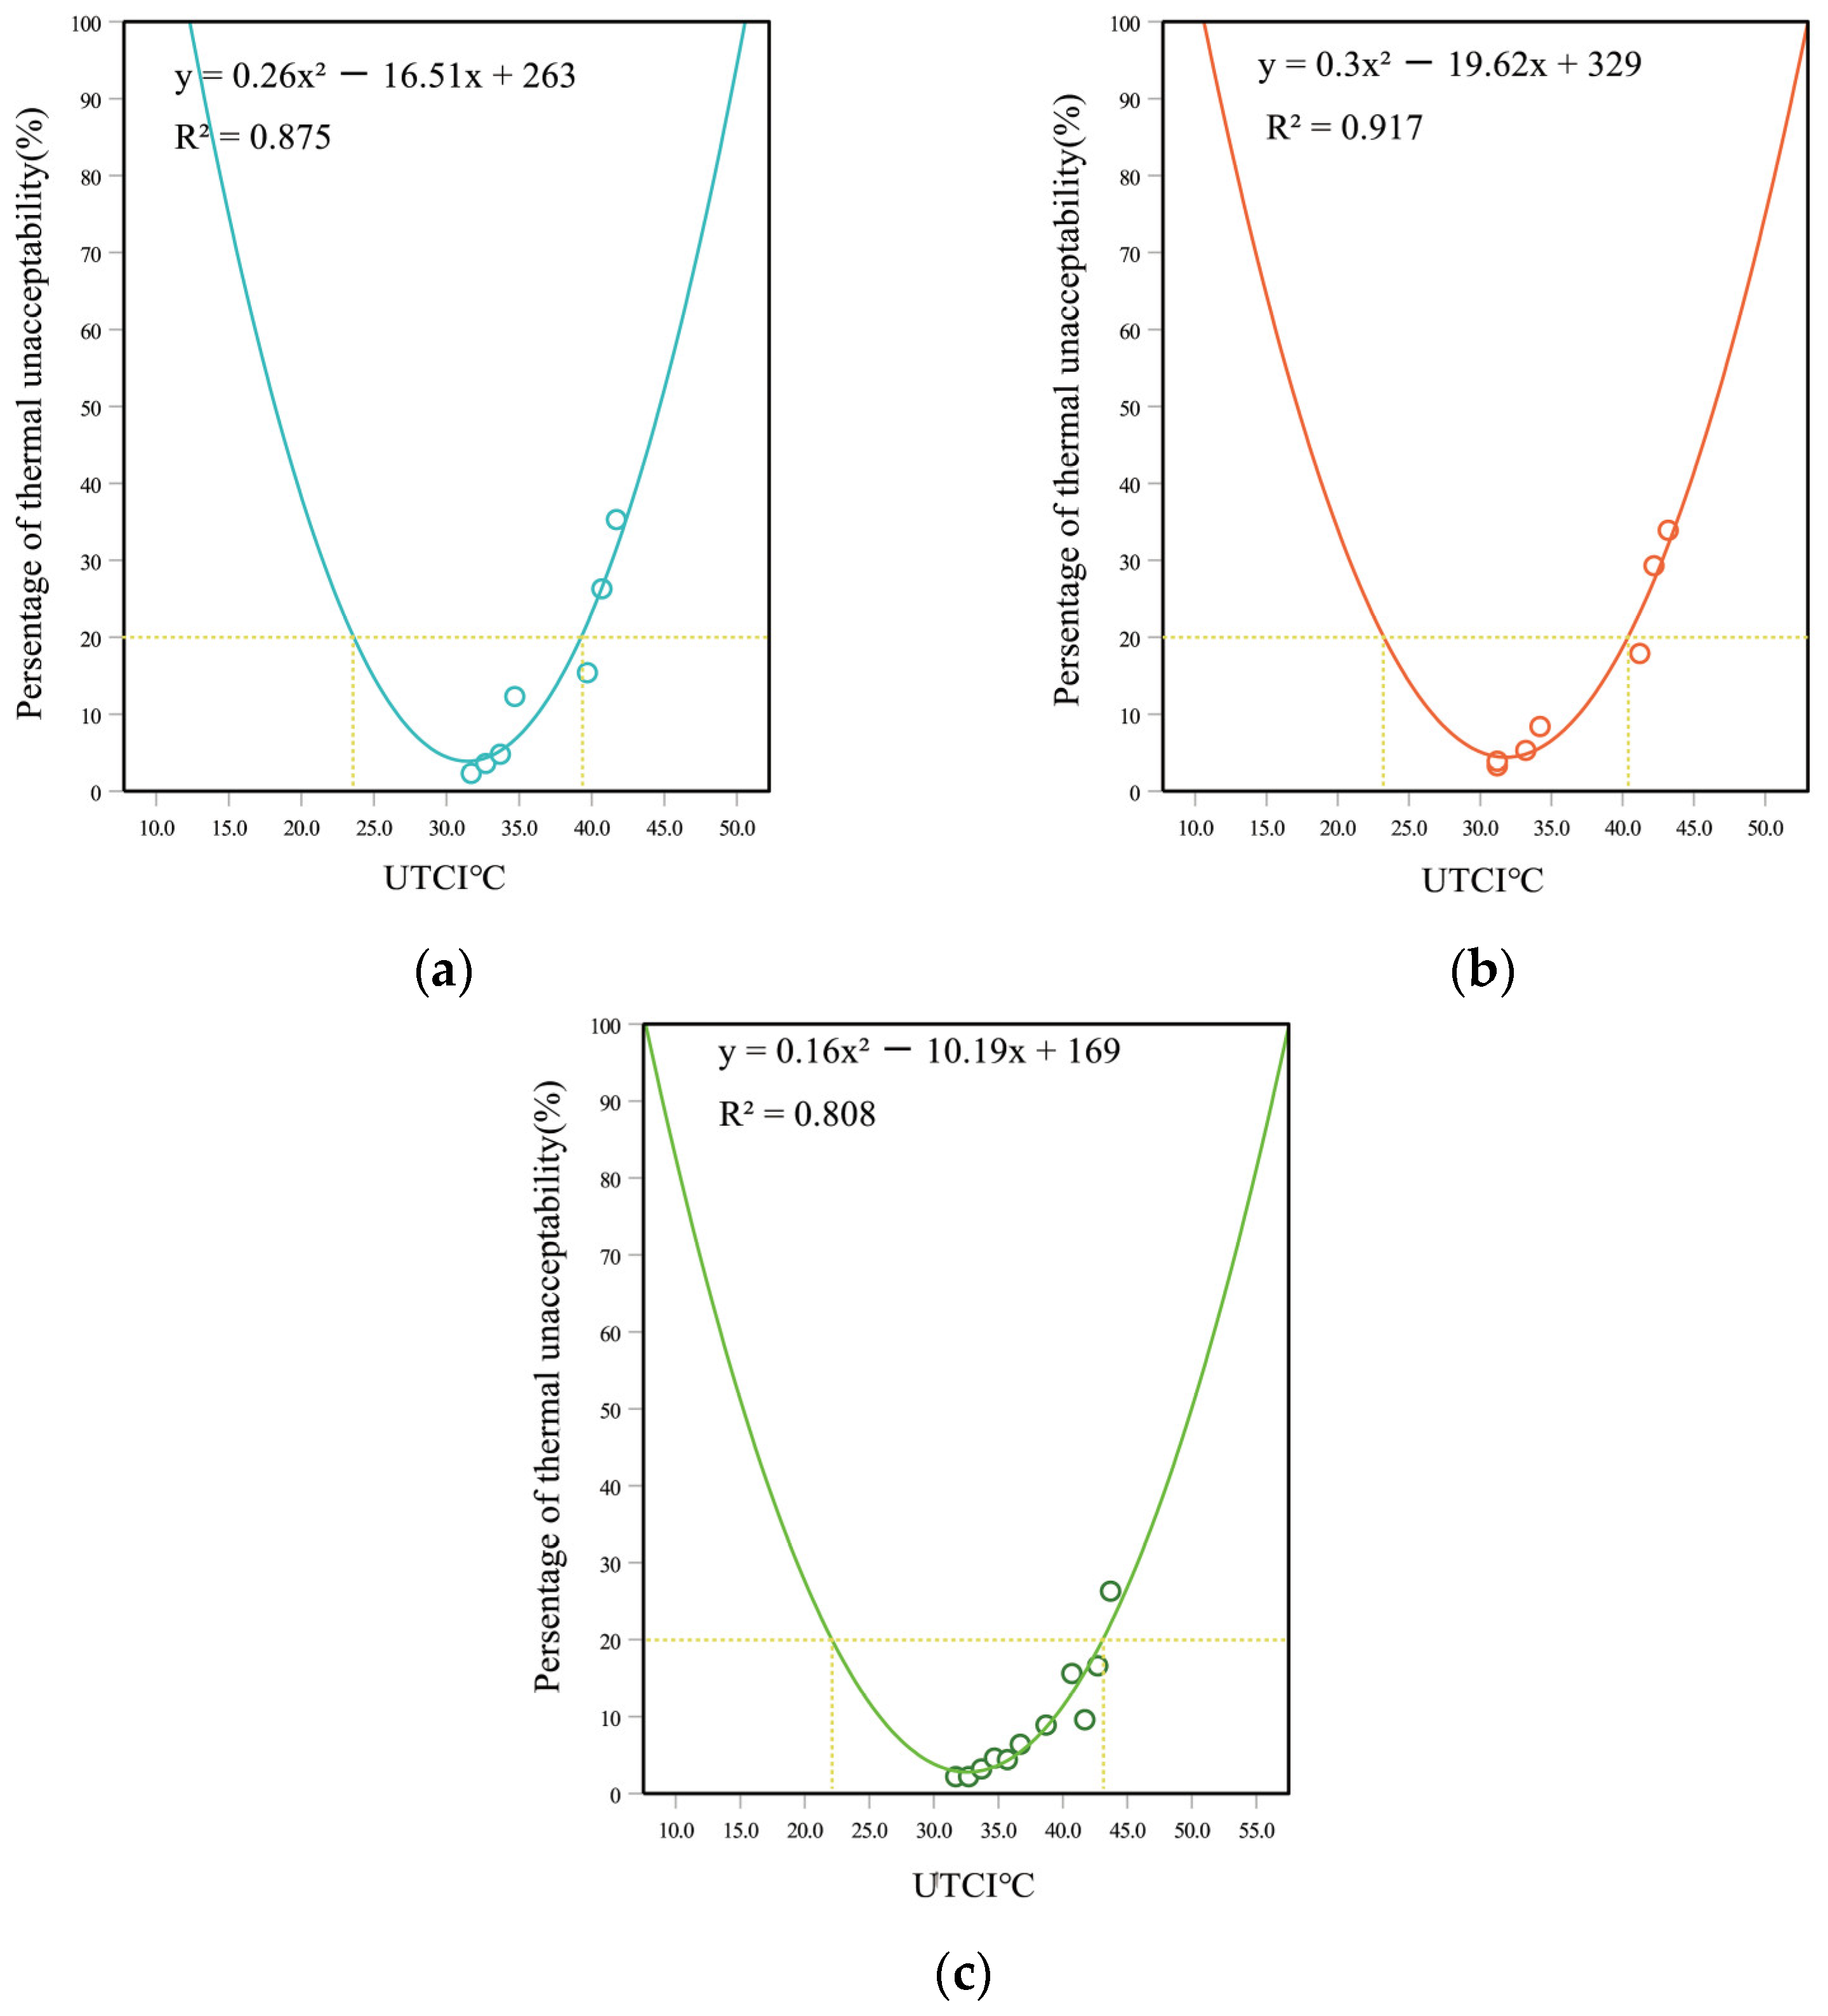
According to ASHRAE Standard 55, evaluation of the acceptability of the thermal environment for this condition requires that the percentage of acceptable votes from respondents be no less than 80% [7]. The percentage of thermal unacceptability was calculated and plotted for each 1 °C UTCI interval and regressed with a second-order polynomial fit to the UTCI. The following second-order polynomial was derived. (Equations (5)–(7)) [6,37,39]:
y = 0.26x2 − 16.51x + 263 (R2 = 0.875) (Male)
y = 0.3x2 − 19.62x + 329 (R2 = 0.917) (Female)
y = 0.16x2 − 10.19x + 169 (R2 = 0.808) (All respondents)
where x is the UTCI and y is the percentage of thermally unacceptable population. Then, y = 20% is substituted into the three equations to calculate the acceptable UTCI range for 80% of children. Figure 10 shows thermal acceptability rates for children’s activity spaces in high-density urban residential areas. Thermal acceptability ranges from 23.2 to 39.1 °C for males (Figure 10a), in females from 22.8 to 40.3 °C (Figure 10b), and all child respondents presented acceptable UTCI ranges from 23.1 to 42.3 °C (Figure 10c). The lower limit of the thermally acceptable range for females was 0.5 °C lower than that for males. However, the upper limit was 1.2 °C higher than that for males. The results indicate that females have a broader thermal acceptability range.

3.9. Thermal Adaptive Behaviors

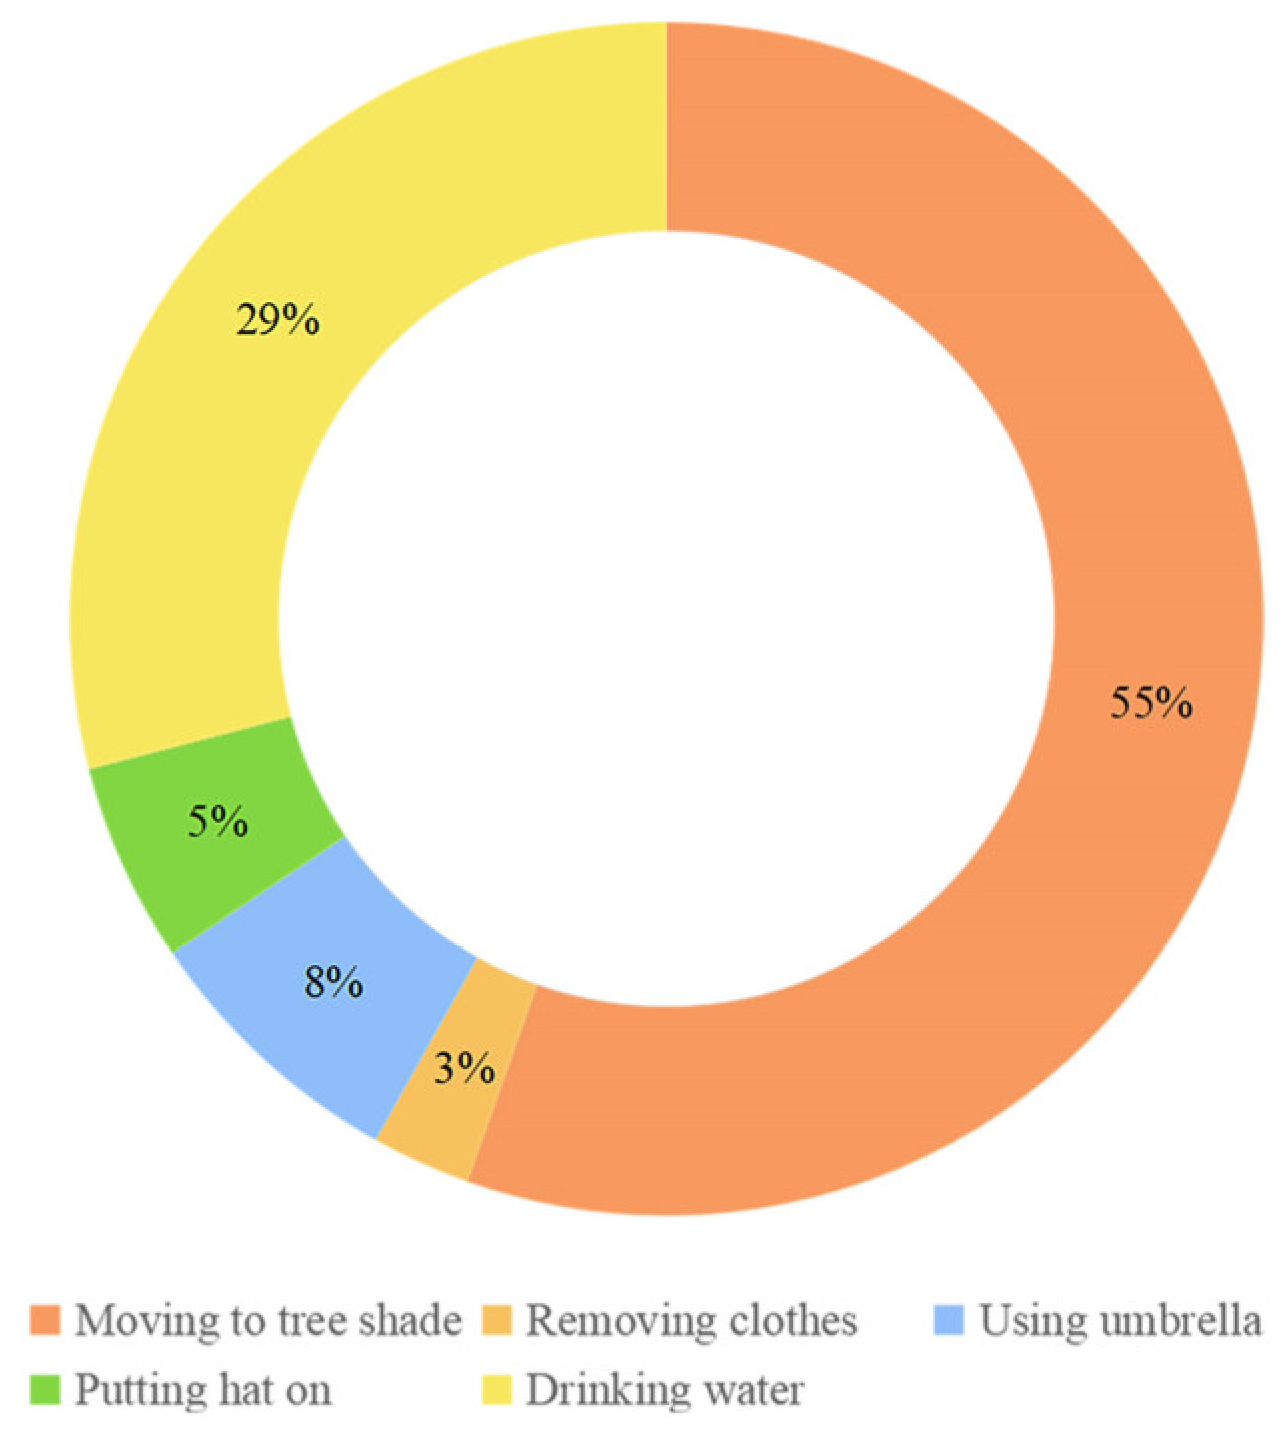
Figure 11 shows the adaptation behavior of children’s activity space to an outdoor thermal environment in Chongqing’s high-density urban residential area. Hence, 55% of children considered “moving to tree shade” as the best choice to improve their thermal comfort. The next highest choice was “drinking water,” chosen by 29% of children. The results indicate that more than half of the children would improve their thermal comfort by avoiding direct sunlight in the hot summer. The lowest percentage of children choosing to “removing clothes” was 3%. This might be because children wear very little clothing during outdoor activities in the summer heat, and the average thermal resistance of clothing is only 0.26 clo. Children’s clothing patterns reach “adaptive saturation,” so few children choose to reduce clothing to improve thermal comfort [40].

4. Discussion

4.1. Most Comfortable Type of Children’s Activity Areas

Outdoor thermal comfort was ranked for children’s activity spaces in three high-density urban residential areas: site R3 with dense vegetation > site R2 with artificial lake > site R1 with open space. The results indicate that different landscape elements have different degrees of influence on human thermal comfort. These results are consistent with the findings of Xu et al. [41] and Wang et al. [42]. In the actual design of residential areas, single landscape elements cannot be arranged centrally, and outdoor spaces should be reasonably designed according to users’ needs.

4.2. Factors Affecting Human Thermal Comfortable

The climate parameters from Table 5 and questionnaire statistics from Table 7 were compared with the overall comfort vote (OTCV) in Section 3.5. The ranking of the thermal comfort vote was inversely proportional to the global solar radiation intensity (G). The stronger the solar radiation, the lower the ranking order of the thermal comfort vote. The results indicate that globe radiation (G) is the main factor influencing outdoor thermal comfort in summer. Furthermore, comparing the other meteorological parameters with the thermal sensation vote revealed that the relative humidity (RH) and wind speed (V) measurements did not significantly affect thermal sensory. However, as the intensity of solar radiation increased, the air temperature (Ta) also increased, and the thermal comfort of the space decreased. This indicates that air temperature is crucial to children’s outdoor thermal comfort.
To sum up, air temperature (Ta) and global radiation (G) are the most important factors affecting human outdoor thermal comfort. The results of such studies are consistent with those of Lai et al. [13], Yao et al. [43], and Cheng et al. [44]. Such research results show that a single meteorological factor does not control human thermal comfort, and more studies are needed to explain the effects of different factors.

4.3. Neutral UTCI (NUTCI) and Neutral UTCI Range (NUTCIR)

Table 8 summarizes the neutral temperature and neutral temperature range for various regions of the world. In general, the NUTCI is usually higher at lower latitudes than at higher latitudes, such as India (31.8 °C) [45] versus Beijing (17.0 °C) [46]. Compared to the same climatic zone (Cwa), children’s NUTCI in this study was lower than that of Zhang et al. [47] in the mixed-age group in Chengdu. It is related to the study subjects’ physical characteristics and activity intensity. During the study period, we observed that over 80% of adult activities were standing and sitting and less than 20% of children were standing or sitting, which resulted in children feeling hotter than adults. This is consistent with studies by Lai et al. [13] and Huang et al. [8]. What differences may exist in different age groups at the same latitude still need further study.
Compared to the NUTCIR in Beijing (8.7–25.4 °C) [46] and Xi’an (6.4–21.5°C), (6.4~21.5 °C) [8], the NUTCIR for children in Chongqing is relatively narrow. This might be related to individual physiological adaptation, where changes in physiological responses due to repeated individual exposure to stimuli lead to a gradual decrease in such exposure-induced changes over time [22]. Beijing and Xi’an have large temperature differences, and residents are more adapted to the local climate with a broader range of NUTCI. In contrast, Chongqing has a long summer duration and minor temperature differences. Therefore, studies of outdoor thermal comfort should follow the principle that data from a measurement site should only be applied to that environment.

4.4. Thermal Acceptability Range (TAR)

This study found that 80% of children in Chongqing have a TAR range of 23.1–42.3 °C, which is wider than the corresponding NUTCIR temperature range of 14.6–24.6 °C. This may be related to Chongqing’s “ stove city,” with hot and long-lasting summers and average summer temperatures above 35 °C. Residents who have lived in the local area for a long time are more adapted to the hot weather [22]. Secondly, children’s perception of their thermal sensations in hot weather was ambiguous. Most children expressed an acceptable perception of the current environment during the study period, but this did not correspond to their physical characteristics. This could be the main reason for the higher upper limit of thermal acceptability range in children than adults. In addition, this may be related to the area of the study, where all three sites in this study were located within high-density residential areas in the urban core, where residents have a more adaptive capacity to the outdoor thermal environment under those conditions. Table 9 shows the acceptable temperature range for outdoor thermal comfort in other climatic zones. The results of the study are consistent with those of An et al. [46] and Cheung et al. [37].

4.5. Limitations of this Study

This study achieved satisfactory results, but there are still some limitations. First, the measurement period was only six days in the hottest month, and we did not measure the thermal environment in other seasons. Children’s thermal sensations are different in winter or during transitional seasons. In a future study, we will add thermal comfort experiments in other seasons. Secondly, we only selected children’s activity spaces in high-density residential areas as experimental sites. However, children in other areas, such as parks, campuses, and streets, may also show different thermal sensations. In the subsequent study, we will comprehensively consider more open spaces for thermal comfort.

5. Conclusions

This study used objective measurements and subjective questionnaires to study children’s outdoor thermal comfort in summer. UTCI was evaluated in order to explore the differences in children’s thermal comfort in different high-density residential areas in Chongqing and determine the thermal benchmarks for children’s outdoor thermal comfort. The following main conclusions were obtained:
  • Different landscape types of children’s activity spaces have different effects on outdoor thermal comfort, and gender differences also affect outdoor thermal comfort in the same type of children’s activity space. Studies have shown that children’s activity spaces with high vegetation cover (R3) are the most comfortable landscape spaces in summer.
  • Global radiation (G) and air temperature (Ta) were the primary meteorological factors influencing children’s thermal sensations. In summer, the enhancement of wind speed can effectively improve outdoor thermal comfort in children’s activity spaces in high-density residential areas.
  • Outdoor thermal comfort of children’s activity spaces in high-density urban residential areas was inferior overall. Thermal sensation voting (TSV) has a strong positive relationship with overall thermal comfort voting (OTCV) and thermal acceptability voting (TAV), and the results for all three questions are very similar.
  • Neutral UTCI (NUTCI) for males and females in Chongqing were 22.2 °C and 21.8 °C, NUTCI range (NUTCIR) was 18.4 to 26.1 °C for males and 16.2 to 27.3 °C for females, indicating that females in high-density urban residential areas in summer had lower thermal sensitivity than males. The thermal acceptable range (TAR) of 80% was 23.2–39.1 °C for males, 22.8–40.3 °C for females, and for all child respondents 23.1–42.3 °C, respectively. This reflected a broader range of thermal acceptability for female children.
The results of this study have important implications for the landscape design of children’s activity areas in high-density urban residential areas, which can help landscape designers and urban planners to improve the outdoor thermal environment and thermal comfort in cities based on scientific experimental studies in the construction of future residential areas. In future outdoor thermal comfort studies, to make up for the shortcomings of this study, we should consider more landscape spaces and people more comprehensively and conduct more accurate data analysis to understand the thermal sensory changes of humans and provide more comfortable and healthy urban habitats for urban residents.

Author Contributions

Conceptualization, H.G. and Q.H.; methodology, Q.H.; software, Q.H., M.F. and J.D.; validation, H.G. and Y.L.; formal analysis, Q.H. and M.F.; investigation, D.Z., Q.H., J.D. and Y.L.; resources, H.G.; data curation, Q.H. and D.Z.; writing—original draft preparation, Q.H.; writing—review and editing, H.G.; visualization, Q.H.; supervision, H.G. All authors have read and agreed to the published version of the manuscript.

Funding

This research was funded by the Science and Technology Research Program of Chongqing Municipal Education Commission (Grant No. KJQN201900747), the Chongqing Social Science Planning Project (Grant No. 2019PY63), and the Chongqing Postgraduate Joint Training Base Construction Project (Grant No. JDLHPYJD2020037).

Institutional Review Board Statement

Not applicable.

Informed Consent Statement

Not applicable.

Data Availability Statement

Not applicable.

Acknowledgments

We thank Dongsheng Zhu, Qiqi Hu, Xinxin Wang, Shunhang Zhou, Mengmeng Fang, Jie Diao, and Ying Liu for their help in measuring and collecting questionnaires on site, and Yawei Jiang for the fisheye photos of the measurement sites.

Conflicts of Interest

The authors declare no conflict of interest.

Appendix A

Figure A1. Children’s outdoor thermal comfort questionnaire.
Atmosphere 13 02016 g0a1

References

  1. United Nations Human Settlements Programme. World Cities Report 2020: The Value of Sustainable Urbanization; United Nations: Nairobi, Kenya, 2020; Available online: https://www.un-ilibrary.org/content/books/9789210054386 (accessed on 27 October 2022).
  2. Lyu, T.; Buccolieri, R.; Gao, Z. A Numerical Study on the Correlation between Sky View Factor and Summer Microclimate of Local Climate Zones. Atmosphere 2019, 10, 438. [Google Scholar] [CrossRef] [Green Version]
  3. Yin, Q.; Cao, Y.; Sun, C. Research on outdoor thermal comfort of high-density urban center in severe cold area. Build. Environ. 2021, 200, 107938. [Google Scholar] [CrossRef]
  4. Zhang, X.; Steeneveld, G.-J.; Zhou, D.; Duan, C.; Holtslag, B. A diagnostic equation for the maximum urban heat island effect of a typical Chinese city: A case study for Xi’an. Build. Environ. 2019, 158, 39–50. [Google Scholar] [CrossRef]
  5. Linares, C.; Diaz, J. Impact of high temperatures on hospital admissions: Comparative analysis with previous studies about mortality (Madrid). Eur. J. Public Health 2007, 18, 317–322. [Google Scholar] [CrossRef] [PubMed] [Green Version]
  6. Li, K.; Zhang, Y.; Zhao, L. Outdoor thermal comfort and activities in the urban residential community in a humid subtropical area of China. Energy Build. 2016, 133, 498–511. [Google Scholar] [CrossRef]
  7. ASHRAE55; Thermal Environmental Conditions for Human Occupancy (Ansi/Ashrae Standard). American Society of Heating, Refrigerating and Air-Conditioning Engineers: Atlanta, GA, USA, 2017.
  8. Huang, B.; Hong, B.; Tian, Y.; Yuan, T.; Su, M. Outdoor thermal benchmarks and thermal safety for children: A study in China’s cold region. Sci. Total. Environ. 2021, 787, 147603. [Google Scholar] [CrossRef]
  9. Vanos, J.K. Childrens health and vulnerability in outdoor microclimates: A comprehensive review. Environ. Int. 2015, 76, 1–15. [Google Scholar] [CrossRef]
  10. Djongyang, N.; Tchinda, R.; Njomo, D. Thermal comfort: A review paper. Renew. Sustain. Energy Rev. 2010, 14, 2626–2640. [Google Scholar] [CrossRef]
  11. Winquist, A.; Grundstein, A.; Chang, H.H.; Hess, J.; Sarnat, S.E. Warm season temperatures and emergency department visits in Atlanta, Georgia. Environ. Res. 2016, 147, 314–323. [Google Scholar] [CrossRef] [Green Version]
  12. Ebi, K.L.; Paulson, J.A. Climate Change and Child Health in the United States. Curr. Probl. Pediatr. Adolesc. Health Care 2010, 40, 2–18. [Google Scholar] [CrossRef]
  13. Chen, Q.; Lin, C.; Guo, D.; Hou, Y.; Lai, D. Studies of outdoor thermal comfort in northern China. Build. Environ. 2014, 77, 110–118. [Google Scholar] [CrossRef]
  14. Cheng, W.; Brown, R.D. An energy budget model for estimating the thermal comfort of children. Int. J. Biometeorol. 2020, 64, 1355–1366. [Google Scholar] [CrossRef] [PubMed]
  15. Nam, I.; Yang, J.; Lee, D.; Park, E.; Sohn, J.-R. A study on the thermal comfort and clothing insulation characteristics of preschool children in Korea. Build. Environ. 2015, 92, 724–733. [Google Scholar] [CrossRef]
  16. Huang, J.; Zhou, C.; Zhuo, Y.; Xu, L.; Jiang, Y. Outdoor thermal environments and activities in open space: An experiment study in humid subtropical climates. Build. Environ. 2016, 103, 238–249. [Google Scholar] [CrossRef] [Green Version]
  17. Olsen, H.; Kennedy, E.; Vanos, J. Shade provision in public playgrounds for thermal safety and sun protection: A case study across 100 play spaces in the United States. Landsc. Urban Plan. 2019, 189, 200–211. [Google Scholar] [CrossRef]
  18. Peel, M.C.; Finlayson, B.L.; McMahon, T.A. Updated world map of the Köppen-Geiger climate classification. Hydrol. Earth Syst. Sci. 2007, 11, 1633–1644. [Google Scholar] [CrossRef] [Green Version]
  19. Climatic Data Center of China Meteorological Administration. Meteorological Data for Built Environmental Analysis in China; China Architecture & Building Press: Beijing, China, 2005. [Google Scholar]
  20. Li, K.; Amatus, G. Spatiotemporal changes of heat waves and extreme temperatures in the main cities of China from 1955 to 2014. Nat. Hazards Earth Syst. Sci. 2020, 20, 1889–1901. [Google Scholar] [CrossRef]
  21. Yao, R.; Luo, Q.; Luo, Z.; Jiang, L.; Yang, Y. An integrated study of urban microclimates in Chongqing, China: Historical weather data, transverse measurement and numerical simulation. Sustain. Cities Soc. 2015, 14, 187–199. [Google Scholar] [CrossRef] [Green Version]
  22. Deng, Y.; Gan, D.; Tang, N.; Cai, Z.; Li, X.; Chen, S.; Li, X. Research on Outdoor Thermal Comfort and Activities in Residential Areas in Subtropical China. Atmosphere 2022, 13, 1357. [Google Scholar] [CrossRef]
  23. ISO International Standard 7726; Thermal Environments: Instruments and Methods for Measuring Physical Quantities. International Standard Organization: Geneva, Switzerland, 1998.
  24. Antoniadis, D.; Katsoulas, N.; Papanastasiou, D. Thermal Environment of Urban Schoolyards: Current and Future Design with Respect to Children’s Thermal Comfort. Atmosphere 2020, 11, 1144. [Google Scholar] [CrossRef]
  25. Haddad, S.; King, S.; Osmond, P.; Heidari, S. Questionnaire design to determine children’s thermal sensation, preference and acceptability in the classroom. In Proceedings of the PLEA 2012—28th International Conference: Opportunities, Limits & Needs, towards an Environmentally Responsible Architecture, Lima, Peru, 7–9 November 2012. [Google Scholar]
  26. ISO International Standard 7730; Ergonomics of the Thermal Environment Analytical Determination and Interpretation of Thermal Comfort Using Calculation of the PMV and PPD Indices and Local Thermal Comfort Criteria. International Standard Organization: Geneva, Switzerland, 2005.
  27. Havenith, G. Metabolic rate and clothing insulation data of children and adolescents during various school activities. Ergonomics 2007, 50, 1689–1701. [Google Scholar] [CrossRef] [PubMed]
  28. ISO International Standard 9920; Ergonomics of the Thermal Environment—Estimation of Thermal Insulation and Water Vapour Resistance of a Clothing Ensemble. International Standard Organization: Geneva, Switzerland, 2007.
  29. De Freitas, C.R.; Grigorieva, E. A comparison and appraisal of a comprehensive range of human thermal climate indices. Int. J. Biometeorol. 2016, 61, 487–512. [Google Scholar] [CrossRef] [PubMed]
  30. Potchter, O.; Cohen, P.; Lin, T.-P.; Matzarakis, A. Outdoor human thermal perception in various climates: A comprehensive review of approaches, methods and quantification. Sci. Total Environ. 2018, 631–632, 390–406. [Google Scholar] [CrossRef] [PubMed]
  31. Jendritzky, G.; de Dear, R.; Havenith, G. UTCI—Why another thermal index? Int. J. Biometeorol. 2012, 56, 421–428. [Google Scholar] [CrossRef] [PubMed] [Green Version]
  32. Binarti, F.; Koerniawan, M.D.; Triyadi, S.; Utami, S.S.; Matzarakis, A. A review of outdoor thermal comfort indices and neutral ranges for hot-humid regions. Urban Clim. 2019, 31, 100531. [Google Scholar] [CrossRef]
  33. Broede, P.; Fiala, D.; Blazejczyk, K.; Holmér, I.; Jendritzky, G.; Kampmann, B.; Tinz, B.; Havenith, G. Deriving the operational procedure for the Universal Thermal Climate Index (UTCI). Int. J. Biometeorol. 2011, 56, 481–494. [Google Scholar] [CrossRef] [Green Version]
  34. Matzarakis, A.; Rutz, F.; Mayer, H. Modelling radiation fluxes in simple and complex environments: Basics of the RayMan model. Int. J. Biometeorol. 2010, 54, 131–139. [Google Scholar] [CrossRef] [Green Version]
  35. Lai, D.; Lian, Z.; Liu, W.; Guo, C.; Liu, W.; Liu, K.; Chen, Q. A comprehensive review of thermal comfort studies in urban open spaces. Sci. Total. Environ. 2020, 742, 140092. [Google Scholar] [CrossRef]
  36. Lindner-Cendrowska, K.; Błażejczyk, K. Impact of selected personal factors on seasonal variability of recreationist weather perceptions and preferences in Warsaw (Poland). Int. J. Biometeorol. 2016, 62, 113–125. [Google Scholar] [CrossRef] [Green Version]
  37. Cheung, P.K.; Jim, C. Determination and application of outdoor thermal benchmarks. Build. Environ. 2017, 123, 333–350. [Google Scholar] [CrossRef]
  38. Aljawabra, F.; Nikolopoulou, M. Thermal comfort in urban spaces: A cross-cultural study in the hot arid climate. Int. J. Biometeorol. 2018, 62, 1901–1909. [Google Scholar] [CrossRef] [PubMed]
  39. Wei, D.; Yang, L.; Bao, Z.; Lu, Y.; Yang, H. Variations in outdoor thermal comfort in an urban park in the hot-summer and cold-winter region of China. Sustain. Cities Soc. 2021, 77, 103535. [Google Scholar] [CrossRef]
  40. Mishra, A.K.; Ramgopal, M. Field studies on human thermal comfort—An overview. Build. Environ. 2013, 64, 94–106. [Google Scholar] [CrossRef]
  41. Xu, M.; Hong, B.; Mi, J.; Yan, S. Outdoor thermal comfort in an urban park during winter in cold regions of China. Sustain. Cities Soc. 2018, 43, 208–220. [Google Scholar] [CrossRef]
  42. Wang, Y.; Ni, Z.; Peng, Y.; Xia, B. Local variation of outdoor thermal comfort in different urban green spaces in Guangzhou, a subtropical city in South China. Urban For. Urban Green. 2018, 32, 99–112. [Google Scholar] [CrossRef]
  43. Yao, J.; Yang, F.; Zhuang, Z.; Shao, Y.; Yuan, P.F. The effect of personal and microclimatic variables on outdoor thermal comfort: A field study in a cold season in Lujiazui CBD, Shanghai. Sustain. Cities Soc. 2018, 39, 181–188. [Google Scholar] [CrossRef]
  44. Cheng, B.; Gou, Z.; Zhang, F.; Feng, Q.; Huang, Z. Thermal comfort in urban mountain parks in the hot summer and cold winter climate. Sustain. Cities Soc. 2019, 51, 101756. [Google Scholar] [CrossRef]
  45. Kumar, P.; Sharma, A. Assessing outdoor thermal comfort conditions at an urban park during summer in the hot semi-arid region of India. Mater. Today Proc. 2021, 61, 356–369. [Google Scholar] [CrossRef]
  46. An, L.; Hong, B.; Cui, X.; Geng, Y.; Ma, X. Outdoor thermal comfort during winter in China’s cold regions: A comparative study. Sci. Total Environ. 2021, 768, 144464. [Google Scholar] [CrossRef]
  47. Zhang, L.; Wei, D.; Hou, Y.; Du, J.; Liu, Z.; Zhang, G.; Shi, L. Outdoor Thermal Comfort of Urban Park—A Case Study. Sustainability 2020, 12, 1961. [Google Scholar] [CrossRef]
Figure 1. Site locations and measured spaces.
Atmosphere 13 02016 g001
Figure 2. Monthly maximum/minimum/mean air temperature and mean relative humidity in Chongqing in 2001–2021.
Atmosphere 13 02016 g002
Figure 3. Photographs of instruments for meteorological measurements: (1) handheld weather recorder, (2) global solar radiometer, and (3) black globe thermometer.
Atmosphere 13 02016 g003
Figure 4. Summer simplified garment checklist.
Atmosphere 13 02016 g004
Figure 5. Thermal sensation vote (TSV) in three different measuring points.
Atmosphere 13 02016 g005
Figure 6. Preference votes for meteorological factors in the three different measuring points: (a) Ta (air temperature), (b) V (wind speed), (c) G (global radiation).
Atmosphere 13 02016 g006
Figure 7. Overall thermal comfort votes (OTCV) in three different measuring sites.
Atmosphere 13 02016 g007
Figure 8. Thermal Acceptability Vote (TAV) in three different measuring points.
Atmosphere 13 02016 g008
Figure 9. Correlation between UTCI and MTSV: male (a), female (b) and all respondents (c).
Atmosphere 13 02016 g009
Figure 10. Relationship between the thermal unacceptable rate and UTCI: male (a), female (b) and all respondents (c).
Atmosphere 13 02016 g010
Figure 11. The frequency distribution of thermal adaptive behavior.
Atmosphere 13 02016 g011
Table 1. Descriptions of the three residential children’s activity space.
Residential AreaBasic
Parameters
Space
Characteristics
Fish-Eye Photos
R1Area: 1617.9 m2
Greening Rate: 32.3%
Volume Rate: 2.9
Building Density: 43.6%
Inhabitants: 6439
Building Years: 2012
The R1 site is located southeast of the residential community, with open design space. The internal children’s recreational facilities are complete. The site has low vegetation coverage and is surrounded by low shrubs and lawns.Atmosphere 13 02016 i001
SVF:0.33
R2Area: 1056.3 m2
Greening Rate: 25.7%
Volume Rate: 3.5
Building Density: 38.7%
Inhabitants: 6332
Building Years: 2015
Three artificial lakes surround the R2 site in an enclosed design. The children’s activity area is moderate in size, and the internal children’s recreational facilities are complete. Tall trees and shrubs surround the space.Atmosphere 13 02016 i002
SVF:0.11
R3Area: 968.7 m2
Greening Rate: 35.9%
Volume Rate: 3.9
Building Density: 36.5%
Inhabitants: 4542
Building Years: 2015
The R3 site is located on the east side of the residential community, and the children’s activity space covers a large area with an enclosed design. The site has high vegetation coverage and good shading in summer. The vegetation types are mostly tall trees and shrubs.Atmosphere 13 02016 i003
SVF:0.05
Table 2. Information on experimental equipment.
NumberParameterBrand and ModelRangeAccuracy
1Air temperatureKestrel5500−29~70 °C±0.5 °C
Relative humidity10~90%±2%
Wind speed0.6~40 m/s±3%
2Global solar radiationTES-13330~2000 W/m2±5%
3Black globe temperatureRS-HQ40.0~120.0 °C±0.1 °C
Table 3. Metabolic rate for children with different activity intensities.
ActivityActivity IntensityMetW/m2
Reclining10.839.0
Seated2148.8
Standing31.258.6
Walking42.097.6
Running52.6126.9
Exercising63.1151.3
Table 4. Thermal stress classification for the Universal Thermal Climate Index (UTCI).
UTCI (°C)Thermal Stress Category
≥+46 Extreme heat stress
+38 to +46 Very strong heat stress
+32 to +38Strong heat stress
+26 to +32 Moderate heat stress
+9 to +26No thermal stress
0 to +9Slight cold stress
−13 to 0Moderate cold stress
−27 to −13Strong cold stress
−40 to −27Very strong cold stress
<−40Extreme cold stress
Table 5. Meteorological parameters of three sites during the measurement period in summer.
SiteTa (°C)RH (%)V (m/s)Tg (°C)G (W/m2)
MaxMinMeanMaxMinMeanMaxMinMeanMaxMinMeanDaily Average
R143.228.535.168.930.247.82.60.00.449.729.639.3433.0
R242.629.736.068.433.255.31.70.00.246.429.937.9291.1
R341.729.935.072.238.152.42.40.00.247.230.235.7130.0
Table 6. Respondents’ attributes.
GenderNumberAgeHeight (m)Weight (kg)
MinMaxMean ± SDMinMaxMean ± SDMinMaxMean ± SD
Male1565128 ± 2.2102.8159.5125 ± 15.117.564.530.6 ± 11
Female1405128 ± 2.3103.5160128.5 ± 13.616.249.527.4 ± 8.7
Table 7. Summarize some of the questionnaire variables.
NumberVariableOptionStatistics and Percentage
1TSVCold = −300
Cool = −200
Slightly cool = −100
Neutral = 0217.1%
Slightly warm = +17625.8%
Warm = +217358.4%
Hot = +3268.7%
2Ta preferenceHigher = +100
Unchanged = 0186.1%
Lower = −127893.9%
3V preferenceHigher = +126489.2%
Unchanged = 03110.5%
Lower = −110.3%
4G preferenceHigher = +110.3%
Unchanged = 011739.5%
Lower = −117860.2%
5Thermal comfortableUncomfortable = −17625.7%
Neutral = 019766.6%
Comfortable = +1237.7%
6Thermal acceptabilityUnacceptable = −14314.5%
Acceptable = +125385.5%
Table 8. NUTCI and NUTCIR in other outdoor thermal comfort studies.
LocationClimatic ZoneSeasonNUTCI
(°C)
NUTCIR
(°C)
References
Chengdu, ChinaCwaWinter, Summer24.713.2~27.2[47]
Xi’an, ChinaBSk/CwaWinter, Summer13.96.4~21.5[8]
Beijing, ChinaDwaWinter17.08.7~25.4[46]
Haryana, IndianBshSummer31.828.0~35.6[45]
Table 9. TAR in other outdoor thermal comfort studies.
LocationClimatic ZoneSeasonRangTAR
(°C)
References
Chengdu, ChinaCwaWinter, Summer80%8.1~28.3[47]
Xi’an, ChinaBSk/CwaWinter, Summer80%3.7~21.2[8]
Beijing, ChinaDwaWinter80%6.1~26.0[46]
Hong Kong, ChinaCwaSummer80%22.7~30.4[37]
Publisher’s Note: MDPI stays neutral with regard to jurisdictional claims in published maps and institutional affiliations.