Article

Measuring and Regression Modeling of Gas–Particle Partitioning of Atmospheric Oxidized Mercury at a Coastal Site in Shanghai

1
School of Environment, Hangzhou Institute for Advanced Study, University of Chinese Academy of Sciences, Hangzhou 310024, China
2
State Key Joint Laboratory of Environmental Simulation and Pollution Control, School of Environment, Tsinghua University, Beijing 100084, China
3
State Environmental Protection Key Laboratory of Sources and Control of Air Pollution Complex, Beijing 100084, China
4
State Key Laboratory of Environmental Criteria and Risk Assessment, Chinese Research Academy of Environmental Science, Beijing 100012, China
*
Author to whom correspondence should be addressed.
Atmosphere 2022, 13(12), 2014; https://doi.org/10.3390/atmos13122014
Submission received: 9 November 2022 / Revised: 25 November 2022 / Accepted: 27 November 2022 / Published: 30 November 2022

Abstract

:
Gas–particle partitioning between reactive gaseous mercury (RGM) and particle bound mercury (PBM) controls the fates of atmospheric oxidized mercury (namely reactive mercury, RM). We conducted a long-term observations of gaseous elemental mercury (GEM), RGM, PBM, and auxiliary parameters in Chongming Island, Shanghai, China, to understand the characteristics of speciated mercury and their gas–particle partitioning behaviors. The entire average abundances of GEM, RGM and PBM were 2.12 ± 0.94 ng/m3, 14.75 ± 9.94 pg/m3 and 21.81 ± 30.46 pg/m3, respectively. An observation data dependent empirical gas–particle partitioning relationship of partitioning coefficient and temperature log(1/KP) = −2692.20/T + 10.57 was obtained, and it varied in different season being by the temperature. To further evaluate the influences of temperature, particulate matter (PM), relative humidity on RGM and PBM partitioning process, the particulate fraction (φ = PBM/(PBM + RGM)) was used in this study. High φ values (φ > 0.8) mainly occurred at low temperature domain (<281 K), and high PM concentration enhanced this influence. In addition, high relative humidity shifts RGM from atmosphere partitioning to PBM in response to the diurnal valley φ values at 13:00–16:00 in the summer. Photochemical reactions were proposed to play important roles on partitioning processes between RGM and PBM. This study will benefit for the understanding of oxidized mercury fate and influencing factors in the complex atmospheric pollutants.

1. Introduction

Mercury is a global toxic pollutant under the control of the Minamata Convention on Mercury. Most of the mercury from anthropogenic and natural sources are emitted into the atmosphere, making the atmosphere especially important for deposition and global distribution of mercury. Once deposited to land surface, the inorganic mercury would transfer to more toxic organic species (majored by methylmercury) threatening ecology and human health [1]. In general, three main forms of mercury exist in atmosphere: gaseous elemental mercury (GEM, Hg0), reactive gaseous mercury (RGM, Hg2+) and particle-bound mercury (PBM, Hgp). RGM and PBM have strong physical chemical activities and water solubilities, which can be efficiently scavenged from the atmosphere via wet and dry depositions regionally. The deposition velocity of RGM (0.5–6.0 cm/s) and PBM (0.02–2.0 cm/s) are several orders bigger than GEM (~1 × 10⁻⁵ cm/s) [2]. RGM and PBM together, are called reactive mercury (RM), which is said to include HgCl2, HgO, HgBr2, HgSO4 and Hg(OH)2. RM is regarded as a semi-volatile compounds with low vapor pressure, e.g., 8.99 × 10⁻³ Pa for HgCl2 and 9.2 × 10⁻¹² Pa for HgO at 298 K, which can exist both in the gaseous phase and particulate phase [1,3,4].
The gas–particle partitioning process has important implications for atmospheric mercury fate, deposition and transport. Condensation, adsorption and chemical reactions were proposed as the three major mechanisms involved for RGM and PBM inter-conversion via gas–particle partitioning [5]. Previous studies adopted the partitioning coefficient (KP) to explore the gas–particle partitioning process for RM, and verified that the partitioning process was strongly controlled by ambient temperature and aerosol chemical constituents [2,6,7]. Actually, RGM and PBM could be removed from air via different deposition pathways and velocities, which makes rain precipitation exhibit different scavenging efficiencies for RGM and PBM [1,2]. Additionally, according to the latest researches that GEM can be in situ oxidized to RGM induced by atmospheric oxidants, such as O3, OH∙ and Br∙ radicals, O3 and Br∙, which were believed to have similar contributions for RGM formation [4,8]. Meanwhile, recent laboratory and field measurements confirm that PBM could be reduce back to GEM via photochemical reactions, especially in the case of aqueous phase aerosols [9]. These newly formed RGM and gradually reduced PBM were expected to shift RM gas–particle partitioning. However, little is known about the influence of photochemical reactions on RM dynamic gas–particle partitioning.
The understanding of how environmental factors and photochemical reactions influence RGM and PBM partitioning, will benefit the prediction of mercury geochemical cycling. In this study, we use long-term (March 2014–February 2017) continuous measurements of RGM and PBM at Chongming Island, Shanghai, China to evaluate atmospheric oxidized mercury partitioning processes. The main aims of this study were to: (1) investigate temporal variations in RGM and PBM; (2) validate RM gas–particle partitioning via empirical models, and (3) assess the potential factors influencing RM gas–particle partitioning process.

2. Materials and Methods

2.1. Observation Site

The GEM, RGM and PBM measurements were conducted at Dongtan Birds National Natural Reserve (31°27′ N, 121°9′ E), Chongming Island, Shanghai, which is a regional background site in eastern China (Figure 1). This atmospheric pollutants observation site is ~50 km from the urban area of Shanghai, and it is surrounded by an intertidal zone that characterized by spare population and no large anthropogenic industrial sources. Chongming Island is an alluvial island in Yangtze River Delta and the third largest island in China, with an area of ~1200 km2. This area is particularly susceptible to East Asian monsoon and receives outflow pollutants from inland area in China. The climate of Chongming island is north subtropics climate, characterized by a typical monsoon climate: hot humid summer dominated by southeast wind, with dry cold winter prevailing by northerly wind. The average annual precipitation amount is approximately 1000 mm, but dramatically varied in inter–annual time. For more detailed information about this atmospheric pollutants monitoring site, one can explore our previous researches [10,11].

2.2. Atmospheric Mercury, Pollutants and Meteorological Parameters Monitoring

Field atmospheric mercury observations were conducted on the rooftop of a three-story building (~10 m above the ground), GEM, RGM and PBM concentrations were monitored from March 2014 to February 2017. The speciated atmospheric mercury were monitored with an automated mercury vapor analyzer Tekran 2537X (Tekran Instrument Corp., Toronto, ON, Canada) coupled with mercury speciation modules Tekran 1130/1135 instruments. This mercury instrument has been used for atmospheric mercury observation worldwide; details of the measurement can be found in our previous study. Briefly, the sample line is set with the inlet placed at 1.5 m above the instrument platform connected to a Teflon sample line (10 m length). The Tekran 2537X Hg vapor analyzer applies a specific set of collections by amalgamation on dual gold cartridge. It was followed by a thermal desorption (500 °C), resulting in the operationally defined continuous release of GEM from the traps into a carrier gas and its quantification by cold vapor atomic fluorescence spectroscopy. The sampling resolution for the measurements of TGM, RGM and PBM abundances was 1 h at 10 L/min of flow rate, with a detection limit of 0.1 ng/m3, 1 pg/m3 and 1 pg/m3, respectively. The instrument is set to perform automated internal calibrations every 25 h using an internal permeation source, and the internal permeation source was calibrated every 12 months with manual injection of Hg by a syringe from an external Hg source. Two zero and two zero calibrations were performed for each calibration of gold trap A and B, respectively, with differences of less than 10%. The impactor plates and quartz filter were changed every 2 weeks, denuders were re–coated once every 2 weeks, while the soda lime was changed once a month.
Meanwhile, fine particle (PM2.5, particle with aerodynamic diameter ≤2.5 μm), ozone (O3), nitric oxide (NOx), carbon monoxide (CO) and sulfur dioxide (SO2) were also monitored by Thermo Scientific TEOM 1405D and Model 49i O3 Analyzer, Model 42i–TL NOx Analyzer, Model 48i CO Analyzer, and Model 43i SO2 Analyzer, Thermo Fisher Scientific, Waltham, MA, USA, with detection limits of 0.1, 1.0, 0.4, 0.04, and 0.5 μg/m3, respectively. Meteorological parameters, including temperature, relative humidity and solar radiation, and precipitation amount, were measured by using a dedicated automatic meteorological station at the same monitor site.

2.3. Gas–Particle Partitioning Model

The RM gas–particle partitioning has been characterized as a linear Langmuir isotherm adsorption process, and the available adsorption surface area is proportional to the particle mass concentration [12,13]. The gas–particle partition behavior of RM was parameterized using Equation (1), which has been widely been used for evaluating gas–particle partitioning behaviors of semi–volatile organic compounds [14,15]. The subscript “M” of KP-M (m3/µg) represents the KP value calculated from field measurement.
K P - M = P B M / P M R G M
where RGM and PBM represent RGM and PBM concentrations, respectively, with unit of pg/m3; PM is the concentration of suspended particle, PM2.5 in this study for the consistence of PBM, µg/m3.
Liner correlation model between log(1/KP-M) and inverse temperature has been proposed to evaluate the gas–particle partitioning process of RM, under the influence of temperature [12], shown as follows:
log 1 K P - M = m T + b
where the slope m and intercept b are fitting constants to be determined empirically via regression, unitless; T is ambient temperature, K. After the regression analysis of log(1/KP) and 1/T, the slope and intercept values should be known, marked as m0 and b0. Then, the log(1/KP) could be calculated empirically using 1/T, m0 and b0 in Equation (3). For better distinguishment, this empirical gas–particle partitioning could be expressed as Equation (3), the subscript “R” in log(1/KP-R) represent regression model approach.
log 1 K P - R = m 0 T + b 0
The particulate fraction (φ) of RM was proposed here to reflect their deposition efficiency as well as the scavenging ability, as follows:
φ = P B M R G M + P B M = K P × P M 1 + K P × P M

3. Results

3.1. Concentrations of GEM, RGM and PBM

The GEM, RGM and PBM concentrations were characterized by large variabilities, with hourly values ranges of 0.18–7.48 ng/m3, and 0.1–97.07 pg/m3, and 0.1–427.92 pg/m3, with mean values of 2.12 ± 0.94 ng/m3, 14.75 ± 9.94 pg/m3 and 21.81 ± 30.46 pg/m3, respectively (Table 1). In a general context, the average abundances of GEM were a bit higher than the background values of 1.5–1.7 ng/m3 in the Northern Hemisphere [1,16]. In comparison with the reported speciated mercury abundances from sites in Shanghai, Zhang et al. (2017) [10] reported that GEM concentrations were 2.65 ± 1.73 ng/m3 at the same monitoring site between 2009–2012, the decreased GEM observed in this study was majorly caused by the aggressive measures to control atmospheric pollutants emissions in China [11]. Qin et al. (2019) [5] reported a slightly higher GEM concentration (2.77 ± 1.36 ng/m3) in an inland background site than the measurement found in this study, and several times higher concentrations of RGM and PBM. Han et al. (2019) [17] found that the PBM concentrations in the urban area of Shanghai (292 ± 121 pg/m3) was ~13 times higher than this costal background site. The GEM concentrations observed at Chongming Island were much higher than remote areas of Qomolangma [18], Nam Co [19], and Waliguan [20] in China and Antarctica [21], but much lower than those observed at urban areas of Guiyang [22], Xiamen [23] and Beijing [24] in China. The RGM and PBM are comparable with observations conducted at remote sites but far lower than measurements in urban areas.
In addition, all the median annual concentrations of GEM (1.91 ng/m3), RGM (12.96 ng/m3) and PBM (10.62 ng/m3) were lower than their corresponding mean values, suggesting occasional pollution episodes with elevated mercury abundances occurring at Chongming Island during the observation period. The positive correlations between PBM with PM2.5, NOx, CO and SO2 (r = 0.29–0.63, p < 0.05), and GEM with NOx and PM2.5, implying regional anthropogenic emission transportation contributed to mercury variation in Chongming Island station. Specifically, the GEM showed its highest level in summer (2.46 ± 1.13 ng/m3), while PBM showed the highest concentrations in cold winter (42.60 ± 43.22 ng/m3) and its lowest in hot summer (11.45 ± 13.25 ng/m3).

3.2. Regression of log(1/KP) and 1/T

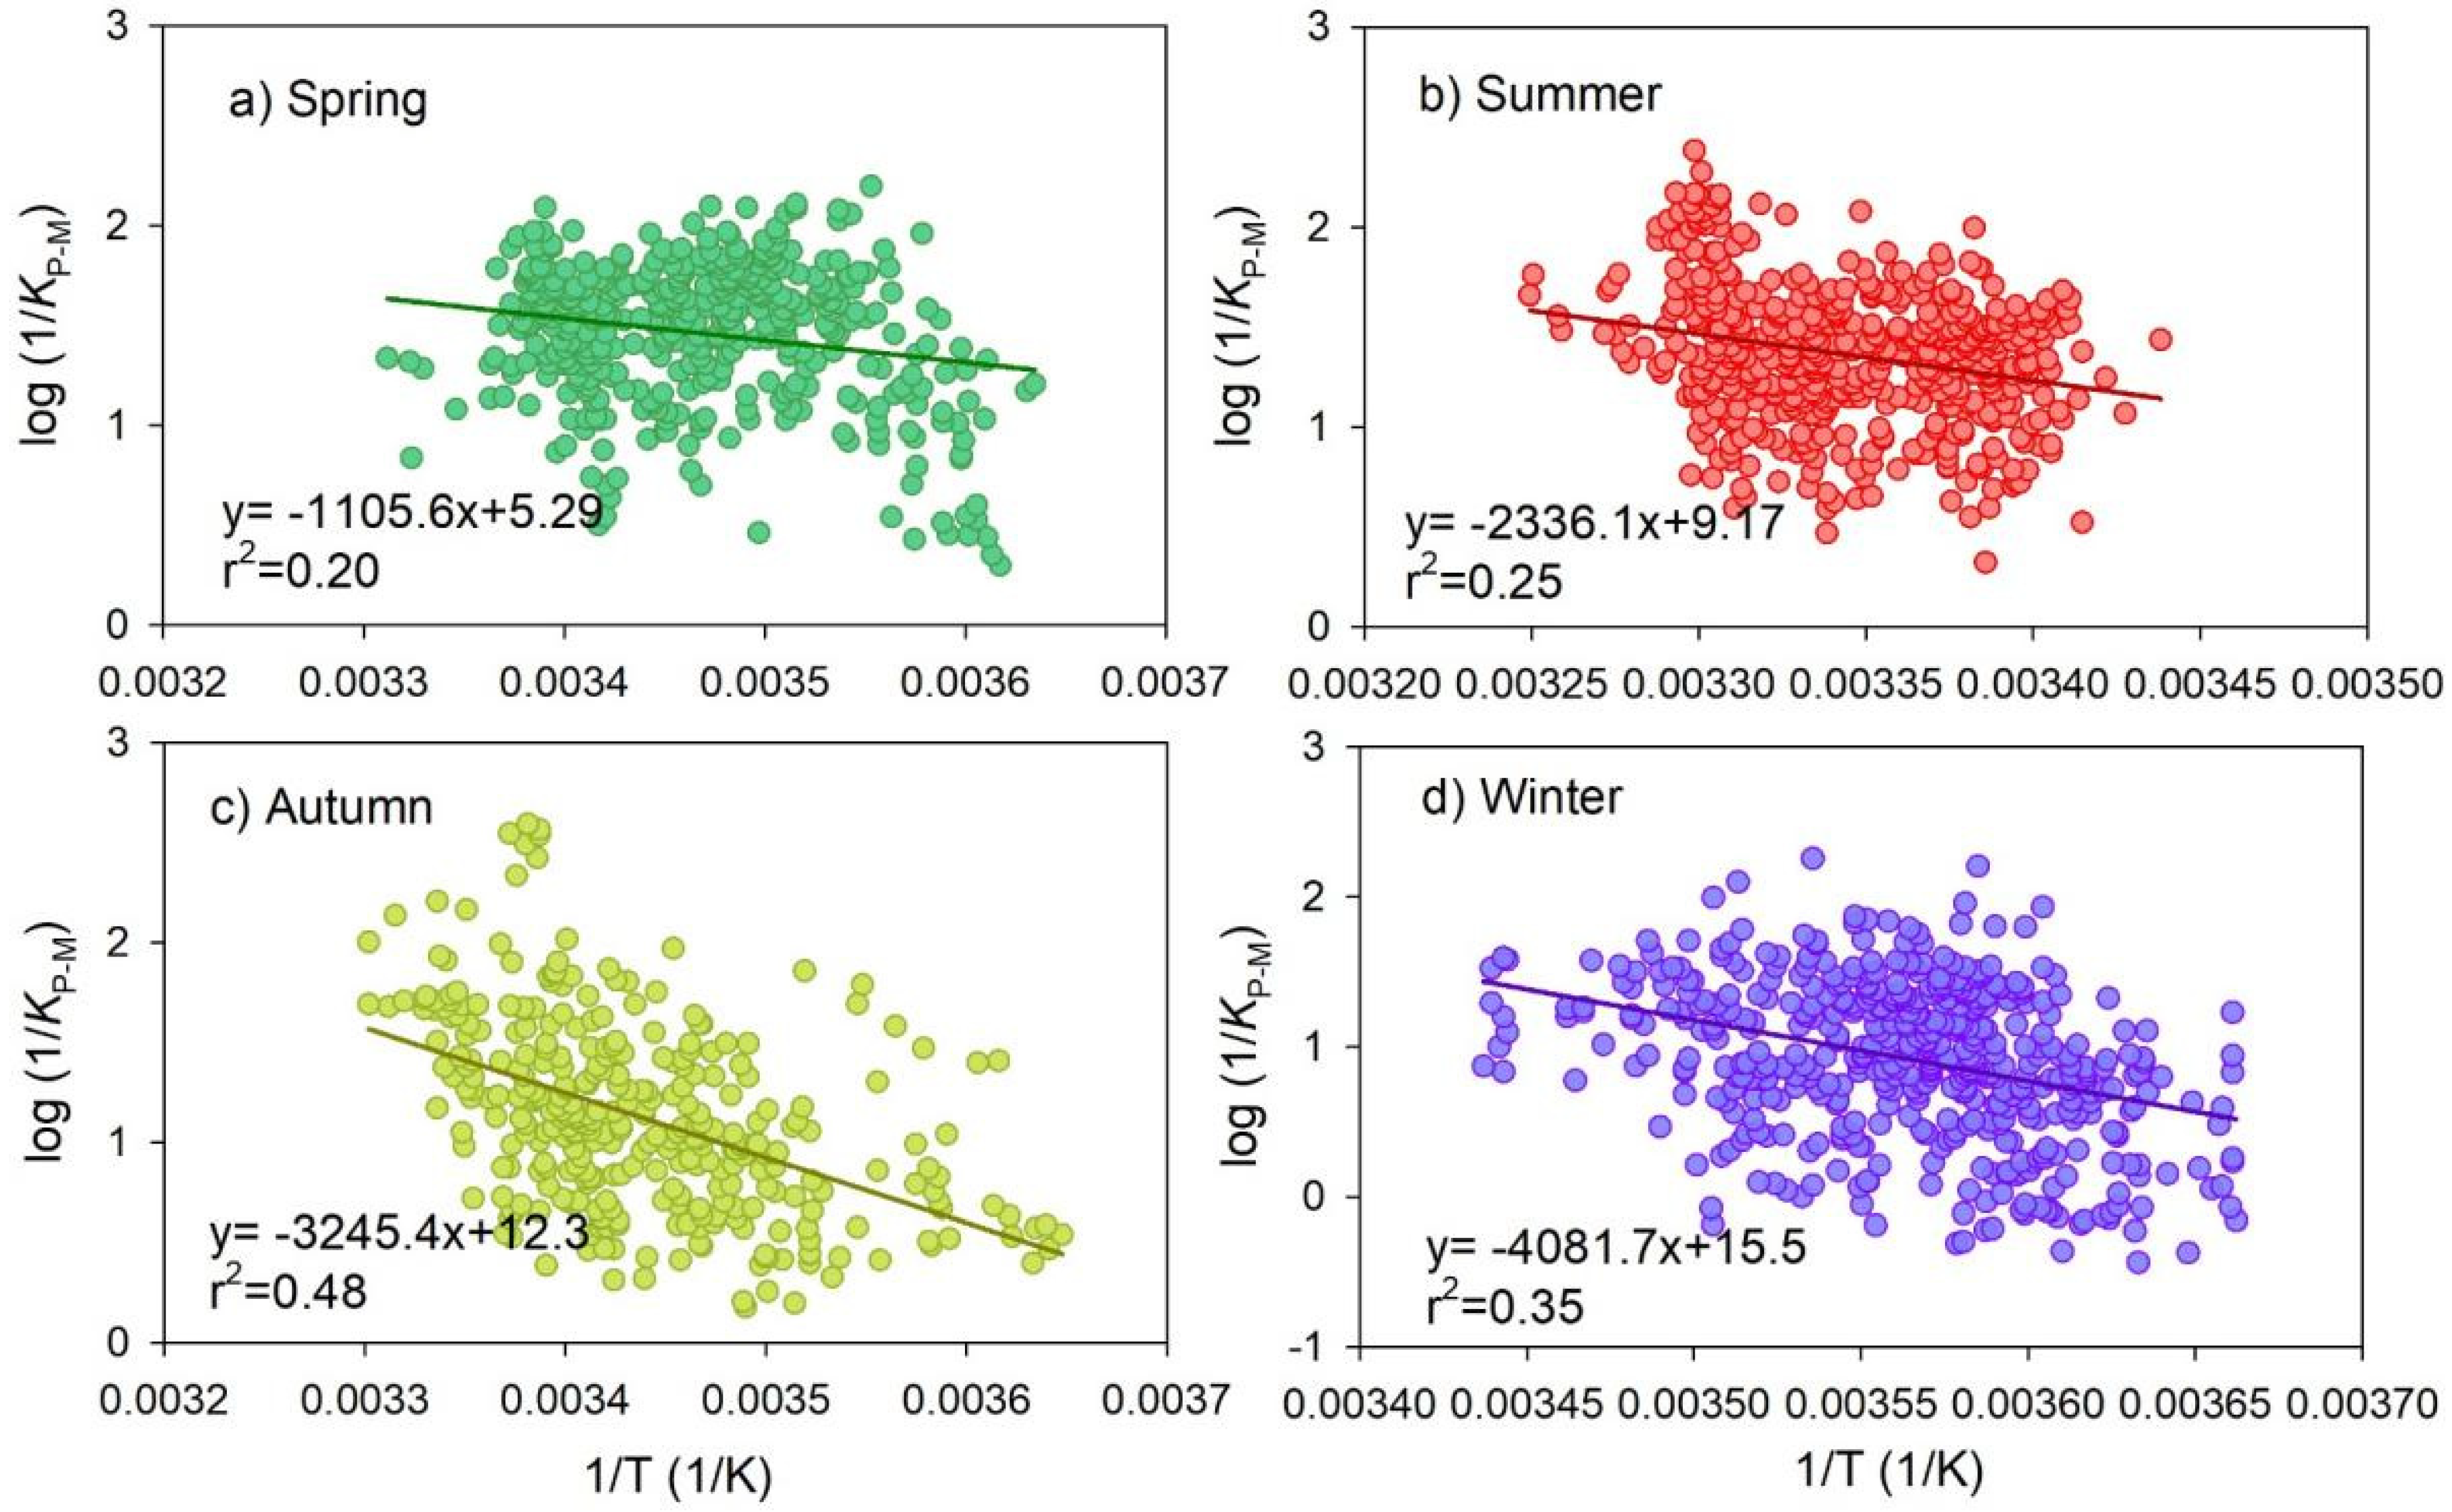
The calculated gas–particle partitioning coefficient KP-M values of RM ranged from 0.01–18.88 m3/µg, with mean values of 0.15 ± 0.40 m3/µg, which were lower than the calculation (0.20 ± 0.25 m3/µg) in urban Beijing [24] and the measurement observed in ten Atmospheric Mercury Network sites (AMNet, aimed to measure atmospheric mercury fractions which contribute to dry and total mercury deposition) in USA (0.61 ± 0.64 m3/µg) [6]. In order to research the seasonal trends of RM gas–particle partitioning, the total observed datasets of logKP-M with inverse temperature were divided into four seasonal groups (Figure 2). Statistically significant negative correlations were found between log(1/KP-M) and 1/T for all four seasons (R2 = 0.20–0.48, p < 0.01), which agreed well with the isotherm model for gas–particle partitioning [15]. The regression slope (m) has been served as a tracer to judge whether gas–particle partitioning reached an equilibrium status [14,15]. The slope m showed a large variation with its highest distribution in spring (−1105.6) and its lowest distribution in winter (−4081.7), which may suggest an equilibrium status has not been reached in different seasons. The intercept (b) values varied from 5.29 to 15.5, which were comparable with previous studies (average of 5–13.5) [2,6,12,13,24]. Previous researches speculated that the regression slope m and intercept b values were associated with the mechanism of RM gas–particle partitioning interaction between RGM and PBM [13,14]. This phenomenon may be partly caused by the dramatic variations in local ambient temperature (daily mean of 271–309 K) during the sampling period, since temperature could influence the adsorption/absorption–desorption balance on the aerosols. In addition, different particle diameter size also plays an important role in RM gas–particle partitioning, the particulate fraction φ exhibited increasing pattern trends as particle diameter increased in the range of 0.01–1.00 µm [17]. More detailed discussion on the influence of photochemical reactions on RM gas–particle partitioning was shown in Section 3.3.2. Numerous fresh sea spray aerosols containing low oxidized mercury would generate and be transferred to the atmosphere, which would then rapidly absorb volatile oxidized RGM resulting in increased KP values in winter in this marine coastal area.
The field measurement-based logKP-M and empirical regression model based partition coefficient (logKP-R) were applied to comprehensively study the gas–particle partitioning behaviors of RM among different temperature domains (Figure 3). Obviously, the partition coefficient logKP values steadily declined with the increasing temperature. The logKP-R approaches logKP-M values at temperatures of 278–298 K, with differences of 17–24%, indicating the empirical regression model showed good performance in prediction logKP. In particular, the model predicted logKP-R values showed excellent consistence for gas–particle partition processes at the temperature domains of less than 278 K.

3.3. Factors Affecting Mercury Gas–Particle Partitioning

3.3.1. Influences from Temperature and PM2.5

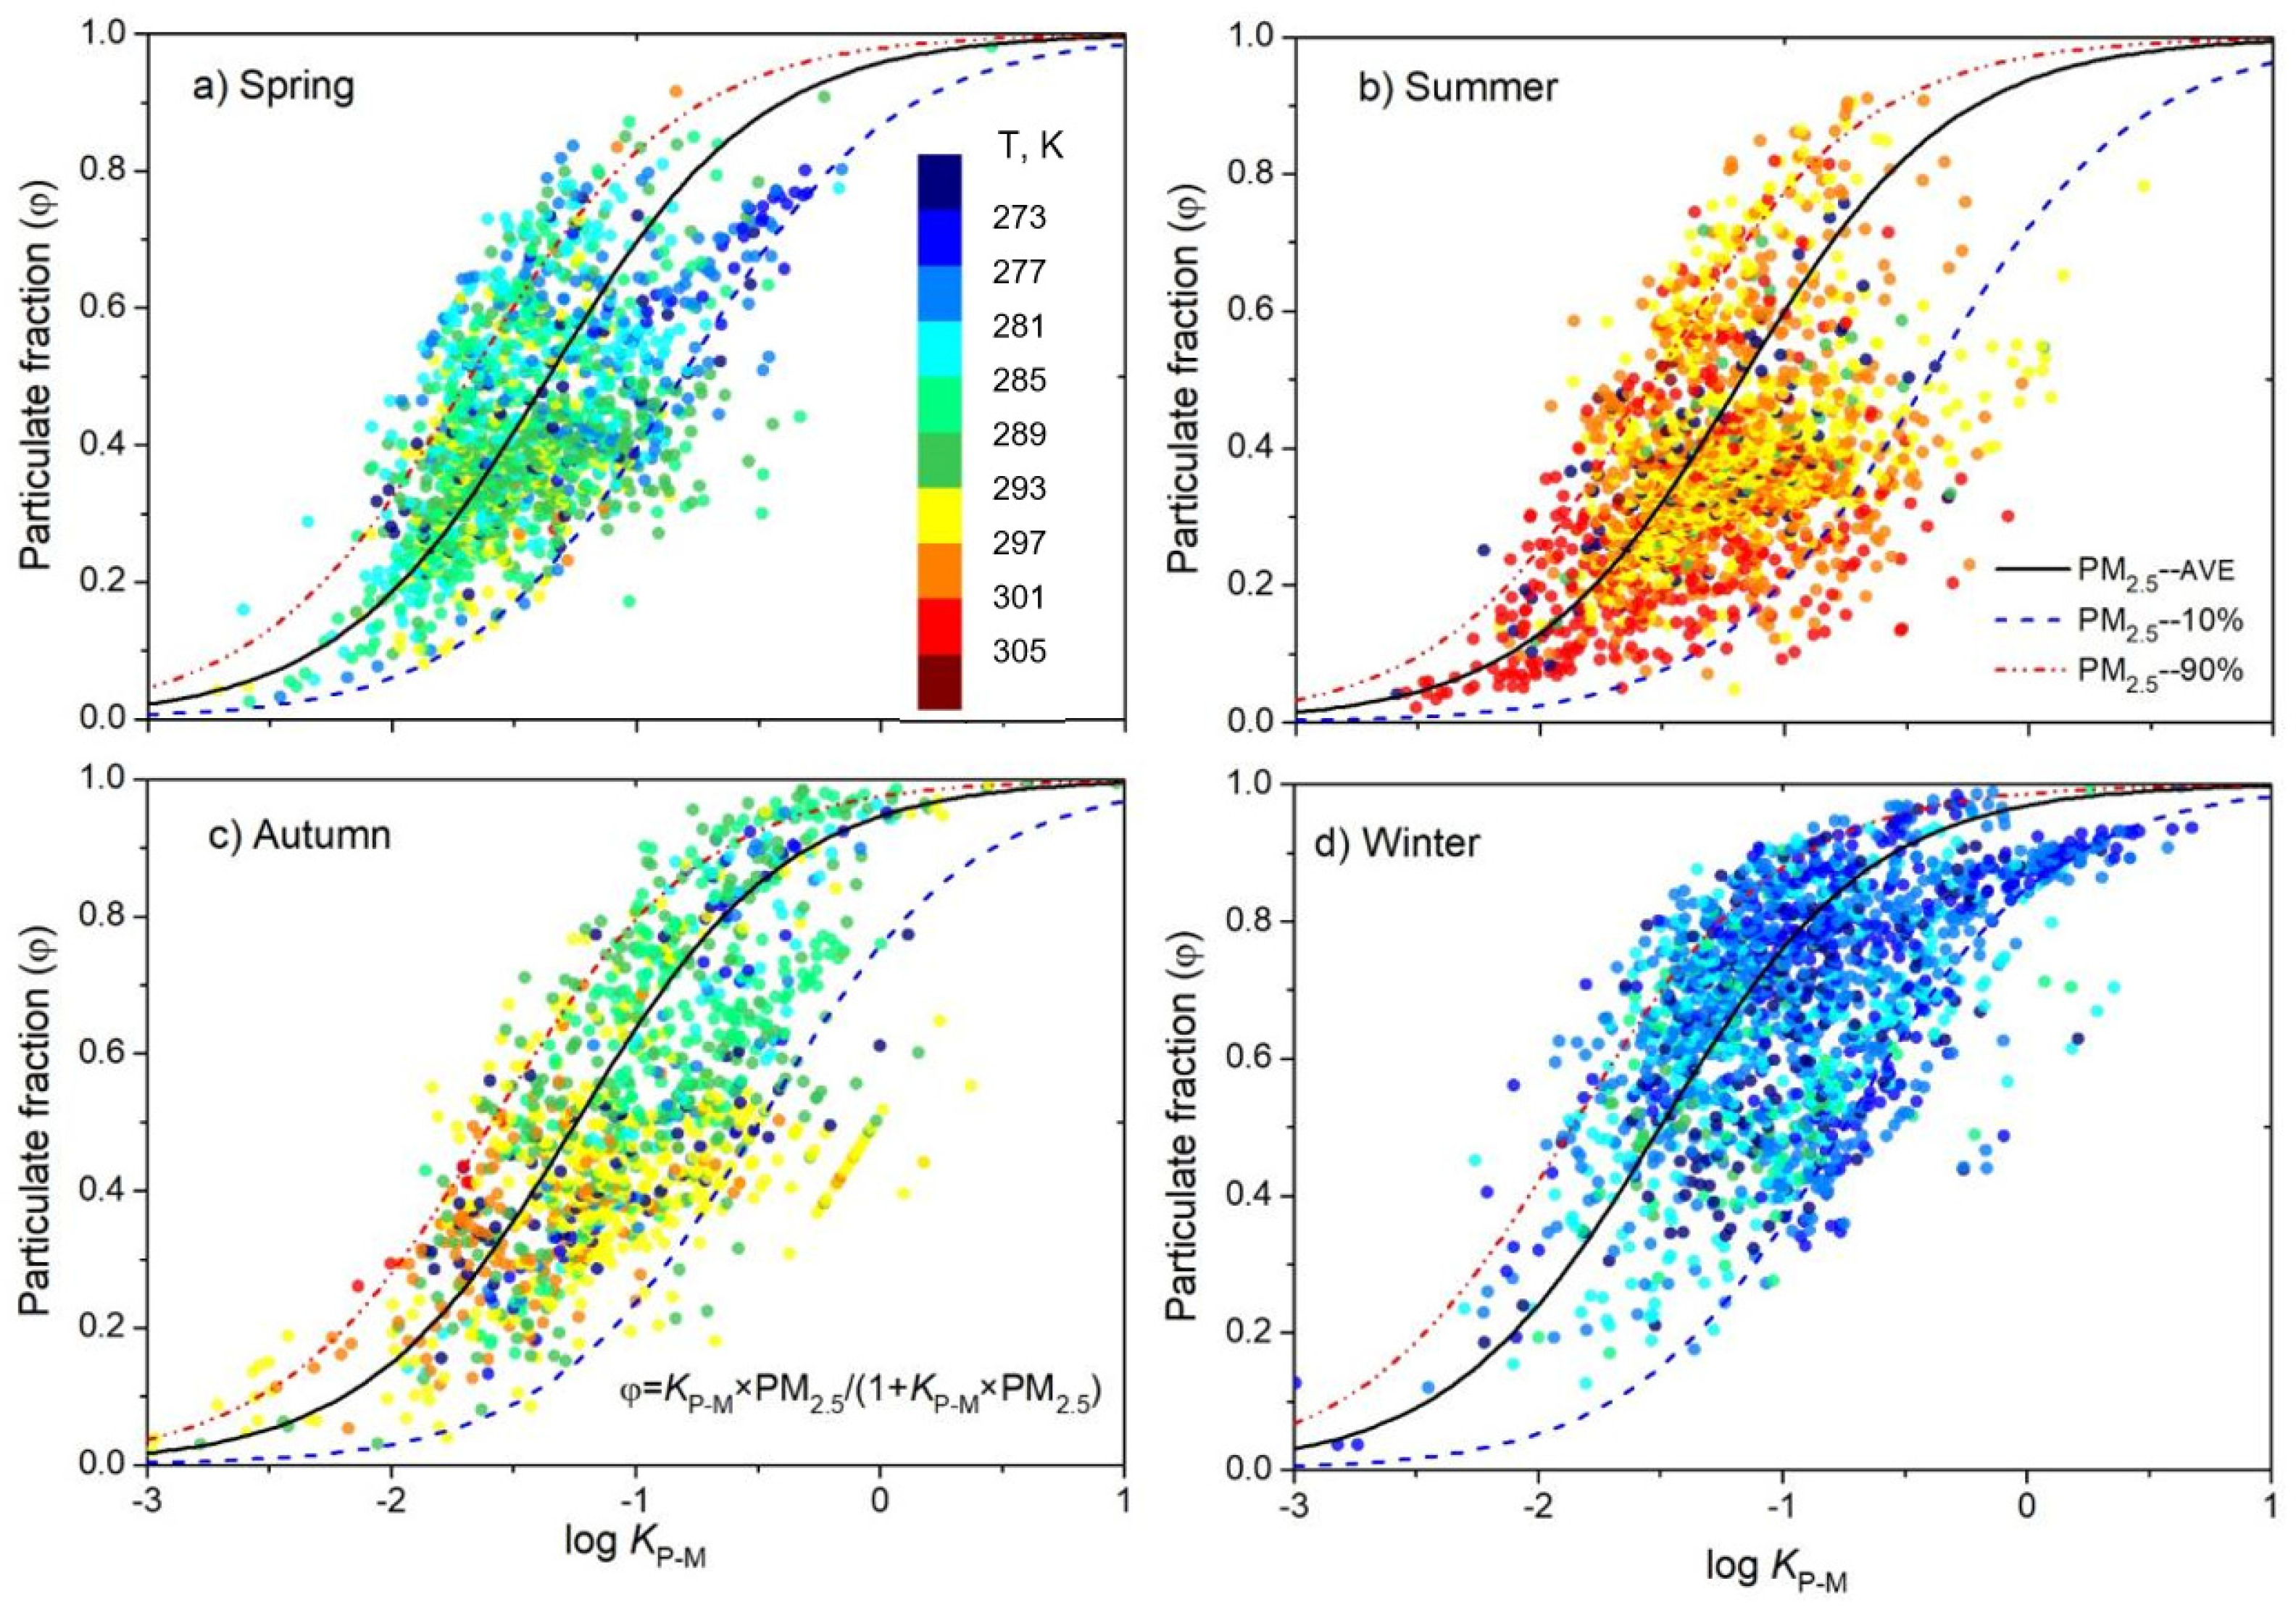
The φ values increased along with the ascending logKP-M values, showing minor fluctuations (~0.2) among logKP-M ranges of −3 to −2 and 0 to 1, but displayed large variability (0.2–0.8) for logKP-M of −2 to 0 (Figure 4). At both the extreme rims of logKP-M, namely logKP-M values <−3 or >1, the RM trended to be exclusive in the gaseous phase (φ = 0) and the particulate phase (φ = 1), respectively. Note that the φ values can fluctuate dramatically even at the same logKP-M value in the medial region. It is well known that the gas–particle partitioning process varies strongly in their relationship to ambient temperature. As expected, it is clearly to see that RM trend to partition to/onto the particulate aerosols at low- temperature domains (<281 K, dark blue to blue color), which was characterized with high φ values (φ > 0.8). By contrast, the RM in the warm period (>301 K, red to dark red color) was more prevalent in the gaseous phase (φ < 0.25) than the general trend across all other measured mercury. The particulate fraction φ showed the highest mean values in winter (0.66 ± 0.19), followed by in spring (0.42 ± 0.17) and autumn (0.42 ± 0.28), while the lowest occurred in summer (0.37 ± 0.16). In addition, the φ values acted as a function of PM2.5 concentrations, and the higher the PM2.5 concentrations, the higher the φ values. The majority of samples dispersed across of the variation ranges of the 10% and 90% percentiles of the PM2.5 concentrations, suggesting aerosol is an important factor in partitioning RM to the particulate phase.

3.3.2. Influences from Relative Humidity and Photochemical Reactions

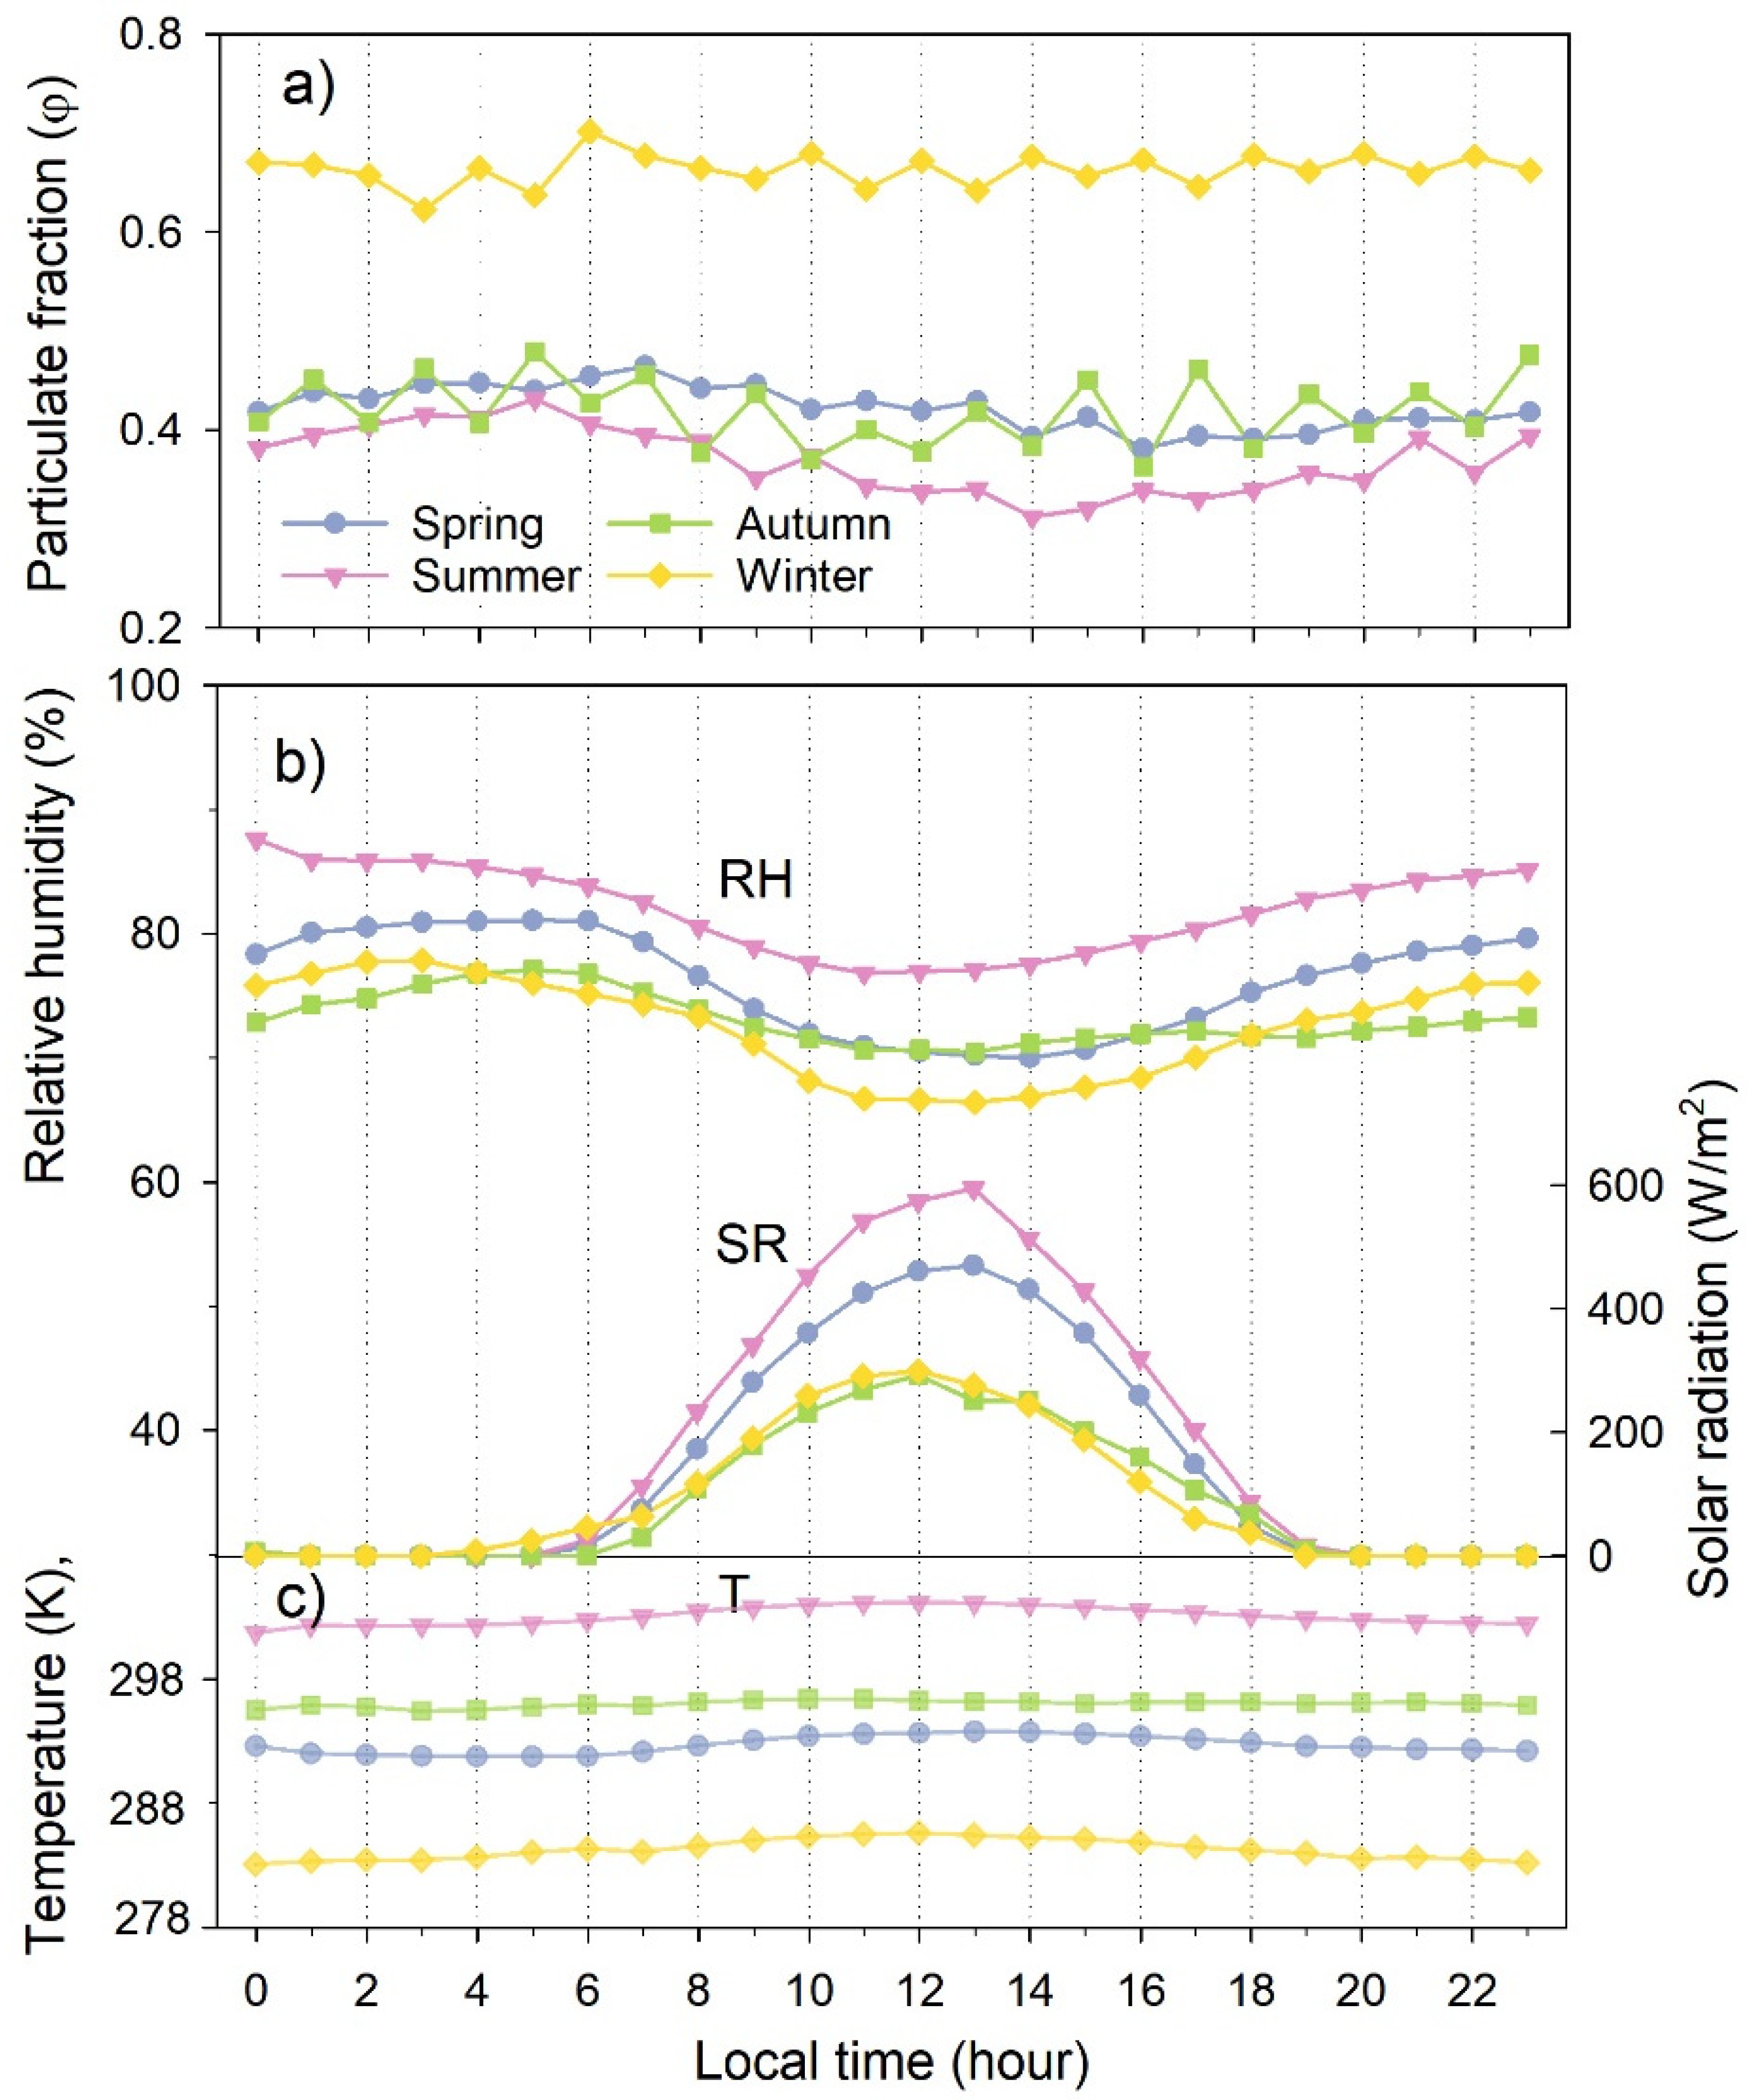
As depicted in Figure 5, the particulate fraction φ values exhibited an apparent variation trend in summer with the peak (0.43) and valley (0.31) values occurring between 4:00–6:00 and 13:00–16:00, respectively. However, the φ values in other seasons display small variations (~0.06). Considering that the entire inter–annual mean diurnal temperature was kept rather stable with variation of ~2 K, some other factors should work for the apparent diurnal variations in φ values in summer. Significantly positive relationships between hourly mean φ and relative humidity was found in spring (R2 = 0.489, p < 0.05), summer (R2 = 0.739, p < 0.01) and autumn (R2 = 0.436, p < 0.05), but no correlation in winter. These results were in accordance with a previous study showing that logKP and relative humidity were positively correlated in summer and autumn (R = 0.33–0.61, p < 0.01) but negatively correlated in winter (R = −0.32, p < 0.01) [24]. Chongming Island coastal observation site is characterized with high relative humidity; inorganic chemical species (e.g., NaCl and NaBr) in marine aerosol have a strong ability to adsorbing water and would lead to aerosols grammatic growth, especially in summer (hourly relative humidity > 80%). Thus, the decreasing relative humidity may promote PBM partitioning to RGM, which partly explains the valley φ values in noon and afternoon in summer.
Moreover, the water uptake into aerosols in high relative humidity conditions may considerably influence aerosol hygroscopicity, forming aqueous phase aerosols [9]. Recent research revealed that the photoreduction of PBM was promoted by water-soluble organic carbon in aerosols with high relative humidity, as demonstrated by positive mercury isotope Δ199Hg values [9,28]. The strongest solar radiation in summer is of benefits to PBM photochemical reduction reactions in aqueous aerosols, promoting RM gas–particle partitioning. In contrast, GEM could be oxidized to RGM in situ by atmospheric oxidants of OH∙ and Br∙ radicals, in which O3 may serve as the principal oxidant for Hg+ transform to Hg2+ [4,8]. In addition, it was widely acknowledged that atmospheric Br∙ radical dominated drive GEM oxidation formed RGM at marine coastal areas. As a result, the enhanced RGM concentrations were expected to promote RGM partitioning to PBM. This deduction was confirmed by the decreased particulate fraction φ values during RGM generation peak period, as well as the diurnal GEM depletion and RGM formation variations. Thus, these results corroborate that photochemical reactions display an important role in the gas–particle partitioning of RM.

3.4. Limitation and Environmental Implication

We evaluated the gas–particle partitioning behaviors of RM using measured and empirical regression models; the negative correlations between log(1/KP-M) and 1/T confirmed that the Langmuir isotherm model applies for gas–particle partitioning of RGM and PBM. The particulate fraction φ of RM acted as a function of logKP-M values and PM2.5 concentrations. Additionally, relative humidity and photochemical reactions played important roles on partitioning processes between RGM and PBM. However, constructing an accurate estimation of RGM and PBM gas–particle partitioning is challenging for the uncertainty in the measurement of RGM abundances on KCl-coated denuder. For instance, Tang et al. (2022) reported an unprecedented elevated RGM (454 ± 349 pg/m3) via a Cation Exchange Membrane-Coupled Speciated Atmospheric Mercury Monitoring System, which was ~23 times higher than observation via a KCl-coated denuder (20 ± 22 pg/m3) [16]. With the O3 and relative humidity interferences for KCl-coated denuders not being well understood [29], the observed RGM concentrations varied with orders that would lead to different gas–particle partitioning status.
Considering RGM has a negligibly small resistance surface and very high dry deposition velocity (0.4–7.6 cm/s, mean of 0.93 cm/s), which was nearly nine times’ higher than PBM [2]. The highest temperature in summer is of benefit promoting PBM partitioning to RGM, which would enhance the dry deposition of RM for the case that RGM is more susceptible to dry deposition than PBM. In addition, the highest amount of rain precipitation in summer (~40% of the total annual amount) is expected to promote atmospheric deposition of PBM due to its strong scavenging capacity as the wet deposition flux of mercury was basically positively related to the annual precipitation [30]. As a consequence, the gas–particle partitioning of RM may enhance the wet deposition and dry deposition of atmospheric oxidized mercury in hot summer. In future, an improved understanding of photochemical reactions (GEM→RGM, and PBM→GEM), with the help of stable mercury isotope mass independent fraction, is urgently needed to evaluate their influences on gas–particle partitioning between RGM and PBM.

4. Conclusions

This study presents a three-year-period measurement of GEM, RGM and PBM in Chongming Island in the east of China, which provides an excellent opportunity to investigate their temporal variations and systemically evaluate the gas–particle partitioning behaviors of RGM and PBM. Results showed that GEM concentration (mean of 2.12 ± 0.94 ng/m3) was a bit lower than other results conducted in urban or suburban areas in China, while RGM (14.75 ± 9.94 pg/m3) and PBM (21.81 ± 30.46 pg/m3) were several folds to several orders lower. The relationship between partitioning coefficient KP and temperature were calculated as log(1/KP-M) = −(2692.20 ± 1275.52)/T + (10.57 ± 4.36), implying a Langmuir surface adsorption isotherm pattern. Except for temperature, the relative humidity and photochemical oxidation/reduction reactions were found to strongly impacting gas–particle partitioning of RM. The present study will benefit from the understanding of oxidized mercury fate and influencing factors in the complex atmospheric pollutants.

Author Contributions

D.H. and Q.W. designed the study and conceived the idea for this article. D.H. conducted the experiments and data analysis and wrote the manuscript. Q.W. supervised the study, helped conduct data analysis, and wrote and edited the manuscript. S.W. helped conceive the idea for this article and edited the manuscript. M.W. and Y.T. helped to collect samples and conduct data analysis. All authors have read and agreed to the published version of the manuscript.

Funding

The authors are grateful for the financial support of the Youth Program of National Natural Science Foundation of China (No. 42007190), the National Postdoctoral Innovative Talent Program (No. BX20190169), the China Postdoctoral Science Foundation Funded Project (No. 2019M660672), and the Tsinghua University “Shuimu Scholar” project (No. 2019SM061).

Institutional Review Board Statement

Not applicable.

Informed Consent Statement

Not applicable.

Data Availability Statement

Not applicable.

Acknowledgments

We thank Jianbo Shi for his fruitful discussions.

Conflicts of Interest

The authors declare no conflict of interest.

References

  1. Lyman, S.N.; Cheng, I.; Gratz, L.E.; Weiss-Penzias, P.; Zhang, L. An updated review of atmospheric mercury. Sci. Total Environ. 2020, 707, 135575. [Google Scholar] [PubMed]
  2. Amos, H.; Jacob, D.; Holmes, C.; Fisher, J.; Wang, Q.; Yantosca, R.; Corbitt, E.; Galarneau, E.; Rutter, A.; Gustin, M.; et al. Gas–particle partitioning of atmospheric Hg(II) and its effect on global mercury deposition. Atmos. Chem. Phys. 2012, 12, 591–603. [Google Scholar] [CrossRef] [Green Version]
  3. Tacey, S.A.; Xu, L.; Szilvasi, T.; Schauer, J.J.; Mavrikakis, M. Quantum chemical calculations to determine partitioning coefficients for HgCl2 on iron-oxide aerosols. Sci. Total Environ. 2018, 636, 580–587. [Google Scholar] [CrossRef] [PubMed]
  4. Shah, V.; Jacob, D.J.; Thackray, C.P.; Wang, X.; Sunderland, E.M.; Dibble, T.S.; Saiz-Lopez, A.; Černušák, I.; Kellö, V.; Castro, P.J.; et al. Improved Mechanistic Model of the Atmospheric Redox Chemistry of Mercury. Environ. Sci. Technol. 2021, 55, 14445–14456. [Google Scholar] [CrossRef] [PubMed]
  5. Qin, X.; Wang, X.; Shi, Y.; Yu, G.; Zhao, N.; Lin, Y.; Fu, Q.; Wang, D.; Xie, Z.; Deng, C.; et al. Characteristics of atmospheric mercury in a suburban area of east China: Sources, formation mechanisms, and regional transport. Atmos. Chem. Phys. 2019, 19, 5923–5940. [Google Scholar] [CrossRef] [Green Version]
  6. Cheng, I.; Zhang, L.; Blanchard, P. Regression modeling of gas-particle partition of oxidized mercury from temperature data. J. Geophys. Res. Atmos. 2014, 119, 11864–11876. [Google Scholar] [CrossRef]
  7. Deng, C.; Tong, Y.; Chen, L.; Yuan, W.; Sun, Y.; Li, J.; Wang, X.; Zhang, W.; Lin, H.; Xie, H.; et al. Impact of particle chemical composition and water content on the photolytic reduction of particle-bound mercury. Atmos. Environ. 2019, 95, 355–362. [Google Scholar] [CrossRef]
  8. Han, D.; Fu, Q.; Gao, S.; Hu, Z.; Zhang, X.; Chen, X.; Feng, J.; Cheng, J.; Wang, W. Two-year monitoring of gaseous elementary mercury in a typical iron-steel plant in Yangtze River Delta, China: Characterization and estimation of its dynamic oxidation. Sci. Total Environ. 2019, 657, 1217–1226. [Google Scholar] [CrossRef]
  9. Zhang, K.; Zheng, W.; Sun, R.; He, S.; Shuai, W.; Fan, X.; Yuan, S.; Fu, P.; Deng, J.; Li, X.; et al. Stable Isotopes Reveal Photoreduction of Particle-Bound Mercury Driven by Water-Soluble Organic Carbon during Severe Haze. Environ. Sci. Technol. 2022, 56, 10619–10628. [Google Scholar] [CrossRef]
  10. Zhang, L.; Wang, L.; Wang, S.; Dou, H.; Li, J.; Li, S.; Hao, J. Characteristics and Sources of Speciated Atmospheric Mercury at a Coastal Site. Aerosol Air Qual. Res. 2017, 17, 2913–2923. [Google Scholar] [CrossRef]
  11. Tang, Y.; Wang, S.; Wu, Q.; Liu, K.; Wang, L.; Li, S.; Gao, W.; Zhang, L.; Zheng, H.; Li, Z.; et al. Recent decrease trend of atmospheric mercury concentrations in East China: The influence of anthropogenic emissions. Atmos. Chem. Phys. 2018, 18, 8279–8291. [Google Scholar] [CrossRef] [Green Version]
  12. Rutter, A.P.; Schauer, J.J. The effect of temperature on the gas–particle partitioning of reactive mercury in atmospheric aerosols. Atmos. Environ. 2007, 41, 8647–8657. [Google Scholar] [CrossRef]
  13. Rutter, A.P.; Schauer, J.J. The Impact of Aerosol Composition on the Particle to Gas Partitioning of Reactive Mercury. Environ. Sci. Technol. 2007, 41, 3934–3939. [Google Scholar] [CrossRef] [PubMed]
  14. Ma, W.L.; Sun, D.Z.; Shen, W.G.; Yang, M.; Qi, H.; Liu, L.Y.; Shen, J.M.; Li, Y.F. Atmospheric concentrations, sources and gas–particle partitioning of PAHs in Beijing after the 29th Olympic Games. Environ. Pollut. 2011, 159, 1794–1801. [Google Scholar] [CrossRef]
  15. Xie, M.; Michael, P.H.; Barsanti, K.C. Gas particle partitioning of n-alkanes, PAHs and oxygenated PAHs in urban Denver. Atmos. Environ. 2014, 95, 355–362. [Google Scholar] [CrossRef]
  16. Tang, Y.; Wang, S.; Li, G.; Han, D.; Liu, K.; Li, Z.; Wu, Q. Elevated Gaseous Oxidized Mercury Revealed by a Newly Developed Speciated Atmospheric Mercury Monitoring System. Environ. Sci. Technol. 2022, 56, 7707–7715. [Google Scholar] [CrossRef]
  17. Han, D.; Zhang, J.; Hu, Z.; Ma, Y.; Duan, Y.; Han, Y.; Chen, X.; Zhou, Y.; Cheng, J.; Wang, W. Particulate mercury in ambient air in Shanghai, China: Size-specific distribution, gas–particle partitioning, and association with carbonaceous composition. Environ. Pollut. 2018, 238, 543–553. [Google Scholar] [CrossRef]
  18. Lin, H.; Tong, Y.; Yin, X.; Zhang, Q.; Zhang, H.; Zhang, H.; Chen, L.; Kang, S.; Zhang, W.; Schauer, J.J.; et al. First measurement of atmospheric mercury species in Qomolangma, Tibetan Plateau, and evidence of transboundary pollutant invasion. Atmos. Chem. Phys. 2019, 19, 1373–1391. [Google Scholar] [CrossRef] [Green Version]
  19. Yin, X.; Kang, S.; Foy, B.D.; Ma, Y.; Tong, Y.; Zhang, W.; Wang, X.; Zhang, G.; Zhang, Q. Multi-year monitoring of atmospheric total gaseous mercury at a remote high-altitude site (Nam Co, 4730m a.s.l.) in the inland Tibetan Plateau region. Atmos. Chem. Phys. 2018, 18, 10557–10574. [Google Scholar] [CrossRef] [Green Version]
  20. Fu, X.; Feng, X.; Liang, P.; Deliger; Zhang, H.; Ji, J.; Liu, P. Temporal trend and sources of speciated atmospheric mercury at Waliguan GAW station, Northwestern China. Atmos. Chem. Phys. 2012, 12, 1951–1964. [Google Scholar] [CrossRef]
  21. Brooksa, S.; Lindbergb, S.; Southworthc, G.; Arimoto, R. Springtime atmospheric mercury speciation in the McMurdo, Antarctica coastal region. Atmos. Environ. 2008, 42, 2885–2893. [Google Scholar] [CrossRef]
  22. Fu, X.; Feng, X.; Qiu, G.; Shang, L.; Zhang, H. Speciated atmospheric mercury and its potential source in Guiyang, China. Atmos. Environ. 2011, 45, 4205–4212. [Google Scholar] [CrossRef]
  23. Xu, L.; Chen, J.; Yang, L.; Niu, Z.; Tong, L.; Yin, L.; Chen, Y. Characteristics and sources of atmosphe...ation in a coastal city, Xiamen, China. Chmosphere 2015, 119, 530–539. [Google Scholar] [CrossRef] [PubMed]
  24. Zhang, H.; Wang, Z.; Wang, C.; Zhang, X. Concentrations and gas–particle Concentrations and gas–particle partitioning of atmospheric reactive mercury at an urban site in Beijing, China. Environ. Pollut. 2019, 249, 13–23. [Google Scholar] [CrossRef] [PubMed]
  25. Sheu, G.-R.; Nguyen, L.S.P.; Truong, M.T.; Lin, D.-W. Characteristics of atmospheric mercury at a suburban site in northern Taiwan and influence of trans-boundary haze events. Atmos. Environ. 2019, 214, 116872. [Google Scholar] [CrossRef]
  26. Lee, G.-S.; Kim, P.-R.; Han, Y.-J.; Holsen, T.M.; Seo, Y.-S.; Yi, S.-M. Atmospheric speciated mercury concentrations on an island between China and Korea: Sources and transport pathways. Atmos. Chem. Phys. 2016, 16, 4119–4133. [Google Scholar] [CrossRef] [Green Version]
  27. Ren, X.; Luke, W.T.; Kelley, P.; Cohen, M.D.; Artz, R.; Olson, M.L.; Schmeltz, D.; Puchalski, M.; Goldberg, D.L.; Ring, A.; et al. Atmospheric mercury measurements at a suburban site in the Mid-Atlantic United States_Inter-annual, seasonal and diurnal variations and source-receptor relationships. Atmos. Environ. 2016, 146, 141–152. [Google Scholar] [CrossRef] [Green Version]
  28. Song, Z.; Sun, R.; Zhang, Y. Modeling mercury isotopic fractionation in the atmosphere. Environ. Pollut. 2022, 307, 119588. [Google Scholar] [CrossRef]
  29. Gustin, M.; Amos, H.; Huang, J.; Miller, M.; Heidecorn, K. Measuring and modeling mercury in the atmosphere: A critical review. Atmos. Chem. Phys. 2015, 15, 5697–5713. [Google Scholar] [CrossRef] [Green Version]
  30. Zhang, L.; Zhou, P.; Cao, S.; Zhao, Y. Global deposition of speciated atmospheric mercury to terrestrial surfaces: An overview. Atmos. Chem. Phys. 2019, 19, 15587–15608. [Google Scholar] [CrossRef]
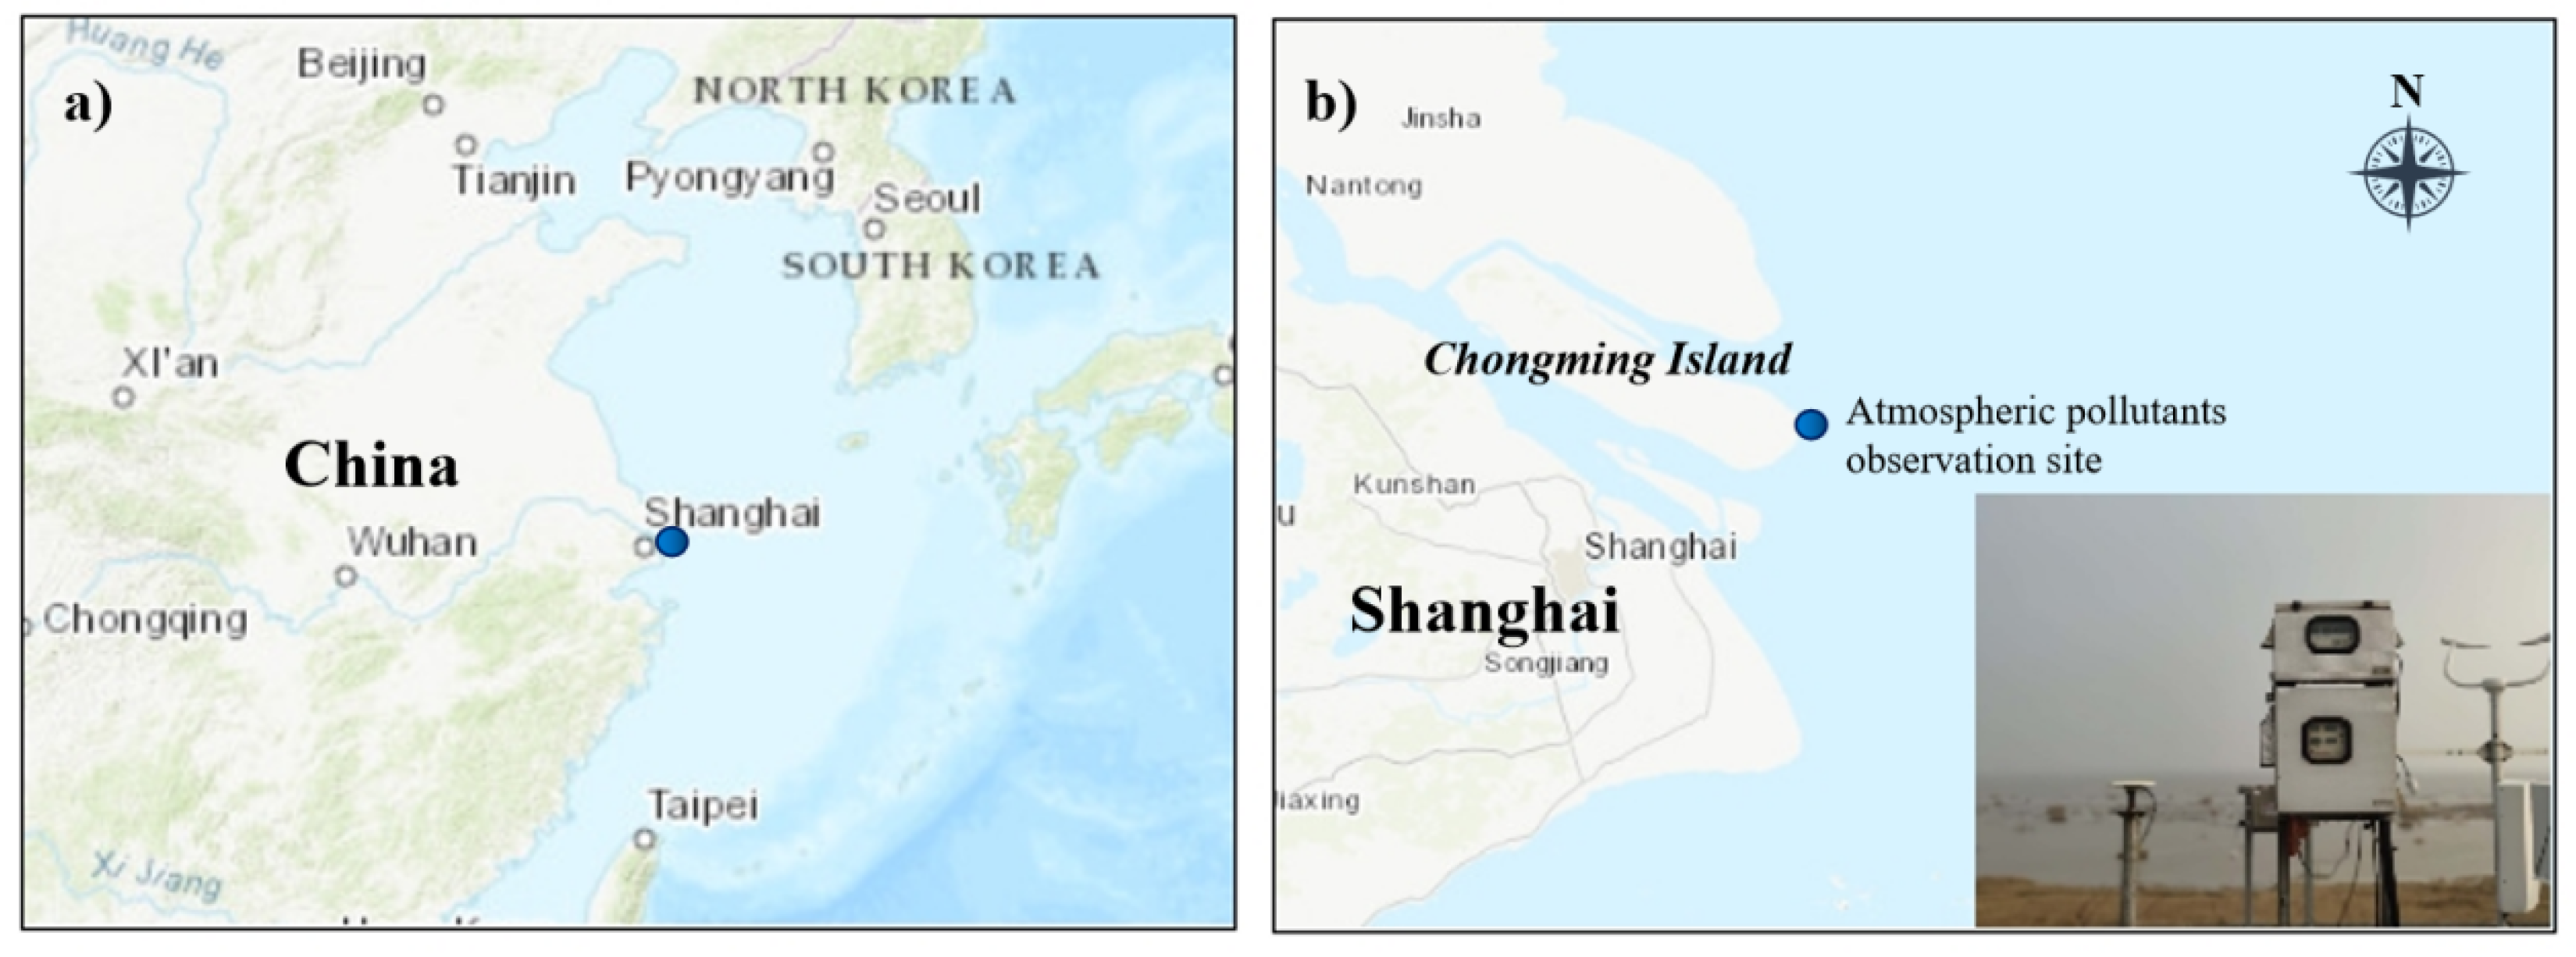
Figure 1. Monitoring site of atmospheric mercury at Chongming Island (a), Shanghai (b).
Atmosphere 13 02014 g001
Figure 2. The relationship of measured logKP-M with 1/T in different seasons.
Atmosphere 13 02014 g002
Figure 3. Comparison of the logKP values obtained from field measurement, empirical regression model prediction.
Atmosphere 13 02014 g003
Figure 4. Seasonal relationship between φ and logKP-M under different temperature and PM2.5 concentrations.
Atmosphere 13 02014 g004
Figure 5. The diurnal variations in φ, temperature, relative humidity and solar radiation.
Atmosphere 13 02014 g005
Table 1. Concentrations of GEM (ng/m3), RGM (pg/m3) and PBM (pg/m3) at Chongming Island, Shanghai and other sites.
Observation SiteTypeSampling TimeGEMRGMPBMReference
Shanghai, ChinaBackgroundMarch 2014–February 2017 2.12 ± 0.9414.75 ± 9.9421.81 ± 30.46This study
Spring2.16 ± 1.0421.31 ± 10.0015.08 ± 13.54
Summer2.46 ± 1.1316.34 ± 8.3111.45 ± 13.25
Autumn1.86 ± 0.6914.57 ± 11.4622.26 ± 29.87
Winter2.06 ± 0.9613.23 ± 9.3142.60 ± 43.22
Shanghai, ChinaBackground2009–20122.65 ± 1.73 8.0 ± 8.821.5 ± 25.4[10]
Shanghai, China BackgroundJanuary 2015–May 20162.77 ± 1.3682.1 ± 115.460.8 ± 67.4[5]
Shanghai, ChinaUrbanMarch 2017–May 2017//292 ± 121[17]
Beijing, ChinaUrban2015–20164.70 ± 3.5318.47 ± 22.2785.18 ± 95.34[24]
Beijing, ChinaUrbanSeptember 20213.02 ± 1.09 454 ± 34946 ± 54[16]
Guiyang, ChinaUrbanAugust 2009–October 20099.72 ± 10.235.7 ± 43.9368 ± 676[22]
Xiamen, ChinaSuburbanMarch 2012–February 20133.5061.05174.41[23]
Qomolangma, ChinaRemoteApril 2016–September 20161.42 ± 0.3721.4 ± 13.425.6 ± 19.1[18]
Nam Co, ChinaRemoteNovember 2014–February 20151.33 ± 0.240.85 ± 2.9148.69 ± 60.28[19]
Waliguan, ChinaRemoteSeptember 2007–September 20081.98 ± 0.987.4 ± 4.819.4 ± 18.1[20]
Taoyuan, Taiwan, ChinaSuburbanOctober 2017–September 20182.61 ± 6.4712.1 ± 34.318.7 ± 86.8[25]
Gyodong, South KoreaBackgroundAugust 2015–September 20172.5 ± 1.55.0 ± 6.224.0 ± 28.1[26]
Beltsville, AmericaSuburban2007–20151.41 ± 0.234.6 ± 33.78.6 ± 56.8[27]
Ross Island, AntarcticaRemoteOctober 2003–December 20031.2 ± 1.08116 ± 4549 ± 36[21]
Publisher’s Note: MDPI stays neutral with regard to jurisdictional claims in published maps and institutional affiliations.