Abstract
The Crop Water Stress Index (CWSI) is a useful tool for evaluating irrigation scheduling and achieving water conservation and crop yield goals. This study examined the CWSI under different water stress conditions for the scheduling of wheat crop irrigation and developed indices using the leaf canopy temperature in Faisalabad, Pakistan. The experiments were conducted using a randomized, complete block design and four irrigation treatments with deficit levels of D0%, D20%, and D40% from the field capacity (FC) and D100% (100% deficit level). The CWSI was determined at pre-heading and post-heading stages through the lower baseline (fully watered crop) and upper limit (maximum stress). These baselines were computed using the air temperature and canopy temperature of plant leaves and the vapor pressure deficit (VPD). The CWSI for each irrigation treatment was calculated and the average seasonal CWSI value for the whole season was used to develop the empirical relationships for scheduling irrigation. The relationships between the air canopy temperatures and the VPD resulted in slope (x) = −0.735 and interception (c) = −0.8731 as well as x = −0.5143 and c = −1.273 at the pre- and post-heading stages, respectively. The values of the CWSI for the treatment at deficit levels of D0%, D20%, D40%, and D100% were found to be 0.08, 0.61, 0.20, and 0.64, respectively. The CWSI values developed in this study can be effectively used to promote better the monitoring of irrigated wheat crops in the region.
1. Introduction
Wheat is an essential cereal crop that provides almost 20% of the calories consumed by the world population [1]. The cultivation area of wheat crops is 220 million hectares, which is 32% of the global cultivated cereal area [2]. Wheat is the staple food of 2 billion people around the globe, and it is severely affected by heat stress and drought conditions worldwide [3]. One-third of the cultivated area of wheat is vulnerable to water-related stress. Approximately 25% of the global wheat crop area belongs to developed nations, while 33% of this area lies in developing nations. Studies have shown that an almost 50% increment in wheat crop production is needed until 2050 to meet the global requirements [4,5]. Wheat is the main crop of Pakistan; it is cultivated in the winter season and needs 325 to 450 mm of water throughout the growing season. The sowing of wheat crops spans from November to December, and they are harvested from April to May in the Punjab province of Pakistan. Due to high temperatures, wheat crops need five to six flood irrigations at different growth stages [6]. Tillering, flowering, and grain filling constitute the growth stages, which are very sensitive to water stress. Water deficiency and the improper scheduling of irrigation are the factors that can have adverse effects on crop growth during these stages, which eventually reduce the crop yield [7]. Therefore, it is important to optimize the limited water supplies with the main objective of applying a certain amount of water at the right time with the least possible amount of water loss. A number of methods have been adopted for the efficient use of irrigation. Among these methods, deficit irrigation is recognized as a useful technique for arid and semiarid environments, in which irrigation is applied during sensitive growth stages of a given crop [8]. Regulated deficit irrigation is a method wherein irrigation is applied below the 100% crop water requirement to achieve a certain yield goal while purposefully facilitating limited water stress on a crop at specific growth stages. The idea is to control the vegetative growth of the plants and improve water use efficiency [9]. Therefore, this method necessitates the precise application of water to the crop. Various studies have shown that deficit irrigation applied to wheat crops produces greater yields compared to other irrigation techniques [10,11]. However, the results are variable under different climatic conditions. Moreover, crop water productivity changes with varying climatic conditions because climatic factors directly affect crop management practices [12].
Among various climatic factors, temperature plays a pivotal role in determining the growth stages of crops including germination, vegetation, and maturity. The stress due to the temperature can reduce the size of organs (i.e., leaves, tillers, and spikes) and can inhibit development during growth stages (tillering, jointing, booting, heading, anthesis, and grain filling) [13]. Due to climate change-induced heat stress, worldwide wheat production is expected to fall 6% with the 1 °C. increase in the global temperature. In the case of Pakistan, it has been reported that a temperature increase of 2 °C may reduce the wheat yield up to 15.2% in semiarid environments by 2069 [14].
There are several indices that incorporate temperature for quantifying the level of stress on crops. Among those indices, the crop water stress index (CWSI) is a useful tool for irrigation scheduling and crop yield prediction. It was established as a standardized index for quantifying the factors affecting stress on plants [15]. The CWSI can be computed by using three approaches: empirical, energy balance, and an approach based on the natural wet and dry conditions of the soil surface. The energy balance approach is mainly based on the estimation of net radiation and aerodynamic resistance factors [16], while the empirical approach is based on the difference between the plant canopy and air temperature (Tc − Ta) and the atmospheric vapor pressure deficit (AVPD) of a “non-water stressed baseline” (NWSB), which refers to the potential transpiration rate of a well-watered crop [17].
The CWSI algorithm is based on the normalization of the difference between the air temperature (Ta) and canopy temperature (Tc) of a plant in relation to the evaporative demand by means of the air vapor pressure deficit (VPD). The Tc–Ta relationship under the two boundary conditions is considered for the normalization associated with the VPD. First, the lower limit is a well-watered condition at which a plant transpires at its potential rate; second, the upper limit has a transpiration rate equal to zero. The lower limit is known as the NWSB, which depicts the linear relationship between the Tc–Ta and VPD. The canopy temperature at different boundary conditions is an important factor for the computation of the CWSI. Few methods, which include infrared thermocouples (IT), the use of a thermal scanner (TS), and the use of an infrared thermometer, are available to the research community for the estimation of canopy temperatures. For example, the method of using portable infrared thermometers, which was initially developed and has been widely used by several researchers for estimating plant canopy temperatures and for the calculation of the CWSI [18].
In China, methods of water use in irrigation areas based on water balance conditions have been proposed [19]. In order to study the effect of water deficits on crops such as pepper, wheat, grapes, cotton, and apples, soybeans were used as experimental objects, and it was found that appropriate water deficits could increase crop yields and that the root system of tomatoes also changed [20,21,22,23,24,25]. Some studies have also found that appropriate water stress on crops can improve soil quality, including soil water retention and water and nitrogen utilization [26,27,28]. Irmak et al. [29] concluded that the CWSI is an effective tool for monitoring and quantifying the water stress of corn with the integration of the canopy temperature estimated using an infrared thermometer under Mediterranean, semi-arid cropping conditions. A study by Da Silva et al. [30] examined the diurnal and seasonal variations of the CWSI of cotton crops using the canopy energy balance in which important parameters such as the canopy temperature, air temperature, net radiation, wind speed, and psychometric measurements were obtained regularly at 10:00 and 14:00 h along with several diurnal cycles. Moreover, the CWSI was calculated by establishing the relationship between the canopy–air temperature difference and the vapor pressure deficit of drip-irrigated beans under a fully irrigated treatment comparing no stress to increased water stress situations [31]. The CWSI calculated by Erdem et al. [32] employed the empirical method for the measurement of the infrared canopy temperature, vapor pressure, and ambient air temperature for five irrigation levels. Gonzalez-Dugo et al. [33] estimated the values of the CWSI for different fruits by considering short-term variations in canopy temperature using infrared thermometers for three seasons (2009 to 2011) in Spain.
Based on the aforementioned studies, the canopy temperature has been reported as a reliable indicator of moisture detection in plants while soil moisture availability in the root zone has significant relationships between different types of canopies, ambient air temperatures (Tc–Ta), and wheat yields. Some researchers have also found the CWSI to be a good prediction parameter for wheat yields and the scheduling of irrigation for wheat. To the best of our knowledge, the crop water stress index with various levels of irrigation applied for crop yields at different growth stages of wheat has not been examined in the study area (Faisalabad, Pakistan). Moreover, the crop water stress index of different irrigation levels with respect to various wheat crop growth stages has received less attention in other parts of world. Therefore, this study focused on using the CWSI together with infrared thermometers to schedule irrigation and predict wheat yield under Faisalabad’s climate conditions. This study’s objectives were to (1) investigate the relationship of the CWSI for different irrigation levels at different growth stages with wheat yield and (2) identify the water use efficiency (WUE) of different irrigation treatments under water-limited conditions.
2. Study Area
This study was conducted during the winter of each year from 2018–2021 at the Post Graduate Agriculture Research Station (PARS), the University of Agriculture Faisalabad (UAF), Pakistan. The area is located around latitude 31°25′ N, longitude 73°09′ E, and at an altitude 184.4 m above sea level in a semiarid subtropical climate with a mean annual rainfall of 350 mm. The location of the study area is shown in Figure 1.
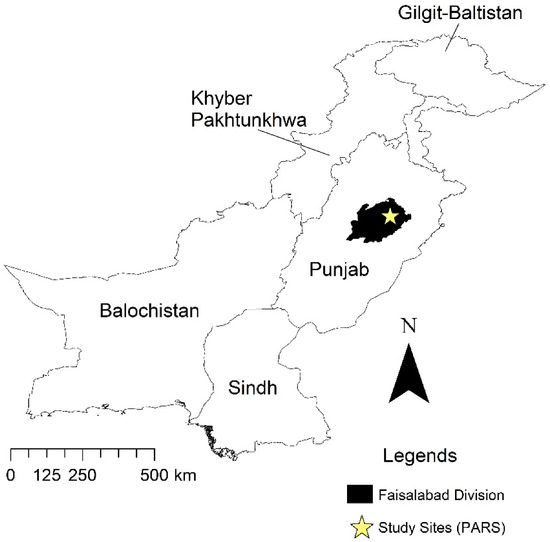
Figure 1.
Location of the study area.
3. Materials and Methods
The soil conditions of experimental area are medium to coarse. Generally, soils are naturally low in organic matter content [34,35,36]. The major crops of this region are wheat (rabi), rice, and cotton (kharif). The wheat variety Galaxy 2013’s seeds were sown by using seed drill. The total experimental area of 192 m2 was divided into three blocks, and each block was further sub-divided into four plots of 3 × 3 m (9 m2) in a randomized, complete block design with four treatments and three replications (Figure 2).
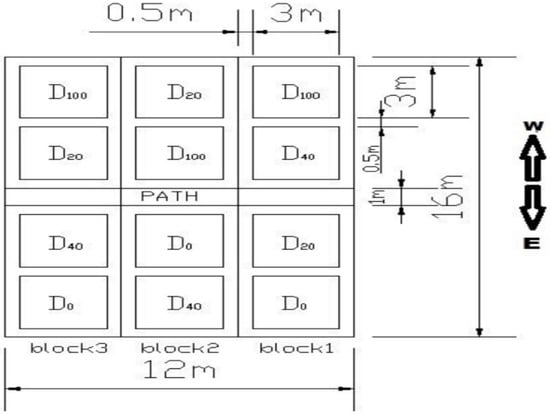
Figure 2.
Experimental field layout.
The wheat-growing season was divided into ten stages, in which almost four growth stages (tillering, stem elongation, dough development, and ripening) were chosen in the experiment during the wheat-growing seasons. The experiment consists of four irrigation treatments at 0% (D0), 20% (D20%), and 40% (D40%) deficits from field capacity and at 100% (D100%) deficit (except rainfall and first irrigation), as shown in Table 1.

Table 1.
Different irrigation treatments at different growth stages for the experiments during three growth seasons from 2018–2021.
3.1. Determination of Water Requirement
Gravimetric soil moisture measurements were used to schedule the application of water while soil moisture content was assessed at 20-day intervals at different effective root zone depths of 0–15 cm, 15–30 cm, and 30–45 cm [37].
The application of irrigation water was estimated by using flow meters while water requirement at specific moisture content was calculated using the equation:
where
n = Number of layers of soil;
= Field capacity based on volume;
= Volumetric Moisture content from ith layer before irrigation;
Rzi = Root zone depth (cm).
Two fertilizer treatments at the time of sowing (Diammonium phosphate) and at first irrigation (Nitrogen) were applied to each experimental plot at the rates of 75 kg ha−1 and 70 kg ha−1, respectively. All other agronomic practices were kept uniform for all the treatments. A portable infrared thermometer was used to measure leaf canopy temperature (Tc), setting it at an angle of 15° with respect to the canopy viewed from the horizontal line. Six canopy temperature readings at mid-day (02:00 P.M.) under clear sky conditions were taken from each plot at different directions (i.e., south-east, north-east, north-west, and south-west) [38]. The six canopy temperature readings were averaged for each plot and used to estimate the difference in canopy and air temperature (Tc–Ta). The moisture content condition of the soil was also determined on the same day and the relationship between estimated soil moisture content and Tc–Ta was developed for the further analysis.
3.2. Vapor Pressure Deficit
The mean vapor pressure deficit (VPD) was computed as the average of the calculated instantaneous VPD using the corresponding instantaneous wet- and dry-bulb temperatures and the standard psychrometer equation using a mean barometric pressure of 101.25 kPA [39].
where
VPD = ea − ed
ea = Saturation vapor pressure;
ed = Dry vapor pressure;
ea = 0.611exp[17.27 T/T +237.3];
where
T = Air temperature °C.
where
ed = ea (Twet − γasp(Tdry − Twet) P
Twet = wet bulb temperature °C;
Tdry = dry bulb temperature;
P = atmospheric pressure [KPa];
γasp = 0.00066 for Assmann aspiration at 5 m/s
= 0.0008 for natural ventilation at 1 m/s
= 0.0012 for indoor ventilation at 0 m/s.
3.3. Crop Water Stress Index
The CWSI was calculated using the method of Idso [17]. In this approach, the calculated crop canopy temperatures were scaled relative to the minimum canopy temperature expected under non-water stress conditions and the maximum temperature under severe water stress. The non-water stressed baseline for the canopy–air difference (Tc–Ta) versus the vapor pressure deficit (VPD) relationship was determined using only the data collected from the 0% deficit irrigation (well-watered treatment). The upper limit (fully stressed) was computed from 100% deficit irrigation treatment according to the procedure explained by [17]. CWSI has been defined by Idso is as follows:
where Tc is the canopy temperature (°C), Ta the air temperature (°C), ll (lower baseline) is the non-water-stressed baseline that was measured from well-watered irrigation treatment (0% deficit treatment), and ul (upper limit) represents the non-transpiring baseline condition that was measured from the zero-water application treatment (100% deficit treatment).
CWSI = [(Tc−Ta) − (Tc−Ta) ll]/[(Tc−Ta) ul− (Tc−Ta) ll]
The baseline is defined to be the relationship between (Tc–Ta) and (VPD) under the conditions of non-limiting soil moisture (when the plant is transpiring at the potential rate) for a particular crop in a region and the baselines for some crops have been determined by [18]. It is important to develop such non-water-stressed baselines for winter wheat crops for both pre-heading and post-heading growth stages. The lower baseline could be different for a crop under different developmental phases as described by different researchers [40]. The climate, soil type, and plant variety might cause differences in the intercept and slope of the baseline.
In this study, the intensive observation of canopy temperature, air temperature, and dry-bulb and wet-bulb temperatures were recorded for wheat crops for pre-heading and post-heading crop growth stages. It was found that the plant canopy was cooler in the morning, with a temperature considerably below the air temperature, and it began to warm with the air temperature up until noon, at which point it attained a peak temperature. In the afternoon, the canopy begins to cool with the air temperature and this relative cooling is then processed as a linear function of the VPD until about 2–3 h before sunset. Similar phenomena were reported by [17]. They postulated that this linear relationship is an expression (for fully moist crops). The linear regression relationship between (Tc–Ta) and VPD is considered as the lower baseline for wheat crops in the region, as given below.
where a1 and a0 are the intercept and slope, respectively, of the linear regression relationship between (Tc–Ta) (°C) lower limit and vapor pressure deficit (Kpa). The upper limit was determined using the data collected from the fully stressed treatment.
(Tc−Ta) ll = a1VPD + ao
The depth of irrigation (mm) was recorded for each treatment and the water use efficiency (WUE), which is defined as units of dry grain matter produced per unit of irrigation water, was also estimated for each of the replicates. The yield of wheat was analyzed statistically using analysis of variance techniques (ANOVA) according to the Randomized Complete Block Design (RCBD) using statistics. The significant means were separated using LSD at 5% level of probability, as shown in Table 2.

Table 2.
Analysis of variance for impact of different irrigation treatment on yield.
4. Results and Discussion
4.1. Soil Texture Analysis with Hydrometer
The results of the soil texture analysis are given in Table 3. According to the United States Department of Agriculture’s (USDA) textural classification, the soil was graded as sandy, clay, and loam. The bulk density and field capacity were measured based on sand, silt, and clay textures using Soil Plant Atmosphere Water (SPAW) software.

Table 3.
Soil texture analysis, bulk density, and field capacity.
4.2. Chemical Analysis of Soil
The chemical analysis of the soil was carried out to determine the pH and Electrical Conductivity (EC) for the soil samples through three replications at depths of 0–90 cm. The soil fertility status, i.e., the of percentage nitrogen, exchangeable potassium, and phosphorus, was also determined from the soil samples, as shown in Table 4.

Table 4.
Chemical Analysis of Soil Samples.
4.3. Relationship between Canopy–Air Temperature Difference and Soil Moisture Content
The relationship developed between the soil moisture content and the canopy–air temperature difference showed that with the decrease in the soil moisture content, the canopy–air temperature difference increases (Figure 3). The coefficient of determination (R2) was determined as 0.87 for this relationship.
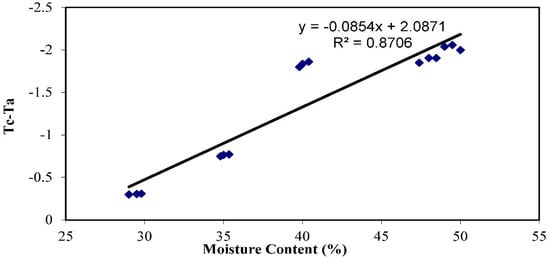
Figure 3.
Relationship between (Tc–Ta) and moisture contents (%).
4.4. Measurement of CWSI
The lower baseline regression equation was developed for the pre-heading and post-heading stages of wheat crops during the season 2018–2021 (Figure 4).
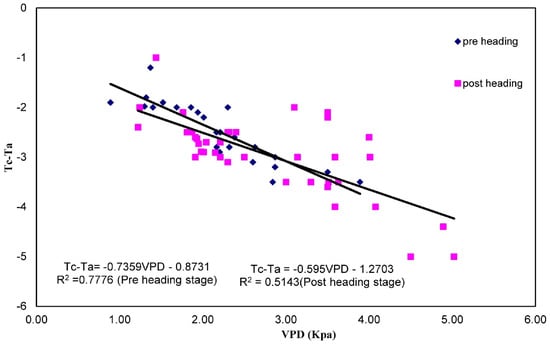
Figure 4.
Lower baseline and upper limit for determination of CWSI at pre-heading and post heading stages.
The Tc–Ta maximum value of 2 °C for the upper limit was selected from the experiment. During the pre-heading stage, the lower baseline had a greater slope than during the post-heading stage (Figure 4). This suggests that the greater canopy of the head of the wheat crop provides more diffusion resistance during the post-heading stage compared to the pre-heading stage. Therefore, as stated by Gontia et al. [41], the during pre-heading stage, more transpiration cooling occurred than during post-heading due to the increase in the air VPD.
The R2 values were 0.51 and 0.78 for the post-heading and pre-heading stages, respectively, during the 2018–2021 wheat-cropping period. The lower baseline (ll) equations developed for the pre-heading and post-heading stages were (Tc−Ta) ll = −0.735 (VPD) − 0.8731 and (Tc–Ta) ll = −0.5143 (VPD) − 1.2703, respectively.
4.5. Response of CWSI to Different Treatments
The CWSI values for different irrigation deficits (D0%, D20%, D40%, and D100%) are shown in Figure 5a–e.
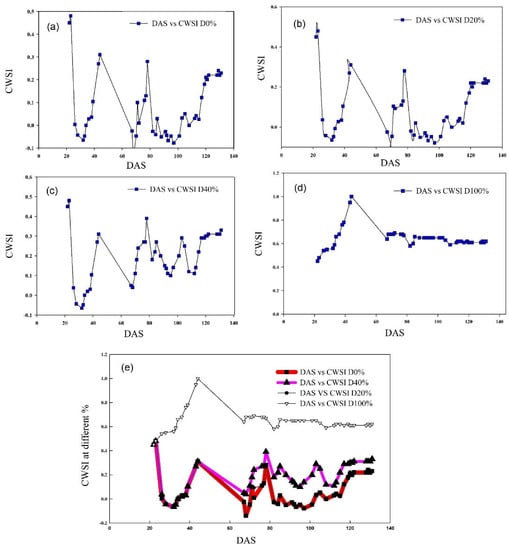
Figure 5.
Relationship between DAS and CWSI for different irrigation deficit treatments (a) at D0%, (b) at D20%, (c) at D40%, and (d) at D100%; (e) combined trend of all deficit levels.
The average seasonal CWSI values were also estimated at each deficit level for the whole season. The CWSI value at D0% (0.08) was below the other treatments that had irrigation levels corresponding to D20% (0.16), D40% (0.20), and D100% (0.64) at different deficit levels. The trend analysis showed that the CWSI value D20% was greater than D0% because less irrigation was applied relative to D0% and due to limited rainfall. A similar trend analysis of the CWSI showed that D40% was greater than D20%. The study conducted by [41] also stated that a higher crop yield was found during the treatment at D40%. The trend of the CWSI in D100% was greater than all other treatments, which resulted from the application of only one irrigation procedure (first irrigation at the time of sowing) and limited rainfall during the growing season. A similar result was found by using the D100% treatment on wheat crops [42].
Figure 5e indicates that the crop water stress index trend of the four irrigation deficit treatments corresponding to different treatments had different CWSI values, which might be due to the different levels of irrigation deficit. It was observed that the trend in the CWSI value in D0% was low compared to the other treatments because the application of water at a zero percent deficit from field capacity and the other treatments—D20%, D40%, and D100%, which each had different trends—has incremented irrigation deficit levels between them. It was observed that the trend in the CWSI value in the D20% treatment was higher than the treatment at D0% due to the lower amount of water applied compared to the zero percent deficit, as well as the changing climate conditions. A similar trend was observed in the CWSI for the D40% treatment, which was higher than the treatment at D20%. The trend in the CWSI value in the D100% treatment was greater than the other treatments due to the lack of irrigation, aside from rainfall, during the examined season.
Since the irrigation interval was 20 days, the analyses of the CWSI variations were performed in 20-day intervals. The CWSI values increased by 0.48 during DAS-0 to DAS-20 (Figure 5e). This increase reflects the very small amount of water contributed by rainfall throughout the period since no irrigation was applied to the field except rain irrigation (irrigation before wheat sowing). Furthermore, the CWSI value varies from 0.5 to 1.0 for DAS-20 to DAS-40. The increasing rate of the CWSI is slightly lower than DAS-0 to DAS-20, which may be due to the increased canopy air temperature difference as well as the absence of rainfall during this period. A declining trend in the CWSI for the interval of DAS-40 to DAS-60 was found, which ranged from 0.35 to 0.0. This may be due the application of the second irrigation.
An increase in the CWSI was found during DAS-60 to DAS-80, even though the third irrigation was applied. This may be associated with the fact that the post-heading stage had begun during this time interval and water consumption has increased due to the start of the crops’ maturity stage (flowering stage). The declining (below zero) CWSI during DAS-80 to DAS-100 could be the result of the fourth irrigation application and the approximately 11.9 mm of rainfall. Subsequently, a relatively rapid increasing trend in the CWSI values was observed up to DAS-112, which may be associated with the fact that irrigation was not applied even though the crop water demand was at its peak.
4.6. Analysis of Crop Yield and Irrigation Treatment
An analysis comparing the crop yield and irrigation management is important for the efficient use of local resources [43]. Many researchers have pointed out the enlightening association between the grain yield and the depth of irrigation in response to various irrigation regimes [44]. D0% was the best treatment for yield production, with an estimated yield of 3.8 ton/ha (Table 5, Figure 6).

Table 5.
Amount of water applied, yield, and water use efficiency with different irrigation treatments during growing season of 2018–2021.
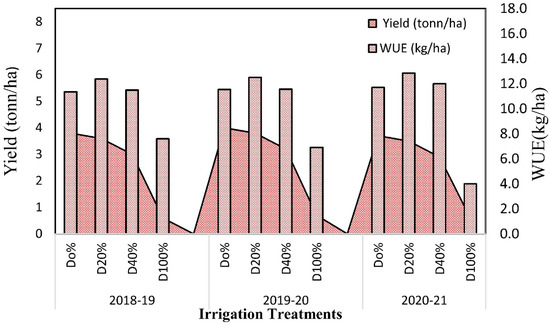
Figure 6.
Relationship between WUE and Yield at different level irrigation treatments during growing season.
A significantly lower yield (0.60 ton/ha) was found for D100% compared to all the other treatments. The mean seasonal CWSI for D40% was 0.193, which was less than D100% and could be responsible for the significant difference in the yield of D100% (0.60 ton/ha) and D40% (3 ton/ha). There was also a significant difference between D20% (3.6 ton/ha) and D0% (3.8 ton/ha). The variations in crop yield are mainly due to the large difference in the amount of irrigation applied in each treatment. The water use efficiency of D20% was higher (13 kg ha−1 mm−1) than all the other treatments, while D100% showed the lowest water use efficiency (7.37 kg ha−1 mm−1). Our findings regarding the WUE (13 kg ha−1 mm−1) are broadly in accordance with [45], which recorded WUE ranges of 14–24 kg ha−1 mm−1. Overall, it was concluded that under the conditions of the study, D20% achieved high yields with a high WUE during the 2018–2021 growing season.
The relationship between yield (kg ha−1) and the seasonal mean CWSI values was linear (Figure 7). This relationship indicated that the CWSI and yield of wheat crops are inversely proportional to each other, meaning that the yield of wheat will decrease with an increase in the CWSI. The wheat crop yield was at its maximum level when the CWSI was at its minimum level. This relationship can be used to predict the yield potential of wheat. Generally, drought stress increases the CWSI. Values of the CWSI from 0 to 0.3 mean that the crops have enough water, while values in the range of 0.3 to 0.6 mean the crops are under stress [46]. Full irrigation is difficult due to water shortages; therefore, deficit irrigation can be employed as an option to save water and achieve high grain yields [47].
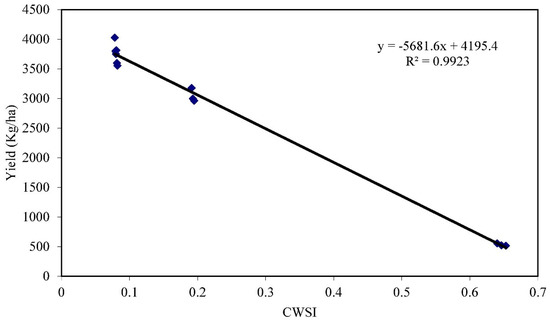
Figure 7.
Relationship between yields of wheat crops related to seasonal CWSI.
5. Conclusions
This study was carried out to estimate the CWSI of wheat crops so as to monitor water-related stress on crops and to assess its impact on yields at different water deficit levels. The CWSI value of the 20% deficit irrigation level (D20%) was lower than the other deficit levels except for D0%. However, with a high WUE, D20% was more efficient compared to the other treatments, demonstrating a greater crop yield per the level of irrigation applied.
The yield of wheat crops was found to be inversely correlated with the CWSI. The CWSI values had an increasing trend with the decreasing irrigation level. A mean CWSI value of 0.08 was found to be the best target value for irrigating crops to obtain a better wheat crop yield. The semi-empirical relationship developed for the CWSI in this study is useful in monitoring wheat crops for water stress during the pre-heading and post-heading stages in the study region. The relationship between the CWSI and wheat yield was also derived. The results showed that the lowest mean seasonal CWSI was 0.079 for the D0% treatment with a wheat yield of 3800 kg ha−1, while the highest mean seasonal crop water stress index value was 0.65 for the treatment at ‘D100%’ with a wheat yield of 983 kg ha−1. The yield difference was found to be non-significant for the ‘D20%’ treatment (3600 kg ha−1) and the D0% treatment (3800 kg ha−1) with mean seasonal CWSI values of 0.081 and 0.079, respectively. Herein, the method used for estimating the crop water stress index via crop data aids regional irrigation scheduling for other crops. Future studies should include a wider range of deficit irrigation regimes and the impact of climate change may be assessed in combination with deficit irrigation. Furthermore, it is suggested to use a crop model with a combination of deficit irrigation schemes, which will provide more accurate irrigation estimates over large-scale regions. Overall, this study could be helpful for improving agricultural water management and enhancing the wheat crop yield in the region.
Author Contributions
Data curation, M.I.K.; Formal analysis, M.I.K. and X.Z.; Investigation, Q.S., X.Z., M.I.K. and A.A.; Methodology, M.I.K., A.A. and S.A. Conceptualization; Writing—original draft, M.I.K., Q.S. and N.A.B.; Writing—review and editing, M.Z., N.S., A.A., A.S. and R.H.A. All authors have read and agreed to the published version of the manuscript.
Funding
This research received no external funding.
Institutional Review Board Statement
Not Applicable.
Informed Consent Statement
Not Applicable.
Data Availability Statement
Data can be provided on a reasonable request.
Acknowledgments
This research was supported by Research project of Pakistan Science Foundation No. PSF/CRP/18th Protocol (10). We are very thankful to the University of Agriculture Faisalabad, Pakistan, for making the necessary arrangements for the experimental study.
Conflicts of Interest
The authors declare no conflict of interest.
References
- Braun, H.J.; Atlin, G.; Payne, T. Multi-location testing as a tool to identify plant response to global climate change. Clim. Chang. Crop Prod. 2010, 1, 115–138. [Google Scholar]
- FAO. Food and Agriculture Organization of the United Nations; FAO: Rome, Italy, 2016; Available online: http://www.fao.org/faostat/en/#data (accessed on 6 December 2018).
- Turral, H.; Burke, J.; Faurès, J.M. Climate Change, Water and Food Security (No. 36); Food and Agriculture Organization of the United Nations: Rome, Italy, 2011. [Google Scholar]
- Godfray, H.C.J.; Beddington, J.R.; Crute, I.R.; Haddad, L.; Lawrence, D.; Muir, J.F.; Pretty, J.; Robinson, S.; Thomas, S.M.; Toulmin, C. Food security: The challenge of feeding 9 billion people. Science 2010, 327, 812–818. [Google Scholar] [CrossRef] [PubMed]
- Fahad, S.; Hussain, S.; Saud, S.; Hassan, S.; Tanveer, M.; Ihsan, M.Z.; Shah, A.N.; Ullah, A.; Khan, F.; Ullah, S.; et al. A combined application of biochar and phosphorus alleviates heat-induced adversities on physiological, agronomical and quality attributes of rice. Plant Physiol. Biochem. 2016, 103, 191–198. [Google Scholar] [CrossRef]
- Khokhar, B.; Hussain, I.; Khokhar, Z. Effect of different irrigation frequiencies on growth and yield of different wheat genotypes in Sindh. Pak. J. Agric. Res. 2010, 23, 3–4. [Google Scholar]
- Kaleri, A.A.; Baloch, A.W.; Baloch, M.; Wahocho, N.A.; Abro, T.F.; Jogi, Q.; Soomro, A.A.; Marri, A.; Bhutto, L.A. Heritability and correlation analysis in Bt and non-Bt cotton (Gossypium hirsutum L.) genotypes. Pure Appl. Biol. 2021, 5, 906–912. [Google Scholar] [CrossRef]
- Wajid, A.; Hussain, A.; Maqsood, M.; Ahmad, A.; Awais, M. Influence of sowing date and irrigation levels on growth and grain yield of wheat. Pak. J. Agric. Sci. 2002, 39, 22–24. [Google Scholar]
- Ibarra, S. Soil Moisture and Tensiometer Measurements Made to Assist the Management of Supplementary Irrigation of Maize in Eastern Ontario. Ph.D. Dissertation, McGill University Libraries, Montreal, QC, Canada, 1997. [Google Scholar]
- Tari, A.F. The effects of different deficit irrigation strategies on yield, quality, and water-use efficiencies of wheat under semi-arid conditions. Agric. Water Manag. 2016, 167, 1–10. [Google Scholar] [CrossRef]
- Saeed, U.; Wajid, S.A.; Khaliq, T.; Zahir, Z.A. Optimizing irrigation and nitrogen for wheat through empirical modeling under semi-arid environment. Environ. Sci. Pollut. Res. 2017, 24, 11663–11676. [Google Scholar] [CrossRef]
- Zhang, H. Improving water productivity through deficit irrigation: Examples from Syria, the North China Plain and Oregon, USA. In Water Productivity in Agriculture: Limits and Opportunities for Improvements; CABI: Wallingford, UK, 2003; pp. 301–309. [Google Scholar]
- Hossain, A.; Sarker, M.A.Z.; Saifuzzaman, M.; Teixeira da Silva, J.A.; Lozovskaya, M.V.; Akhter, M.M. Evaluation of growth, yield, relative performance and heat susceptibility of eight wheat (Triticum aestivum L.) genotypes grown under heat stress. Int. J. Plant Prod. 2013, 7, 615–636. [Google Scholar]
- Ahmad, A.; Ashfaq, M.; Rasul, G.; Wajid, S.A.; Khaliq, T.; Rasul, F.; Saeed, U.; Rahman, M.H.U.; Hussain, J.; Ahmad Baig, I.; et al. Impact of climate change on the rice–wheat cropping system of Pakistan. In Handbook of Climate Change and Agroecosystems: The Agricultural Model Intercomparison and Improvement Project Integrated Crop and Economic Assessments; World Scientific: Singapore, 2015; Part 2; pp. 219–258. [Google Scholar]
- Jackson, R.D. Soil moisture inferences from thermal infrared measurements of vegetations temperatures. In Digest 1981 International Geosciences and Remote Sensing Symposium; Institute of Electrical and Electronics Engineers: Washington, DC, USA; New York, NY, USA, 1981. [Google Scholar]
- Jackson, R.D. Canopy temperature and crop water stress. Adv. Irrig. 1982, 1, 43–85. [Google Scholar]
- Idso, S.B.; Jackson, R.D.; Pinter Jr, P.J.; Reginato, R.J.; Hatfield, J.L. Normalizing the stress-degree-day parameter for environmental variability. Agric. Meteorol. 1981, 24, 45–55. [Google Scholar] [CrossRef]
- Idso, S.B.; Reginato, R.J.; Farah, S.M. Soil-and atmosphere-induced plant water stress in cotton as inferred from foliage temperatures. Water Resour. Res. 1982, 18, 1143–1148. [Google Scholar] [CrossRef]
- Erman, F.; Li, Y.; Hu, Z.; Yang, J.; Min, D. Review on methods for water use planning in irrigation districts based on water balance. J. Drain. Irrig. Mach. Eng. 2022, 40, 294–301. [Google Scholar]
- Hou, Y.; Wang, Z.L.; Wenhao, Z.; Jifeng, D.; Yunqing, W.Y. Principal component analysis method for suitable water and fertilizer doses of drip irrigation grape in an extreme arid area. J. Drain. Irrig. Mach. Eng. 2021, 1, 89–95. [Google Scholar]
- Zhou, X.; Wang, R.L.; Chaonan, Z.C.; Liu, W.; Bi, H. Effects of water regulation on physiological characteristics and water use of apple-soybean alley cropping system. J. Drain. Irrig. Mach. Eng. 2021, 39, 410–418. [Google Scholar]
- Gao, J.Z.; Hongbin, Z.H.; Yuchun, B.A. Effects of water deficit on quality and yield of pepper under mulched drip irrigation in cold Oasis Region. J. Drain. Irrig. Mach. Eng. 2021, 39, 404–409. [Google Scholar]
- Yang, L.Z.; Beibei, H.Y.; Wang, Q.; Chen, X. Effects of Bacillus subtilis on growth of winter wheat and distribution of soil water and nitrogen under salt stress. J. Drain. Irrig. Mach. Eng. 2021, 39, 517–524. [Google Scholar]
- Ding, H.; Wang, Z.L.; Wenhao, Z.J.; Jia, H.; Wen, Y.; Zou, J. Effects of degradation film on soil hydrothermal and yield of drip irrigation cotton in extremely arid areas. J. Drain. Irrig. Mach. Eng. 2021, 39, 525–532. [Google Scholar]
- Zhang, K.; Diao, M.; Jing, B.; Zhang, X.; Wan, W.; Guo, P.; Han, W. Influence of irrigation quota and frequency on root growth and yield of processing tomato. J. Drain. Irrig. Mach. Eng. 2020, 38, 83–89. [Google Scholar]
- Li, X.; Zhang, C.; Yan, H.; Akhlaq, M.; Lanlan, Z.W.; Wang, J. Effects of biochar and irrigation on soil water retention and physiological characteristics of tomato in greenhouse condition. J. Drain. Irrig. Mach. Eng. 2022, 40, 317–324. [Google Scholar]
- Chen, S.; Hu, J.; Xiao, M.; Hu, X. Effects of irrigation regulation of rural domestic reclaimed water on soil nutrients in paddy field. J. Drain. Irrig. Mach. Eng. 2022, 40, 411–418. [Google Scholar]
- Li, X.M.A.; Juanjuan, S.X.; Shi, X.; Guo, X.; Lei, T. Effects of water saving and nitrogen reduction on tomato growth and utilization rate of water and nitrogen in greenhouse. J. Drain. Irrig. Mach. Eng. 2021, 39, 1056–1061. [Google Scholar]
- Irmak, S.; Haman, D.Z.; Bastug, R. Determination of crop water stress index for irrigation timing and yield estimation of corn. Agron. J. 2000, 92, 1221–1227. [Google Scholar] [CrossRef]
- Da Silva, B.B.; Rao., R.T.V. The CWSI variations of a cotton crop in a semi-arid region. J. Arid. Environ. 2005, 62, 649–659. [Google Scholar] [CrossRef]
- Erdem, Y.; Şehirali, S.; Erdem, T.; Kenar, D. Determination of crop water stress index for irrigation scheduling of bean (Phaseolus vulgaris L.). Turk. J. Agric. For. 2006, 30, 195–202. [Google Scholar]
- Erdem, Y.; Arin, L.; Erdem, T.; Polat, S.; Deveci, M.; Okursoy, H.; Gültaş, H.T. Crop water stress index for assessing irrigation scheduling of drip irrigated broccoli (Brassica oleracea L. var. italica). Agric. Water Manag. 2010, 98, 148–156. [Google Scholar] [CrossRef]
- Gonzalez-Dugo, V.; Zarco-Tejada, P.J.; Fereres, E. Applicability and limitations of using the crop water stress index as an indicator of water deficits in citrus orchards. Agric. For. Meteorol. 2014, 198, 94–104. [Google Scholar] [CrossRef]
- Ali, A.; Zia, M.S.; Hussain, F.; Salim, M.; Mahmood, I.A.; Shahzad, A. Efficacy of different methods of potassium fertilizer application on paddy yield, K uptake and agronomic Efficiency. Pak. J. Agric. Sci. 2005, 42, 1–2. [Google Scholar]
- Manzoor, Z.; Awan, T.H.; Ahmad, M.; Akhter, M.; Faiz, F.A. Effect of split application of potash on yield and yield related traits of basmati rice. J. Anim. Plant Sci. 2008, 18, 120–124. [Google Scholar]
- Tanvir, M.A. Performance of Various Tree Species as Irrigated by Urban Wastewater. Ph.D. Dissertation, University of Agriculture, Faisalabad, Pakistan, 2010. [Google Scholar]
- Panda, R.K.; Behera, S.K.; Kashyap, P.S. Effective management of irrigation water for wheat under stressed conditions. Agric. Water Manag. 2003, 63, 37–56. [Google Scholar] [CrossRef]
- Jackson, R.D.; Reginato, R.J.; Idso, S.B. Wheat canopy temperature: A practical tool for evaluating water requirements. Water Resour. Res. 1977, 13, 651–656. [Google Scholar] [CrossRef]
- Priestley, C.H.B.; Taylor, R.J. On the assessment of surface heat flux and evaporation using large-scale parameters. Mon. Weather. Rev. 1972, 100, 81–92. [Google Scholar] [CrossRef]
- Ru, C.; Hu, X.; Wang, W.; Ran, H.; Song, T.; Guo, Y. Evaluation of the crop water stress index as an indicator for the diagnosis of grapevine water deficiency in greenhouses. Horticulturae 2020, 6, 86. [Google Scholar] [CrossRef]
- Gontia, N.K.; Tiwari, K.N. Development of crop water stress index of wheat crop for scheduling irrigation using infrared thermometry. Agric. Water Manag. 2008, 95, 1144–1152. [Google Scholar] [CrossRef]
- Alghory, A.; Yazar, A. Evaluation of crop water stress index and leaf water potential for deficit irrigation management of sprinkler-irrigated wheat. Irrig. Sci. 2019, 37, 61–77. [Google Scholar] [CrossRef]
- Chai, Q.; Gan, Y.; Zhao, C.; Xu, H.L.; Waskom, R.M.; Niu, Y.; Siddique, K.H.M. Regulated deficit irrigation for crop production under drought stress. A review. Agron. Sustain. Dev. 2016, 36, 3. [Google Scholar] [CrossRef]
- Zhang, C.; Liu, J.; Dong, T.; Pattey, E.; Shang, J.; Tang, M.; Cai, H.; Saddique, Q. Coupling hyperspectral remote sensing data with a crop model to study winter wheat water demand. Remote Sens. 2019, 11, 1684. [Google Scholar] [CrossRef]
- Jin, N.; He, J.; Fang, Q.; Chen, C.; Ren, Q.; He, L.; Yu, Q. The responses of maize yield and water use to growth stage-based irrigation on the loess plateau in China. Int. J. Plant Prod. 2020, 14, 621–633. [Google Scholar] [CrossRef]
- Wang, F.; Xiao, J.; Ming, B.; Xie, R.; Wang, K.; Hou, P.; Liu, G.; Zhang, G.; Chen, J.; Liu, W. Grain yields and evapotranspiration dynamics of drip-irrigated maize under high plant density across arid to semi-humid climates. Agric. Water Manag. 2021, 247, 106726. [Google Scholar] [CrossRef]
- Yuan, G.; Luo, Y.; Sun, X.; Tang, D. Winter wheat water stress detection based on canopy surface temperature. Trans. CSAE 2002, 18, 13–17, (In Chinese with English abstract). [Google Scholar]
Publisher’s Note: MDPI stays neutral with regard to jurisdictional claims in published maps and institutional affiliations. |
© 2022 by the authors. Licensee MDPI, Basel, Switzerland. This article is an open access article distributed under the terms and conditions of the Creative Commons Attribution (CC BY) license (https://creativecommons.org/licenses/by/4.0/).