Article

Performance of a Thermodynamic Model for Predicting Inorganic Aerosols in the Southeastern U.S.

1
Department of Biological and Agricultural Engineering, North Carolina State University, Raleigh, NC 27695, USA
2
Department of Statistics, North Carolina State University, Raleigh, NC 27695, USA
*
Author to whom correspondence should be addressed.
Atmosphere 2022, 13(12), 1977; https://doi.org/10.3390/atmos13121977
Submission received: 1 November 2022 / Revised: 21 November 2022 / Accepted: 24 November 2022 / Published: 26 November 2022
(This article belongs to the Section Aerosols)

Abstract

:
Fine particulate matter (i.e., PM2.5) has gained intensive attention due to its adverse health and visibility degradation effects. As a significant fraction of atmospheric PM2.5, secondary inorganic PM2.5 may be formed through the gas-phase ammonia (NH3) and particle-phase ammonium (NH4+) partitioning. While partitioning of NH3-NH4+ may be simulated using a thermodynamic equilibrium model, disagreement between model predictions and measurements have been realized. In addition, the applicability of the model under different conditions has not been well studied. This research aims to investigate the applicability of a thermodynamic equilibrium model, ISORROPIA II, under different atmospheric conditions and geographic locations. Based upon the field measurements at the Southeastern Aerosol Research and Characterization (SEARCH) network, the performance of ISORROPIA II was assessed under different temperature (T), relative humidity (RH), and model setups in urban and rural locations. The impact of organic aerosol (OA) on the partitioning of NH3-NH4+ was also evaluated. Results of this research indicate that the inclusion of non-volatile cations (NVCs) in the model input is necessary to improve the model performance. Under high T (>10 °C) and low RH (<60%) conditions, ISORROPIA II tends to overpredict nitric acid (HNO3) concentration and underpredict nitrate (NO3) concentration. The predominance of one phase of semi-volatile compound leads to low accuracy in the model prediction of the other phase. The model with stable and metastable setups may also perform differently under different T-RH conditions. Metastable model setup might perform better under high T (>10 °C) and low RH (<60%) conditions, while stable model setup might perform better under low T (<5 °C) conditions. Both model setups have consistent performance when RH is greater than 83%. Future studies using ISORROPIA II for the prediction of NH3-NH4+ partitioning should consider the inclusion of NVCs, the under/over prediction of NO3/HNO3, the selection of stable/metastable model setups under different T-RH conditions, and spatiotemporal variations of inorganic PM2.5 chemical compositions.

1. Introduction

Fine particulate matter with aerodynamic diameter less than 2.5 μm (i.e., PM2.5) has gained attention due to its adverse health effects, visibility degradation, and the impacts on the Earth’s ecosystems and radiative balance [1,2,3]. Secondary inorganic PM2.5 (iPM2.5) constitutes a significant fraction of atmospheric PM2.5 mass concentration and the chemistry of secondary iPM2.5 formation has been investigated for decades [4,5,6,7]. The formation of the secondary iPM2.5 may be characterized by thermodynamic equilibrium of gas-phase ammonia (NH3) and particle-phase ammonium (NH4+) partitioning [8,9]. It is important to establish a holistic understanding of the formation of secondary iPM2.5 such that the regional impact of iPM2.5 may be fully understood. Secondary iPM2.5 is usually formed through chemical reactions between different basic and acidic gases such as NH3, nitric acid (HNO3), and sulfuric acid (H2SO4). In general, NH3 gas is directly emitted, while HNO3 and H2SO4 mainly form through (photo)chemical reactions during atmospheric transformation of sulfur dioxide (SO2) and nitrogen oxides (NOx) (NOx = NO + NO2). It was reported that iPM2.5 mainly consists of ammonium nitrate (NH4NO3), ammonium sulfate ((NH4)2SO4), ammonium bisulfate (NH4HSO4), and ammonium chloride (NH4Cl) [10,11,12,13,14,15,16]; the latest research found that NH4HSO4 is the dominant component for SO42− aerosols due to acidic properties of the particles [17]. The partitioning of total ammonia (NH3 + NH4+) into gas and particle phase is usually assumed to be in the thermodynamic equilibrium state such that thermodynamic models can be used to estimate the physical phases (gas, liquid, solid) and interactions of different precursor gases of iPM2.5 [18,19,20]. However, the non-equilibrium state may exist in ambient air due to surface heterogeneity [21], the mass transport limitation between different sizes of particles [22], and the long timescale to reach equilibrium state for super-micron particles [23]. Consequently, the applicability of thermodynamic equilibrium theory for modelling the NH3-NH4+ partitioning may lead to erroneous results under certain atmospheric conditions. As a widely used thermodynamic equilibrium model, ISORROPIA II has been coupled to large-scale chemical transport model (CTM) to predict the concentrations of secondary iPM2.5 at equilibrium state. In this study, we carry out comprehensive evaluation of the applicability of the ISORROPIA II model for predicting inorganic aerosols.
The default assumption made in the thermodynamic equilibrium model is that the gas and particle system is in a chemical equilibrium state, i.e., the total free energy of the system is minimized [8]. The ISORROPIA II [24] is one of the commonly used thermodynamic models, in which gas-particle partitioning phenomenon and the impacts of temperature (T) and relative humidity (RH) are incorporated. The mutual deliquescence region and hysteresis phenomenon are both resolved in the model. In addition, compared with other thermodynamic models, ISORROPIA II is more computationally efficient with stable performance [24,25,26,27]. Input data required by the ISORROPIA II include the concentrations of NH3, HNO3, H2SO4, hydrochloric acid (HCl) in both gas and particle phases, T and RH. Two types of problem (forward and backward) can be solved by ISORROPIA II [28]. The input data for forward problem include total concentrations of precursor gases existing both in gas and particle phases. The input data for backward problem include the concentrations of precursor gases exclusively in particle phase. In addition, thermodynamically stable and metastable states can be set by the user to adapt to different application scenarios. The difference between these two states reflects if the salts in the solution will precipitate when super saturation state is achieved. For thermodynamically stable states, the salts will precipitate when super saturation is achieved, while for metastable states, the salts remain in the aqueous phase. The outputs of the model include the concentrations of gases, iPM2.5 chemical compositions, hydrogen ion, and water content at chemical equilibrium state for both forward and backward problems.
The ISORROPIA II model assumes that the thermodynamic equilibrium is established instantaneously, and the equilibrium state could also be kinetically approached, which was done in some Chemical Transport Model (CTM) applications [29,30]. To prove the validity of this assumption, the timescales to reach thermodynamic equilibrium state were assessed by different researchers [31,32]. The theoretical calculations revealed that it takes around 5–30 min for submicron (PM1) and more than 1 h for super-micron (PM1–2.5) aerosols to reach equilibrium state. Therefore, the application of equilibrium models (e.g., ISORROPIA II) to timescales shorter than the equilibrium time would be problematic. In addition, the field sampling with long integration time may not be able to detect the variation of gas- and particle-phase pollutants caused by dramatic changes of ambient conditions. If ambient conditions and inorganic aerosol compositions are variable on timescales shorter than the sampling timescale, then that could be problematic for an equilibrium model application, which should be calculating all the individual equilibrium states rather than an average over all states.
Time resolution of the concentrations of iPM2.5 and its precursor gases varied in different field studies from several minutes to 24 h due to the differences in the measurement instruments and techniques. Zhang et al., (2002), Yu et al., (2005), and Fountoukis et al., (2009) used 5–6 min measurements to assess the performance of ISORROPIA II [32,33,34]; Yu et al., (2005) and Takahama et al., (2004) used 1–3 h measurements to check the prediction skill of ISORROPIA II [34,35]; Moya et al., (2001), Yu et al., (2005), and Goetz et al., (2008) used 6–24 h measurements to investigate the performance of ISORROPIA II [34,36,37]. The measurements with 6 to 24 h time resolution may not be suitable to assess the model prediction skill because the greater time scale loses the resolution to detect the impact of ambient condition changes on the NH3-NH4+ partitioning process.
Factors influencing the gas-particle system equilibrium state include ambient meteorological condition [38], surface heterogeneity and multiphase chemistry [21], and organic aerosols coating inorganic aerosols [39,40]. Thus, the application of thermodynamic models such as ISORROPIA II may also be affected by those factors [22]. Thermodynamic equilibrium models predict the molar ratio R (R = ([NH4+] − [NO3] − [Cl])/[SO42−]) to be 2 when NH3 is abundant compared to acidic gases, corresponding to the stoichiometry of (NH4)2SO4. Research conducted by Li et al., (2014a, b) detected the high concentration of NH3 gas near the source region [41,42]. It was observed that the mean R was 1.75, which is less than 2, although this ratio should be close to 2 under high NH3 concentration environments. Further investigation suggested that wind speed may affect the local thermodynamic equilibrium status as the time for establishing such equilibrium may exceed the time needed for transporting NH3-laden air parcels from emission sources under high wind speed. The concentrations of iPM2.5 chemical compositions and precursor gases were measured at an agricultural site located in an area impacted by the NH3 emissions from intensive animal production activities and fertilizer application [38]. It was also discovered that the mean R was approximately 1.43. The high NH3 concentrations at the site present a potential to react with acidic gases, and the abundant NH3 should render molar ratio R close to 2. Walker et al., (2006) noted that the possible reason for the low molar ratio R may be due to the non-equilibrium state of the NH4+-NO3-SO42− system; the mass transport between gaseous NH3 and particles may limit the protonation of NH3 by H2SO4 [38]. Although the applicability of ISORROPIA II in rural area with high NH3 concentrations was not fully assessed in the research, the ISORROPIA II model was utilized to investigate the responses of secondary iPM2.5 to the changes of precursor gases. Further investigation should be conducted to advance our understanding on the thermodynamic equilibrium assumption.
The impact of organic matter on the chemistry of NH3 and acidic gas H2SO4 involves complex processes, and, in the literature, there are two contradictory explanations. Liggio et al., (2011) investigated the time to achieve equilibrium state in the system of NH3-H2SO4-organics [43]. In a closed chamber, particle-free ambient air was exposed to H2SO4 aerosols. The initial molar ratio of total NH3/total H2SO4 was set at various values and the steady NH4+/SO42− molar ratio was treated as the equilibrium indicator. The comparison of equilibrium time between the organic-free system and the organic-rich system indicated the delay effect of organics on the NH3 uptake to H2SO4 particles. The inorganic particles may be coated by organic materials, which leads to a long equilibrium time, i.e., hours instead of minutes. Silvern et al., (2017) compared the [NH4+]/[SO42−] in the air with the values in rainwater in the eastern U.S. The results indicated that not all the SO42− was in the form of (NH4)2SO4, even with abundant NH3 in ambient air [39]. The possible reason is that the organic aerosol (OA) coating on the inorganic particles may hinder the reaction of NH3 and acidic gases. On the other hand, Pye et al., (2018) noted that the organic coatings may not be needed to explain the [NH4+]/[SO42−] because the Chemical Speciation Network (CSN) contains measurement artifacts leading to ammonium volatilization, and aerosol mass spectrometer (AMS) measurements also include organosulfates in total sulfate [44]. Furthermore, Guo et al., (2018) challenged the ability of organic film to retard NH3 uptake [45]. In this newer research, the OA/PM2.5 mass fraction was utilized to represent the thickness of organic film. No significant relationship between the measured molar ratio of [NH4+]/[SO42−] and OA/PM2.5 mass fraction was observed. This finding may challenge the ability of organic film to retard NH3 uptake.
The ISORROPIA II model simulates the K+-Ca2+-Mg2+-NH4+-Na+-SO42−-NO3-Cl-H2O system; thus, the ISORROPIA model has been used to estimated particle pH due to the lack of operational techniques for direct particle pH measurements [17,46]. In addition, oftentimes, the nonvolatile cations (NVCs) such as potassium (K+), calcium (Ca2+), magnesium (Mg2+), and sodium (Na+) may not be monitored due to the limitation of measurement instruments and techniques. Fountoukis et al., (2009) and Guo et al., (2018) observed that the inclusion of measured Na+ to the model input significantly improved the performance of ISORROPIA II in reproducing the gas-phase and particle-phase pollutants [32,45].
In this study, we explore impacts of the factors, e.g., organic materials, and ambient T and RH, on the performance of the ISORROPIA II model with an aim to identify the possible reasons to the underestimations or overestimations in the concentrations of gas-phase and particle-phase species.

2. Materials and Methods

2.1. Monitoring Network Description

The Southeastern Aerosol Research and Characterization (SEARCH) Network is a long-term air quality monitoring network established in the southeastern U.S. (AL, FL, GA, and MS) [47]. The network provides high-quality field measurements of PM2.5 mass and chemical compositions. More specifically, the continuous measurements of iPM2.5 chemical compositions and its precursor gases provides information with high time resolution to investigate the partitioning of gas- and particle-phase pollutants at eight sites covering agricultural rural areas and urban regions.
Under the SEARCH, the concentrations of iPM2.5 chemical compositions and its precursor gases were measured at four paired urban/nonurban sites, named as JST/YRK, BHM/CTR, GFP/OAK, and PNS/OLF. The measurements started from 1998/1999 and ended in 2016. These eight monitoring sites are shown in Figure 1.
The onsite measurements provided processed 1 h average concentrations of precursor gases, iPM2.5 chemical compositions, and meteorological conditions. In addition, the 24 h average measurements of iPM2.5 chemical compositions were also performed. The details of the measurements made at the eight sites are reported in [48,49] and summarized in Table 1.

2.2. Data Reduction and Processing

Some of the reported gas- and particle-phase measurements were found to be negative or below the instrument’s detection limit. All the negative values were excluded from the analysis, while those values below the detection limits were included in the data analysis [50,51].
During the SEARCH data collection period, rain events happened that led to pollutant wet depositions. The precipitation led to a rapid decrease in the concentrations of gas- and particle-phase pollutants. Thus, the hourly and daily measurements in rain events are not suitable to assess the performance of the thermodynamic model. In data reduction process, the hours and days with precipitation were flagged and excluded from the analysis.

2.3. Thermodynamic Model Assessment

We explore the impact of factors including ambient T and RH, stable/metastable model setups, and NVCs on the performance of ISORROPIA II. Comparisons of model predicted concentrations and measurements were performed to check the over or underestimations of ISORROPIA II under various conditions and to identify the possible reasons. In addition, the impact of OA on the thermodynamic equilibrium partitioning of NH3-NH4+ was evaluated as well.
The impacts of T and RH on the model performance are assessed using the following experimental design. The T and RH scenarios are broken down into various 5 °C T × 10% RH conditions; under each condition, the model-predicted concentrations of NH3, NH4+, HNO3, NO3, and iPM2.5 (SO42− + NH4+ + NO3) were assessed against hourly measurements of gas-phase and particle-phase pollutants.
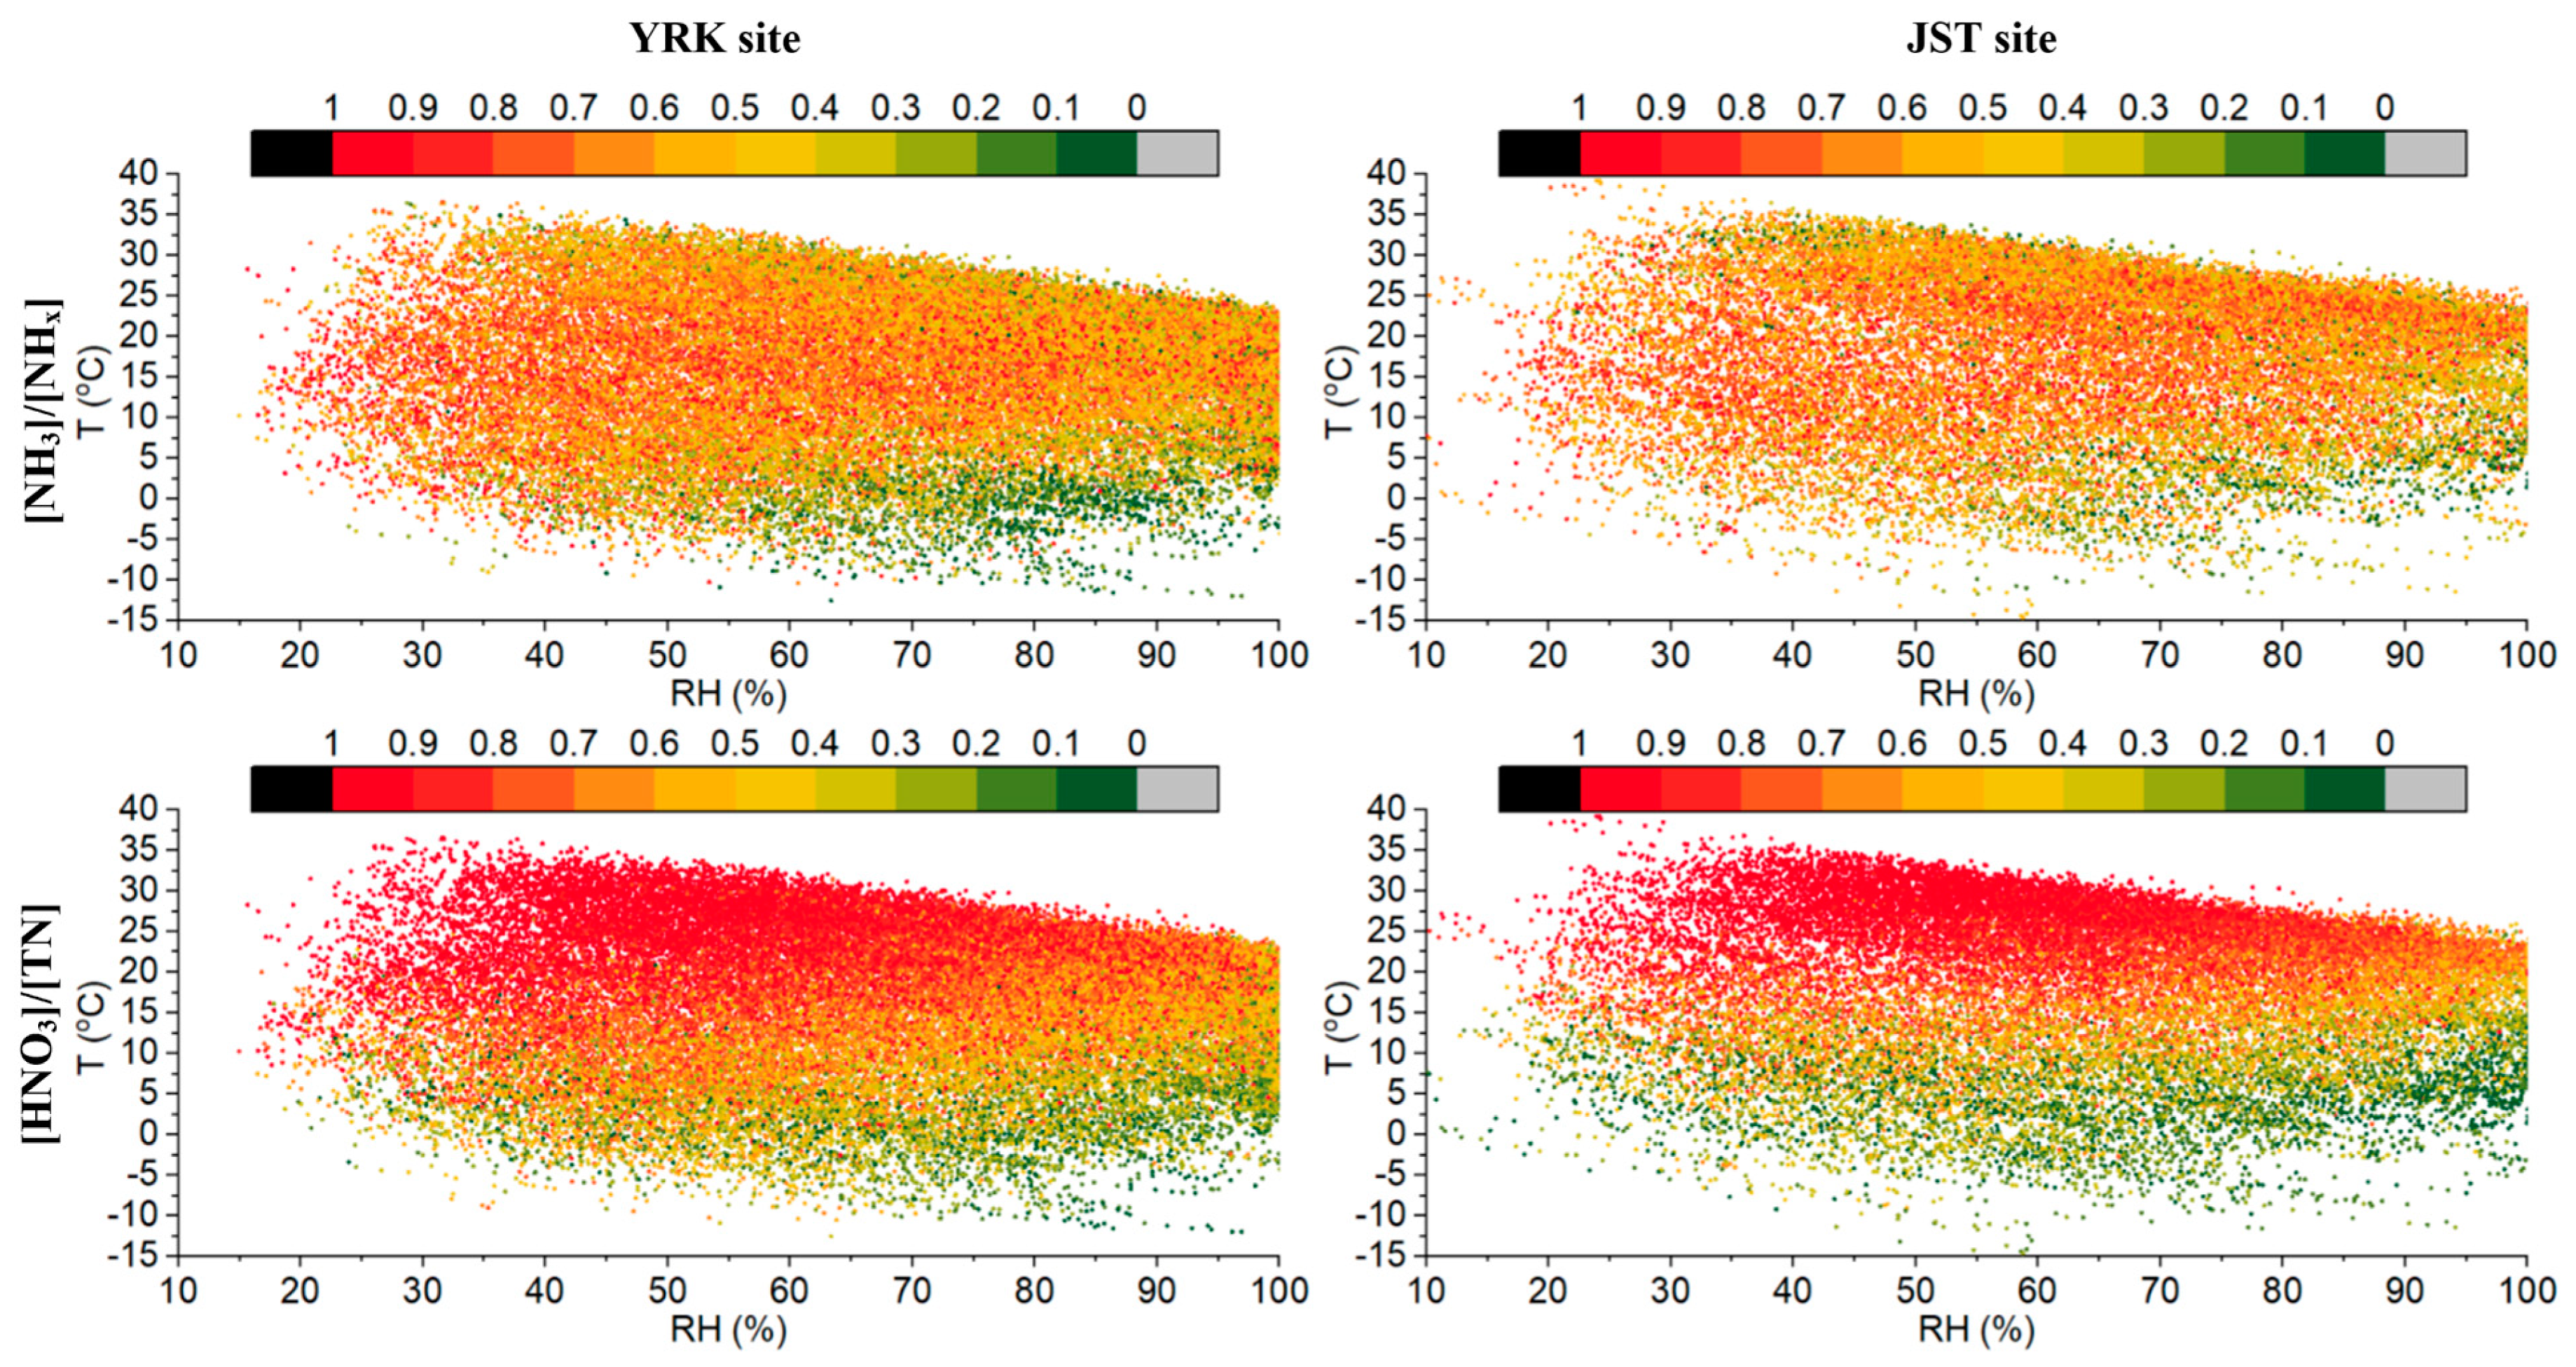
The gas-phase NH3 and HNO3 molar fractions under different T-RH conditions were also analyzed. The gas-phase NH3 molar fraction ([NH3]/[NHx]) and gas-phase HNO3 molar fraction ([HNO3]/[TN]) are defined in Equations (1) and (2):
[ NH 3 ] / [ NH x ] = [ N H 3 ] [ N H 3 ] + [ N H 4 + ]
[ HNO 3 ] / [ TN ] = [ H N O 3 ] [ H N O 3 ] + [ N O 3 ]
where [NHx] is the sum of molar concentrations (µmol m−3) of gas-phase NH3 and particle-phase NH4+, and [TN] is the sum of molar concentrations (µmol m−3) of gas-phase HNO3 and particle-phase NO3.
The ISORROPIA II is usually utilized to predict the gas-particle partitioning given the concentrations of precursor gases, thus forward mode is used as default in this study. The performance of ISORROPIA II with thermodynamically stable and metastable setups under different T and RH conditions was assessed by comparing forward model predictions with field measurements to check the applicability of the model for predicting inorganic aerosols under different conditions.
The hourly measurements only included the concentrations of NH3, NH4+, HNO3, NO3, and SO42−. The discrepancies in the predictions of gas- and particle-phase pollutants may be due to the lack of other cations/anions measurements. Thus, the model performances of ISORROPIA II in simulating NH3, HNO3, NH4+, and NO3 under different gas ratios (GR) and measured charge balances were analysed. The GR characterizes the potential reaction of NH3 and acidic gases, and measured charge balance is the molar difference of cation (NH4+) and anions (SO42− and NO3). More specifically, GR and charge balance can be defined as Equations (3) and (4):
GR = [ T A ] 2 [ T S ] [ T N ]
Measured charge balance = [NH4+] − 2 × [SO42−] − [NO3]
where TA is total available ammonia (NH3 + NH4+), TS is total sulfate (H2SO4 + HSO4 + SO42−), and TN is total nitrate (HNO3 + NO3).
In terms of the impact of NVCs on the model performance, only 24 h average data of K+, Ca2+, Mg2+, and Na+ were available under the SEARCH Network. Thus, 24 h average data of iPM2.5 chemical composition and its precursor gases were used to assess the impact of NVCs inclusion/exclusion on the model performance. For each site, two datasets were used to run ISORROPIA II: one was NH3-NH4+-HNO3-NO3-SO42− system, the other one was Ca2+-Mg2+-K+-Na+-HCl-Cl-NH3-NH4+-HNO3-NO3-SO42− system.
If iPM2.5 may be coated with organic film, retarding the uptake of NH3 to react with H2SO4, then the higher OA/SO42− mass ratio may lead to lower probability of the reaction between NH3 and H2SO4 [43]. The reaction of H2SO4 and NH3 was characterized by molar ratio R, Equation (5):
R = [ N H 4 + ] [ N O 3 ] [ C l ] [ S O 4 2 ]
The postulated organic film hypothesis was examined by testing if there was a significant correlation between molar ratio R and OA/SO42− mass ratio. The negative correlation may indicate the organic film hypothesis, while no correlation may challenge the organic film hypothesis.
The pH was calculated to study the acidity of the inorganic aerosol:
pH = log 10 1000 γ H + H a i r + W
where γH+ is the hydronium ion activity coefficient, which is set as unity, Hair+ (µg m–3) is the hydronium ion concentration in volume of air, and W (µg m–3) is particle water concentration associated with inorganic aerosol. Both Hair+ and W are from the ISORROPIA II model output.

2.4. Statistical Tests of the Model Performance Assessment

Following the approaches by [32,52,53], four parameters were used to evaluate the performance of the ISORROPIA II model. The four parameters’ criteria values for acceptable model performance and associated meanings are as follows (the bracket means averaging; Co and Cp denote measured and predicted concentration):
1.
Fraction of predictions falls in a factor of two of observations (Fa2): the fraction of data with 0.5 ≤ C p C o   ≤ 2.0 (Fa2 ≥ 0.8).
The perfect model should have Fa2 = 1 acceptable model performance should have Fa2 greater than 0.8.
2.
Normalized mean square error (NMSE): NMSE = [ ( C o C p ) 2 ] [ C o ] × [ C p ] (NMSE ≤ 0.5).
The NMSE measures the scatter of the data and indicates both systematic and random errors. The perfect model should have NMSE = 0 and the acceptable model performance should have NMSE less than 0.5.
3.
Fractional bias (FB): FB = 2 × ( [ C p ] [ C o ] ) [ C o ] + [ C p ] (−0.5 ≤ FB ≤ 0.5).
FB is symmetrical and bounded between −2 and 2; FB = −2 indicates extremely underprediction and FB = 2 indicates extremely overprediction. The perfect model should have FB = 0. The acceptable model performance should have FB in the range between −0.5 and 0.5.
4.
Geometric mean bias (MG): MG = exp([lnCp] − [lnCo]) (0.75 ≤ MG ≤ 1.25).
The MG is suitable to assess datasets with a large range of concentrations, and the perfect model should have MG = 1. The acceptable model performance should have MG in the range between 0.75 and 1.25. Both FB and MG measure the mean bias of the prediction and indicate systematic errors. The FB and MG can also be used to check the over or underprediction of the ISORROPIA II model; FB > 0 and MG > 1 indicate overprediction and FB < 0 and MG < 1 indicate underprediction. In addition, NMSE and MG are not defined for zero values. In this research, FB was used as a proxy for the model performance assessment parameter.

3. Results and Discussion

3.1. Applicability of ISORROPIA II in the Predictions of Gas- and Particle-Phase Pollutants

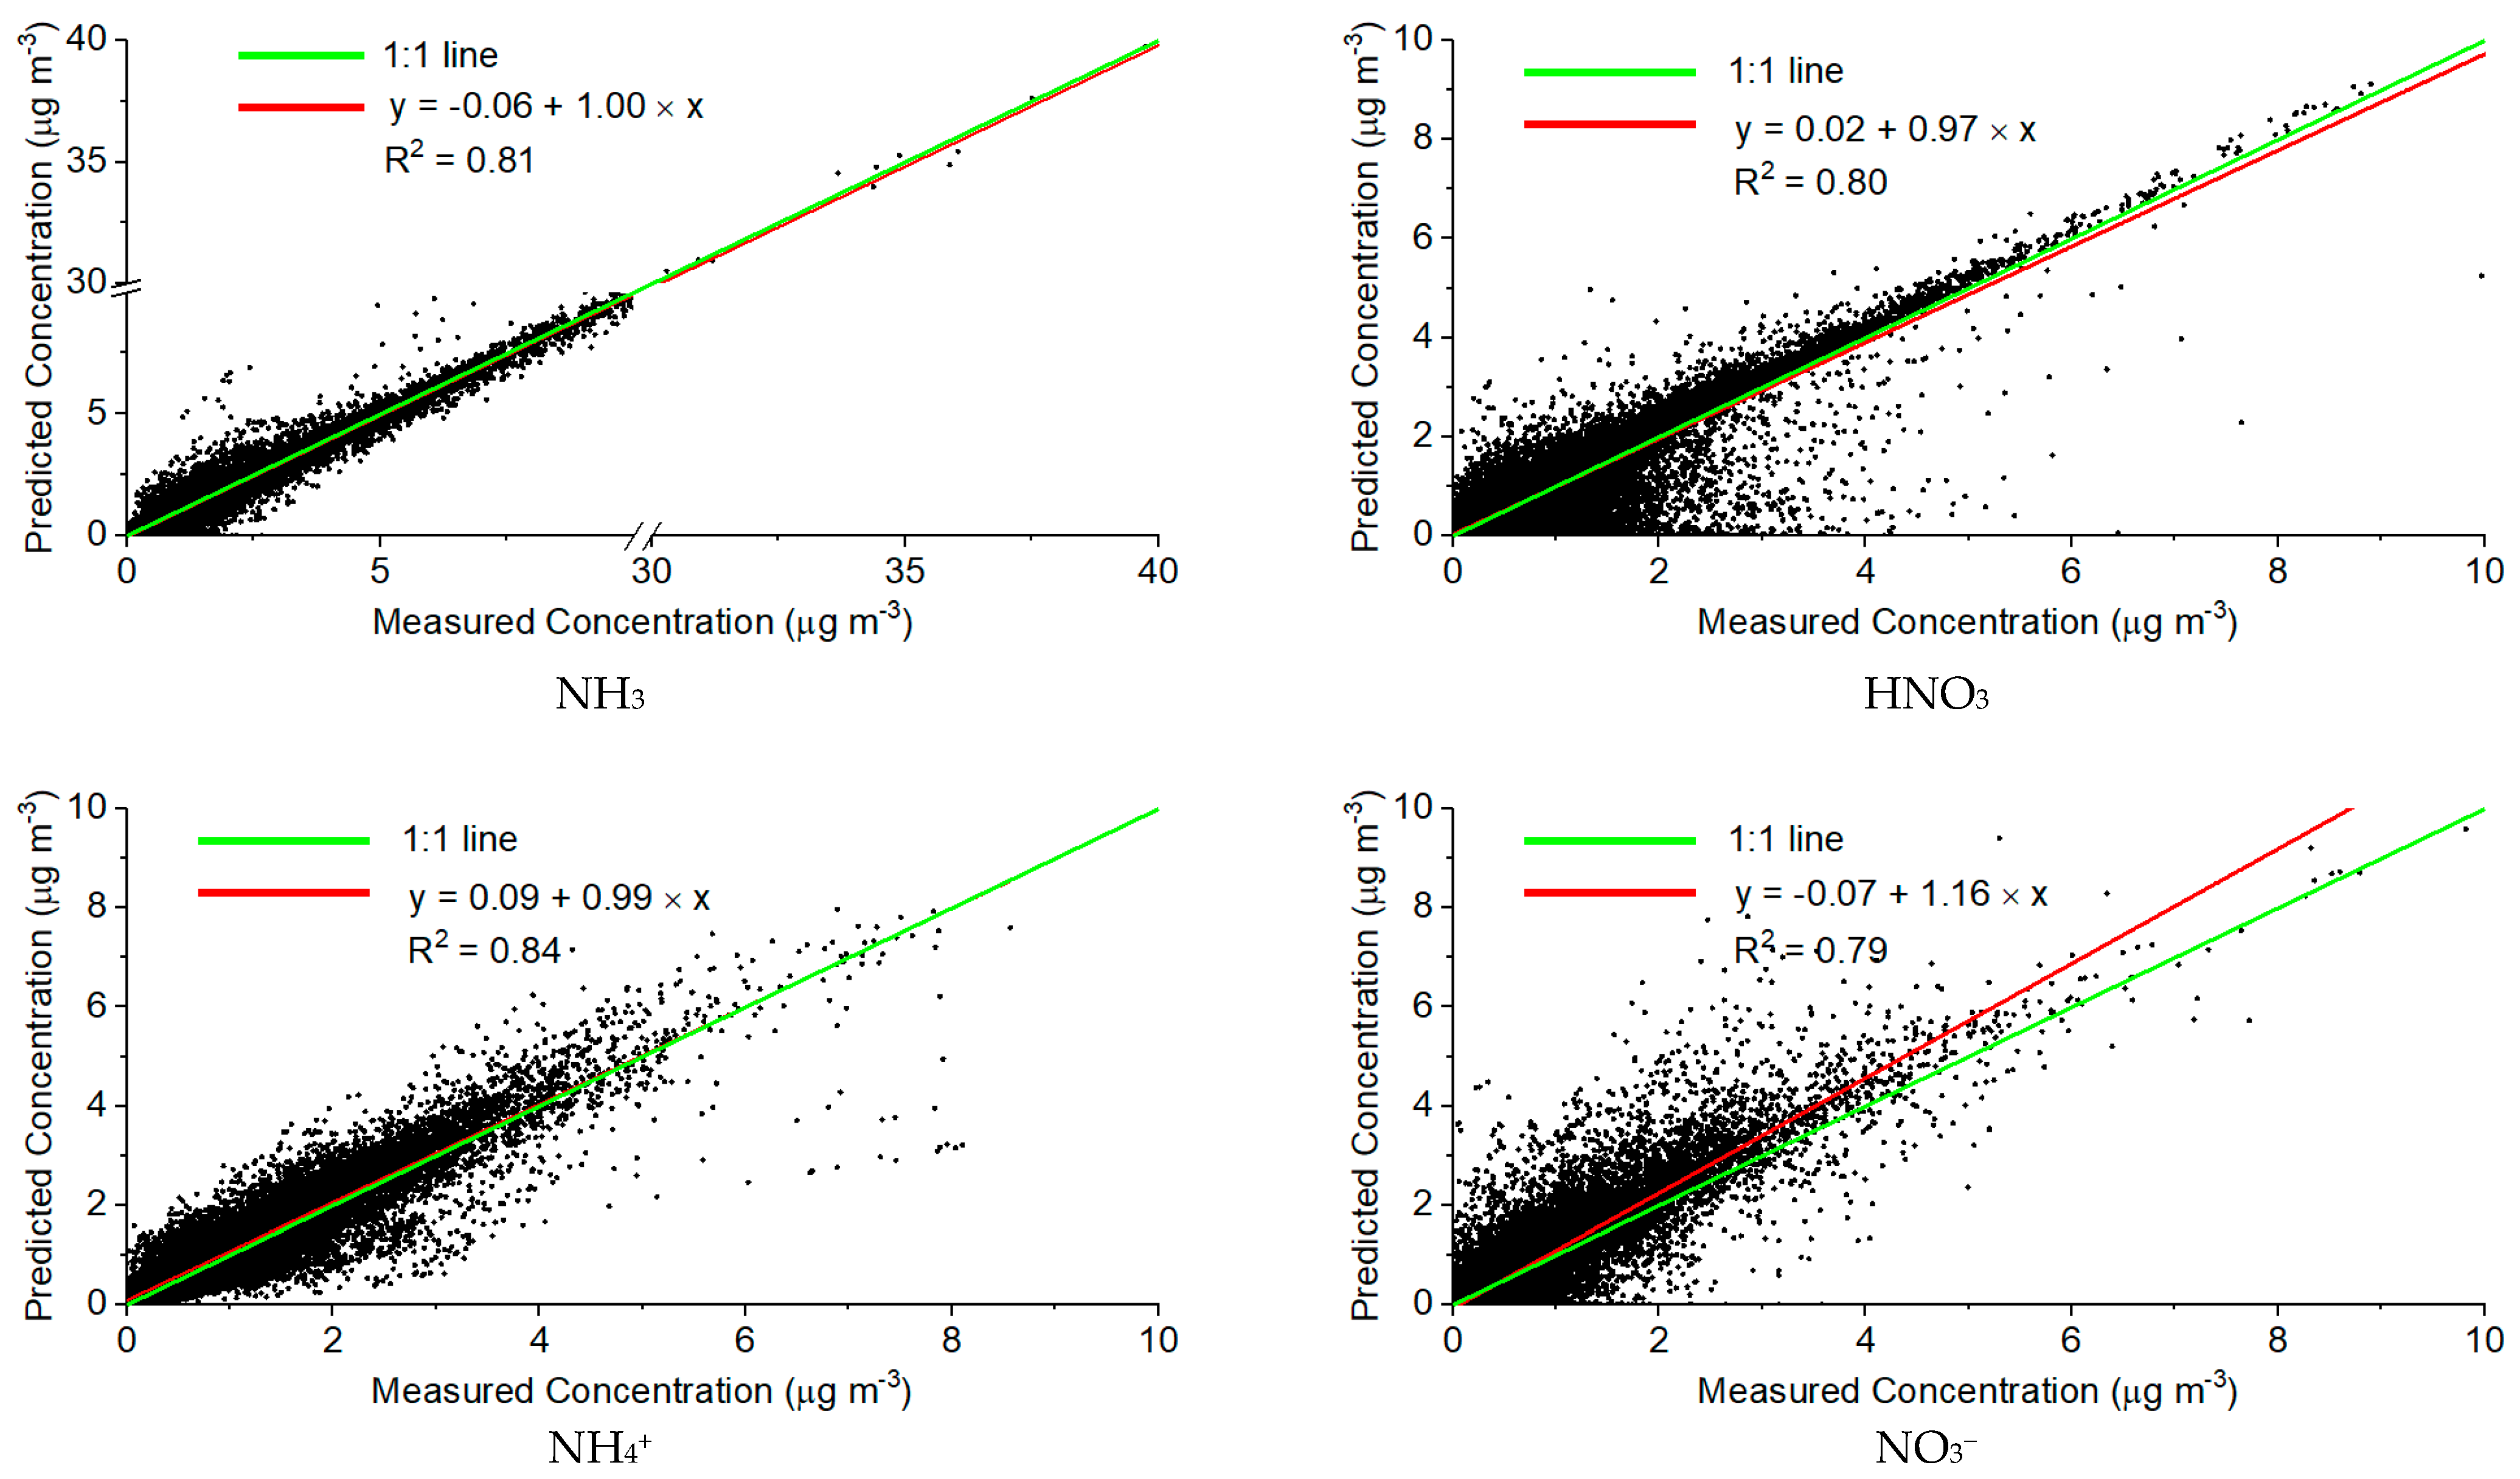
The ISORROPIA II model performance evaluation at the YRK site (2007–2013), JST site (2010–2014), CTR site (2012–2013), BHM site (2011–2013), OAK site (2010), and OLF site (2013) were presented. The model performance assessment exhibits the similar pattern at these six sites; thus, only results at the YRK agricultural–rural site are presented in this paper. The comparison between model predictions and measurements at the YRK site is shown in Figure 2.
As can be seen from Figure 2, in general, the ISORROPIA II model is able to reproduce NH3, HNO3, NH4+, and NO3 concentrations at the YRK site, with R2 values above 0.79. As for NH3 and NH4+, the slopes are 1.00 and 0.99, respectively, which indicate that the ISORROPIA II model predicts NH3 and NH4+ well. However, for HNO3 and NO3, the ISORROPIA II model tends to underpredict HNO3 (slope is 0.97), and overpredict NO3 (slope is 1.16), especially when the measured concentrations of HNO3 and NO3 are below 4 µg m−3. Some disagreement between model prediction and measurements can be observed. In this research, we explore the impact of ambient T and RH, model setups, NVCs, and OA on model performance, and the following sections show the results.

3.1.1. Ambient T-RH, Aerosol pH, and ISORROPIA II Stable and Metastable Setups

The impact of T and RH on model performance exhibits similar results at the six sites. Figure 3, Figure 4 and Figure 5 show the ratios of prediction over observation (Cp/Co) at the YRK site using stable and metastable model setups.
As it can be seen from Figure 3, Figure 4 and Figure 5, under T > 10 °C and RH < 60% conditions, ISORROPIA II model tends to excessively partition N into a gas phase, i.e., to overpredict HNO3 and underpredict NO3. As for the prediction of iPM2.5 (SO42− + NH4+ + NO3), generally, the ISORROPIA II model predicts the concentration of iPM2.5 well; most of the Cp/Co are within the range of 0.8 and 1.2. The accuracy of the prediction of iPM2.5 is determined by three chemical compositions: SO42−, NH4+, and NO3. One of the assumptions made by the ISORROPIA II model is that the vapor pressure of H2SO4 is low; thus, all the H2SO4 partitions into aerosol phase. The ISORROPIA II model always predicts SO42− concentration well; if SO42− accounts for the most of iPM2.5 mass concentration, then the prediction of iPM2.5 is not sensitive to the disagreement between predictions and measurements for NO3 and NH4+. The analyses of the mass closure of PM2.5 in 2001–2016 at the agricultural–rural site, YRK, and industrial–residential site, JST, indicate that iPM2.5 (SO42− + NH4+ + NO3) was the dominant components of PM2.5 mass concentration before 2011, while in 2012–2016, the mass fraction of iPM2.5 was decreased and organic carbon matter (OCM) dominated in PM2.5 mass concentration. Among the three major chemical compositions of iPM2.5, SO42− accounted for greater than 59% of iPM2.5, which may explain the acceptable performance of ISORROPIA II in the prediction of iPM2.5 concentration.
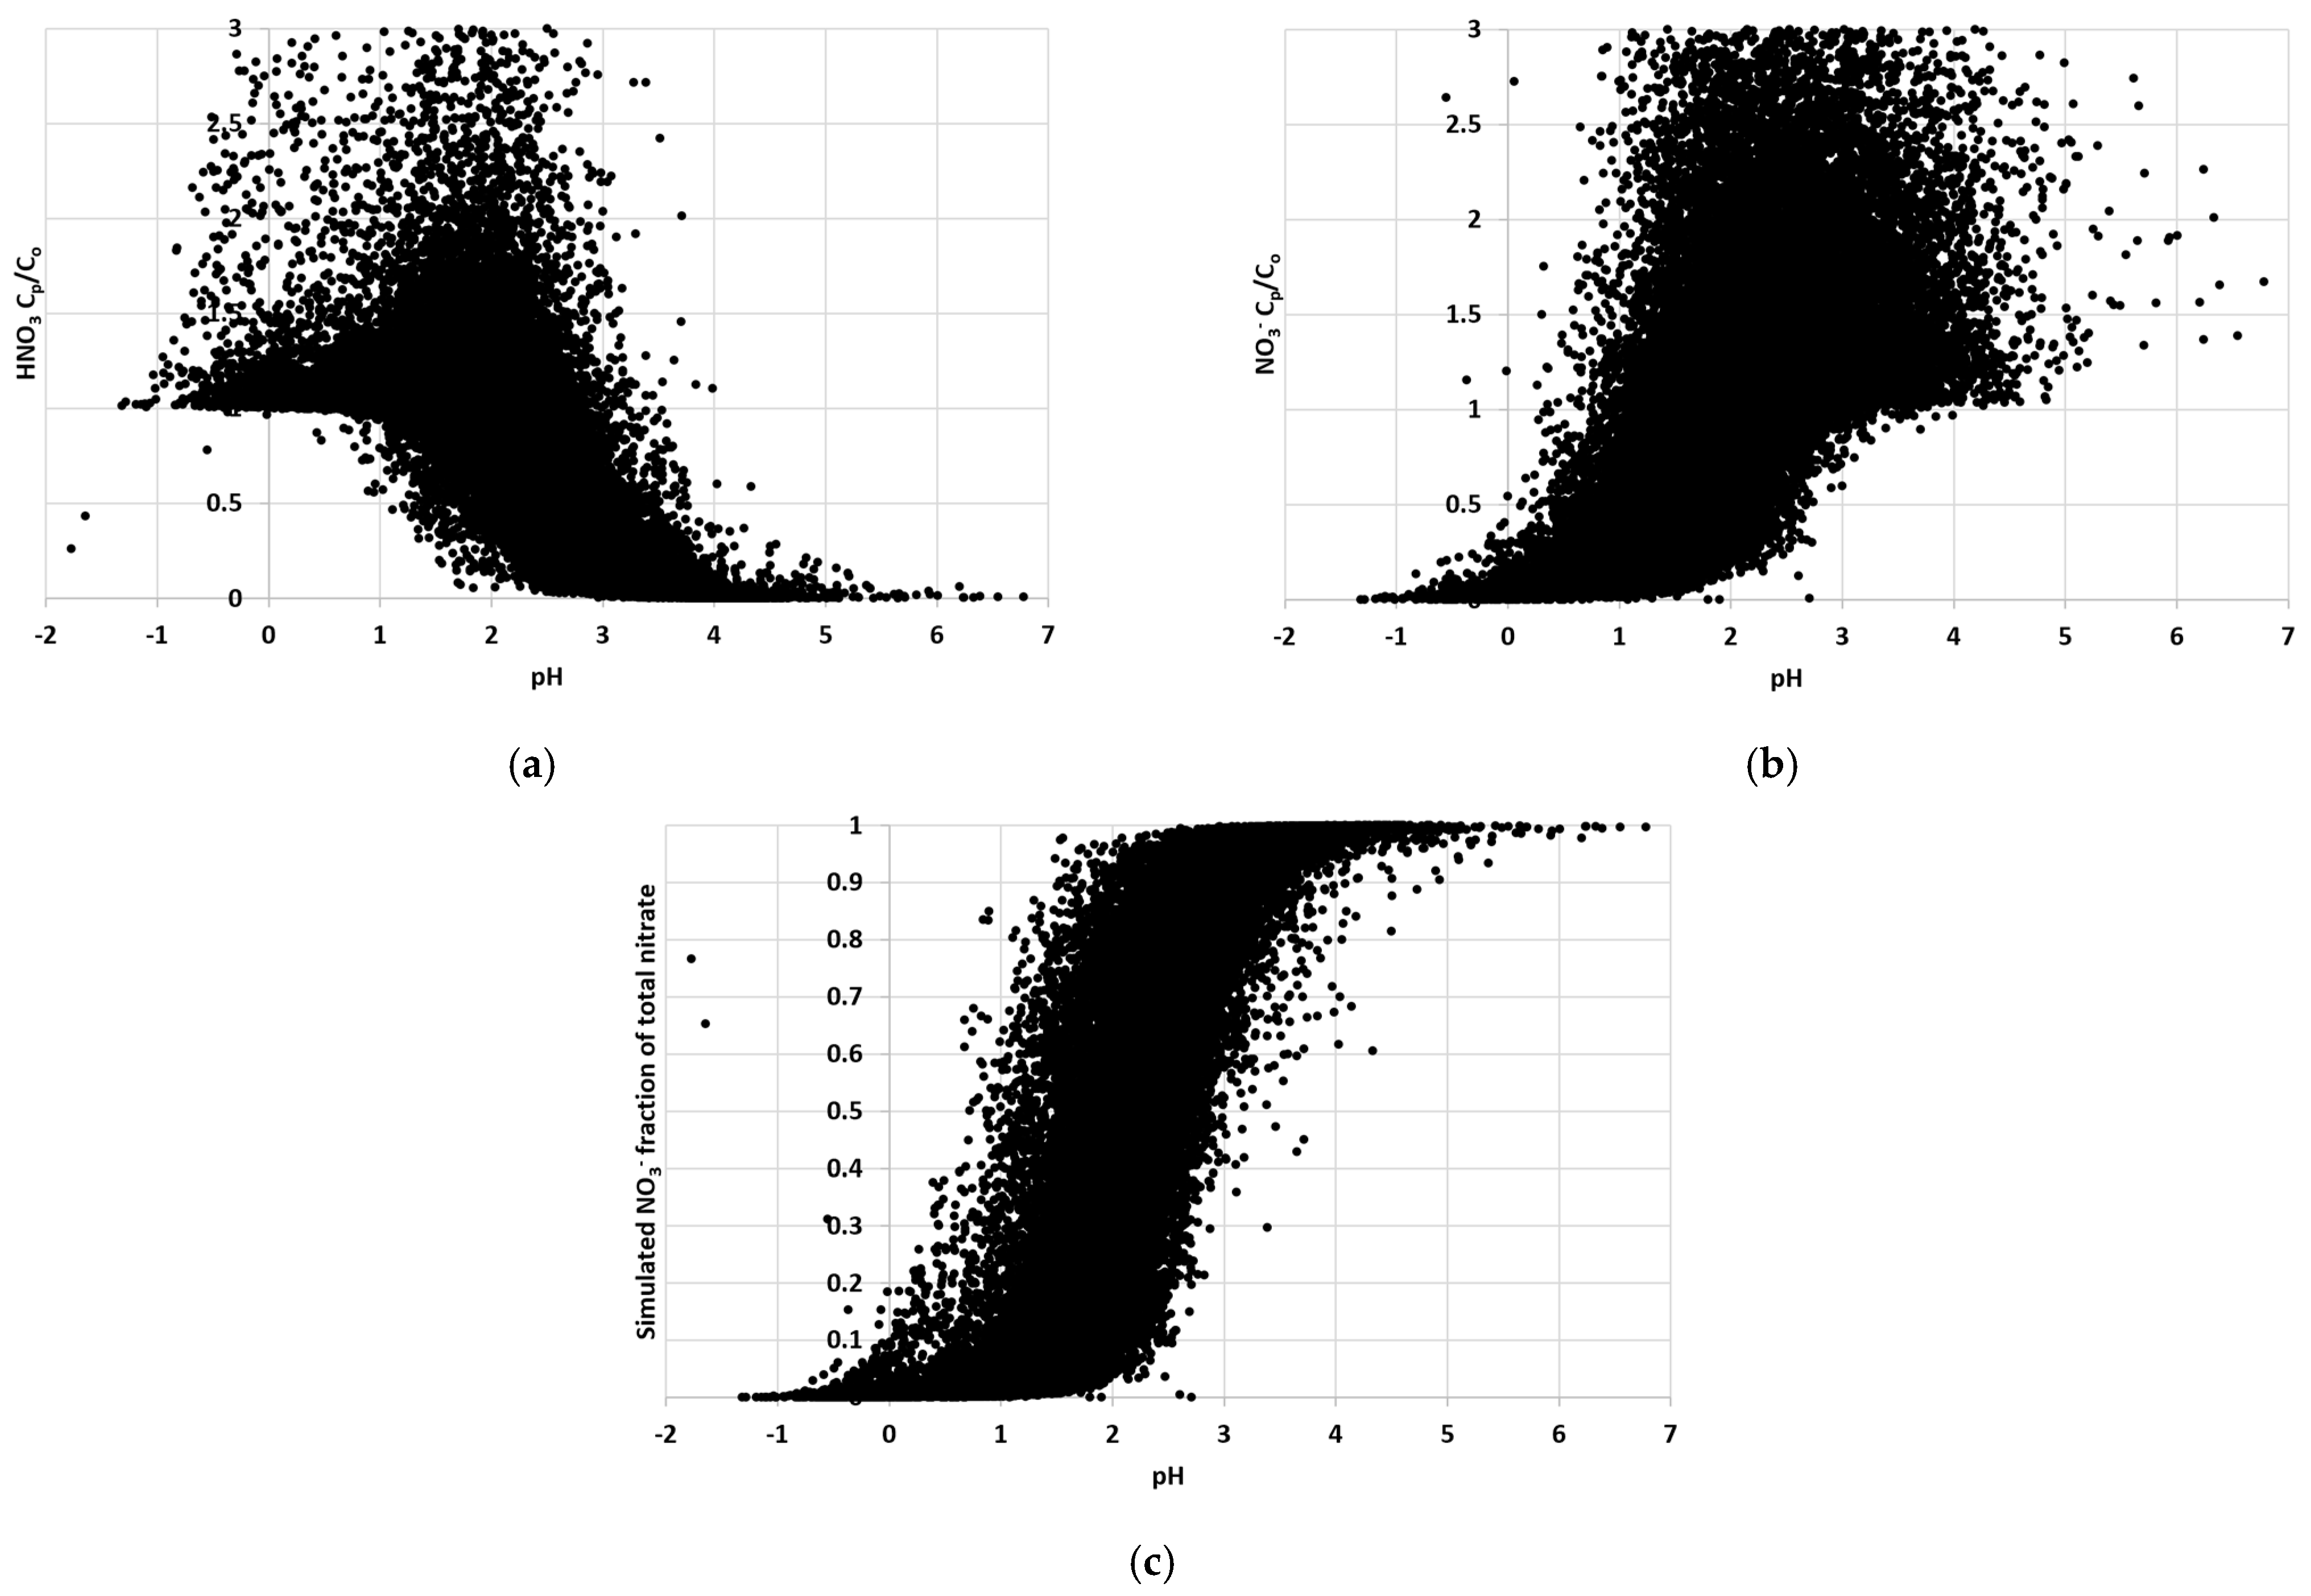
The impact of pH on the under and overprediction of nitrate partitioning was shown below.
As seen in Figure 6a,b, when pH is less than 1, ISORROPIA II tends to overpredict HNO3 and underpredict NO3; when pH is greater than 3, ISORROPIA II tends to underpredict HNO3 and overpredict NO3. The under and overprediction of nitrate partitioning is caused by the sensitivity of the simulated NO3 fraction of total nitrate (ε(NO3)) to the change of pH. As seen in Figure 6c, when pH is less than 1 and greater than 3, ε(NO3) tends not to be sensitive to the change of pH (less than 10% change in ε(NO3)); while when pH is in the range of 1 and 3, the change in pH may have significant impact on the nitrate partitioning. Thus, both under and overprediction of nitrate partitioning is observed when pH is in the range of 1 and 3.

3.1.2. Statistical Tests of Model Performance under Different T-RH Conditions

As for NH3 and NH4+, overprediction and underprediction both happen under all T-RH conditions. To quantitatively assess the performance of ISORROPIA II under different T-RH conditions, under each 5 °C T × 10% RH condition, the model performance (only the values of FB are shown) in the prediction of NH3, NH4+, HNO3, NO3, and iPM2.5 at the YRK site was assessed. The data at the JST site exhibit the similar results; thus, the statistical analysis results at the JST site are not shown here. We only show the values of FB for NO3 prediction with stable setup at the YRK site (Table 2); the results for the other gas- and particle-phase pollutants are in the supplemental material, Tables S1–S5.
For the comparison between the model performance with stable and metastable model setups, four parameters reveal the same conclusion about the selection of model setups under various T-RH conditions. The FB value can not only indicate the model performance, the sign of the value can also indicate over and underpredictions, thus FB is used in the model performance assessment discussion. As it can be seen from Tables S1 and S3, the performance of ISORROPIA II in the prediction of NH3 and NH4+ is generally acceptable. While Table 2 indicates that prediction of HNO3 and NO3 is not satisfactory under certain T-RH conditions, especially under higher T and lower RH conditions, the ISORROPIA II model exhibits worse performance. The prediction of iPM2.5 is acceptable under all T-RH conditions. The model performance in the prediction of HNO3 and NO3 is sensitive to the dominant physical state (gas or aerosol) of HNO3 in ambient air. Under high T (>15 °C) and low RH (<60%) conditions, the ammonium nitrate (NH4NO3) may decompose into gas-phase NH3 and HNO3 due to the semi-volatile characteristic of NH4NO3, leading to the dominance of gas-phase HNO3 [8]; thus, most of the total HNO3 is in gas phase, and the NO3 is more sensitive to the prediction uncertainties. The FB values for NO3 under T > 25 °C and RH < 70% are all negative, as small as −2, which indicates extreme underprediction. While under low T or high RH conditions, HNO3 gas is underpredicted, especially for T < −5 °C or RH > 90%. This can be explained by the fact that, under low T and/or high RH conditions, most of the HNO3 is in particle phase and the prediction of HNO3 gas is more sensitive to prediction uncertainties.
To further investigate the partitioning of NH3-NH4+ and HNO3-NO3, the measured gas-phase NH3 and HNO3 molar fractions under different T-RH conditions are shown in Figure 7.
As for NH3, Table S1 shows that the values of FB are closer to 0 under T > 5 °C than under T < 5 °C, and this indicates that the model performance of ISORROPIA II is better under T > 5 °C than under T < 5 °C. The semi-volatile characteristic of NH4NO3 can lead to greater gas-phase NH3 molar fraction under high T. When the gas-phase NH3 dominates in the partitioning of NH3-NH4+, the NH4+ is more sensitive to prediction uncertainty and vice versa. The model performance in the prediction of NH3 is better under T > 5 °C conditions for both stable and metastable model setups. The predominance of one phase (aerosol or gas) of semi-volatile compounds under certain T-RH conditions can amplify the small errors in the model prediction of the other phase. The variable sensitivities to the prediction errors for gas-phase and particle-phase pollutants are more apparent for the partitioning of HNO3-NO3. As for HNO3, Figure 7 indicates that, under T > 15 °C and RH < 90% conditions, most of the HNO3 stays in the gas phase. The particle-phase NO3 only accounts for a small fraction of total available HNO3; the mass conservation of the HNO3 renders the NO3 concentration more sensitive to the uncertainties in the prediction. On the contrary, under T < 5 °C conditions, most of the HNO3 stays in particle phase, the mass conservation of the HNO3 renders the HNO3 gas concentration more sensitive to the uncertainties in the prediction. The dependence of the partitioning of HNO3-NO3 on the T and RH makes the prediction of NO3 tougher than the other chemical compositions of iPM2.5.
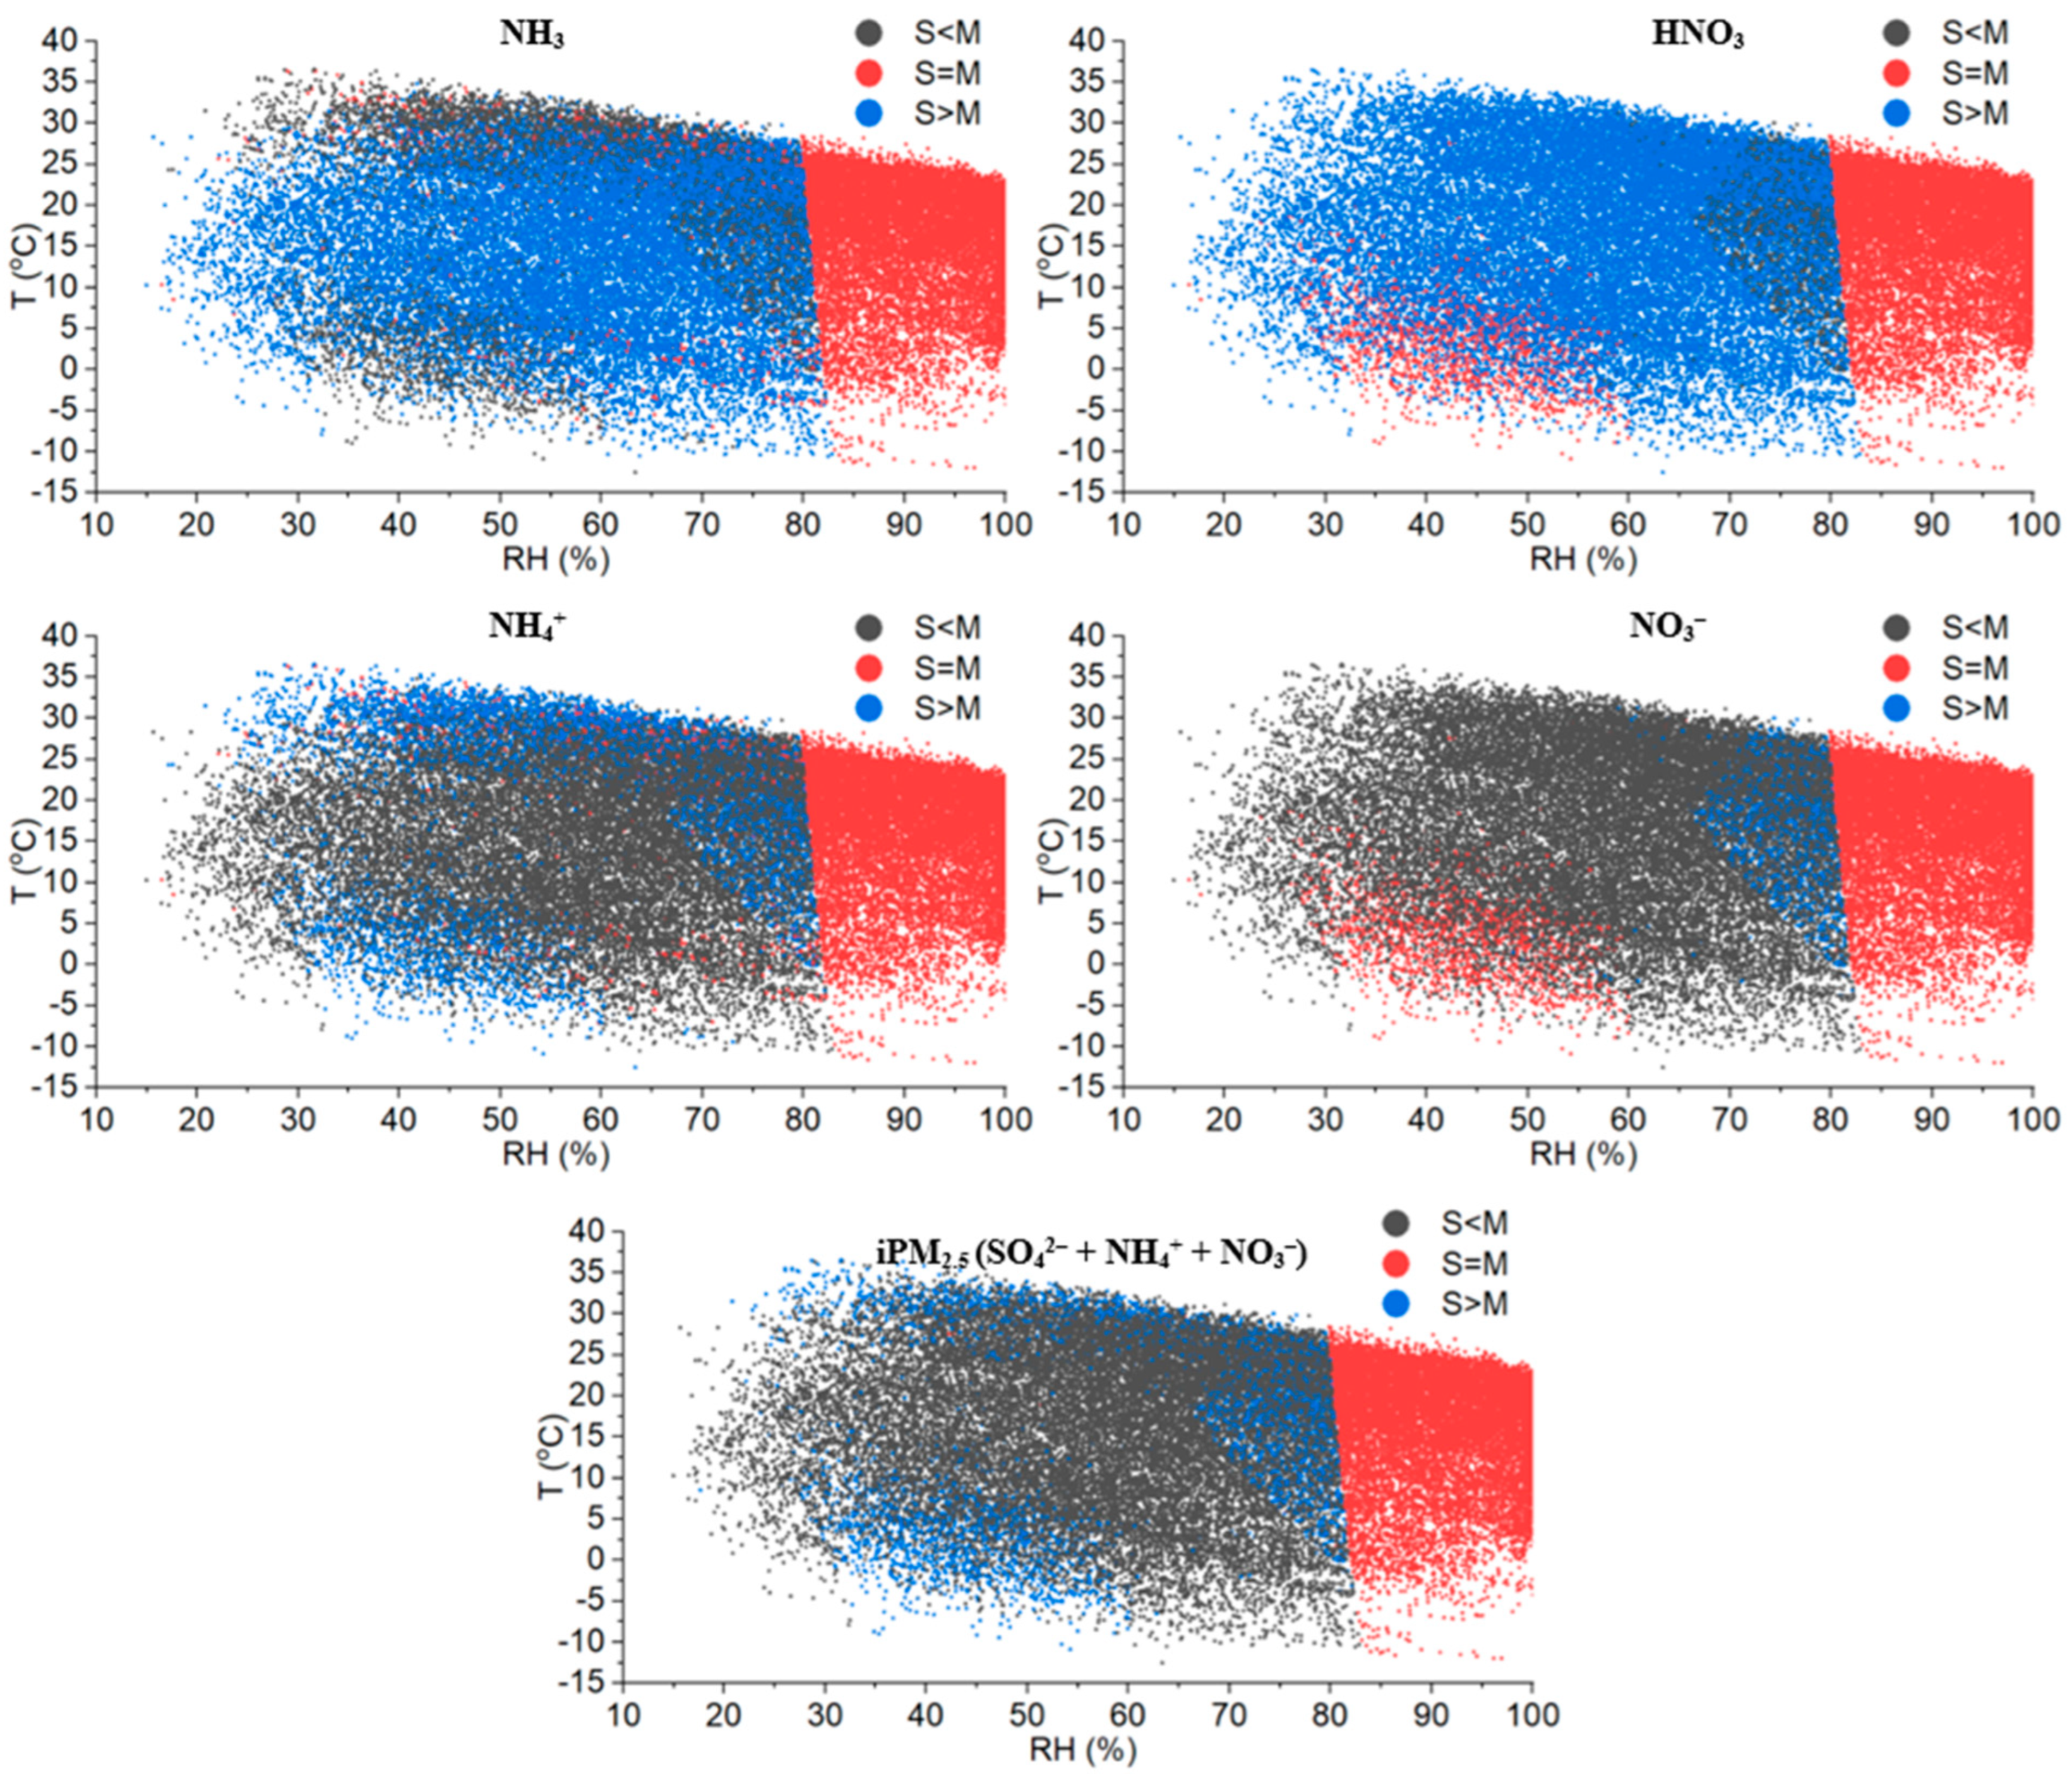
According to Ansari and Pandis (2000) and Fountoukis et al., (2009) [32,54], under different T-RH conditions, the metastable and stable model setups may have different performances in the prediction of NH3, HNO3, NH4+, NO3, and iPM2.5 (SO42− + NH4+ + NO3). The differences of predictions using stable and metastable model setups are shown in Figure 8.
As can be seen from Figure 8, under high RH (RH > 83%) conditions, there is no difference for model prediction of NH3, HNO3, NH4+, NO3, and iPM2.5 (SO42− + NH4+ + NO3) between the stable and metastable model setups. The high RH facilitates the absorption of water vapor to the iPM2.5 particles; the particle always stays in the aqueous phase and there is no salts precipitation. Thus, the prediction of the stable and the metastable setups is the same. However, Tables S1–S4 indicate that, under certain T-RH conditions, stable and metastable model setups may have different performances in the prediction of NH3, HNO3, NH4+, NO3, and iPM2.5. Under T > 10 °C and RH < 60% conditions, the ISORROPIA II model with metastable setup tends to perform better in the prediction of NH3, HNO3, NH4+, NO3, and iPM2.5. Under T < 5 °C and RH < 90% conditions, the ISORROPIA II model with stable setup tends to perform better in the prediction of NH3, HNO3, NH4+, NO3, and iPM2.5. This can be explained by the difference in the prediction of the partitioning of NH3-NH4+ and HNO3-NO3 by stable and metastable model setups.
As for NH4+, when RH < 80%, the prediction of NH4+ can be divided into four regions based on the difference between stable and metastable model setups. When T > 25 °C, 70% < RH < 80%, or T < 5 °C, the NH4+ prediction of stable setup tends to be either greater or smaller than the metastable setup. When 5 °C < T < 25 °C and RH < 70%, the NH4+ prediction of stable setup tends to be smaller than the metastable setup. As for NO3, when RH < 80%, the prediction of NO3 can be divided into three regions based on the difference between stable and metastable model setups. When 70% < RH < 80%, the NO3 prediction of stable setup tends to be either greater or smaller than the metastable setup. When RH < 70%, the NO3 prediction of stable setup tends to be either equal to or smaller than the metastable setup. Thus, the selection of stable and metastable model setups depends on ambient T and RH at the location.
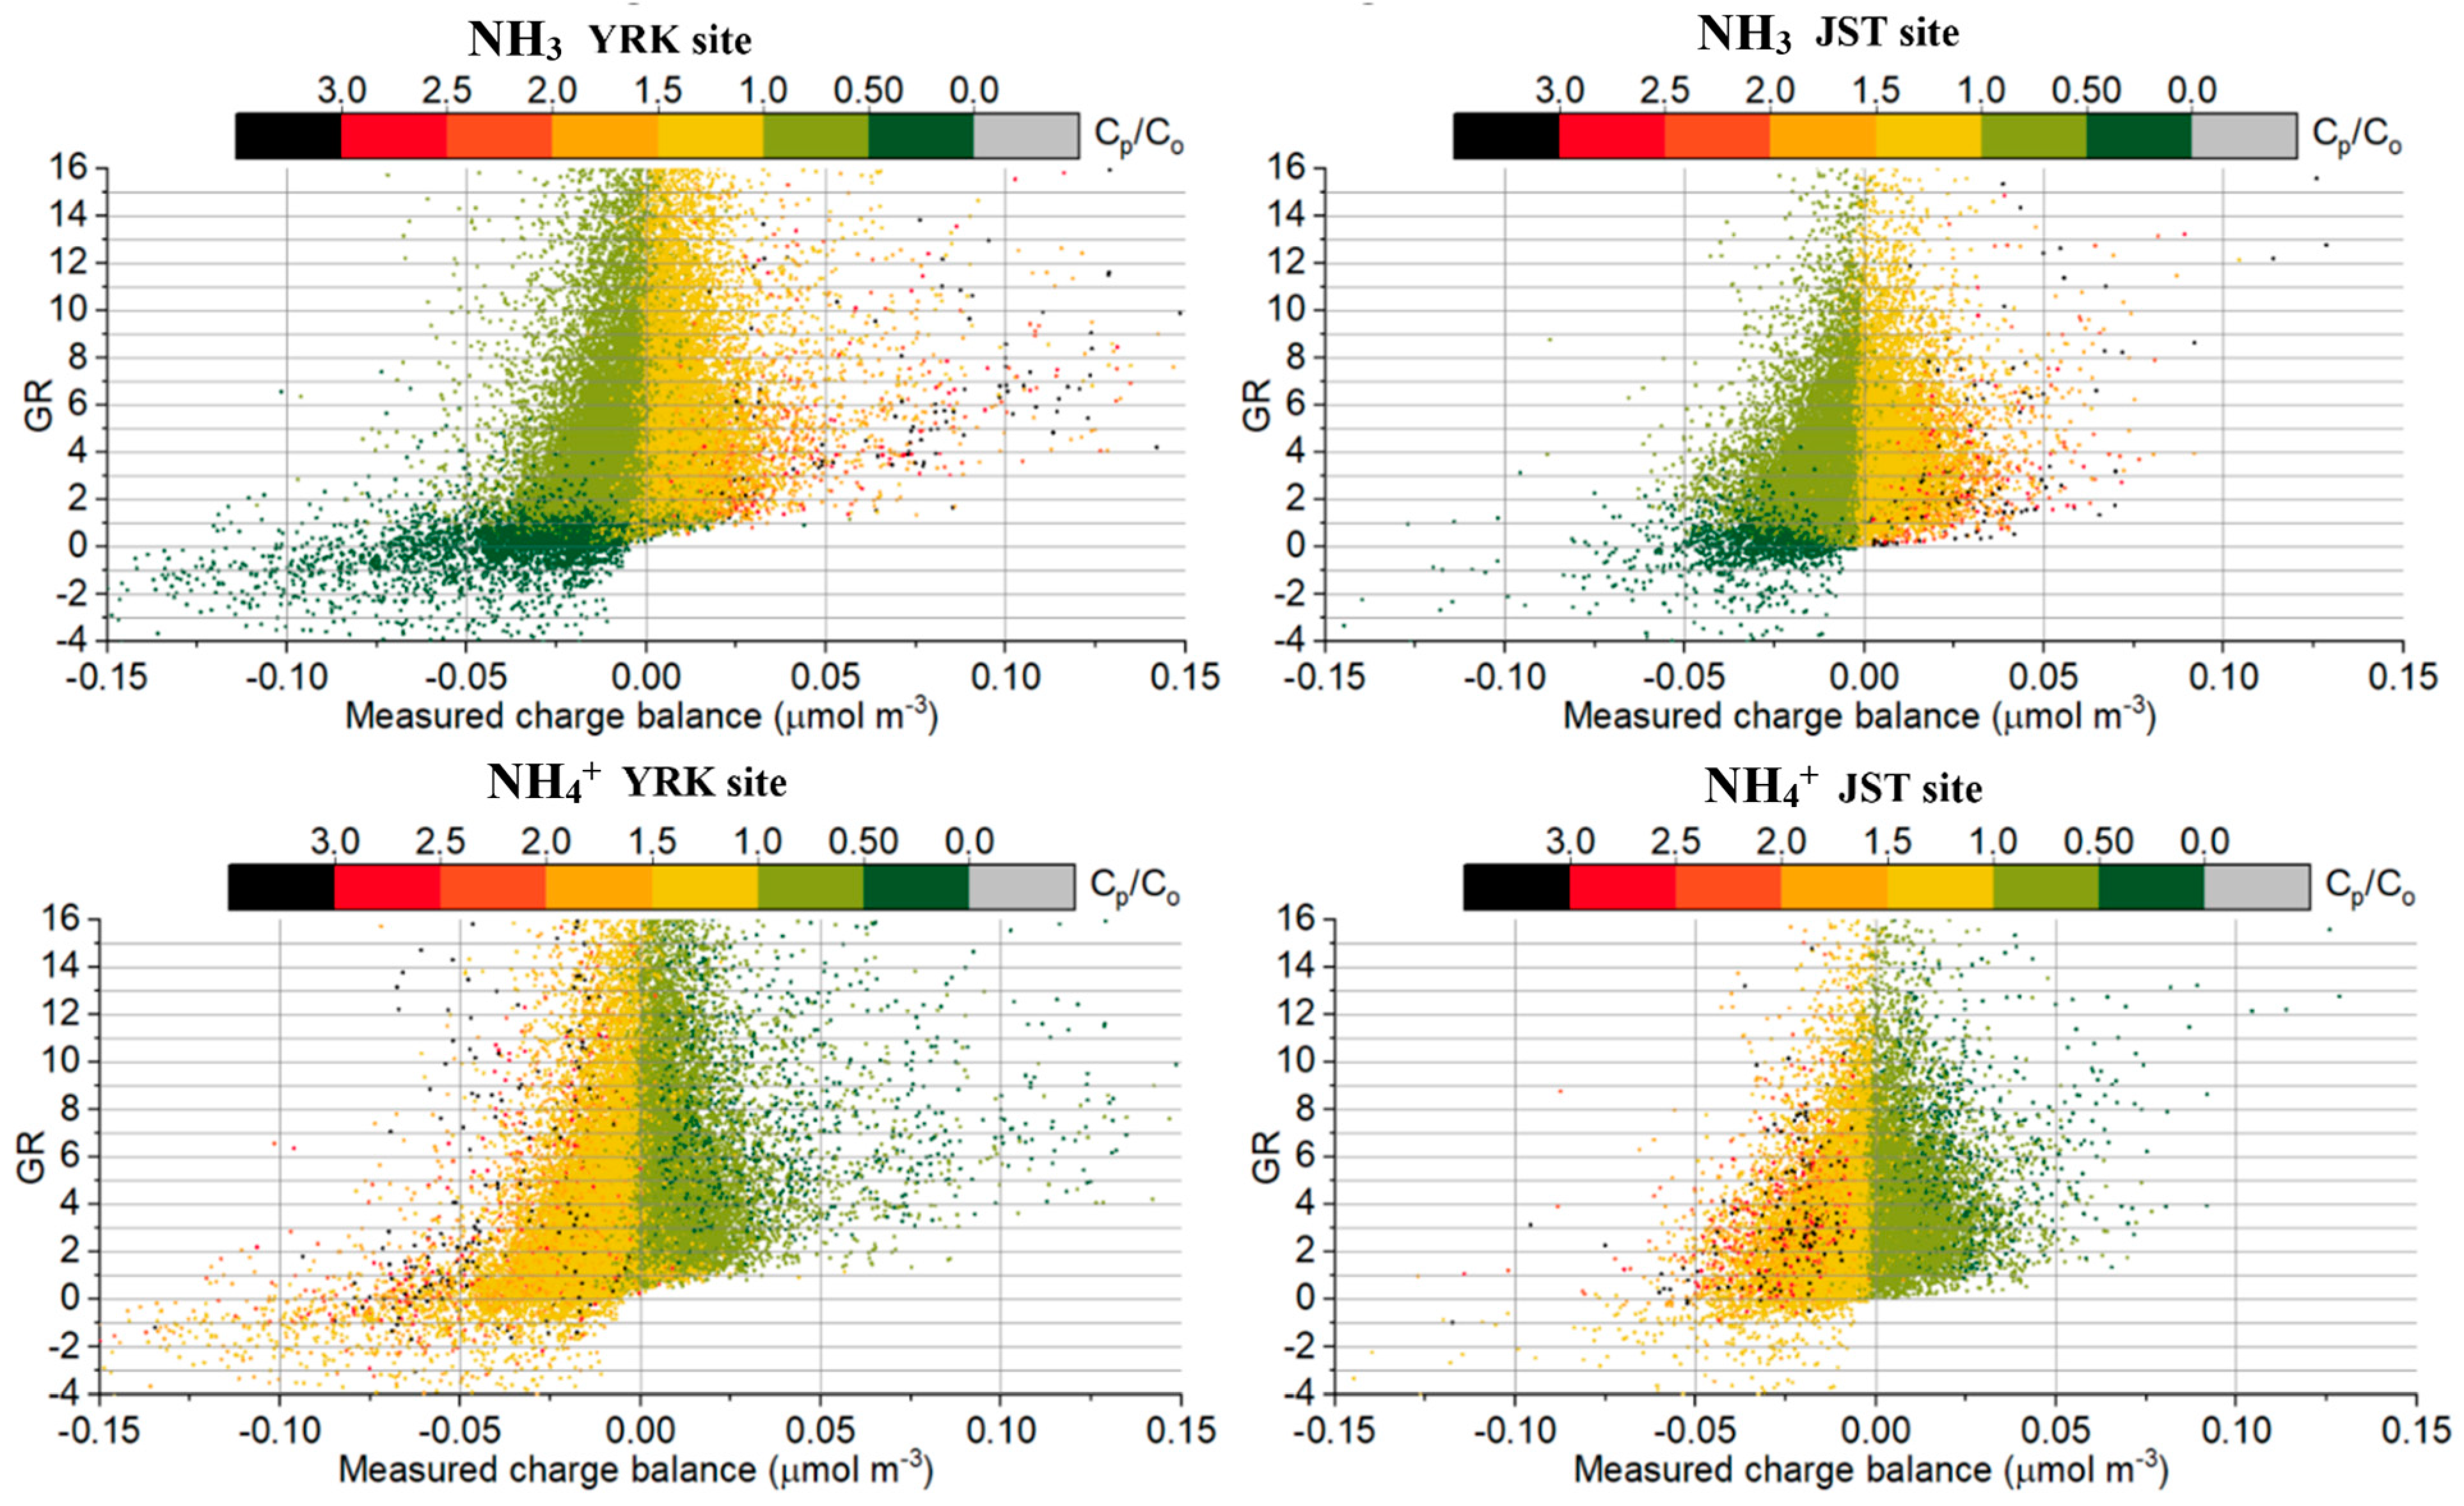
The model performance of ISORROPIA II in simulating NH3 and NH4+ under different GRs and measured charge balance is shown in the Figure 9.
As can be seen from Figure 9, when the measured charge balance is negative, the NH3 is underpredicted and NH4+ is overpredicted; when GR < 1, the NH3 is underpredicted to a greater degree; when the measured charge balance is positive, the NH3 is over predicted and NH4+ is underpredicted. In ambient air, the charge balance [NH4+] − 2 × [SO42−] − [NO3] is equal to [OH] − [H+] + [organic anion] + [Cl] − [K+] − [Na+] − 2 × [Ca2+] − 2 × [Mg2+]. However, only total NH3, total HNO3, and total H2SO4 are the input data for ISORROPIA II in this research. In the model, the charge balance [NH4+] − 2 × [SO42−] − [NO3] is equal to [OH] − [H+]. Therefore, several possible reasons may explain the phenomena of over and underpredictions of NH3 and NH4+:
  • The measurement uncertainties in total H2SO4 may explain part of the disagreement between predictions and measurements. Zhang et al., (2002) used 5 min measurements of iPM2.5 chemical compositions and their precursor gases to test the validity of the thermodynamic equilibrium assumption for the partitioning of NH3-NH4+ [33]. Good agreement was found between field measurements and ISORROPIA II predictions in NO3 and NH4+ when ~15% downward correction in SO42− concentration was applied. Yu et al., (2005) used different time resolution (5 min, 2 h, and 12 h) measurements of NH3, NH4+, HNO3, NO3, and SO42− to assess the ability of ISORROPIA II in the prediction of HNO3-NO3 partitioning. The sensitivity test indicated that the measurement uncertainties in the SO42− and total NH3 concentrations may explain the errors in the prediction of NO3 [34].
  • The positive measured charge balance may be explained by the fact that part of the NH4+ cations are associated with organic anions, which the ISORROPIA II model does not consider in the modeling system. In addition, NH4+ cations may also be associated with Cl, which is not incorporated in the model input; the negative measured charge balance may be explained by the exclusion of the NVCs in the modeling system. Metzger et al., (2006) investigated the partitioning of NH3–NH4+ and HNO3–NO3 using three thermodynamic models [55], the model performance was assessed with/without the inclusion of NVCs and organic acid (R-COOH) in the input data. The comparison between model prediction and observations indicated that it is necessary to include NVCs and R-COOH in the model input of a thermodynamic model to accurately predict the gas-particle partitioning of NH3-NH4+ and HNO3-NO3.
To further investigate the over and underprediction of gas-phase and particle-phase pollutants, the impact of NVCs on the model performance of ISORROPIA II was assessed.

3.1.3. Nonvolatile Cations (NVCs)

The comparisons between model predictions and measurements for particle-phase NH4+ and NO3 at the YRK site are shown in Figure S1. As for daily measurements of particle-phase pollutants, in general, ISORROPIA II is able to reproduce the concentrations of NH4+ and NO3; thus, factorial ANOVA statistical analysis is then used to check if NVCs (with/without nonvolatile cations) and model setups (stable/metastable setups) have significant impact on the prediction of NH3, HNO3, NH4+, NO3, and iPM2.5. Only the data analysis results at the YRK site are shown in Table S6. Model setups and NVCs have variable impacts on the predictions of gas-phase and particle-phase pollutants. For NH3 prediction, only NVCs have significant impact on the model performance. For NO3 prediction, only model setup has significant impact on the model performance. For HNO3, NH4+, and iPM2.5 predictions, both NVCs and model setup have significant impact on the model performance.
To quantitatively assess the impact of NVCs and model setups on the model performance, Fa2 and FB values are calculated for model assessment at the YRK site (Table S7). Based upon the FB values, inclusion of NVCs into the modeling framework and stable model setup has a better performance in the prediction of NH3, HNO3, NH4+, NO3, and iPM2.5 concentrations at the YRK site. Statistical summary of T and RH data at the YRK site indicates that, in the total 467 data points for the ISORROPIA II model assessment, 81 data points were under the T > 10 °C and RH < 60% conditions, under which the metastable model setup has the better performance. In addition, 67 data points were under RH > 83% condition, under which the performance of the model with stable and metastable setups is the same. The other data points were under conditions in which the stable setup has the better performance. This may indicate the preference of stable model setup at the YRK site. This finding is consistent with the study performed by [36], in which 6 h measurements of NH3, HNO3, NH4+, NO3, and SO42− were used to assess the performance of ISORROPIA, and it was found that the inclusion of NVCs as equivalent Na+ can improve the model performance in the prediction of NO3 concentration. Therefore, the inclusion of the NVCs into the model framework is necessary to accurately simulate the thermodynamic equilibrium partitioning of NH3-NH4+.

3.1.4. Organic Aerosol (OA)

The relationships between the molar ratio-R and OA/SO42− mass ratio at the YRK and JST sites are shown in Figure S2. There is a weak correlation between molar ratio-R and OA/SO42− mass ratio, R2 = 0.09, and 0.17 at the YRK and JST sites, respectively; the molar ratio-R slightly tends to decrease with OA/SO42− mass ratio. As shown in Figure S2, no definite conclusion can be made about the impact of OA on the thermodynamic equilibrium partitioning of NH3-NH4+. The higher OA/SO42− mass ratio may indicate the lower probability for the uptake of NH3 by H2SO4. However, in this research, only a weakly negative correlation between molar ratio-R and OA/SO42− mass ratio can be observed. One explanation may be that the daily data itself cannot adequately detect the impact of OA on the equilibrium process of NH3-NH4+ partitioning. Other factors such as T and RH can also affect the equilibrium process, while the coarse resolution of daily measurement cannot detect the variable sensitivities of the equilibrium process to the impacts of different factors. Thus, higher time resolution data such as 5 min data may be required to detect the impact of OA on the formation of iPM2.5.

3.2. Possible Reasons for the Disagreement between Model Predictions and Measurements

In assessment of the ISORROPIA II model performance under different T-RH-model setups conditions, it is discovered that ambient T and RH, model setups, and NVCs have significant impacts on model prediction. The inclusion of NVCs in the ISORROPIA II input is necessary to improve the model performance. Under certain T and RH conditions, ISORROPIA II tends to over or underpredict specific gas-phase or particle-phase pollutants. The stable and metastable model setups may also perform differently under different T-RH conditions. The impact of OA on the equilibrium assumption may not be detected by daily measurements; further research is needed to study the impact of OA on the equilibrium partitioning of NH3–NH4+. The disagreement between model prediction and field measurements may be due to the following reasons:
  • The hourly and daily data were used in this research to assess the performance of the ISORROPIA II model. The duration of the daily input data may not be adequate to detect the impact of atmospheric transport and ambient T and RH on the thermodynamic equilibrium partitioning of NH3-NH4+. Thus, the daily data of NH3, HNO3, T, and RH may not be able to represent the thermodynamic equilibrium state of the gas-particle partitioning process.
  • The gas-particle system was not in a chemical equilibrium state. The mixture of PM1 and PM1–2.5 in secondary iPM2.5 may hinder the applicability of the ISORROPIA II model. The simple thermodynamic equilibrium assumption for iPM2.5 may not adequately characterize the partitioning of NH3-NH4+ in ambient air.
  • The inorganic PM2.5 particles were assumed to be internally mixed; therefore, the particles were treated as an ensemble bulk. However, Koo et al., (2003) observed that dynamic model may perform better in the prediction of iPM2.5 chemical compositions. The dynamic change of particle size distribution may require vigorous treatment of different physical processes such as condensation, evaporation, and coagulation. The size-resolved measurements with high time resolution are not available in this research, thus the dynamic approach cannot be tested.
  • Field measurement uncertainty. These uncertainties can be divided into two aspects: the measurement uncertainties caused by instruments and techniques, and the uncertainties caused by the atmospheric transport of air mass. The values below the instrument’s detection limit were included in the ISORROPIA II model assessment; this may cause some disagreement between model predictions and measurements. The small values are especially sensitive to the prediction uncertainty. In addition, the ideal assessment of ISORROPIA II prediction skill should be based on the high time resolution measurements under controlled conditions. Furthermore, the thermodynamic equilibrium models should simulate the equilibrium partitioning of NH3-NH4+ and HNO3-NO3 happening in the same air parcel. While in the field, air parcels laden with different concentrations of gas-phase and particle-phase pollutants may travel from and to any direction. Thus, the average measurements in one hour or day may not represent the thermodynamic equilibrium state of the same air parcel.
  • The history of RH experienced by air mass from different wind directions is not a priori; thus, the decision regarding the selection of stable and metastable setups is quite difficult, and this may also add some uncertainties to the model simulation.
Although the ISORROPIA II performance in the prediction of iPM2.5 concentration under all T-RH conditions is acceptable in the southeast U.S. due to the dominance of SO42− in the iPM2.5 concentration, it may perform differently in other regions where SO42− is not dominant in the iPM2.5 concentration. The PM2.5 chemical compositions varied in spatial and temporal scales in the U.S. The PM2.5 chemical compositions such as SO42− and NO3 exhibited inverse seasonal variation patterns in the eastern and western coastal areas of U.S.; SO42− exhibited a spatial heterogeneity with higher mass fraction in the eastern U.S. and lower mass fraction in California [56,57,58]. Thus, the model performance of ISORROPIA II in the prediction of iPM2.5 may differ according to the spatial scale.

4. Conclusions

Based on the hourly and daily measurements of gas-phase and particle-phase pollutants at the SEARCH Network, the performance of ISORROPIA II was assessed under different T-RH, model setups, and NVCs conditions. The impact of OA on the thermodynamic equilibrium partitioning of NH3-NH4+ was also evaluated. Ambient T and RH, model setups, and NVCs have significant impact on model prediction. The inclusion of NVCs in the ISORROPIA II input is necessary to improve the model performance. Under high T (>10 °C) and low RH (<60%) conditions, ISORROPIA II tends to overpredict HNO3 concentration and underpredict NO3 concentration. The predominance of one phase (aerosol or gas) of a semi-volatile compound can amplify the small errors in the model prediction of the other phase. The model with stable and metastable setups may also perform differently under different T-RH conditions. Metastable model setups might perform better under high T (>10 °C) and low RH (<60%) conditions, while stable model setups might perform better under low T (<5 °C) conditions. Under high RH (RH > 83%) conditions, there is no difference in the model performance with stable and metastable setups. The dominance of SO42− in the iPM2.5 concentration may explain the acceptable model performance of ISORROPIA II in the prediction of iPM2.5 under all T-RH conditions. Furthermore, higher resolution data may be required to investigate the impact of OA on the thermodynamic equilibrium partitioning of NH3-NH4+. This research provides systematic assessment of the ISORROPIA II model under different conditions. Future studies using ISORROPIA II for the prediction of partitioning of NH3-NH4+ and HNO3-NO3 should consider the inclusion of NVCs, the under/overprediction of NO3/HNO3, the selection of stable/metastable model setups under different T-RH conditions, and spatiotemporal variations of iPM2.5 chemical compositions.

Supplementary Materials

The following supporting information can be downloaded at: https://www.mdpi.com/article/10.3390/atmos13121977/s1, Figure S1: The comparison of prediction and observation for NH4+ and NO3− at the YRK site; Figure S2: The relationships between molar ratio-R and OA/SO42− mass ratio at the YRK and JST sites; Table S1: Model performance assessment for NH3 prediction with stable and metastable setups at the YRK site; Table S2: Model performance assessment for HNO3 prediction with stable and metastable setups at the YRK site; Table S3: Model performance assessment for NH4+ prediction with stable and metastable setups at the YRK site; Table S4: Model performance assessment for NO3− prediction with metastable setups at the YRK site; Table S5: Model performance assessment for iPM2.5 prediction with stable and metastable setups at the YRK site; Table S6: Factorial ANOVA test results at the YRK site; Table S7: Model performance of ISORROPIA II at the YRK site.

Author Contributions

Conceptualization, B.C. and L.W.-L.; methodology, B.C. and L.W.-L.; formal analysis, B.C., J.C., P.B. and L.W.-L.; writing—original draft preparation, B.C.; writing—review and editing, B.C. and L.W.-L.; funding acquisition, L.W.-L. All authors have read and agreed to the published version of the manuscript.

Funding

This study was supported in part by NSF Award No. CBET-1804720.

Institutional Review Board Statement

Not applicable.

Informed Consent Statement

Not applicable.

Data Availability Statement

Data are available upon request from Eric Edgerton, all the data are extracted from SEARCH program Dropbox link: https://www.dropbox.com/sh/o9hxoa4wlo97zpe/AACbm6LetQowrpUgX4vUxnoDa?dl=0 (accessed on 21 November 2022).

Acknowledgments

Great thanks to Eric Edgerton from ARA, Inc. for providing the SEARCH program data. We also want to express our gratitude to Nicholas Meskhidze for his important revision advice.

Conflicts of Interest

The authors declare no conflict of interest.

References

  1. USEPA. Health and Environmental Effects of Particulate Matter. Available online: https://www.epa.gov/pm-pollution/health-and-environmental-effects-particulate-matter-pm (accessed on 31 October 2022).
  2. Pui, D.Y.H.; Chen, S.; Zuo, Z. PM2.5 in China: Measurements, sources, visibility and health effects, and mitigation. Particuology 2014, 13, 1–26. [Google Scholar] [CrossRef]
  3. Xing, Y.; Xu, Y.; Lian, Y. The impact of PM2.5 on the human respiratory system. J. Thorac. Dis. 2016, 8, E69–E74. [Google Scholar] [CrossRef] [PubMed]
  4. Allen, A.G.; Harrison, R.M.; Erisman, J.-W. Field measurements of the dissociation of ammonium nitrate and ammonium chloride aerosols. Atmos. Environ. 1989, 23, 1591–1599. [Google Scholar] [CrossRef]
  5. Hildemann, L.M.; Russell, A.G.; Cass, G.R. Ammonia and nitric acid concentration in equilibrium with atmospheric aerosols: Experiment vs. theory. Atmos. Environ. 1984, 18, 1737–1750. [Google Scholar] [CrossRef] [Green Version]
  6. Stelson, A.W.; Seinfeld, J.H. Relative humidity and temperature dependence of the ammonium nitrate dissociation constant. Atmos. Environ. 1982, 16, 983–992. [Google Scholar] [CrossRef]
  7. Shiraiwa, M.; Zuend, A.; Bertram, A.K.; Seinfeld, J.H. Gas-particle partitioning of atmospheric aerosols: Interplay of physical state, non-ideal mixing and morphology. Phys. Chem. Chem. Phys. 2013, 15, 11441–11453. [Google Scholar] [CrossRef] [Green Version]
  8. Seinfeld, J.H.; Pandis, S.N. Atmospheric Chemistry and Physics: From Air Pollution to Climate Change; John Wiley & Sons: New York, NY, USA, 2016; ISBN 978-1-118-94740-1. [Google Scholar]
  9. Cheng, B.; Wang-Li, L.; Meskhidze, N.; Classen, J.; Bloomfield, P. Partitioning of NH3-NH4+ in the Southeastern U.S. Atmosphere 2021, 12, 1681. [Google Scholar] [CrossRef]
  10. Saxena, P.; Hudischewskyj, A.B.; Seigneur, C. A comparative study of equilibrium approaches to the chemical characterization of secondary aerosols. Atmos. Environ. 1986, 20, 1471–1483. [Google Scholar] [CrossRef]
  11. Tanner, R.L.; Marlow, W.H.; Newman, L. Chemical composition correlations of size-fractionated sulfate in New York City. Am. Chem. Soc. 1979, 13, 75–78. [Google Scholar] [CrossRef]
  12. Tolocka, M.P.; Solomon, P.A.; Mitchell, W.; Norris, G.A.; Gemmill, D.B.; Wiener, R.W.; Vanderpool, R.W.; Homolya, J.B.; Rice, J. East versus west in the US: Chemical characteristics of PM2.5 during the winter of 1999. Aerosol Sci. Technol. 2001, 34, 88–96. [Google Scholar] [CrossRef]
  13. Walker, J.T.; Whitall, D.R.; Robarge, W.; Paerl, H.W. Ambient ammonia and ammonium aerosol across a region of variable ammonia emission density. Atmos. Environ. 2004, 38, 1235–1246. [Google Scholar] [CrossRef]
  14. Cheng, B.; Wang-Li, L. Spatial and temporal variations of PM2.5 in North Carolina. Aerosol Air Qual. Res. 2019, 19, 698–710. [Google Scholar] [CrossRef] [Green Version]
  15. Cheng, B.; Wang-Li, L.; Meskhidze, N.; Classen, J.; Bloomfield, P. Spatial and temporal variations of PM2.5 mass closure and inorganic PM2.5 in the Southeastern U.S. Environ. Sci. Pollut. Res. 2019, 26, 33181–33191. [Google Scholar] [CrossRef] [PubMed]
  16. Cheng, B. and Wang-Li, L. Responses of secondary inorganic PM2.5 to precursor gases in an ammonia abundant area in North Carolina. Aerosol Air Qual. Res. 2019, 19, 1126–1138. [Google Scholar] [CrossRef]
  17. Pye, H.O.T.; Nenes, A.; Alexander, B.; Ault, A.P.; Barth, M.C.; Clegg, S.L.; Collett, J.L., Jr.; Fahey, K.M.; Hennigan, C.J.; Herrmann, H.; et al. The acidity of atmospheric particles and clouds. Atmos. Chem. Phys. 2020, 20, 4809–4888. [Google Scholar] [CrossRef] [PubMed] [Green Version]
  18. Ansari, A.S.; Pandis, S.N. Prediction of multicomponent inorganic atmospheric aerosol behaviour. Atmos. Environ. 1999, 33, 745–757. [Google Scholar] [CrossRef]
  19. Zhang, Y.; Seigneur, C.; Seinfeld, J.H.; Jacobson, M.; Clegg, S.L.; Binkowski, F.S. A comparative review of inorganic aerosol thermodynamic equilibrium modules: Similarities, differences, and their likely causes. Atmos. Environ. 2000, 34, 117–137. [Google Scholar] [CrossRef]
  20. Cheng, B. Dynamics of Rural and Urban Atmospheric Chemical Conditions and Inorganic Aerosols; North Carolina State University: Raleigh, NC, USA, 2018. [Google Scholar]
  21. Ravishankara, A.R. Heterogeneous and multiphase chemistry in the troposphere. Science 1997, 276, 1058–1065. [Google Scholar] [CrossRef]
  22. Wexler, A.S.; Seinfeld, J.H. Analysis of aerosol ammonium nitrate: Departures from equilibrium during SCAQS. Atmos. Environ. 1992, 26, 579–591. [Google Scholar] [CrossRef]
  23. Moya, M.; Pandis, S.N.; Jacobson, M.Z. Is the size distribution of urban aerosols determined by thermodynamic equilibrium? An application to Southern California. Atmos. Environ. 2002, 36, 2349–2365. [Google Scholar] [CrossRef]
  24. Fountoukis, C.; Nenes, A. ISORROPIA II: A computationally efficient thermodynamic equilibrium model for K+-Ca2+-Mg2+-NH4+-Na+-SO42−-NO3-Cl-H2O aerosols. Atmos. Chem. Phys. Discuss. 2007, 7, 1893–1939. [Google Scholar] [CrossRef] [Green Version]
  25. Ansari, A.S.; Pandis, S.N. An analysis of four models predicting the partitioning of semi-volatile inorganic aerosol components. Aeros. Sci. Technol. 1999, 31, 129–153. [Google Scholar] [CrossRef]
  26. Nenes, A.; Pilinis, C.; Pandis, S.N. ISORROPIA: A new thermodynamic equilibrium model for multiphase multicomponent inorganic aerosols. Aqua. Geochem. 1998, 4, 123–152. [Google Scholar] [CrossRef]
  27. Nenes, A.; Pilinis, C.; Pandis, S.N. Continued development and testing of a new thermodynamic aerosol module for urban and regional air quality models. Atmos. Environ. 1999, 33, 1553–1560. [Google Scholar] [CrossRef]
  28. Fountoukis, C.; Nenes, A.; Pandis, S.; Pilinis, C. ISORROPIA v2.1 Reference Manual. 2009. Available online: https://www.epfl.ch/labs/lapi/wp-content/uploads/2018/12/ISORROPIA21Manual.pdf (accessed on 21 November 2022).
  29. Koo, B.; Gaydos, T.M.; Pandis, S.N. Evaluation of the equilibrium, dynamic, and hybrid aerosol modeling approaches. Aerosol Sci. Technol. 2003, 37, 53–64. [Google Scholar] [CrossRef]
  30. Hu, X.-M.; Zhang, Y.; Jacobson, M.Z.; Chan, C.K. Coupling and evaluating gas/particle mass transfer treatments for aerosol simulation and forecast. J. Geophys. Res. 2008, 113, 1–20. [Google Scholar] [CrossRef] [Green Version]
  31. Meng, Z.; Seinfeld, J.H. Time scale to achieve atmospheric gas-aerosol equilibrium for volatile species. Atmos. Environ. 1996, 30, 2889–2900. [Google Scholar] [CrossRef]
  32. Fountoukis, C.; Nenes, A.; Sullivan, A.; Weber, R.; Van Reken, T.; Fischer, M.; Matias, E.; Moya, M.; Farmer, D.; Cohen, R.C. Thermodynamic characterization of Mexico City aerosol during MILAGRO 2006. Atmos. Chem. Phys. 2009, 9, 2141–2156. [Google Scholar] [CrossRef] [Green Version]
  33. Zhang, J.; Chameides, W.L.; Weber, R.; Cass, G.; Orsini, D.; Edgerton, E.S.; Jongejan, P.; Slanina, J. An evaluation of the thermodynamic equilibrium assumption for fine particulate composition: Nitrate and ammonium during the 1999 Atlanta Supersite Experiment. J. Geophys. Res. 2002, 107, 8414. [Google Scholar] [CrossRef]
  34. Yu, S.; Dennis, R.; Roselle, S.; Nenes, A.; Walker, J.; Eder, B.; Schere, K.; Swall, J.; Robarge, W. An assessment of the ability of three-dimensional air quality models with current thermodynamic equilibrium models to predict aerosol NO3. J. Geophys. Res. 2005, 110, D07S13. [Google Scholar] [CrossRef]
  35. Takahama, S.; Wittig, A.E.; Vayenas, V.; Davidson, C.I.; Pandis, S.N. Modeling the diurnal variation of nitrate during the Pittsburgh Air Quality Study. J. Geophys. Res. 2004, 109, D16S06. [Google Scholar] [CrossRef]
  36. Moya, M.; Ansari, A.S.; Pandis, S.N. Partitioning of nitrate and ammonium between the gas and particulate phases during the 1997 IMADA-AVER study in Mexico City. Atmos. Environ. 2001, 35, 1791–1804. [Google Scholar] [CrossRef]
  37. Goetz, S.; Aneja, V.P.; Zhang, Y. Measurement, analysis, and modeling of fine particulate matter in Eastern North Carolina. J. Air Waste Manag. Assoc. 2008, 58, 1208–1214. [Google Scholar] [CrossRef] [Green Version]
  38. Walker, J.T.; Robarge, W.P.; Shendrikar, A.; Kimball, H. Inorganic PM2.5 at a U.S. agricultural site. Environ. Pollut. 2006, 139, 258–271. [Google Scholar] [CrossRef] [PubMed]
  39. Silvern, R.F.; Jacob, D.J.; Kim, P.S.; Marais, E.A.; Turner, J.R. Inconsistency of ammonium-sulfate aerosol ratios with thermodynamic models in the eastern U.S.: A possible role of organic aerosol. Atmos. Chem. Phys. 2017, 17, 5107–5118. [Google Scholar] [CrossRef] [Green Version]
  40. Gill, P.S.; Graedel, T.E.; Weschler, C.J. Organic films on atmospheric aerosol particles, fog droplets, cloud droplets, raindrops, and snowflakes. Rev. Geophys. 1983, 21, 903–920. [Google Scholar] [CrossRef]
  41. Li, Q.-F.; Wang-Li, L.; Shah, S.B.; Jayanty, R.K.M.; Bloomfield, P. Ammonia concentrations and modeling of inorganic particulate matter in the vicinity of an egg production facility in Southeastern USA. Environ. Sci. Pollut. Res. 2014, 21, 4675–4685. [Google Scholar] [CrossRef]
  42. Li, Q.-F.; Wang-Li, L.; Liu, Z.; Jayanty, R.K.M.; Shah, S.B.; Bloomfield, P. Major ionic composition of fine particulate matter in an animal feeding operation facility and its vicinity. J. Air Waste Manag. Assoc. 2014, 64, 1279–1287. [Google Scholar] [CrossRef] [Green Version]
  43. Liggio, J.; Li, S.M.; Vlasenko, A.; Stroud, C.; Makar, P. Depression of ammonia uptake to sulfuric acid aerosols by competing uptake of ambient organic gases. Environ. Sci. Technol. 2011, 45, 2790–2796. [Google Scholar] [CrossRef]
  44. Pye, H.O.T.; Zuend, A.; Fry, J.L.; Isaacman-VanWertz, G.; Capps, S.L.; Appel, K.W.; Foroutan, H.; Xu, L.; Ng, N.L.; Goldstein, A.H. Coupling of organic and inorganic aerosol systems and the effect on gas–particle partitioning in the southeastern US. Atmos. Chem. Phys. 2018, 18, 357–370. [Google Scholar] [CrossRef]
  45. Guo, H.; Nenes, A.; Weber, R.J. The underappreciated role of nonvolatile cations on aerosol ammonium-sulfate molar ratios. Atmos. Chem. Phys. 2018, 18, 17307–17323. [Google Scholar] [CrossRef] [Green Version]
  46. Zheng, G.; Su, H.; Wang, S.; Andreae, M.O.; Pöschl, U.; Cheng, Y. Multiphase buffer theory explains contrasts in atmospheric aerosol acidity. Science 2020, 369, 1374–1377. [Google Scholar] [CrossRef] [PubMed]
  47. Electric Power Research Institute (EPRI). 2008. Available online: https://yosemite.epa.gov/sab%5CSABPRODUCT.NSF/B99E5E7B1FC13632852575B50069AAC2/$File/EPRI-SEARCH+for+EPA+SAB+INC+May+14-15+2009+Meeting.pdf (accessed on 21 November 2022).
  48. Hansen, D.A.; Edgerton, E.S.; Hartsell, B.E.; Jansen, J.J.; Kandasamy, N.; Hidy, G.M.; Blanchard, C.L. The Southeastern Aerosol Research and Characterization Study: Part 1–Overview. J. Air Waste Manag. Assoc. 2003, 53, 1460–1471. [Google Scholar] [CrossRef] [PubMed]
  49. Hidy, G.M.; Blanchard, C.L.; Baumann, K.; Edgerton, E.; Tanenbaum, S.; Shaw, S.; Knipping, E.; Tombach, I.; Jansen, J.; Walters, J. Chemical climatology of the Southeastern United States, 1999–2013. Atmos. Chem. Phys. 2014, 14, 11893–11914. [Google Scholar] [CrossRef] [Green Version]
  50. Cohen, M.A.; Ryan, P.B. Observations less than the analytical limit of Detection: A new approach. JAPCA 1989, 39, 328–329. [Google Scholar] [CrossRef]
  51. USEPA. Guidance for Data Quality Assessment. 2000. Available online: https://www.epa.gov/sites/production/files/2015-06/documents/g9-final.pdf (accessed on 21 November 2022).
  52. Chang, J.C.; Hanna, S.R. Air quality model performance evaluation. Meteo. Atmos. Phys. 2004, 87, 167–196. [Google Scholar] [CrossRef]
  53. Kumar, A.; Dixit, S.; Varadarajan, C.; Vijayan, A.; Masuraha, A. Evaluation of the AERMOD dispersion model as a function of atmospheric stability for an urban area. Environ. Prog. 2006, 25, 141–151. [Google Scholar] [CrossRef]
  54. Ansari, A.S.; Pandis, S.N. The effect of metastable equilibrium states on the partitioning of nitrate between the gas and aerosol phases. Atmos. Environ. 2000, 34, 157–168. [Google Scholar] [CrossRef]
  55. Metzger, S.; Mihalopoulos, N.; Levieveld, J. Importance of mineral cations and organics in gas-aerosol partitioning of reactive nitrogen compounds: Case study based on MINOS results. Atmos. Chem. Phys. 2006, 6, 2549–2567. [Google Scholar] [CrossRef] [Green Version]
  56. Bell, M.L.; Dominici, F.; Ebisu, K.; Zeger, S.L.; Samet, J.M. Spatial and temporal variation in PM2.5 chemical composition in the United States for health effects studies. Environ. Health Perspect. 2007, 115, 989–995. [Google Scholar] [CrossRef]
  57. Cheng, B.; Wang-Li, L.; Classen, J.; Meskhidze, N.; Bloomfield, P. Spatial and temporal variations of atmospheric chemical condition in the Southeastern U.S. Atmos. Res. 2021, 248, 105190. [Google Scholar] [CrossRef]
  58. Hand, J.L.; Schichtel, B.A.; Pitchford, M.; Malm, W.C.; Frank, N.H. Seasonal composition of remote and urban fine particulate matter in the United States. J. Geophys. Res. 2012, 117, D05209. [Google Scholar] [CrossRef]
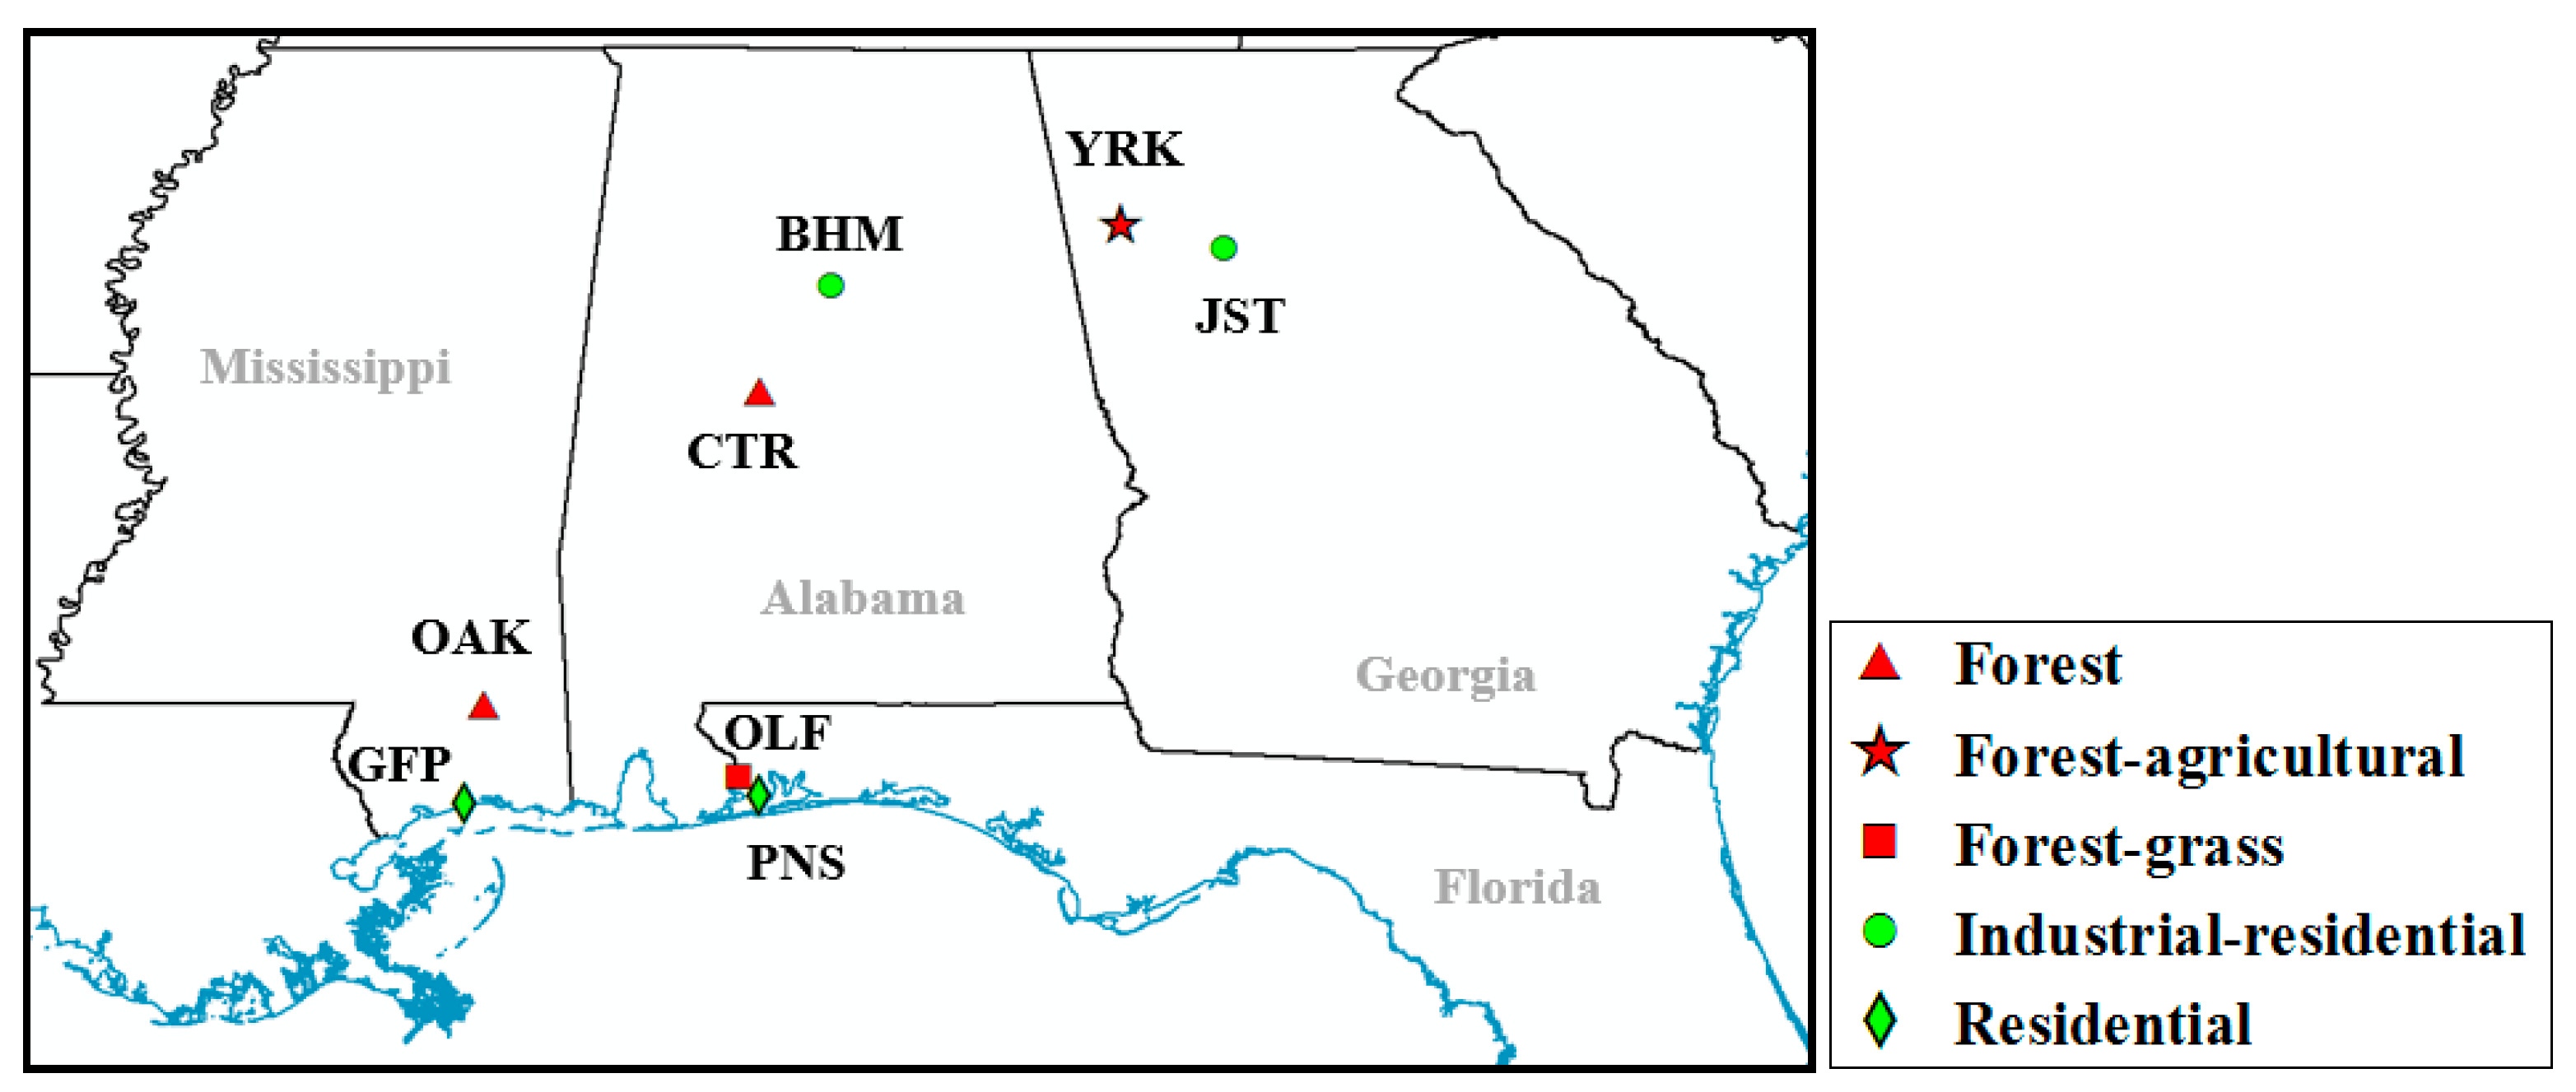
Figure 1. The geographical locations of the eight monitoring sites under the SEARCH (Green label indicates urban sites; red label indicates rural or suburban sites).
Atmosphere 13 01977 g001
Figure 2. The comparison of prediction and observation using stable setup at the YRK site.
Atmosphere 13 01977 g002
Figure 3. The ratios of Cp/Co for HNO3 prediction using stable and metastable model setups.
Atmosphere 13 01977 g003
Figure 4. The ratios of Cp/Co for NO3 using stable and metastable model setups.
Atmosphere 13 01977 g004
Figure 5. The ratios of Cp/Co for iPM2.5 (SO42− + NH4+ + NO3) using stable and metastable model setups.
Atmosphere 13 01977 g005
Figure 6. The relationship of under and overprediction of nitrate partitioning with pH at the YRK site, (a) HNO3 Cp/Co ratio under different pH; (b) NO3 Cp/Co ratio under different pH; (c) Simulated NO3 fraction of total nitrate under different pH.
Atmosphere 13 01977 g006
Figure 7. The measured gas-phase NH3 and HNO3 molar fractions under different T-RH conditions at the YRK and JST sites.
Atmosphere 13 01977 g007
Figure 8. The difference of predictions using stable and metastable setups at the YRK site (S: stable; M: metastable).
Atmosphere 13 01977 g008
Figure 9. The ratios of prediction over observation for NH3 and NH4+ using stable setup at the YRK and JST sites.
Atmosphere 13 01977 g009
Table 1. Continuous and discrete field measurements at the eight sites.
ObservableTechniqueMax ResolutionDetection Limit (ppb or µg m−3)
Gases
NOCL a1 min0.05
NO2Photolysis/CL1 min0.1
HNO3Denuder/Mo reduction/CL1 min0.1
NOyMo reduction/CL1 min0.1
SO2UV–fluorescence1 min0.2
NH3Denuder/Pt oxidation/CL5 min0.2
iPM2.5 chemical compositions
SO42−Fe reduction/UV–fluorescence5 min0.4
NO3Filter/Mo reduction/CL5 min0.2
NH4+Filter/Pt oxidation/CL5 min0.1
Meteorological conditions
T/RH/SR b/BP cVarious1 minNA
WS d/WD e/PrecipitationVarious1 minNA
Discrete iPM2.5 chemical compositions
NO3Teflon filer + IC f24 h0.01
Volatile NO3Nylon filer + IC24 h0.02
NH4+Teflon filer + AC g24 h0.03
Volatile NH4+Citric acid annular denuder + AC24 h0.04
SO42−Teflon filter + IC24 h0.05
K+-Ca2+-Mg2+-Na+Teflon filter + ICP-MS h24 hNA i
a CL: chemiluminescence; b SR: solar radiation; c BP: barometric pressure; d WS: wind speed; e WD: wind direction; f IC: ion chromatography; g AC: automated colorimetry; h ICP-MS: inductively coupled plasma mass spectrometry; i NA: not applicable.
Table 2. Model performance assessment for NO3 prediction with stable setup at the YRK site.
TemperatureRelative Humidity
20–30%30–40%40–50%50–60%60–70%70–80%80–90%90–100%
30–35 °C−2.00 M−2.00 M−2.00 M−1.98 M−1.81 MNANANA
25–30 °C−2.00 M−2.00 M−2.00 M−1.99 M−1.66 M−0.71 M−0.48 S = MNA
20–25 °C−2.00 M−1.95 M−1.84 M−1.97 M−1.10 M−0.27 M−0.09 M0.25 S = M
15–20 °C−0.78 M−1.20 M−1.33 M−1.53 M−0.29 M0.06 S0.12 S0.36 S = M
10–15 °C−0.65 M−0.61 M−0.49 S−0.47 M−0.02 S0.30 S0.29 S0.41 S = M
5–10 °C−0.29 M0.01 S0.09 S0.03 S0.08 S0.21 S0.17 S0.17 S = M
0–5 °C0.18 S0.30 S0.29 S0.25 S0.12 S0.09 S0.07 S0.17 S = M
−5–0 °CNA0.40 S0.44 S0.30 S0.16 S0.08 S0.06 S0.13 S = M
−10–−5 °CNANANA0.37 S0.20 S0.05 S0.02 SNA
a The unacceptable FB values (<−0.5 or >0.5) are labeled as bold values; b NA: not applicable; c the FB values closer to 0 indicates the better model performance. The S superscript indicates the stable setup performs better, the M superscript indicates the metastable setup performs better, and the S = M superscript indicates the same model performance.
Publisher’s Note: MDPI stays neutral with regard to jurisdictional claims in published maps and institutional affiliations.