Article

Spatial Clustering of Vegetation Fire Intensity Using MODIS Satellite Data

1
Discipline of Geography and Environmental Science, School of Agricultural Earth and Environmental Sciences, University of KwaZulu-Natal, Private Bag X01, Scottsville, Pietermaritzburg 3209, South Africa
2
Institute of Water Studies, Department of Earth Sciences, The University of the Western Cape, Private Bag X17, Bellville 7535, South Africa
3
Department of Geography, Environmental Sustainability and Resilience Building, Midlands State University, Gweru 9055, Zimbabwe
*
Author to whom correspondence should be addressed.
Atmosphere 2022, 13(12), 1972; https://doi.org/10.3390/atmos13121972
Submission received: 30 September 2022 / Revised: 17 November 2022 / Accepted: 17 November 2022 / Published: 25 November 2022
(This article belongs to the Special Issue Wildland Fire under Changing Climate)

Abstract

:
This work analyses the spatial clustering of fire intensity in Zimbabwe, using remotely sensed Moderate Resolution Imaging Spectroradiometer (MODIS) active fire occurrence data. In order to investigate the spatial pattern of fire intensity, MODIS-derived fire radiative power (FRP) was utilized. A local indicator of spatial autocorrelation method, the Getis-Ord (Gi*) spatial statistic, was applied to show the spatial distribution of high and low fire intensity clusters. Analysis of the relationship between topographic variables, vegetation type, agroecological zones and fire intensity was done. According to the study’s findings, the majority (44%) of active fires detected in the study area in 2019 were of low-intensity (cold spots), and the majority (49.3%) of them occurred in shrubland. High-intensity fires (22%) primarily occurred in the study area’s eastern and western regions. The study findings demonstrate the utility of spatial statistics methods in conjunction with satellite fire data in detecting clusters of high and low-intensity fires (hot spots and cold spots).

1. Introduction

Fire has always been utilized as a useful management tool in maintaining ecosystem diversity mainly in semi-arid environments [1,2,3,4,5,6,7]. The occurrence of uncontrolled vegetation fires can, however, threaten the environment, economy and human safety [8,9]. Landscape fires produce significant amounts of particulate matter globally [10], affecting air quality and hence leading to negative human health impacts [11]. The loss of vegetation due to wildfires tends to alter landscape structure, with devastating effects on erosion dynamics [12,13] and ecosystem services footprint thereby affecting essential ecological and hydrological processes [14,15]. Fires also contribute to climate change by transferring terrestrial to atmospheric carbon pools [16]. Although fires are largely due to anthropogenic factors, climatic conditions tend to greatly influence increased extreme fire events globally [17]. On the other hand, forest fires influence global climate change by emitting greenhouse gases such as CO2 and CO.
Fire intensity is the energy which is released by a fire when burning [18] and is influenced by the fuel content [19]. The biomass which is consumed during burning influences fire intensity which is one key fire regime descriptor used by fire scientists [20]. Fire intensity is usually confused with fire severity which focuses on the impacts of fire on the ecosystem.
The widely used hot spot analysis methods include Kernel Density [9,15,21,22] and Moran’s I [22,23]. The Kernel density analysis usually generalizes point-based spatial data into continuous spatial data and considers search radius and cell size. On the other hand, the Getis-Ord (Gi*) statistic utilizes the magnitude of each spatial feature in relation to its neighbors’ values to form clusters of the features in form of cold spots and hot spots [22]. Local indicators of spatial autocorrelation (LISA) methods such as the Getis-Ord (Gi*) statistic, therefore, help in the determination of whether fires are clustered or randomly spread within a landscape. The Getis-Ord (Gi*) statistic allows for the detection of local pockets of spatial dependence which may be difficult to detect using global spatial autocorrelation methods [22]. In other fields, hot spot analysis methods have been used to analyze the clustering of crimes [24], pulmonary tuberculosis incidences [25], and vegetation fragmentation [26,27].
Currently, fire monitoring in Zimbabwe is done using both ground-based and satellite data, where the detected active fires and burned area are generally documented. Fire intensity is not measured and, therefore, not incorporated into the fire management system in Zimbabwe. Currently, no study has assessed the fire intensity in Zimbabwe. In the studies [26,27,28,29] on fire clustering in the study area, the focus was on identifying hotspots and cold spots, which denoted areas with high and low fire occurrence. A study by Shekede et al. [29], for example, assessed the spatial distribution of fire hot spots within districts in Zimbabwe using the location (coordinates) of MODIS active fire data. In Zimbabwe again, Mpakairi et al. [28] analyzed the spatial clustering of active fires in a protected area using satellite data. These previous studies [28,29] generally utilized the geographic location of MODIS active fires to determine the spatial clustering of fires based on administrative boundaries. Administration boundaries generally do not follow any environmental gradient. Such studies lacked the analysis of critical fire variables such as fire intensity.
Elsewhere, very few studies have been done on the spatial clustering of fire intensity based on satellite data and spatial autocorrelation methods. For instance, [15] utilized the k-means clustering method to detect fire intensity clusters based on MODIS fire radiative power (FRP) data in India, Asia. A study by [18] utilized MODIS FRP to study forest fire activity and intensity in the tropical savanna of northern Australia. A study by Mohd Said et al. [9] used ground-based fire data in a study where the spatial distribution of high and low-intensity fires in Brunei-Muara District Brunei Darussalam, Southeast Asia was examined. This is time-consuming, expensive, and does not cover large areas. On the other hand, satellite remote sensing allows for synoptic coverage, the ability to take repetitive measurements, and the ability to cover large areas.
Zimbabwe, for example, supports seven agroecological regions which are characterized by different climatic and topographic conditions. By analyzing the variability of fire intensity clusters in the different agroecological zones, this study incorporates the effect of varying climatic, vegetation, and topographic conditions on fire intensity in the study area. Further, the study also analyzed the contribution of topography, land cover, and agroecological zones to fire intensity which was not incorporated in previous studies [5,25,27,29].
In Zimbabwe, climate change has manifested itself with an increase in temperatures and a decrease in rainfall [30] which is associated with a high recurrence of fires. With the risks of climate change becoming more real in Zimbabwe [30], information on fire intensity clusters becomes very critical for fire management strategies. This is because it gives fire managers an indication of the propagation of fire and how difficult or easy it will be to stop the fire. Information on fire intensity clusters also helps in identifying areas prone to fires of high-intensity, posing high risks to vegetation, infrastructure, and people [9]. Fire managers can utilize fire hot spot maps to assist in decision-making for the appropriate allocation of fire management resources to priority areas [31,32]. Findings from this study contribute novel knowledge in terms of utilizing spatial autocorrelation methods and earth observation data to identify fire intensity clusters in Zimbabwe, Southern Africa.

2. Materials and Methods

2.1. Study Area

This study was carried out in Zimbabwe, Southern Africa and located between the coordinates 15°30″–22°30″ S and 25°00″–33°10″ E as shown in Figure 1. The elevation varies from below 300 m for the Southern districts to more than 2500 m above mean sea level for the Eastern regions of the study area. The climate is divided into three distinct seasons where the hot and wet season occurs from November to April while the cool and dry season occurs from May to around August. The hot and season which coincides with the fire season generally occurs from August to November [33]. In Zimbabwe, minimum temperatures usually occur around June to July, while maximum temperatures are usually experienced in October. Annual rainfall in the study area varies from below 400 mm in the western and southern regions to above 1500 mm in the eastern regions of the study area [29,34], and this has been categorized into seven agroecological zones, as shown in Figure 1. Mean annual rainfall decreases with the transition from agroecological zones 1 (about 1250 mm) to Vb (below 400 mm). The study area is defined by decreasing elevation and increasing temperature from agroecological zones I to Vb [35]. Savannah woodlands characterize approximately 95% of Zimbabwe’s forest cover, where trees and grasses co-exist and provide fuel load for forest fires [36,37]. The peak fire season in the study area span from August to October, which is a period characterized by hot and dry conditions [38].

2.2. Satellite Data

The daily active fire product (MCD14DL) from MODIS was used. MODIS Terra and Aqua satellites have a 1 to 2-day revisit time and pass over the equator at around 1030 am and 1.30 pm. The data has a spatial resolution of 1 km at the nadir, but it is worth noting that the MODIS sensor tends to detect fires as small as 50 m2 [15,39]. Each detected active fire depicts the center of a 1 km pixel where one or more fires are burning during the time the satellite overpasses [40]. In this context, an active fire is defined as any fire identified by the MODIS satellite sensor while burning is still active [41]. The factors that determine the probability of a fire being detected include the temperature of the fire, the area covered by the fire spread, the satellite’s angle, and the prevailing weather conditions [42].
Data for the daily active fires detected by the MODIS sensor from January to December 2019 was freely downloaded from the Fire Information Management System (FIRMS) website (https://earthdata.nasa.gov/earth-observation-data/near-real-time/firms/active-fire-data (accessed on 10 March 2022)) in shapefile (*shp) format. The geographic coordinates (latitude and longitude) of the fire, brightness temperature (Kelvin), acquisition date and time, confidence (0–100%), and fire radiative power are all included in the MODIS active fire data (FRP). A description by [42] provides details on the acquisition of MODIS data. Because it is free and covers a large area, MODIS active fire data was chosen for analysis in this study [28,43,44]. Several studies have used MODIS active fire data in fire studies [15,44,45,46,47]. To date, the MODIS sensors have been extensively utilized in the detection of fire because of the presence of channels specifically designed for fire monitoring and their high temporal resolution.

2.3. Pre-Processing of Data

The active fires utilized in the analysis had a confidence level greater than 30% [31,42] to minimize false alarms [48]. Fire points of less than a 30% confidence level are considered unreliable [31,48]. Using ArcMap 9.5’s Projection and Transformations tool, all the datasets in Table 1 were projected to the UTM coordinate system using the Project tool in a GIS environment to ensure compatibility.

2.4. Data Analysis

2.4.1. Spatial Clustering of Fire Intensity

The presence or absence of spatial clustering in the fires detected by the MODIS sensor was tested using Moran’s I [23] spatial autocorrelation statistic, which was computed using the Spatial Statistics tool in a GIS environment. The fire radiative power extracted from the MODIS fire data was used as a measure of fire intensity [46]. The FRP, in this context, refers to the rate of radiative energy emitted by the fire at the time of the observation [46]. It is a good approximation of the total amount of energy released during burning and can be used to assess the destructive power of the detected fire [46].
Fire intensity cold spots and hot spots were computed using Getis-Ord (Gi*) [22] statistic based on Equation (1):
Gi * = j = 1 n w i , j x ¯ , X ¯ j = 1 n w i , j [ n j = 1 n w i , j 2 ( j = 1 n w i , j   ) ] n 1 S
where xj is the attribute value for feature j, wij is the spatial weight between feature i and j, and n is the total number of features in the dataset. This spatial autocorrelation statistic assessed the extent to which fires exhibit spatial patterns in space as high-intensity hot spots or cold spots, which are areas of statistically high or low fire intensity concentration, respectively. The Gi* statistic identifies spatial clusters of high and low values which are statistically significant hence creating hot spots and cold spots. Hot spots form when points of high values are surrounded by high values, while cold spots form when points of low values are surrounded by low values [22].
In this study, the fire radiative power extracted from the MODIS fire data was utilized in the analysis to detect fire intensity clusters in the form of low fire intensity (cold spots) and high fire intensity (hot spots). MODIS active fire data is globally accessible and can be used at various scales, which is beneficial to data-poor regions such as southern Africa [29]. The Hot spot Analysis tool in ArcMap 10.5 was utilized in the identification of fire intensity clusters. The derived Getis-ord (Gi*) values were classified into hot spots, which are areas with z-score > 3.87, and cold spots are areas with z-scores < 3.87 [28,49]. High values of the z score in association with low p values indicate a Hot spot [50]. In this context, fire-intensity hotspots were formed when points of high FRP were surrounded by high FRP values, while fire-intensity cold spots were formed when points of low FRP values were surrounded by low FRP values. The spatial distribution of high-fire-intensity (hot spots) and low-fire-intensity (cold spots) areas in the study area were presented in the form of a map.

2.4.2. Analysis of Fire Intensity within Clusters

The number of active fire points within the fire intensity clusters (hot spots and cold spots) was calculated. The paired t-test was calculated using the GraphPad Prism version 6.04 for Windows (www.graphpad.com: accessed on 27 March 2022) to test for the difference in the mean FRP within the fire intensity clusters.

2.4.3. Correlation of Fire Intensity Clusters with Topographic Factors

Correlation between topographic variables (elevation, slope, aspect) given in Table 2 and FRP was done.
Elevation explains the changes in temperature while aspect determines the amount of solar radiation available for the fuel, hence affects the moisture content of the fuel. Steep slopes are associated with greater preheating of fuels. Topographic derivatives such as aspect, slope, and elevation also influence the amount of solar radiation reaching any location [51]. The vegetation type is also influenced by slope and altitude and hence affects the fire intensity. To test for the significant difference in topographic variables within fire intensity clusters, the paired t-test was utilized.

2.4.4. Association between Fire Intensity and Vegetation Cover Types

The association between fire intensity and vegetation cover types was also examined to assess the susceptibility of the various vegetation types to burning. The 10 m resolution land cover map from the European Space Agency (ESA) initiated WorldCover project was downloaded from https://viewer.esa-worldcover.org/worldcover/ (accessed on 27 March 2022) as indicated in Table 1. The specific vegetation cover type for each fire point data was extracted using the Extract tool in ArcMap 10.5, and the FRP for each fire point was determined.

2.4.5. Association between Fire Intensity and Agroecological Zones

The association between FRP and the agroecological zones was examined to determine which agroecological zones are characterized by hot or cold fires. The agroecological zone map produced by [35] was utilized. The Zimbabwe agroecological zones were delineated based on mean annual precipitation and temperature. The Extract tool in ArcMap 10.5 was utilized to determine the agroecological zone for each fire point.

3. Results

3.1. Spatial Distribution of Active Fires

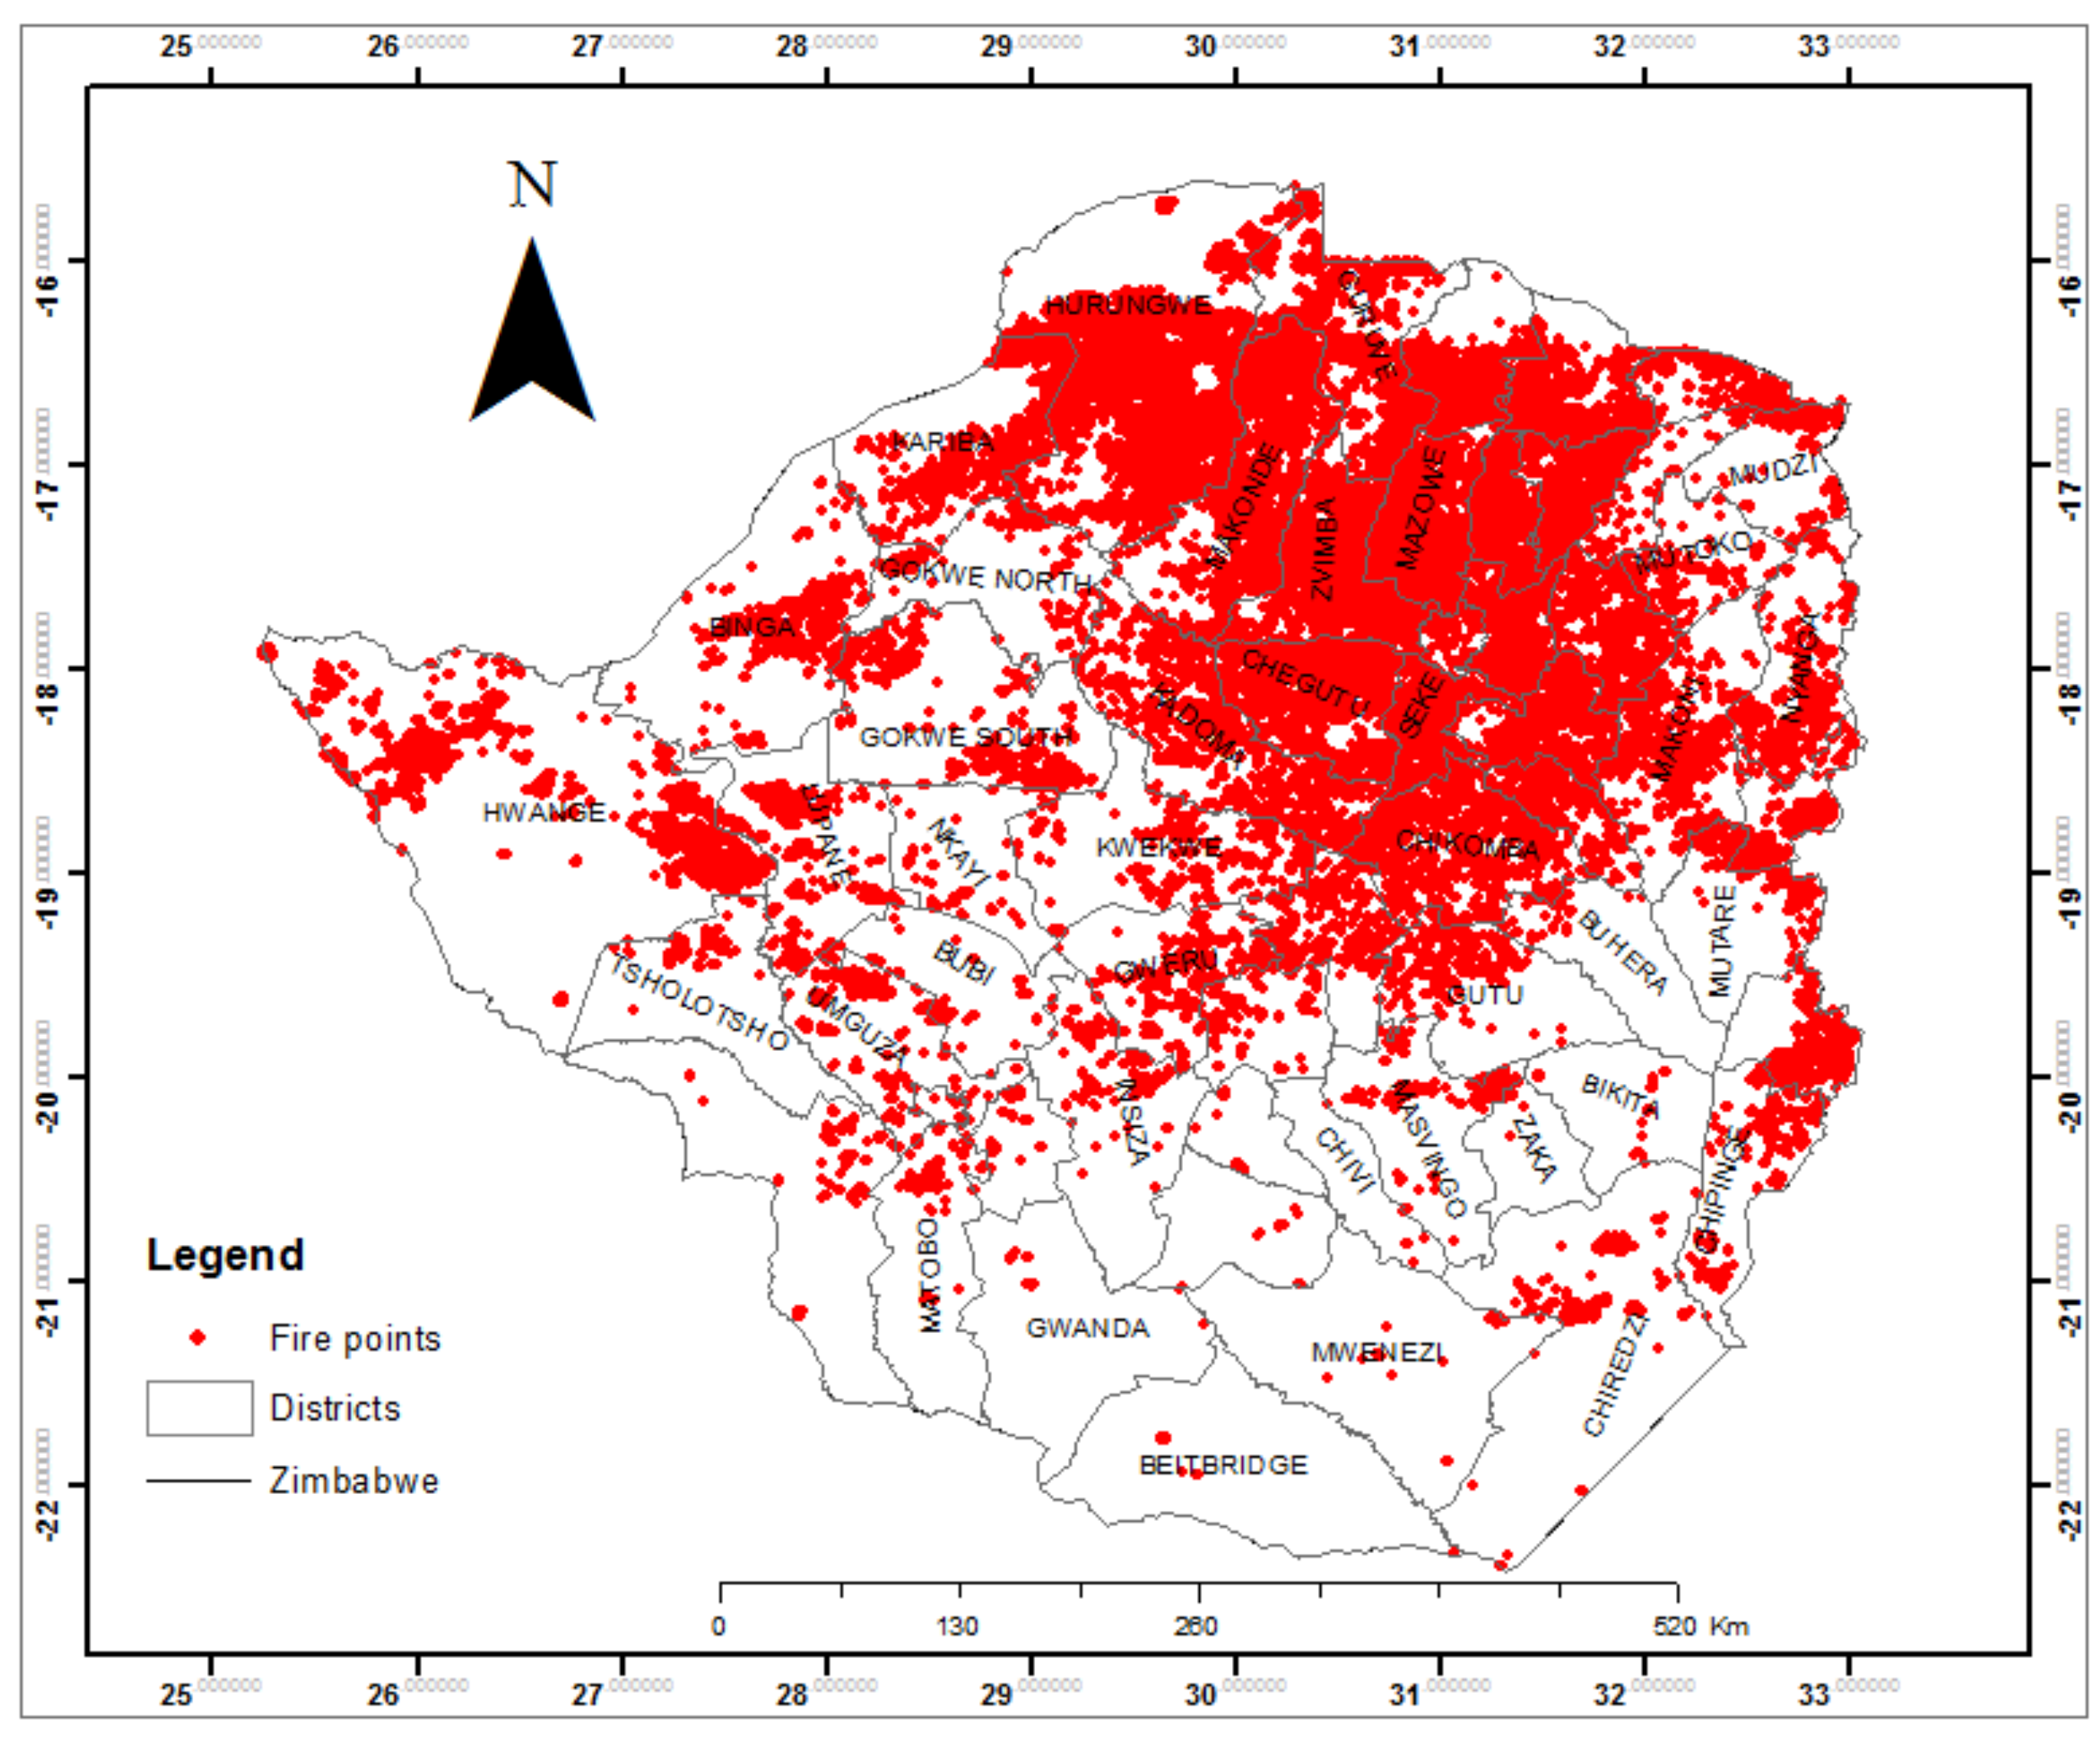
A total of 35,342 active fires were detected in 2019 in the study area (Figure 2). High fire activity was detected in agroecological regions IIa, IIb, and IV (Figure 3), which are characterized by high rainfall and increasing temperatures [35]. The highest fire activity was detected in Mashonaland West province (Figure 2), while low activity was recorded in the southern and south-western districts. Nyanga, Mutasa, Chimanimani, and Chipinge districts in Manicaland province also experienced a considerable number of fire incidences.

3.2. Spatial Distribution of fire Intensity

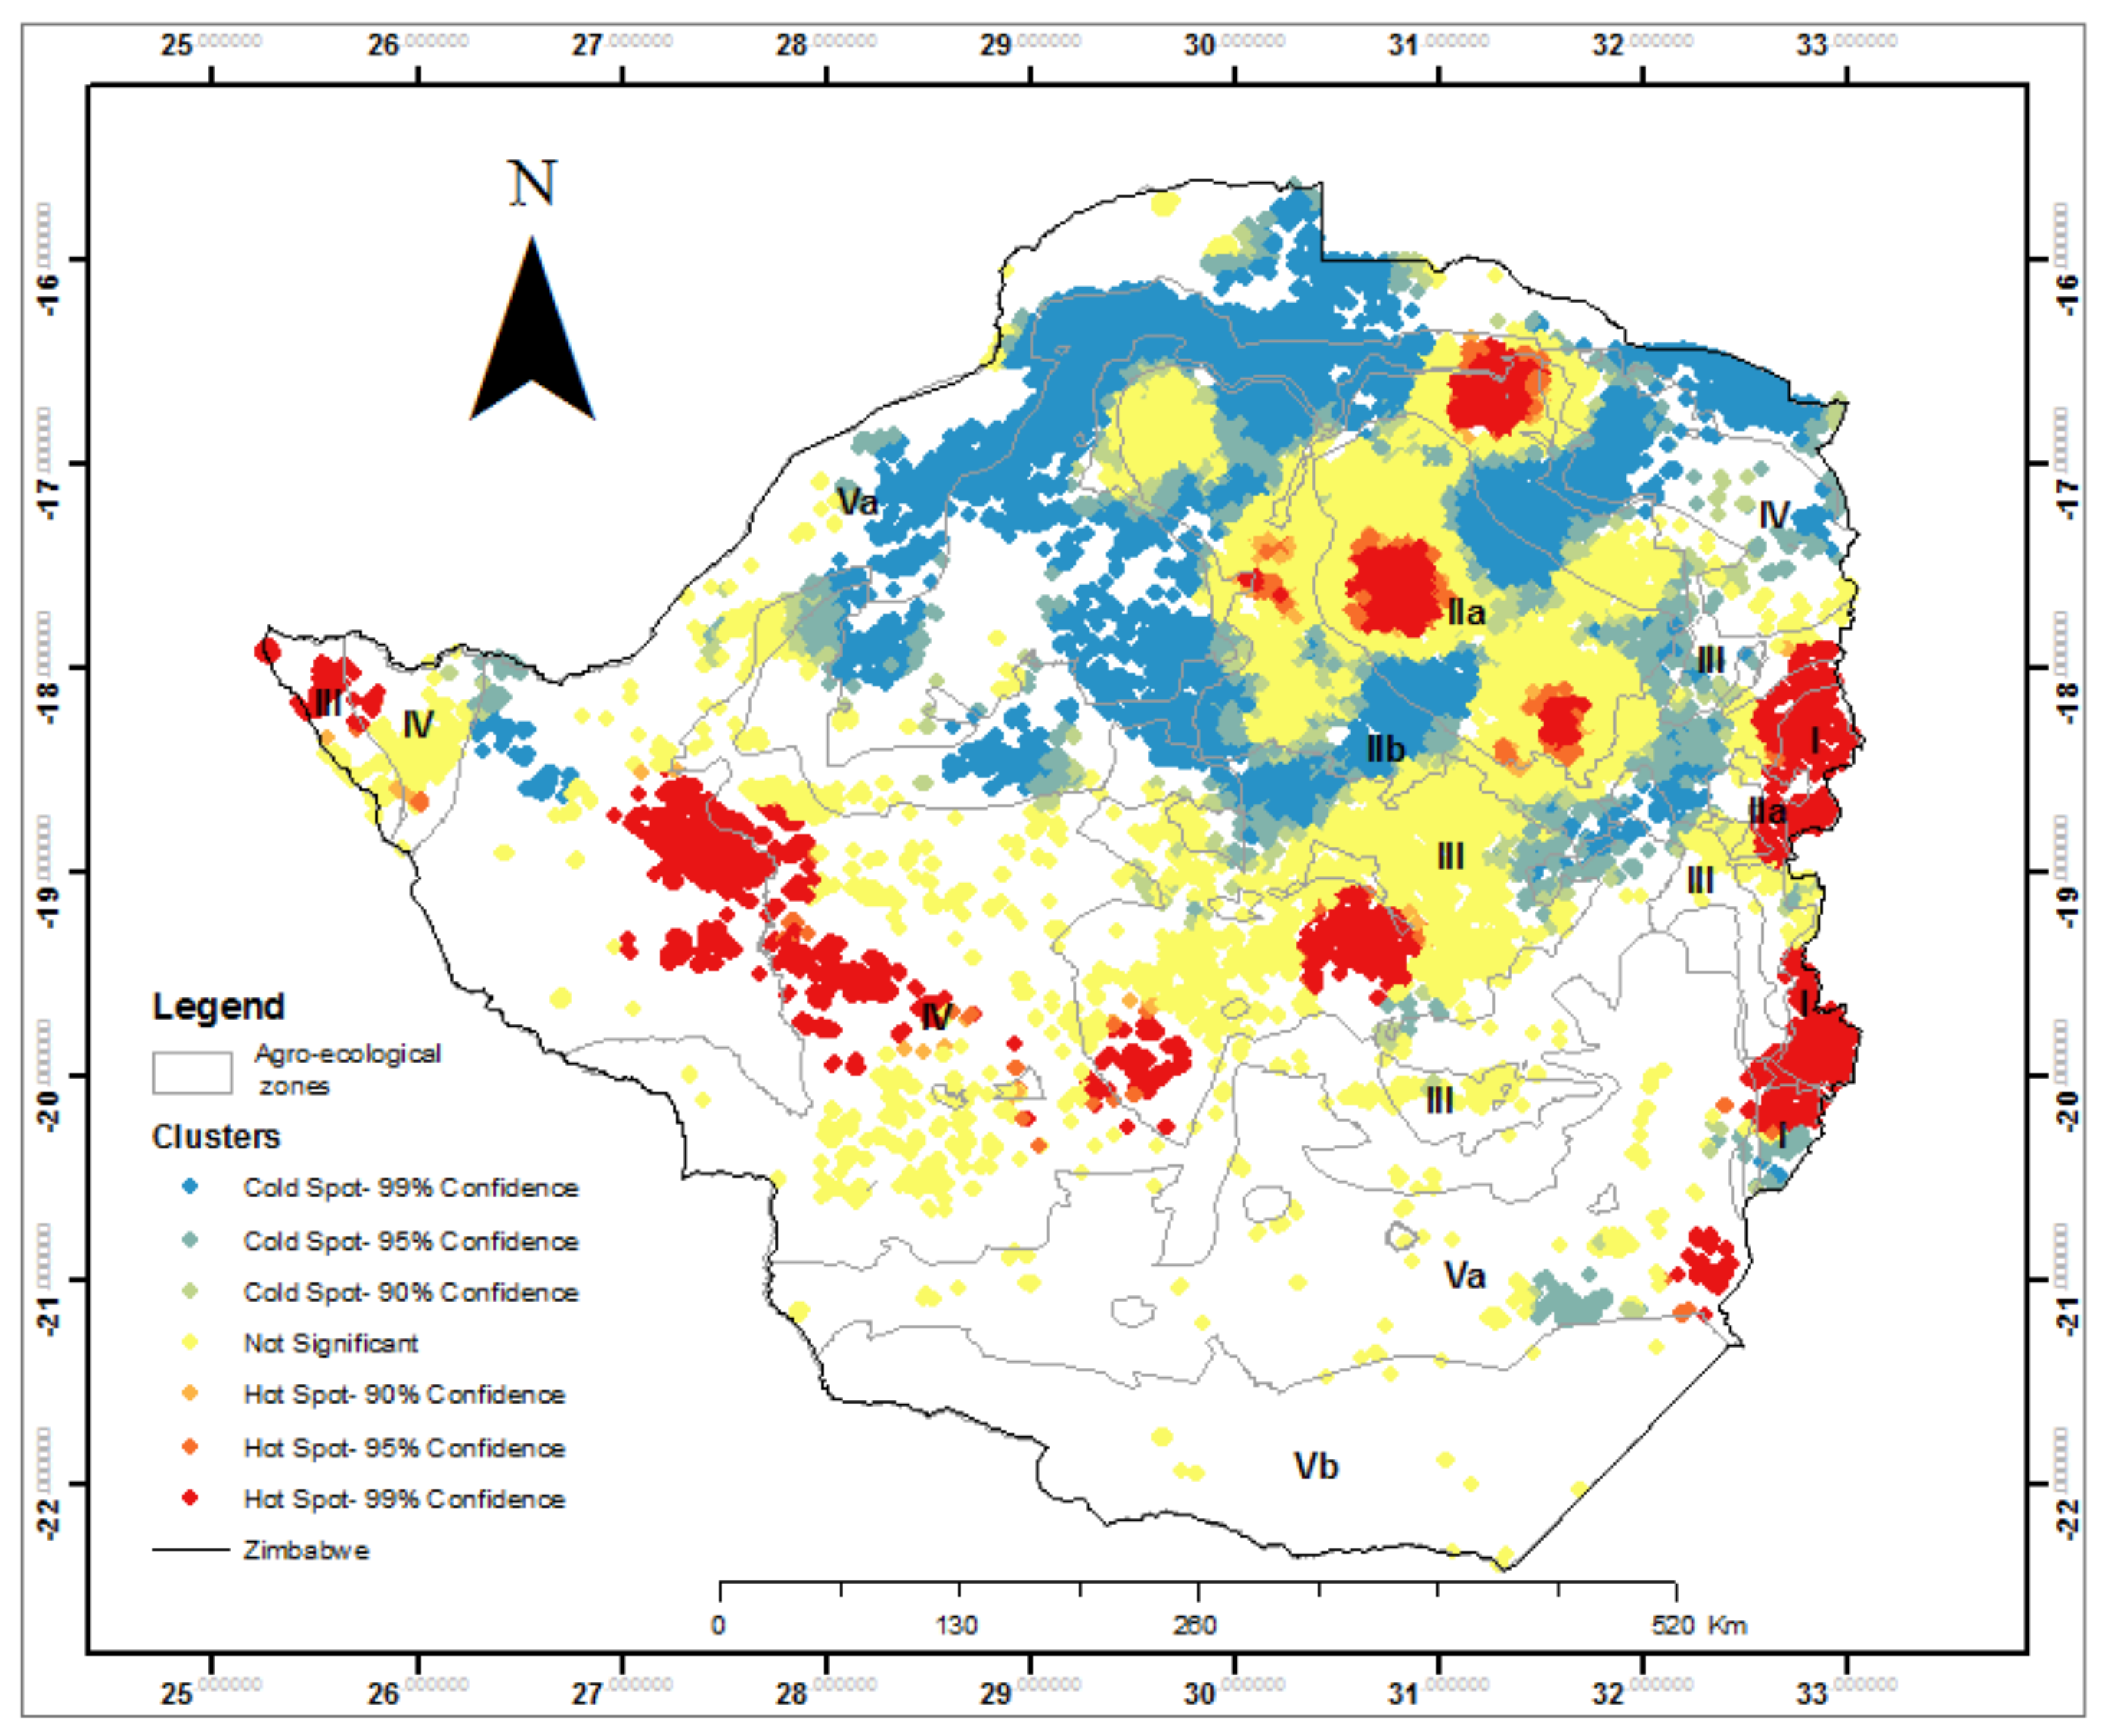
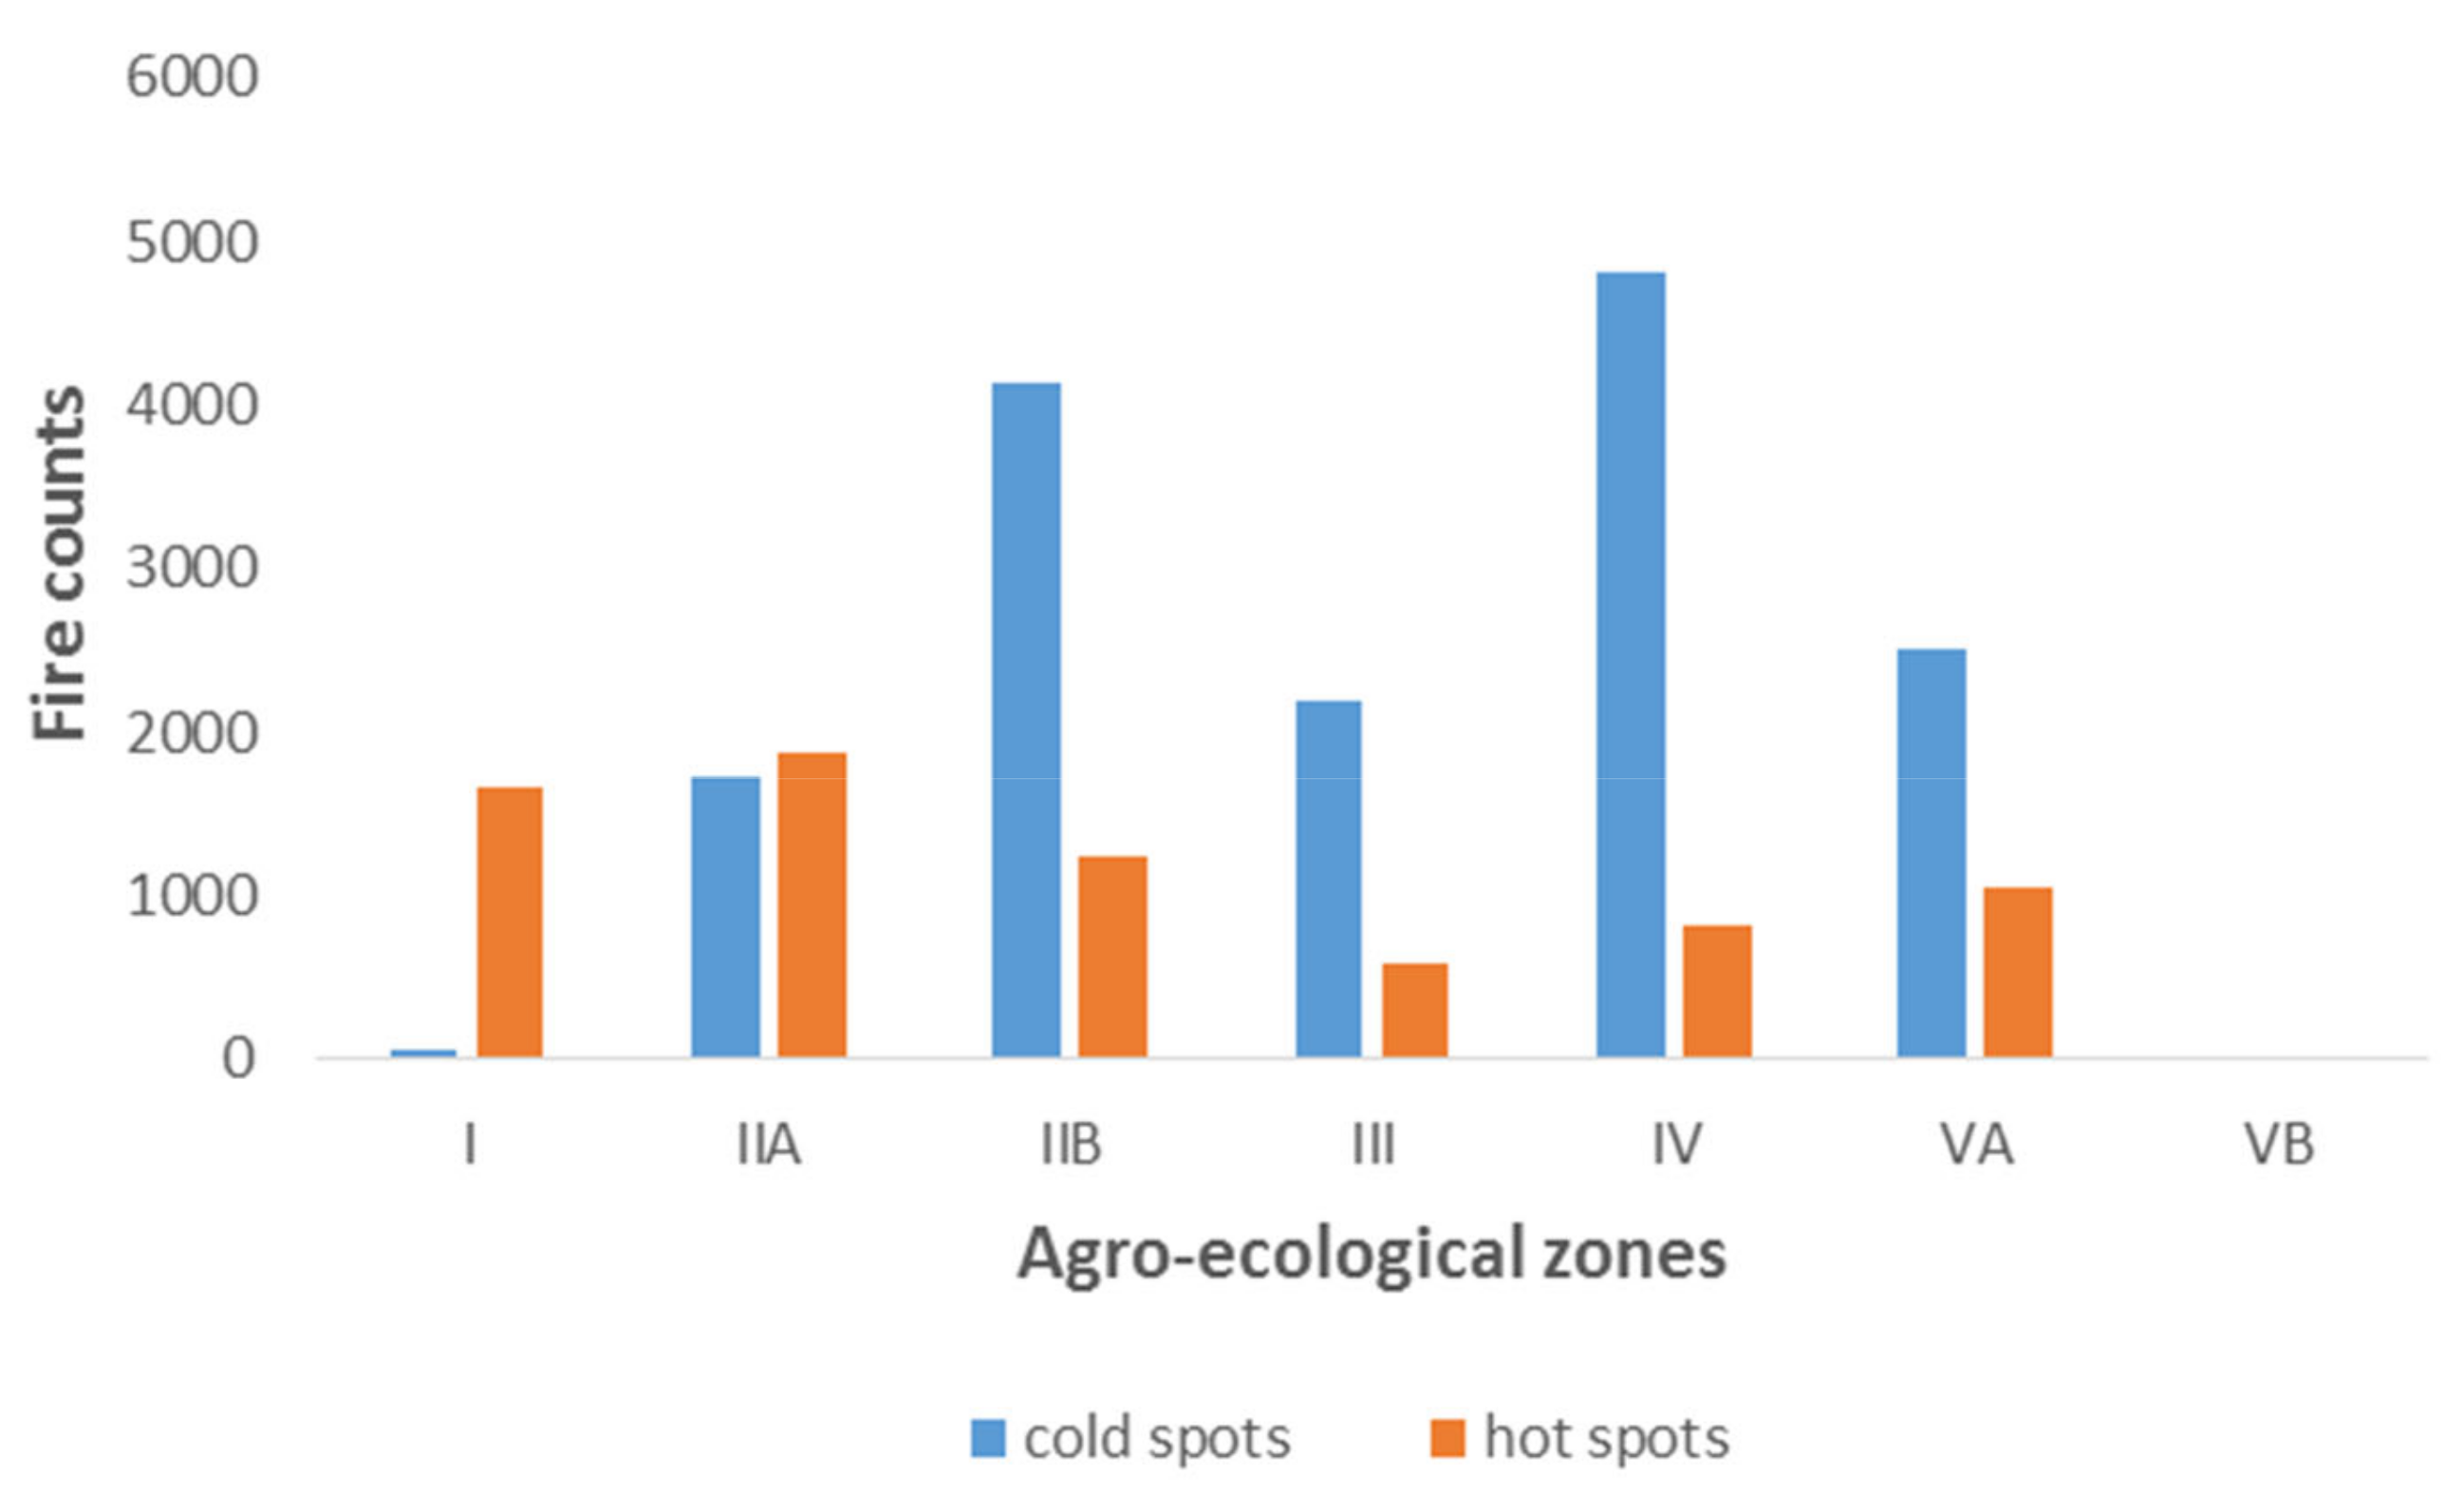
The test for clustering using the Moran’s I statistic revealed that the occurrence of active fire clusters in the study area was statistically significant (p < 0.05; z-score = 35.17). The map showing spatial occurrence of high and low fire intensity clusters (Figure 3) shows that most of the fires under study were of low intensity. Based on the results shown in Figure 3 and Figure 4, agroecological zones I and IIA and parts of agroecological zones III, IV, and VA are associated with high-intensity fires. Although these zones are associated with lower temperatures than other regions, they are characterized by higher altitudes which could result in high-intensity fires. Agroecological zone I is characterized by plantations that burn intensely. High fire intensity clusters (hot spots), as detected using the Getis Ord statistic (Gi*), have shown to be distributed in parts of the eastern (Mutasa, Nyanga, Chimanimani), northern (Centenary), and western (Tsholotsho, Hwange) districts as shown in Figure 3. The research findings also show that fires of low-intensity (cold spots) occur mostly in the northern districts such as Hurungwe, Kariba, Rushinga, Guruve, and others shown in Figure 3.
According to [46], the mean FRP in hot spot clusters is generally around 40 MW, indicating moderate to high fire intensity. This fire intensity class accounted for 20% of all the fire points detected by the MODIS satellite sensor in the study area in 2019. Table 3 shows that 44% of the detected fires had low fire intensity (cold spots), describing the majority of fires detected in Zimbabwe as cold fires. The fire intensity within cold spots range from 26 to 35 MW. Table 3 also shows that 36% of the active fires detected do not show significant clustering, indicating spatial randomness.
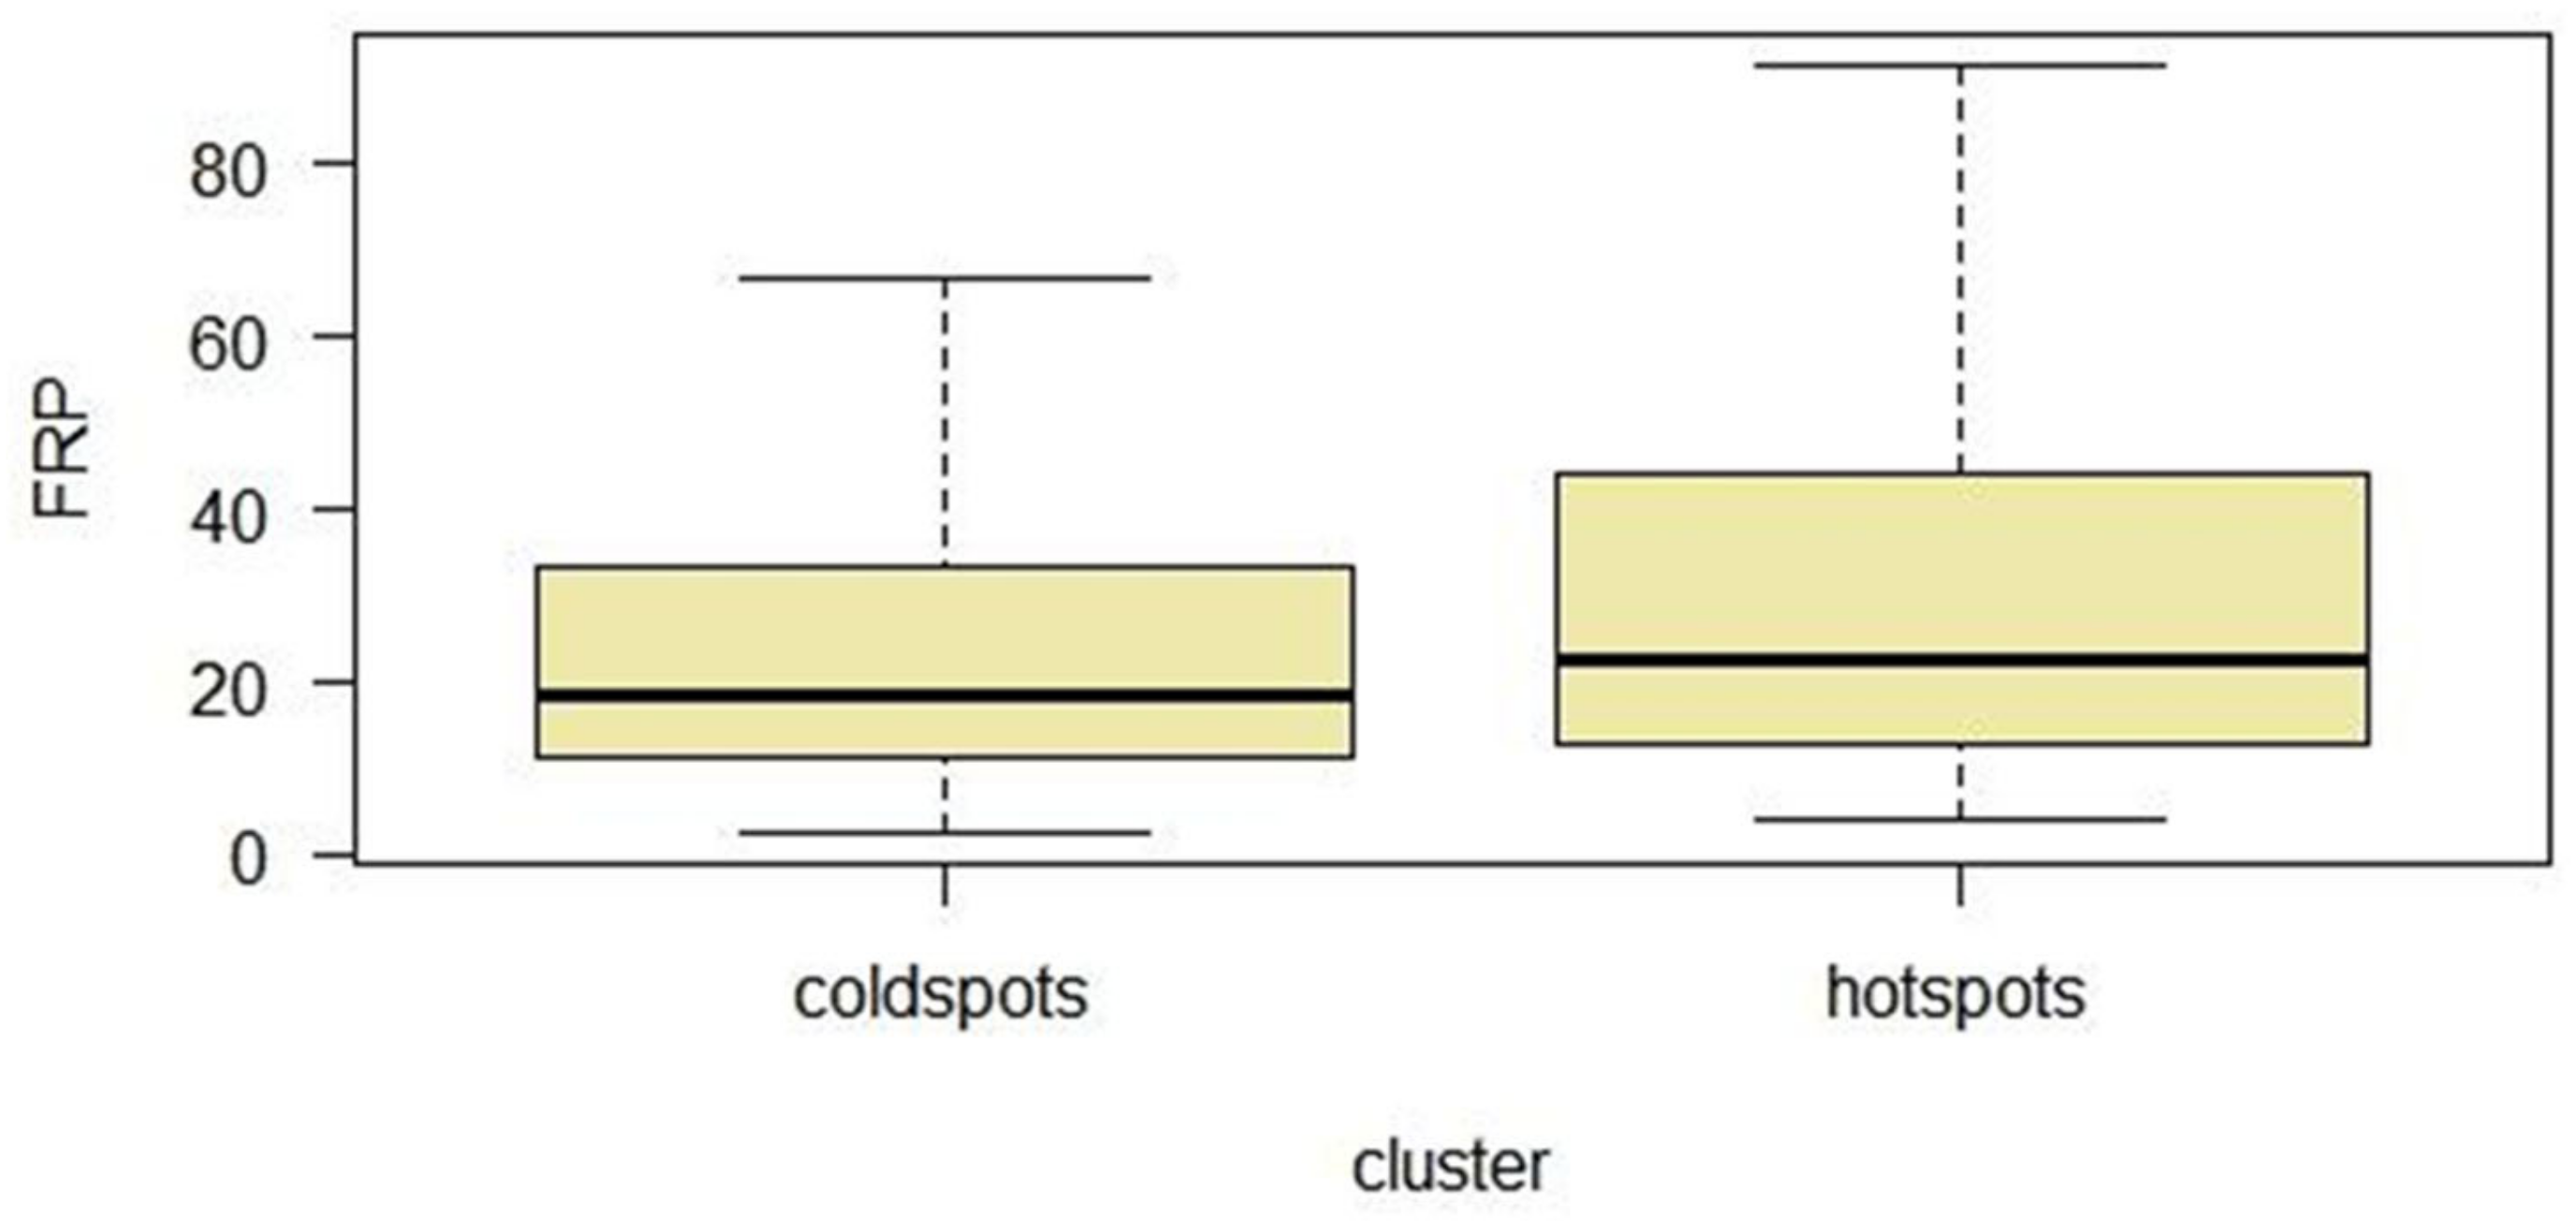
The statistical distribution of fire intensity (FRP) in the study area is shown in the box plots in Figure 5. The fire intensity as approximated by FRP is significantly (p < 0.05) higher within the hot spots than in the cold spots. This implies that although the greater proportion of fires under study was characterized by low fire intensity, the difference in the FRP between the fire intensity clusters is significant. It is important to note that most fires had fire intensity (FRP) of less than 50 MW although there exist outliers with FRP higher than 80 MW.

3.3. Association between Fire Intensity and Topography and Vegetation

3.3.1. Correlation of Fire Intensity with Topographic Variables

The results of the correlation analysis (Table 4) show a significant weak negative correlation between fire intensity (FRP) and slope, while a weak positive correlation exists between fire intensity and elevation. This is clearly shown in Figure 3, where high-intensity fires occur in the eastern region (agroecological zone I) of Zimbabwe, which is characterized by high elevation and mountainous terrain. The correlation between fire intensity and aspect was not significant.
Findings from the t-test show that high fire intensity (hot spots) are associated with higher elevation, as illustrated in Table 4.

3.3.2. Association between Fire Intensity and Vegetation Type

Analysis of the association between vegetation type and the intensity of burning is shown in Table 5 and shows that shrubland is affected by fire more than the other vegetation types. The highest proportion (49%) of cold fires occurred within shrublands and grasslands, whilst most hot fires were detected in shrublands, forests and grasslands. For example, within the high fire intensity class (hot spots), 12% of the detected fires occurred in the shrubland, while almost half (49.3%) of the fires within the low fire intensity class (cold spots) were detected in this vegetation type.
The sparse vegetation was least affected by burning. Grassland, forests, and croplands also experienced burning mostly of low intensity.

4. Discussion

This study demonstrates the heterogeneity of fire intensity as affected by various factors. It is the first to characterize the clustering of remotely sensed fire intensity in Zimbabwe. The highest fire activity was detected in northern districts, while low activity was recorded in the southern and south-western districts. Eastern districts such as Nyanga, Mutasa, Chimanimani, and Chipinge districts also experienced a considerable number of fire incidences. These findings agree with findings from a study by Shekede et al. [29], where high fire activity was observed in similar areas. The positive relationship between slope and fire occurrence has been observed in rugged terrains, such as those found in the eastern districts. High fire incidences were detected in agroecological regions IIa, IIb, and IV (Figure 3), which are characterized by a moderate rainfall and increasing temperatures [35].
The FRP derived from satellites is an indicator of the strength of fire which is directly related to the amount of biomass consumed by the fire [52]. The majority (44%) of the fires detected in 2019 were classified as cold spots meaning that they are of low to moderate intensity with mean FRP ranging from 26 to 34 MW. This observation corroborates with findings from Cizungu et al. [31], who observed low fire intensity fires within dense forest and agricultural areas. A study by Agata [17] in Poland also observed mean FRP of 36.3 and 35.1 in grasslands and forests, respectively. Zimbabwe is greatly characterized by savannah grasslands, so the findings from this study are not surprising. A very small proportion (20%) of the clusters of high-intensity fires were mainly concentrated in the eastern regions of Zimbabwe. However, even though high-intensity fires are few, they possess great destructive power [31], so appropriate precautions should be taken in such areas.
The study also assessed the association between fire intensity clusters and the various vegetation types and agroecological zones within the study area. Low fire intensity was detected in sparse vegetation and cropland classes, which is agrees with findings by Giglio et al. [46], who observed low FRP in croplands. On the other hand, Agata [17] observed highly intense fires in arable lands and grasslands. Zimbabwe is largely characterized by savannah grasslands hence general findings of low fire intensity [36,37,53]. The least effect of burning on the sparse vegetation could have resulted from low fuel loads since the vegetation is sparsely distributed.
High fire activity was detected in agroecological regions IIa, IIb, and IV, which are characterized by moderate rainfall and increasing temperatures [38]. High fire occurrence and intensity were observed in several districts in Manicaland province. This observation agrees with the findings mentioned in [54], where from 2001 to 2021, Manicaland had the highest rate of tree cover loss due to fires. The study shows that agroecological zones I and IIA and parts of agroecological zones III, IV, and VA are associated with high-intensity fires. Although agroecological zone I is associated with lower temperatures than other regions, the area is characterized by higher elevation and rugged terrain, which can contribute to high fire intensity [31,50,55]. High fire intensity clusters detected in parts of agroecological zone I could also be associated with plantations of fire-prone eucalyptus-related vegetation and heavy fuel load [31], which burn intensely and result in hot fires. High-intensity fires in the other regions could be attributed to warmer temperatures and the presence of flammable biomass [35].
The Gi* statistic was utilized to characterize both the type of clustering and its location and uses probability to determine fire intensity clusters [56] which is imperative for reliable and informed delineation of fire management zones. Although MODIS fire data does not show the source of ignition, this study has shown its utility in detecting fire intensity clusters in the study area. The dense canopy of forests also affects the detection of fire intensity by satellites.
Future studies should also assess burn severity which is positively correlated with fire intensity [18]. This is critical because it gives information on the effects of fire intensity levels on vegetation. In this research, fire intensity was analyzed at a larger scale; hence future studies should additionally look at a local scale to gain more finely-tuned information, which will improve fire management. Future studies should also utilize higher spatial resolution satellite data considering that the level of detection of active fires is highly determined by sensor differences such as resolution, swath width, and along scan aggregation [51,57,58]. The temporal distribution of fire intensity clustering as a function of climatic drivers should be prioritized in future studies. More variables should be considered to explain the spatial distribution of fire intensity. Since global climate warming may result in the increasing impact of fires on ecosystems [59], more fire studies have become relevant.

5. Conclusions

The research findings have shown the utility of a combination of MODIS fire data and spatial autocorrelation methods in mapping spatial patterns of fire intensity in Zimbabwe. The results suggest that most fires detected by the MODIS satellite in the study area were of low intensity (cold spots), while high-intensity fires (hot spots) were associated with mountainous areas of the study area. The study has, therefore, produced critical information which can be used in the management of fires in Zimbabwe. This information will assist fire management agencies to better allocate the limited resources to high-fire-intensity areas and hence plan appropriate fire management activities. Measures should be taken in areas where high fire intensity was observed, such as strict monitoring of fires. Information on fire intensity clusters will assist authorities responsible for fire management to intervene before (for prevention), during (for detection of fire intensity levels), and after the occurrence of fire (for mapping fire intensity). For example, real-time fire monitoring of fire intensity can be implemented by the fire managers to minimize damage by fire on various vegetation types. Areas with similar vegetation characteristics as in areas where high-intensity fires were detected will be given high priority. In addition, areas with high fire intensity clusters will receive the appropriate fire suppression during the fire. Well-equipped firefighting teams can also be set up when a fire occurs in fire-intensity hotspot areas. The research findings, therefore, show extended knowledge about the association between fire intensity and agroclimatic zones, topographic factors, and vegetation types. The global accessibility of MODIS active fire data has enabled the analysis of fire intensity at a broad spatial scale which is beneficial for data-poor regions like Zimbabwe.

Author Contributions

Conceptualization, U.N.M.; methodology, U.N.M., O.M., T.D. and P.K.; software, U.N.M.; Writing—original draft preparation, U.N.M.; writing—review and editing, U.N.M., O.M., T.D. and P.K.; visualization, U.N.M.; supervision, O.M. and T.D. All authors have read and agreed to the published version of the manuscript.

Funding

This research received no external funding.

Data Availability Statement

The data that support the findings of this study are available from the corresponding author upon reasonable request.

Conflicts of Interest

The authors would like to declare no conflict of interest.

References

  1. Andela, N.; van der Werf, G.R. Recent Trends in African Fires Driven by Cropland Expansion and El Niño to La Niña Transition. Nat. Clim. Change 2014, 4, 791–795. [Google Scholar] [CrossRef]
  2. Benali, A.; Mota, B.; Carvalhais, N.; Oom, D.; Miller, L.M.; Campagnolo, M.L.; Pereira, J.M.C. Bimodal Fire Regimes Unveil a Global-Scale Anthropogenic Fingerprint. Glob. Ecol. Biogeogr. 2017, 26, 799–811. [Google Scholar] [CrossRef]
  3. Buthelezi, N.; Mutanga, O.; Rouget, M.; Sibanda, M. A Spatial and Temporal Assessment of Fire Regimes on Different Vegetation Types Using MODIS Burnt Area Products. Bothalia 2016, 46, 9. [Google Scholar] [CrossRef]
  4. Filipponi, F. Exploitation of Sentinel-2 Time Series to Map Burned Areas at the National Level: A Case Study on the 2017 Italy Wildfires. Remote Sens. 2019, 11, 622. [Google Scholar] [CrossRef] [Green Version]
  5. Kganyago, M.; Shikwambana, L. Assessment of the Characteristics of Recent Major Wildfires in the USA, Australia and Brazil in 2018–2019 Using Multi-Source Satellite Products. Remote. Sens. 2020, 12, 1803. [Google Scholar] [CrossRef]
  6. Li, F.; Zhang, X.; Kondragunta, S.; Csiszar, I. Comparison of Fire Radiative Power Estimates from VIIRS and MODIS Observations. J. Geophys. Res. Atmospheres 2018, 123, 4545–4563. [Google Scholar] [CrossRef]
  7. Mupangwa, W.; Walker, S.; Twomlow, S. Start, End and Dry Spells of the Growing Season in Semi-Arid Southern Zimbabwe. J. Arid Environ.-J ARID Env. 2011, 75, 1097–1104. [Google Scholar] [CrossRef]
  8. Gambiza, J.; Campbell, B.M.; Moe, S.; Frost, P. Fire Behaviour in a Semi-Arid Baikiaea Plurijuga Woodland on Kalahari Sand in Western Zimbabwe. South Afr. J. Sci. 2005, 101, 239–244. [Google Scholar]
  9. Mohd Said, S.; Zahran, E.-S.; Shams, S. Forest Fire Risk Assessment Using Hotspot Analysis in GIS. Open Civ. Eng. J. 2017, 11, 786–801. [Google Scholar] [CrossRef] [Green Version]
  10. Dwyer, E.; Pinnock, S.; Gregoire, J.-M.; Pereira, J.M.C. Global Spatial and Temporal Distribution of Vegetation Fire as Determined from Satellite Observations. Int. J. Remote Sens. 2000, 21, 1289–1302. [Google Scholar] [CrossRef]
  11. Roberts, G.; Wooster, M.J. Global Impact of Landscape Fire Emissions on Surface Level PM2.5 Concentrations, Air Quality Exposure and Population Mortality. Atmos. Environ. 2021, 252, 118210. [Google Scholar] [CrossRef]
  12. Stefanidis, S.; Alexandridis, V.; Mallinis, G. A Cloud-Based Mapping Approach for Assessing Spatiotemporal Changes in Erosion Dynamics Due to Biotic and Abiotic Disturbances in a Mediterranean Peri-Urban Forest. Catena 2022, 218, 106564. [Google Scholar] [CrossRef]
  13. Stefanidis, S.; Alexandridis, V.; Spalevic, V.; Mincato, R.L. Wildfire Effects on Soil Erosion Dynamics: The Case of 2021 Megafires in Greece. Agric. For. 2022, 68, 49–63. [Google Scholar]
  14. Wooster, M.J.; Roberts, G.J.; Giglio, L.; Roy, D.P.; Freeborn, P.H.; Boschetti, L.; Justice, C.; Ichoku, C.; Schroeder, W.; Davies, D.; et al. Satellite Remote Sensing of Active Fires: History and Current Status, Applications and Future Requirements. Remote Sens. Environ. 2021, 267, 112694. [Google Scholar] [CrossRef]
  15. Vadrevu, K.P.; Csiszar, I.; Ellicott, E.; Giglio, L.; Badarinath, K.V.S.; Vermote, E.; Justice, C. Hotspot Analysis of Vegetation Fires and Intensity in the Indian Region. IEEE J. Sel. Top. Appl. Earth Obs. Remote Sens. 2013, 6, 224–234. [Google Scholar] [CrossRef]
  16. Eskandari, S.; Miesel, J.R.; Pourghasemi, H.R. The Temporal and Spatial Relationships between Climatic Parameters and Fire Occurrence in Northeastern Iran. Ecol. Indic. 2020, 118, 106720. [Google Scholar] [CrossRef]
  17. Agata, H.; Konrad, T. Use of Satellite Data for Monitoring Fire Events in Poland. In Proceedings of the IEEE Geoscience and Remote Sensing Symposium (IGARSS), Quebec City, QC, Canada, 13–18 July 2014; Institute of Electrical and Electronics Engineers Inc.: Interlaken, Switzerland, 2014; pp. 828–831. [Google Scholar]
  18. Keeley, J.E. Fire Intensity, Fire Severity and Burn Severity: A Brief Review and Suggested Usage. Int. J. Wildland Fire 2009, 18, 116–126. [Google Scholar] [CrossRef]
  19. Drewa, P.B. Effects of Fire Season and Intensity on Prosopis Glandulosa Torr. Var. Glandulosa. Int. J. Wildland Fire 2003, 12, 147–157. [Google Scholar] [CrossRef]
  20. Lentile, L.B.; Holden, Z.A.; Smith, A.M.S.; Falkowski, M.J.; Hudak, A.T.B.; Morgan, P.; Lewis, S.; Gessler, P.; Benson, N. Remote Sensing Techniques to Assess Active Fire Characteristics and Post-Fire Effects. Int. J. Wildland Fire 2006, 15, 319–345. [Google Scholar] [CrossRef]
  21. Getis, A. Reflections on Spatial Autocorrelation. Reg. Sci. Urban Econ. 35 Retrosp. Spec. Issue 2007, 37, 491–496. [Google Scholar] [CrossRef]
  22. Getis, A.; Ord, J.K. The Analysis of Spatial Association by Use of Distance Statistics. Geogr. Anal. 1992, 24, 189–206. [Google Scholar] [CrossRef]
  23. Anselin, L. Local Indicators of Spatial Association—ISA. Geogr. Anal. 1995, 27, 93–115. [Google Scholar] [CrossRef]
  24. Chainey, S.; Tompson, L.; Uhlig, S. The Utility of Hotspot Mapping for Predicting Spatial Patterns of Crime. Secur. J. 2008, 21, 4–28. [Google Scholar] [CrossRef]
  25. Wubuli, A.; Xue, F.; Jiang, D.; Yao, X.; Upur, H.; Wushouer, Q. Socio-Demographic Predictors and Distribution of Pulmonary Tuberculosis (TB) in Xinjiang, China: A Spatial Analysis. PLoS ONE 2015, 10, e0144010. [Google Scholar] [CrossRef] [PubMed]
  26. Kowe, P.; Mutanga, O.; Odindi, J.; Dube, T. Exploring the Spatial Patterns of Vegetation Fragmentation Using Local Spatial Autocorrelation Indices. J. Appl. Remote Sens. 2019, 13, 024523. [Google Scholar] [CrossRef]
  27. Kowe, P.; Mutanga, O.; Odindi, J.; Dube, T. A Quantitative Framework for Analysing Long Term Spatial Clustering and Vegetation Fragmentation in an Urban Landscape Using Multi-Temporal Landsat Data. Int. J. Appl. Earth Obs. Geoinformation 2020, 88, 102057. [Google Scholar] [CrossRef]
  28. Mpakairi, K.; Tagwireyi, P.; Ndaimani, H.; Madiri, H. Distribution of Wildland Fires and Possible Hotspots for the Zimbabwean Component of Kavango-Zambezi Transfrontier Conservation Area. South Afr. Geogr. J. 2018, 101, 110–120. [Google Scholar] [CrossRef]
  29. Shekede, M.D.; Gwitira, I.; Mamvura, C. Spatial Modelling of Wildfire Hotspots and Their Key Drivers across Districts of Zimbabwe, Southern Africa. Geocarto Int. 2019, 36, 874–887. [Google Scholar] [CrossRef]
  30. Mushore, T.D.; Mhizha, T.; Manjowe, M.; Mashawi, L.; Matandirotya, E.; Mashonjowa, E.; Mutasa, C.; Gwenzi, J.; Mushambi, G.T. Climate Change Adaptation and Mitigation Strategies for Small Holder Farmers: A Case of Nyanga District in Zimbabwe. Front. Clim. 2021, 3, 676495. [Google Scholar] [CrossRef]
  31. Cizungu, N.C.; Tshibasu, E.; Lutete, E.; Mushagalusa, C.A.; Mugumaarhahama, Y.; Ganza, D.; Karume, K.; Michel, B.; Lumbuenamo, R.; Bogaert, J. Fire Risk Assessment, Spatiotemporal Clustering and Hotspot Analysis in the Luki Biosphere Reserve Region, Western DR Congo. Trees For. People 2021, 5, 100104. [Google Scholar] [CrossRef]
  32. Zhang, Y.; He, H.S.; Yang, J. The Wildland-Urban Interface Dynamics in the Southeastern U.S. from 1990 to 2000. Landsc. Urban Plan. 2008, 85, 155–162. [Google Scholar] [CrossRef]
  33. Shoko, C.; Masocha, M.; Dube, T. A New Potential Method to Estimate Abundance of Small Game Species. Afr. J. Ecol. 2015, 53, 406–412. [Google Scholar] [CrossRef]
  34. Gwitira, I.; Murwira, A.; Shekede, M.; Masocha, M.; Chapano, C. Precipitation of the Warmest Quarter and Temperature of the Warmest Month Are Key to Understanding the Effect of Climate Change on Plant Species Diversity in Southern African Savannah. Afr. J. Ecol. 2014, 52, 209–216. [Google Scholar] [CrossRef]
  35. Manatsa, D.; Mushore, T.D.; T., G.; Wuta, M.; Chemura, A.; Shekede, M.; Mugandani, R.; Sakala, L.; L.H., A.; Masukwedza, G.I.; et al. Report on Revised Agroecological Zones of Zimbabwe; Government of Zimbabwe: Harare, Zimbabwe, 2020; in press. [Google Scholar]
  36. Archibald, S.; Scholes, R.J.; Roy, D.P.; Roberts, G.; Boschetti, L. Southern African Fire Regimes as Revealed by Remote Sensing. Int. J. Wildland Fire 2010, 19, 861–878. [Google Scholar] [CrossRef] [Green Version]
  37. Nyamadzawo, G.; Gwenzi, W.; Kanda, A.; Kundhlande, A.; Masona, C. Understanding the Causes, Socio-Economic and Environmental Impacts, and Management of Veld Fires in Tropical Zimbabwe. Fire Sci. Rev. SpringerOpen 2013, 2, 2. [Google Scholar] [CrossRef] [Green Version]
  38. Zimbabwe Deforestation Rates & Statistics | GFW. Available online: https://globalforestwatch.org/dashboards/country/ZWE/?burnedAreaRanked=eyJoaWdobGlnaHRlZCI6ZmFsc2V9&category=fires&dashboardPrompts=eyJzaG93UHJvbXB0cyI6dHJ1ZSwicHJvbXB0c1ZpZXdlZCI6WyJkb3dubG9hZERhc2hib2FyZFN0YXRzIiwiZGFzaGJvYXJkQW5hbHlzZXMiLCJ3aWRnZXRTZXR0aW5ncyJdLCJzZXR0aW5ncyI6eyJzaG93UHJvbXB0cyI6dHJ1ZSwicHJvbXB0c1ZpZXdlZCI6WyJkb3dubG9hZERhc2hib2FyZFN0YXRzIiwiZGFzaGJvYXJkQW5hbHlzZXMiLCJ3aWRnZXRTZXR0aW5ncyJdLCJzZXR0aW5ncyI6eyJzaG93UHJvbXB0cyI6dHJ1ZSwicHJvbXB0c1ZpZXdlZCI6WyJkb3dubG9hZERhc2hib2FyZFN0YXRzIiwiZGFzaGJvYXJkQW5hbHlzZXMiXSwic2V0dGluZ3MiOnsic2hvd1Byb21wdHMiOnRydWUsInByb21wdHNWaWV3ZWQiOltdLCJzZXR0aW5ncyI6eyJvcGVuIjpmYWxzZSwic3RlcEluZGV4IjowLCJzdGVwc0tleSI6IiJ9LCJvcGVuIjp0cnVlLCJzdGVwc0tleSI6ImRvd25sb2FkRGFzaGJvYXJkU3RhdHMifSwib3BlbiI6dHJ1ZSwic3RlcEluZGV4IjowLCJzdGVwc0tleSI6IndpZGdldFNldHRpbmdzIn0sInN0ZXBzS2V5Ijoid2lkZ2V0U2V0dGluZ3MiLCJzdGVwSW5kZXgiOi0xLCJmb3JjZSI6dHJ1ZX0sIm9wZW4iOnRydWUsInN0ZXBzS2V5Ijoic2hhcmVXaWRnZXQifQ%3D%3D&location=WyJjb3VudHJ5IiwiWldFIl0%3D&map=eyJjZW50ZXIiOnsibGF0IjotMTkuMDMzNTgzNTkzNjY5NzUsImxuZyI6MjkuMTU5MDU5NTI1MDA1MDEzfSwiem9vbSI6NC44MTA2NDUwNTQ4NzQ0MjMsImNhbkJvdW5kIjpmYWxzZSwiZGF0YXNldHMiOlt7ImRhdGFzZXQiOiJwb2xpdGljYWwtYm91bmRhcmllcyIsImxheWVycyI6WyJkaXNwdXRlZC1wb2xpdGljYWwtYm91bmRhcmllcyIsInBvbGl0aWNhbC1ib3VuZGFyaWVzIl0sImJvdW5kYXJ5Ijp0cnVlLCJvcGFjaXR5IjoxLCJ2aXNpYmlsaXR5Ijp0cnVlfSx7ImRhdGFzZXQiOiJmaXJlLWFsZXJ0cy12aWlycyIsImxheWVycyI6WyJmaXJlLWFsZXJ0cy12aWlycyJdLCJvcGFjaXR5IjoxLCJ2aXNpYmlsaXR5Ijp0cnVlLCJwYXJhbXMiOnsidmlzaWJpbGl0eSI6dHJ1ZSwiYWRtX2xldmVsIjoiYWRtMCJ9LCJ0aW1lbGluZVBhcmFtcyI6eyJzdGFydERhdGVBYnNvbHV0ZSI6IjIwMjItMDctMjMiLCJlbmREYXRlQWJzb2x1dGUiOiIyMDIyLTEwLTIxIiwic3RhcnREYXRlIjoiMjAyMi0wNy0yMyIsImVuZERhdGUiOiIyMDIyLTEwLTIxIiwidHJpbUVuZERhdGUiOiIyMDIyLTEwLTIxIn19XX0%3D&showMap=true (accessed on 21 October 2022).
  39. Vadrevu, K.; Lasko, K. Intercomparison of MODIS AQUA and VIIRS I-Band Fires and Emissions in an Agricultural Landscape—Implications for Air Pollution Research. Remote Sens. 2018, 10, 978. [Google Scholar] [CrossRef] [Green Version]
  40. Giglio, L.; Randerson, J.; Van Der Werf, G. Analysis of Daily, Monthly, and Annual Burned Area Using the Fourth-Generation Global Fire Emissions Database (GFED4. J Geophys Res Biogeosci 2013, 118, 317–328. [Google Scholar] [CrossRef] [Green Version]
  41. Soro, T.D.; Koné, M.; N’Dri, B.; Touré, N. Identified Main Fire Hotspots and Seasons in Côte d’Ivoire (West Africa) Using MODIS Fire Data. South Afr. J. Sci. 2021, 117, 1–13. [Google Scholar] [CrossRef]
  42. Giglio, L.; Descloitres, J.; Justice, C.; Kaufman, Y. An Enhanced Contextual Fire Detection Algorithm for MODIS. Remote Sens. Environ. 2003, 87, 273–282. [Google Scholar] [CrossRef]
  43. Chen, Y.; Zhu, X.; Yebra, M.; Harris, S. Strata-Based Forest Fuel Classification for Wild Fire Hazard Assessment Using Terrestrial LiDAR. J. Appl. Remote Sens. 2016, 10, 046025. [Google Scholar] [CrossRef] [Green Version]
  44. Chen, C.-Y.; Yang, Q.-H. Hotspot Analysis of the Spatial and Temporal Distribution of Fires. In Proceedings of the GISTAM; SciTePress: Setubal, Portugal, 2018; pp. 15–21. [Google Scholar]
  45. Chuvieco, E.; Giglio, L.; Justice, C. Global Characterization of Fire Activity: Toward Defining Fire Regimes from Earth Observation Data. Glob. Change Biol. 2008, 14, 1488–1502. [Google Scholar] [CrossRef]
  46. Giglio, L.; Csiszar, I.; Justice, C.O. Global Distribution and Seasonality of Active Fires as Observed with the Terra and Aqua Moderate Resolution Imaging Spectroradiometer (MODIS) Sensors. J. Geophys. Res. Biogeosciences 2006, 111. [Google Scholar] [CrossRef]
  47. Ichoku, C.; Kaufman, Y.J.; Hao, W.M.; Habib, S. Application of MODIS-Derived Active Fire Radiative Energy to Fire Disaster and Smoke Pollution Monitoring; IEEE: New York, NY, USA, 2004; p. 1115. ISBN 0-7803-8742-2. [Google Scholar]
  48. Giglio, L.; Schroeder, W.; Justice, C.O. MODIS Collection 6 Active Fire Product User’s Guide Revision B; Elsevier: Amsterdam, The Netherlands, 2018. [Google Scholar]
  49. Lanorte, A.; Danese, M.; Lasaponara, R.; Murgante, B. Multiscale Mapping of Burn Area and Severity Using Multisensor Satellite Data and Spatial Autocorrelation Analysis. Int. J. Appl. Earth Obs. Geoinf. 2013, 20, 42–51. [Google Scholar] [CrossRef]
  50. Zúñiga-Vásquez, J.M.; Pompa-García, M. The Occurrence of Forest Fires in Mexico Presents an Altitudinal Tendency: A Geospatial Analysis. Nat. Hazards 2019, 96, 213–224. [Google Scholar] [CrossRef]
  51. Ruecker, G.; Leimbach, D.; Tiemann, J. Estimation of Byram’s Fire Intensity and Rate of Spread from Spaceborne Remote Sensing Data in a Savanna Landscape. Fire 2021, 4, 65. [Google Scholar] [CrossRef]
  52. Kganyago, M.; Shikwambana, L. Assessing Spatio-Temporal Variability of Wildfires and Their Impact on Sub-Saharan Ecosystems and Air Quality Using Multisource Remotely Sensed Data and Trend Analysis. Sustain. Switz. 2019, 11, 6811. [Google Scholar] [CrossRef] [Green Version]
  53. Scholes, R.J.; Archer, S.R. Tree-Grass Interactions in Savannas. Annu. Rev. Ecol. Syst. 1997, 28, 517–544. [Google Scholar] [CrossRef]
  54. Zimbabwe Climate, Weather By Month, Average Temperature—Weather Spark. Available online: https://weatherspark.com/countries/ZW (accessed on 21 October 2022).
  55. Zhang, X.; Kondragunta, S. Temporal and Spatial Variability in Biomass Burned Areas across the USA Derived from the GOES Fire Product. Remote Sens. Environ. 2008, 112, 2886–2897. [Google Scholar] [CrossRef]
  56. Peeters, A.; Zude, M.; Käthner, J.; Ünlü, M.; Kanber, R.; Hetzroni, A.; Gebbers, R.; Ben-Gal, A. Getis–Ord’s Hot- and Cold-Spot Statistics as a Basis for Multivariate Spatial Clustering of Orchard Tree Data. Comput. Electron. Agric. 2015, 111, 140–150. [Google Scholar] [CrossRef]
  57. Liu, X.; Zhang, J.; Tong, Z.; Bao, Y. GIS-Based Multi-Dimensional Risk Assessment of the Grassland Fire in Northern China. Nat. Hazards 2012, 64, 381–395. [Google Scholar] [CrossRef]
  58. Liu, Y.; Lu, J.; Luo, J.; Zhang, G.; He, L. Synchronous satellite wide area monitoring for overhead transmission line wildfire and tower location. Dianwang JishuPower Syst. Technol. 2018, 42, 1322–1327. [Google Scholar] [CrossRef]
  59. Brotons, L.; Aquilué, N.; de Cáceres, M.; Fortin, M.-J.; Fall, A. How Fire History, Fire Suppression Practices and Climate Change Affect Wildfire Regimes in Mediterranean Landscapes. PLoS ONE 2013, 8, e62392. [Google Scholar] [CrossRef] [PubMed]
Figure 1. Study area map showing agroecological zones: Adapted from Manatsa et al. [35].
Atmosphere 13 01972 g001
Figure 2. Spatial distribution of active fires.
Atmosphere 13 01972 g002
Figure 3. Spatial distribution of fire intensity clusters.
Atmosphere 13 01972 g003
Figure 4. Fire intensity clusters in agroecological zones.
Atmosphere 13 01972 g004
Figure 5. The distribution of FRP within fire intensity clusters.
Atmosphere 13 01972 g005
Table 1. Datasets used in the study.
DatasetSource
MODIS (MCD14DL) active fire datahttps://earthdata.nasa.gov/earth-observation-data/near-real-time/firms/active-fire-data (accessed on 10 March 2022)
Digital Elevation Model (DEM)https://earthexplorer.usgs.gov/ (accessed on 15 March 2022)
Land cover maphttps://viewer.esa-worldcover.org/worldcover/ (accessed on 27 March 2022)
Table 2. Topographic variables.
VariableSource
SlopeExtracted from the Digital Elevation Model using Spatial Analyst tool in ArcMap 10.6
AspectExtracted from the Digital Elevation Model using Spatial Analyst tool in ArcMap 10.6
ElevationDigital Elevation Model
Table 3. Characteristics of fire intensity clusters.
ClassNumber of Fire CountsPercentage %Mean FRP (MW)Fire Intensity Class
[48]
Cold spot (99% CI)10,3092926.33Low
Cold spot (95% CI)35031028.93Low
Cold spot (90% CI)1657534.49Moderate
Not significant12,58036
Hot spot (90% CI)427140.39High
Hot spot (95% CI)805239.10Moderate
Hot spot (99% CI)60351740.39High
Table 4. Correlation between FRP and topographic variables.
FRP vs. SlopeFRP vs. AspectFRP vs. Elevation
r−0.0186−0.00080.0718
p value0.00050.8843<0.0001
Significant? (alpha = 0.05)YesNoYes
Table 5. Distribution of fire intensity in vegetation types.
Hot SpotCold Spots
Number of Fire CountsPercentage (%)Number of Fire CountsPercentage (%)
Forests15407.8225014.5
Grassland23266.6327521.2
Cropland8474179111.6
Shrubland238112762749.3
Sparse vegetation1120.64623
Publisher’s Note: MDPI stays neutral with regard to jurisdictional claims in published maps and institutional affiliations.