Article

Probabilistic Forecast of Visibility at Gimpo, Incheon, and Jeju International Airports Using Weighted Model Averaging

1
Applied Meteorology Research Division, National Institute of Meteorological Sciences, Jeju 63568, Republic of Korea
2
Department of Applied Mathematics, Kongju National University, Gongju 32588, Republic of Korea
*
Author to whom correspondence should be addressed.
Atmosphere 2022, 13(12), 1969; https://doi.org/10.3390/atmos13121969
Submission received: 22 September 2022 / Revised: 10 November 2022 / Accepted: 21 November 2022 / Published: 25 November 2022
(This article belongs to the Section Meteorology)

Abstract

:
In this study, weighted model averaging (WMA) was applied to calibrating ensemble forecasts generated using Limited-area ENsemble prediction System (LENS). WMA is an easy-to-implement post-processing technique that assigns a greater weight to the ensemble member forecast that exhibits better performance; it is used to provide probabilistic visibility forecasting in the form of a predictive probability density function for ensembles. The predictive probability density function is a mixture of discrete point mass and two-sided truncated normal distribution components. Observations were obtained at Gimpo, Incheon, and Jeju International Airports, and 13 ensemble member forecasts were obtained using LENS, for the period of December 2018 to June 2019. Prior to applying WMA, a reliability analysis was conducted using rank histograms and reliability diagrams to identify the statistical consistency between the ensembles and the corresponding observations. The WMA method was then applied to each raw ensemble model, and a weighted predictive probability density function was proposed. Performances were evaluated using the mean absolute error, the continuous ranked probability score, the Brier score, and the probability integral transform. The results showed that the proposed method provided improved performance compared with the raw ensembles, indicating that the raw ensembles were well calibrated using the predicted probability density function.

1. Introduction

The aviation sector requires new high-quality forecast information for all types of weather conditions. In particular, it is difficult to provide high-quality information on weather variables (e. g., wind direction, wind speed, cloud altitude, visibility, etc.) directly related to aviation safety with existing numerical weather prediction (NWP) systems. Visibility is one of the important aspects of aviation weather. The lack of visibility is hazardous for airplane landing operations and can be detrimental for its management, as it can lead to delays and cancellations. Efforts have been made to produce more reliable and accurate prediction information based on the ensemble NWP system. However, the visibility forecasts generated using NWP can be biased and dispersive, due to the limitations of the models. Therefore, deterministic and probabilistic forecasts can be applied to provide improved results by calibrating these uncertainties.
Several methods for forecasting visibility and post-processing forecasts in short-time forecasting have been developed. Vislocky and Fritsch [1] compared the performance of observation-based, model output statistics-based, and persistence climatology models for short-term deterministic ceiling and visibility forecasts. Leyton and Fritsch [2,3] extended the observation-based approach using high-density and, later, high-frequency networks of surface observations to produce probabilistic forecasts. Pasini et al. [4], Bremnes and Michaelides [5], and Marzban et al. [6] applied neural networks for probabilistic visibility forecasting. Zhou et al. [7] described the use of a short-range ensemble forecast system to generate probabilistic visibility forecasts. Roquelaure and Bergot [8,9] and Roquelaure et al. [10] were the first to use Bayesian model averaging (BMA) in visibility forecasting. Their studies modeled binary low-visibility outcomes using a local ensemble prediction system at Charles de Gaulle Airport in Paris. However, none of the existing methods provides a general framework for generating a full predictive probability density function (PDF) for visibility. Chmielecki and Raftery [11] applied BMA to probabilistic visibility forecasting using a fully predictive PDF that is a mixture of discrete point mass and beta distribution components. BMA, introduced by Raftery et al. [12], helps to produce calibrated predictive PDFs for any weather parameter of interest. This method has been successfully used to generate probabilistic forecasts of temperature, sea level pressure, quantitative precipitation [13,14], wind speed [15,16], and wind direction [17].
We analyzed the probabilistic forecast of visibility using a statistical post-processing method based on the reliability analysis of ensemble forecasts of visibility. Various statistical post-processing techniques, for example, BMA [12] or ensemble model output statistics (EMOS [18]), are widely used to reduce systematic errors and uncertainties caused by initial conditions and parametrization in NWP systems [11,16,19,20]. In addition, these methods can improve the accuracy by increasing the correlation between observations and ensemble forecasts or by removing the existing biases. Among the statistical post-processing methods, the most preferred method is to provide probabilistic forecasts that have a full probability distribution of an interest variable. The basic concept of probabilistic prediction is to derive probabilistic forecasts by applying a PDF to future weather variables for events and to provide information on the magnitude of the occurrence and possibility of an interesting event (or threshold) through its probability generated from the predictive PDF. That is, the objective of probabilistic prediction is to reduce the variation in predictive distribution, thus leading to conformity between the probability density functions of observations and those of the corresponding ensemble forecasts [21,22].
In this study, we propose weighted model averaging (WMA) as a way of generating probabilistic forecasts of visibility. The basic concepts of the WMA model are almost the same as those of the BMA model but provide an easier means to estimate parameters than BMA. A detailed description is provided in Section 3.
The remainder of this paper is organized as follows: In Section 2, we briefly describe the visibility forecasts generated using LENS. In Section 3, we describe WMA and its application to visibility forecasting. The results of the method for daily 1 h forecasts of visibility are presented in Section 4. Finally, conclusions are presented in Section 5.

2. Data

Visibility data obtained from Gimpo, Incheon, and Jeju International Airports in South Korea, and 13 ensemble member forecasts obtained using LENS, a numerical forecast model operated by Korea Meteorological Administration (KMA), were used in this study. LENS consists of 13 members, 1 unperturbed control member and 12 perturbed members selected from the global ensemble prediction system with 32 km horizontal resolution. The horizontal resolution of LENS is 2.2 km for the domain including the Korea peninsula. In addition, LENS has 70 terrain-following vertical levels up to 40 km. The LENS microphysics scheme is rooted in Wilson and Ballard [23], and visibility is calculated as
V i s i b i l i t y = l n ε / ( β a i r + β ) = l n ε / ( β a i r + π N r m 2 Q η )
where the liminal contrast is ε = 0.05, β a i r is the extinction coefficient of clean air (which is assumed to be equivalent to 100 km visibility), β is the extinction coefficient of droplets (dry or wet) in a volume, Q is the extinction efficiency, and η is the ratio of the mean square radius to the square of the mean radius of the droplets (η ( r 2 / r m 2 ) = 0.75) [24,25].
Datasets of hourly visibility, precipitation, and relative humidity were obtained between 1 December 2018 and 30 June 2019, and the ensemble forecast was conducted at 0000 UTC and 1200 UTC for projection times of 1 h, 4 h, and 24 h. Since the model resolution changed on 29 November 2018, only the datasets from December 2018 to June 2019 were analyzed. The information on the observation stations is presented in Table 1.
Prior to the analyses, we checked the missing values of ensemble forecasts and their corresponding observations for the entire period. If either was absent, both were removed from the datasets. Because the property of visibility may vary depending on the season, to consider this seasonal characteristic, the datasets were converted into seasonal data (winter and spring) for the three stations.
We first examined the empirical distributions of the observed visibility data and ensemble forecasts. The plots of the empirical distributions for Station 110 are presented in Figure 1. The first histogram presents the frequencies of all observed visibility, and the second histogram only shows the frequencies of observations below 10 km. The majority of all visibility values were recorded at exactly 10 km (Figure 1(1)), which indicated that observation was censored at 10 km, even if the visibility measure was more than 10 km. In addition, this plot shows a mixture of discrete probabilities of point masses for visibility values of 10 km; therefore, a continuous probability distribution was appropriate. In Figure 1(2), the observations are highly discretized. A histogram of the ensemble forecasts is presented in Figure 1(3). The scales of the observation and ensemble forecasts varied considerably. Ensemble forecasts generated visibility values much greater than 10 km and were not constrained at 10 km, in contrast to values obtained from the observations. In addition, ensemble forecasts were continuous and were skewed to the right. For Stations 113 (Incheon) and 182 (Jeju), the empirical distributions of the observed visibility and ensemble forecast showed patterns similar to those obtained for Station 110.

3. Materials and Methods

To set up the probabilistic prediction model for visibility, the characteristics of data from observed visibility and from the corresponding ensemble forecasts had to be considered. The observed visibility was censored at 10 km, while the corresponding ensemble forecasts generated using LENS had positive real numbers. In other words, even if visibility was observed for more than 10 km, the observed visibility was recorded as 10 km; in contrast, the corresponding values from the ensemble forecasts were used as they were generated. Therefore, we needed a probabilistic model that reconciled the results obtained from these different datasets.

3.1. Weighted Model Averaging

We consider WMA, which models the predictive PDF of a weather quantity of interest y , as a mixture of the conditional PDFs. Let f k be the k th ensemble member forecast and h k ( y | f k ) a mixture of the conditional PDF given a specific forecast f k . The WMA predictive PDF is given by
p ( y | f 1 ,   f 2 ,   ,   f K ) = k   =   1 K w k h k ( y | f k )
where w k is the weight of the k th ensemble member forecast and refers to its relative skill over the training period. The weights are constrained to be non-negative and sum to 1.
To determine the mixture of conditional PDF h k ( y | f k ) , we consider a two-component model. The first part consists of a point mass at 10 km and corresponds to the probability that the recorded visibility is 10 km, which is conditional on the kth forecast in the ensemble. The second component of the model assigns a member-specific PDF to visibility, given that it is less than 10 km. We use a two-sided truncated normal distribution defined in (0, 10).
First, we apply a logistic regression model to estimate the probability that the observed visibility is 10 km, given the forecast of the kth ensemble member, f k , as follows:
logit   P ( y = 10 | f k ) = log P ( y = 10 | f k ) P ( y < 10 | f k ) = a 0 k + a 1 k f k
where a 0 k and a 1 k are regression coefficients, and these parameters are estimated using a logistic regression model using the member forecasts in the training period as predictors and a vector of binary indicator of y = 10 as the response variable.
To predict visibility when the observed visibility is less than 10 km, we consider a two-sided truncated normal distribution. Observed visibility y has a normal distribution, with mean μ and variance σ 2 defined for 0 < y < 10, and the PDF for 0 < y < 10 is given by
p ( y | μ ,   σ ) = ( y     μ σ ) σ ( Φ ( 10     μ σ ) Φ ( μ σ ) ) ,   0 < y < 10
where Φ ( · ) is the PDF of the standard normal distribution and Φ ( · ) is its cumulative distribution function.
Combining the two components of the model, we build a final conditional PDF for visibility, given the kth ensemble member forecast, as follows:
h k ( y | f k ) = P ( y < 10 ) g k ( y | f k ) I ( y < 10 ) + P ( y = 10 | f k ) I ( y = 10 )
where g k ( y | f k ) is a member-specified truncated normal distribution. The final WMA model for the predictive probability density function of visibility y is given by
p ( y | f 1 , ,   f K ) = k   =   1 K w k [ P ( y < 10 | f k ) g k ( y | f k ) I ( y < 10 ) + P ( y = 10 | f k ) I ( y = 10 ) ]
where
g k ( y | f k ) = ϕ ( y     μ k σ k ) σ k ( Φ ( 10     μ k σ k ) Φ ( μ k σ k ) ) ,   0 < y < 10
with mean μ k = b 0 k + b 1 k f k and standard deviation σ k of the truncated normal distribution.
We consider a relative humidity variable for inclusion in each component of the model. The model for binary outcome y = 10 is represented by
logit   P ( y = 10 | f k ,     r k ) = a 0 k + a 1 k f k + a 2 k r k
where f k and r k are the member-specified visibility and relative humidity forecasts, respectively. Given that y < 10 , the mean and standard deviation of the associated member-specific two-sided truncated normal distribution is specified as
μ k = b 0 k + b 1 k f k + b 2 k r k
and
σ k = c k
By inserting these two components into Equation (6), we consider the predictive PDF that takes into account the relative humidity variable.
For the given observation of visibility less than 10 km, parameters b 0 k and b 1 k , and standard deviation σ k are estimated using the method of maximum likelihood.
Parameters w 1 ,   ,   w K are estimated as follows: After estimating parameters μ k = b 0 k + b 1 k f k , standard deviation σ k , and the probability that the observed visibility is 10 km given the forecast of the kth ensemble member f k over the training period, the median value is derived from the truncated normal distribution based on Equation (6) to estimate the visibility for less than 10 km. The corresponding estimates of observed visibility y during the training period are obtained as
o ^ = [ o ^ 11 o ^ 1 K   o ^ n 1 o ^ n K ]
where o ^ i , k = { 10 ,   P ( y i = 10 | f i , k ) 0.5 , m e d i a n   v a l u e ,   o t h e r w i s e , i = 1 , , n ,   k = 1 ,   ,   K ; K is the total number of ensemble members; and n is the total number of observations.
We used the mean absolute error (MAE) and non-negative least squares to determine weights w 1 ,   ,   w K . The weight based on MAE is used to assign the largest weight to the ensemble member forecast with the smallest prediction error in the training period. In contrast, the weights based on non-negative least squares are determined by minimizing the following weighted combinations:
w ^ = ( w ^ 1 ,   ,   w ^ K )   = arg   min   i   =   1 n ( y i k   =   1 K w k o ^ i k ) 2 ,   w k 0 ,     k   =   1 K w k = 1 .
To select one of the two estimated weights, each prediction error is calculated for the training period; then, the weights ( w = ( w 1 ,   ,   w K ) ) that provide the smallest prediction error are finally selected. WMA is applied to each station individually.

3.2. Scoring Rules

Prior to setting up a statistical model of ensemble member forecasts, we evaluated the prediction skills of ensembles. The measures used for comparing the prediction skills were the Brier score [26,27] for the binary events (y = 10), the continuous ranked probability score (CRPS), the mean absolute error (MAE), and the root mean square error (RMSE). The Brier score (BS) is defined as the mean squared error of the forecast probability for y = 10, as follows:
B S = 1 n i   =   1 n ( p i o i ) 2  
where n is the number of observations; p i is the forecasted probability of P ( y = 10 ) ; and o i is 1 if y = 10 and 0 otherwise. The BS takes a value in the range between 0 and 1, and the perfect BS has a value of zero. The CRPS [22,28] is an accurate scoring rule, which is defined as
c r p s ( F ,   y ) = ( F ( x ) 1 ( x y ) ) 2 d x
where F ( · ) is the cumulative distribution function of the forecast, y is the observation, and 1 ( · ) is the indicator function. CRPS is a generalization of the MAE and is a more general measure of model fit than the BS.

4. Results

Since the visibility may vary depending on the season, to consider the seasonal characteristic, the datasets were divided into seasonal data (winter and spring) for the three stations. For each station, the model was estimated using the training dataset, and the performance was evaluated using the test dataset. The training and test periods for each season are given in Table 2.
The point forecast using WMA was obtained by evaluating the median of the predictive probability density function. Similarly, we took the median of the ensemble forecasts to be the point forecast associated with the raw ensembles. In the calculation of the prediction performances, all ensemble forecasts greater than 10 km were set to 10 km to facilitate the comparisons between WMA and ensemble forecasts.

4.1. Reliability Analysis

A rank histogram (RH) [29,30] was used to assess the reliability of the visibility ensemble forecasts and their corresponding observations at the three stations. The RH is a very useful visual tool for evaluating the reliability of ensemble forecasts and for identifying errors related to their mean and spread.
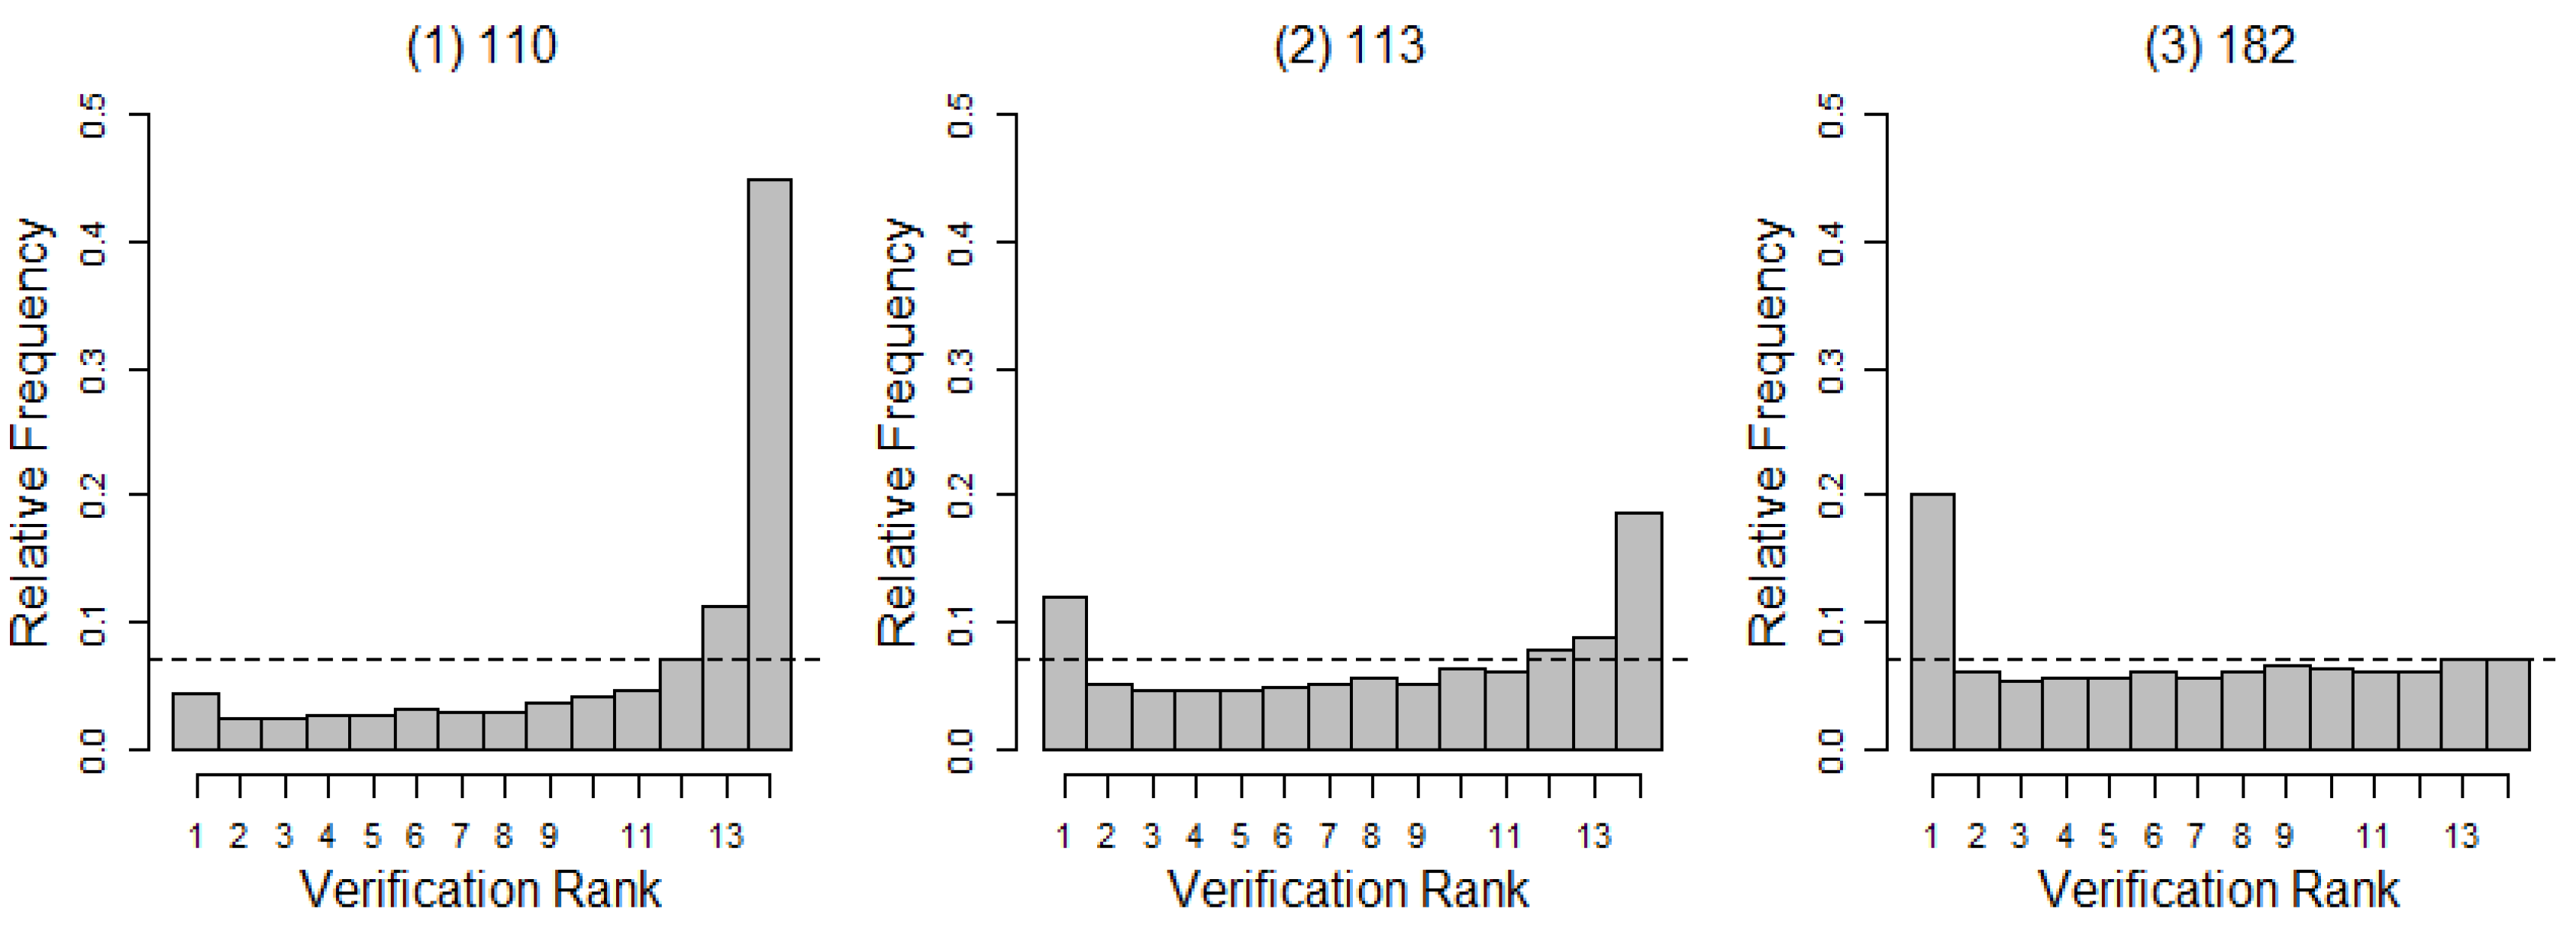
The RHs of the 13 ensemble forecasts and the corresponding observation visibility values for the three stations, that is, Gimpo (110), Incheon (113), and Jeju (183), are presented in Figure 2. In general, the RHs showed different trends and dispersions for each station. For Station 110 (Gimpo), an RH with high counts near the right extreme and low frequency counts near the left extreme presented a systematic error in the data of the ensembles; ensemble forecasts had a strong negative bias, which indicated an under-estimation. For Station 113 (Incheon), the RH showed nearly similar frequency counts at both extremes but had a slightly higher frequency on the right. This implied that the ensemble forecasts may have been under-dispersive and had a weak negative bias. However, the RH for Station 182 (Jeju) tended to have an almost uniform distribution, although it had a slightly higher frequency on the extreme left of the histogram.
The reliability index [31] was used to quantify the deviation of the rank distribution from uniformity. The reliability index (RI) is defined as
R I = k   =   1 K | p k 1 K | ,
where K denotes the number of classes in the rank histogram and p k denotes the observed relative frequency in class k. If the ensemble forecasts and observations were obtained from the same distribution, the RI would have been zero. The RI for each station in Figure 2 is listed in Table 3, and their values show that they were far from uniformity.

4.2. Prediction Skill

The prediction skills of the ensemble forecasts are listed in Table 4. From the table, it can be seen that the prediction skills for Jeju International Airport (182) were superior to those for other stations in terms of the three scoring measures. This was similar to the results of the RHs. As the RH for Station 110 (Gimpo) had a strong negative bias, this indicated that the corresponding prediction error was relatively larger than that for the other stations.
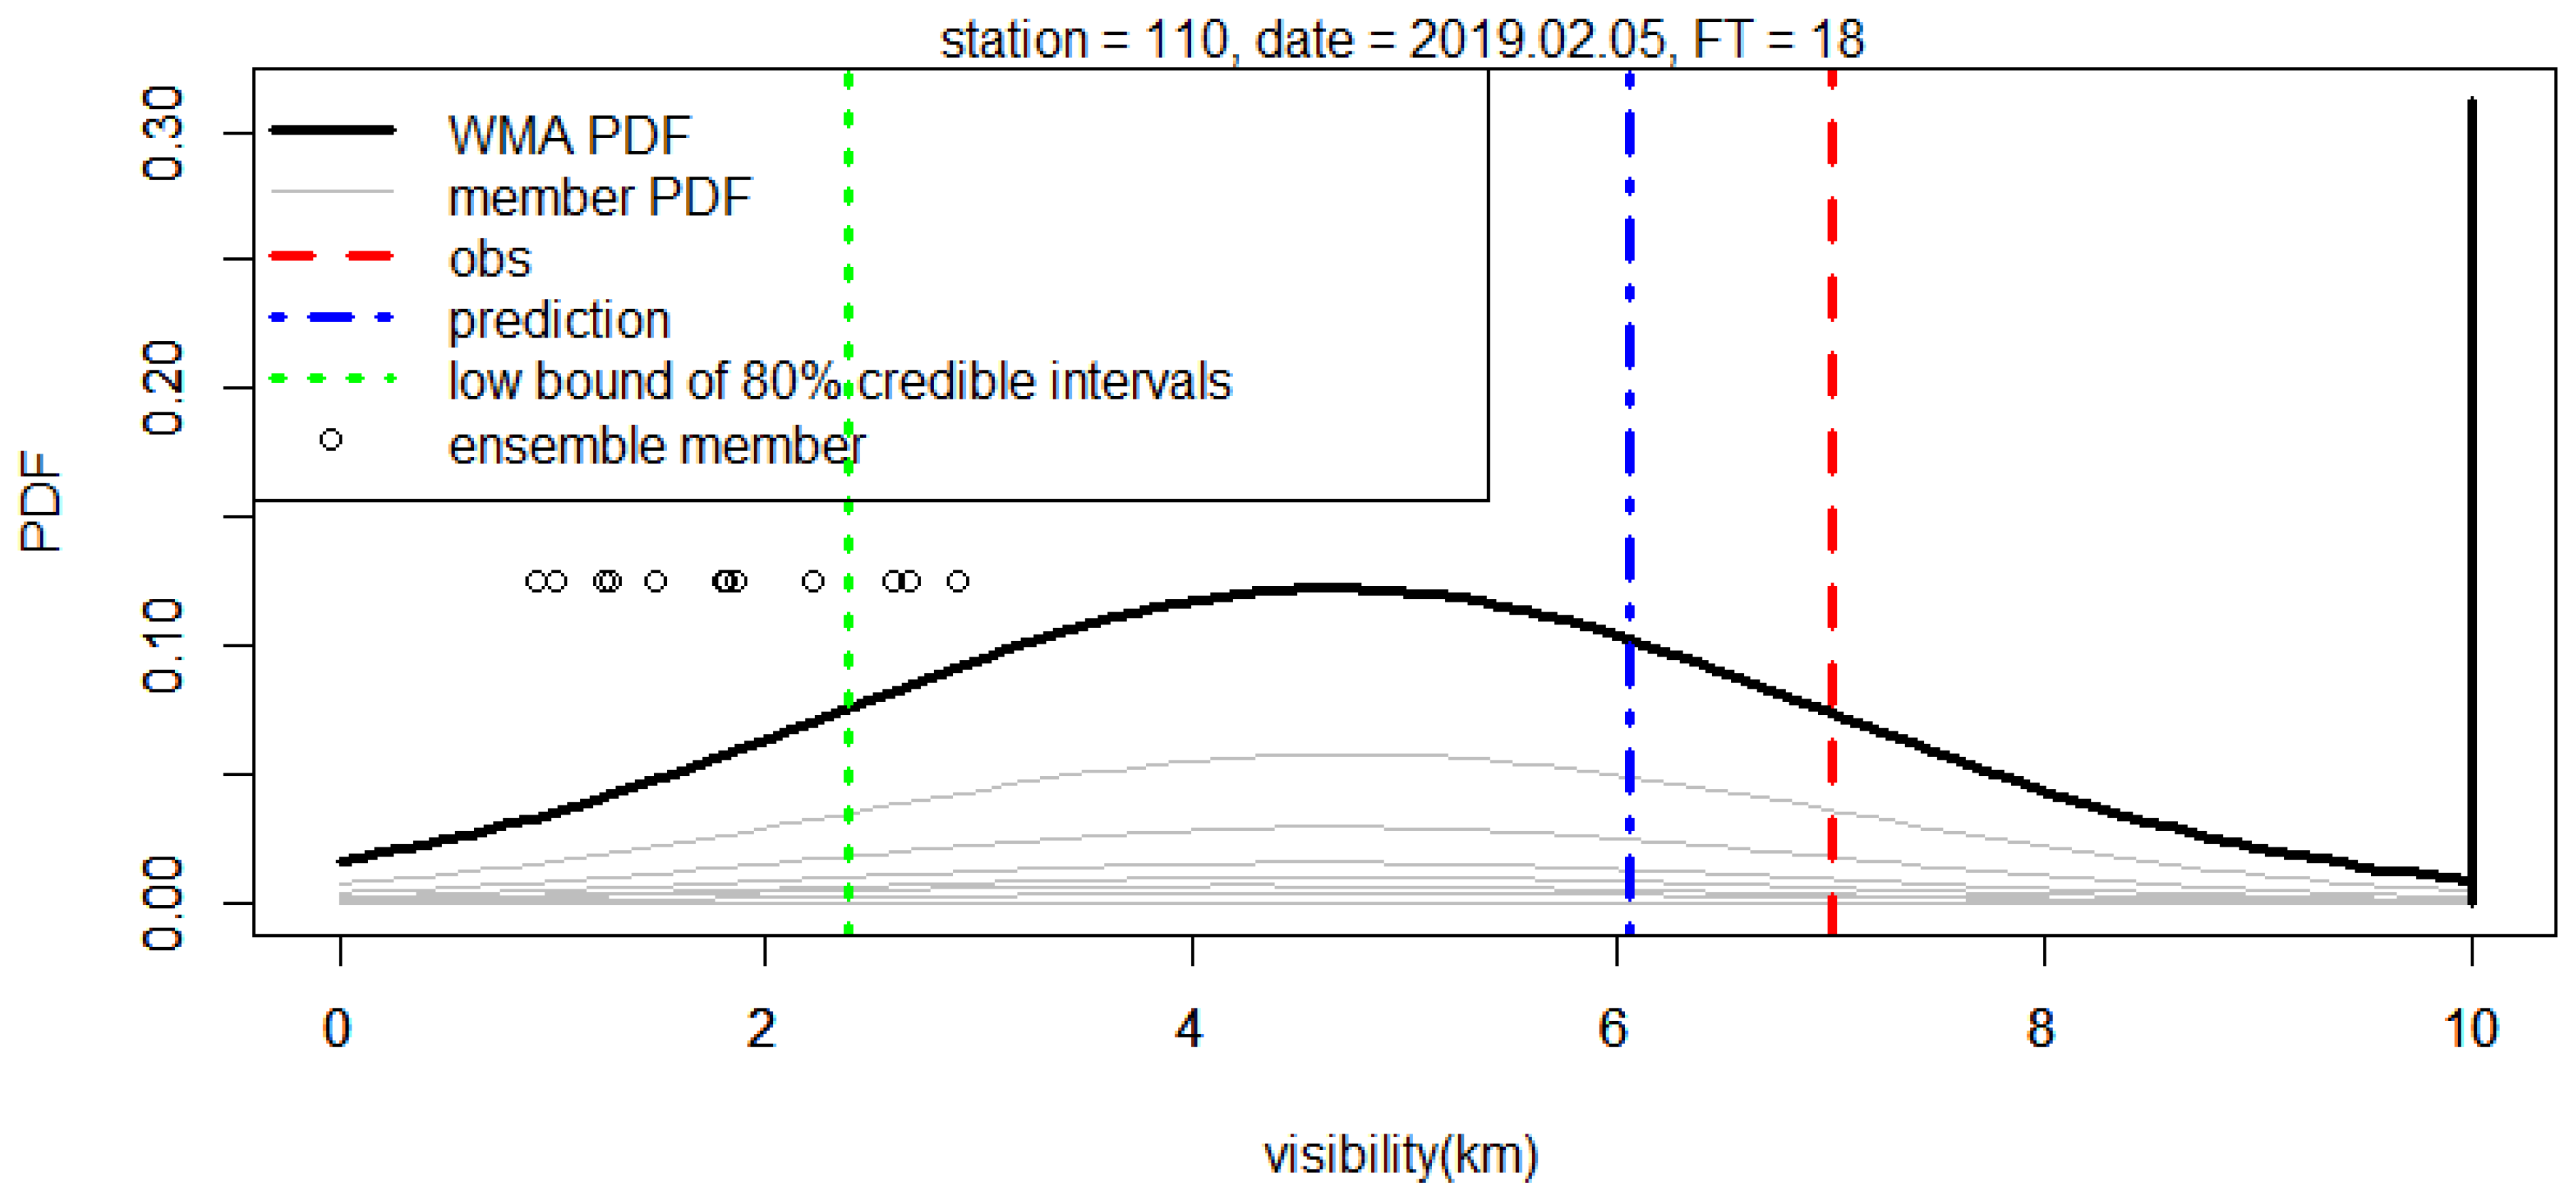
We applied the WMA model to each projection time to obtain the probabilistic forecast, and the prediction performance was evaluated by comparing the station and projection time. The results for Station 110 (Gimpo) considering 5 February 2019, and the projection time of 6 h, are shown in Table 5 and Figure 3.
Table 5 lists each ensemble forecast and the corresponding WMA output details, and Figure 3 depicts the WMA predictive PDF and contributions from the weighted ensemble PDFs. From Table 5 and Figure 3, it can be seen that the range of ensemble forecasts was approximately in the range of 0.9–3.0 km, and the verifying observation value was 7 km. Although the observation value lay outside the range of ensemble forecasts, it was within 80% of the central predictive interval obtained using WMA.
The comparison of the prediction performances of the ensemble median and WMA median forecast for each station in terms of the MAE, CRPS, and BS according to season is listed in Table 6. As shown in the table, although the prediction skills of the models differed slightly depending on the season, it could be seen that the prediction skills of the WMA forecast were better than those of the ensemble for all stations. Among them, it could be seen that the prediction error was significantly improved for Station 110, and the prediction error for Station 182 (Jeju) was less improved. These improvements could also be inferred from the results of the previous reliability analysis. Since the RH for Station 110 had a strong trend (negative bias), this bias was significantly calibrated in the predictive probability model, whereas the RH for Station 182 (Jeju) was generally uniform, indicating that it was relatively less calibrated for bias.
We then assessed whether adding additional predictors resulted in improved WMA forecasts. The available independent variables (predictors) in this study were relative humidity and quantitative precipitation. Quantitative precipitation was mostly 0, which was not useful for estimating visibility. Therefore, only the relative humidity was significantly associated with observed visibility, and we limited the inclusion to this additional predictor.
Table 7 lists the model performance scores of WMA for visibility (denoted by WMA (vis)), WMA for visibility and relative humidity (denoted by WMA (vis, rh)), and the raw ensembles. From the table, it can be seen that the WMA models performed better than the raw ensembles across all scores; in particular, the WMA(vis, rh) model showed a slight improvement over the WMA(vis) model. Moreover, for Station 110 (Gimpo), it can be seen that the prediction error improved significantly; the prediction error was less improved for Station 182 (Jeju). The results showed that it was similar to the reliability analysis that is mentioned above. We could see that the prediction performance in spring was better than that in winter, and this implied that prediction performance can be affected by season, that is, different prediction performances may be delivered according to the season.
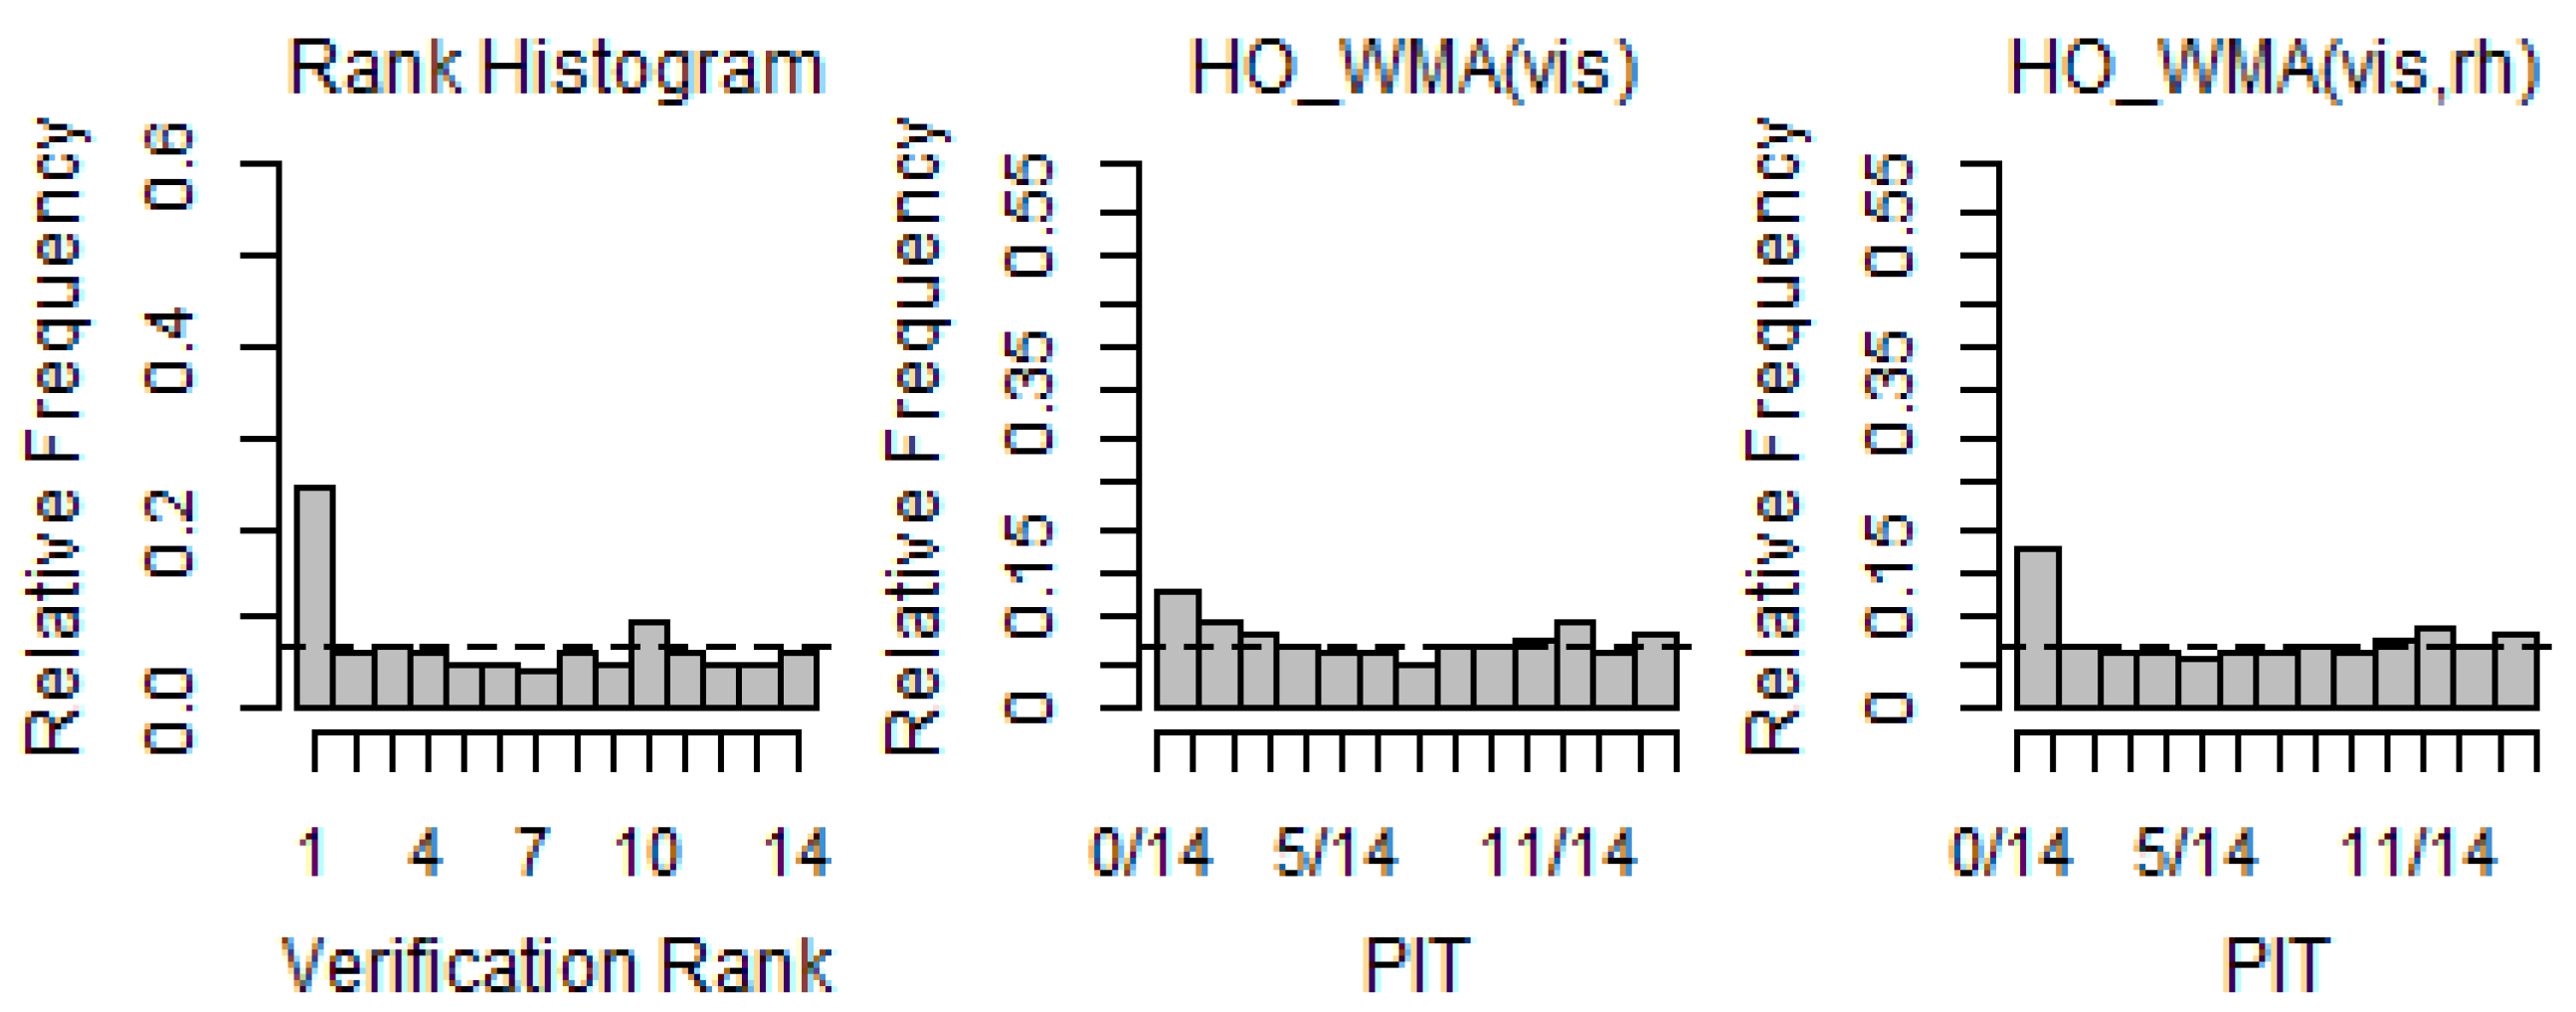
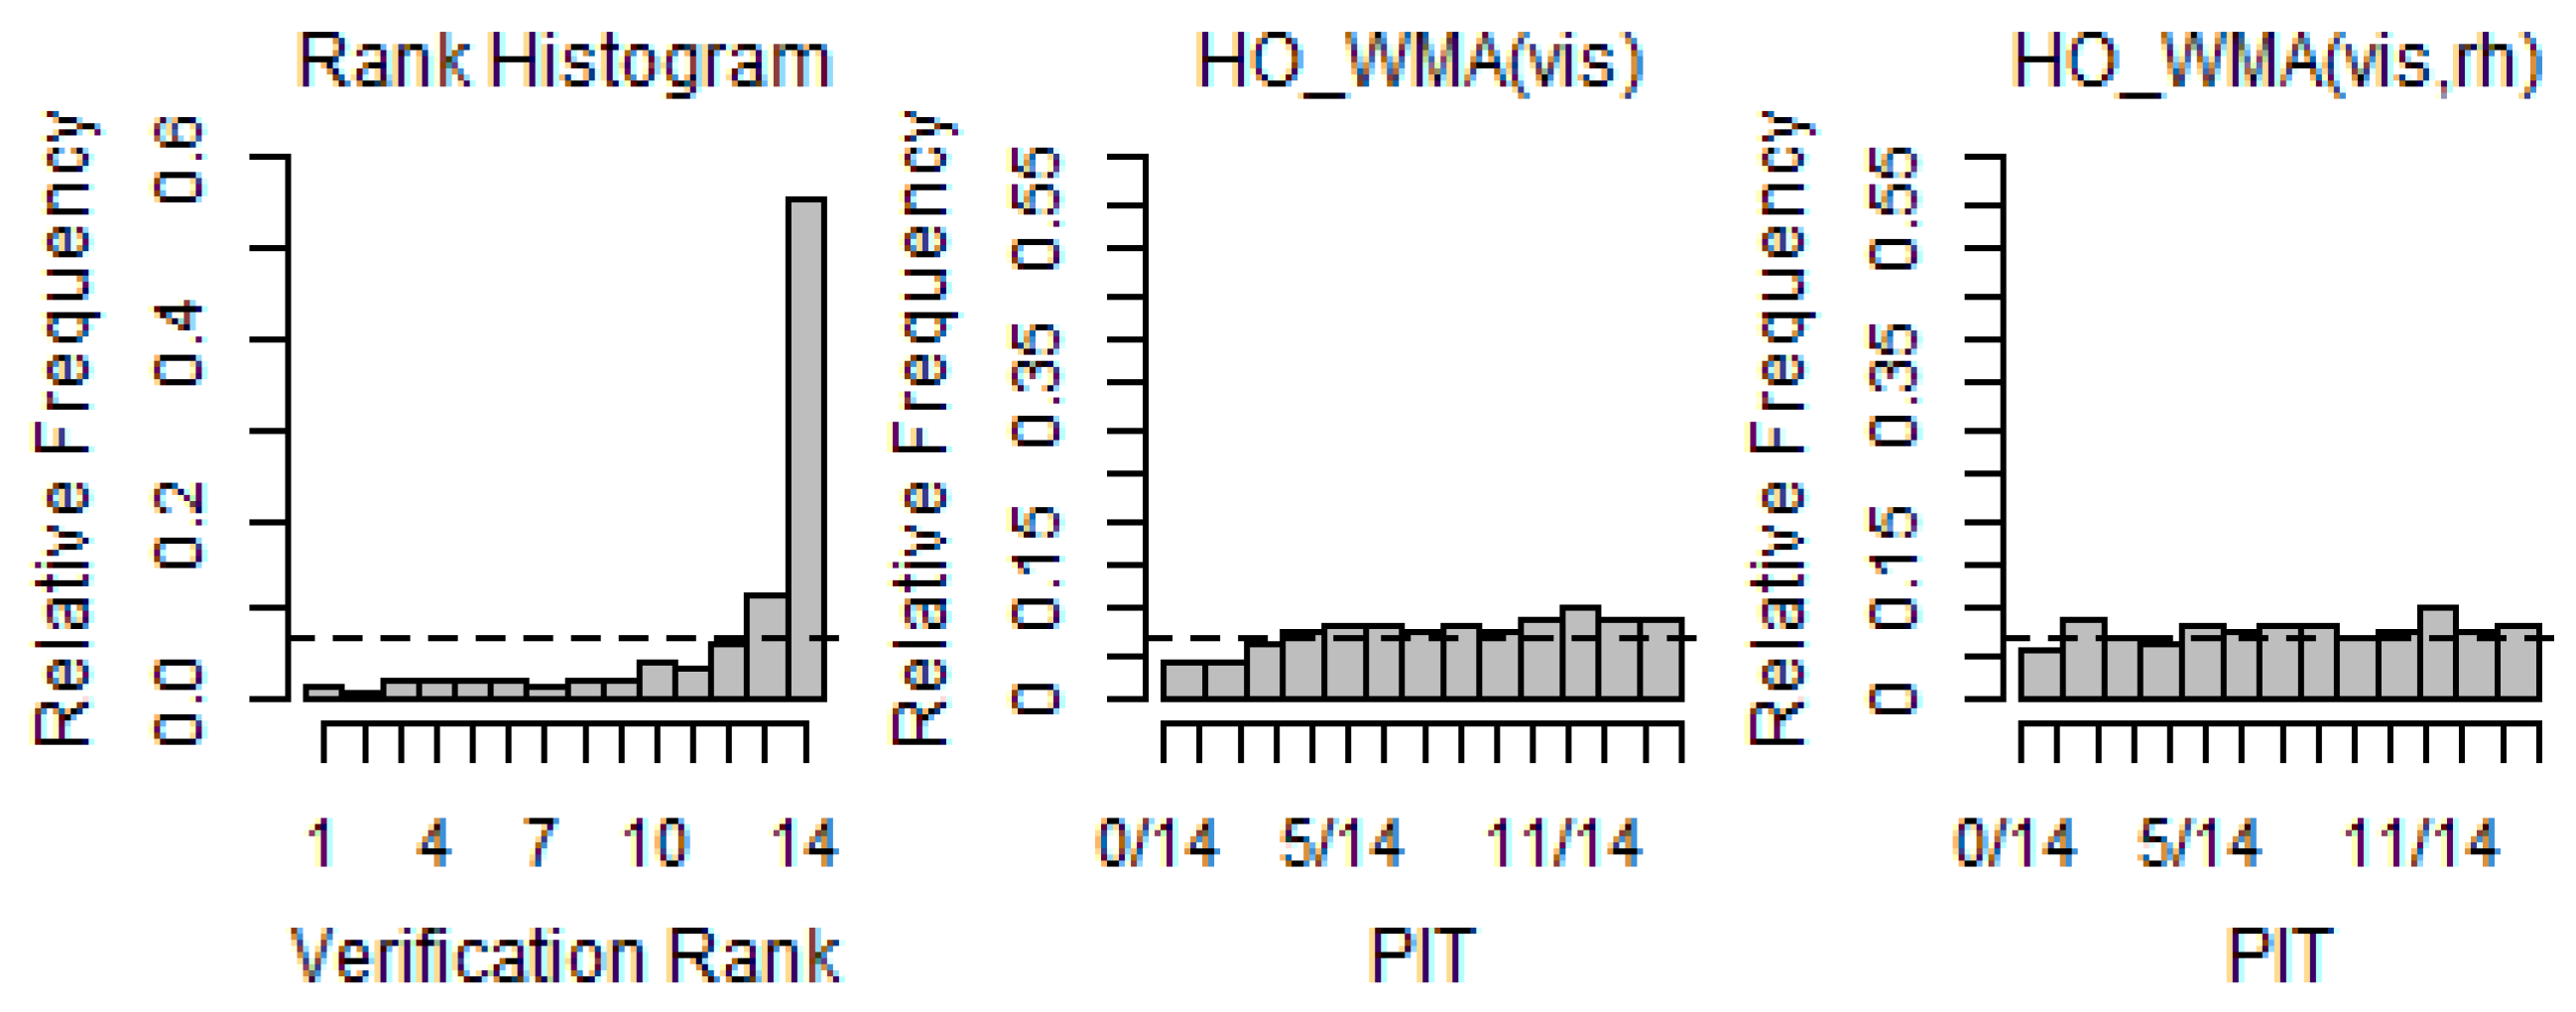
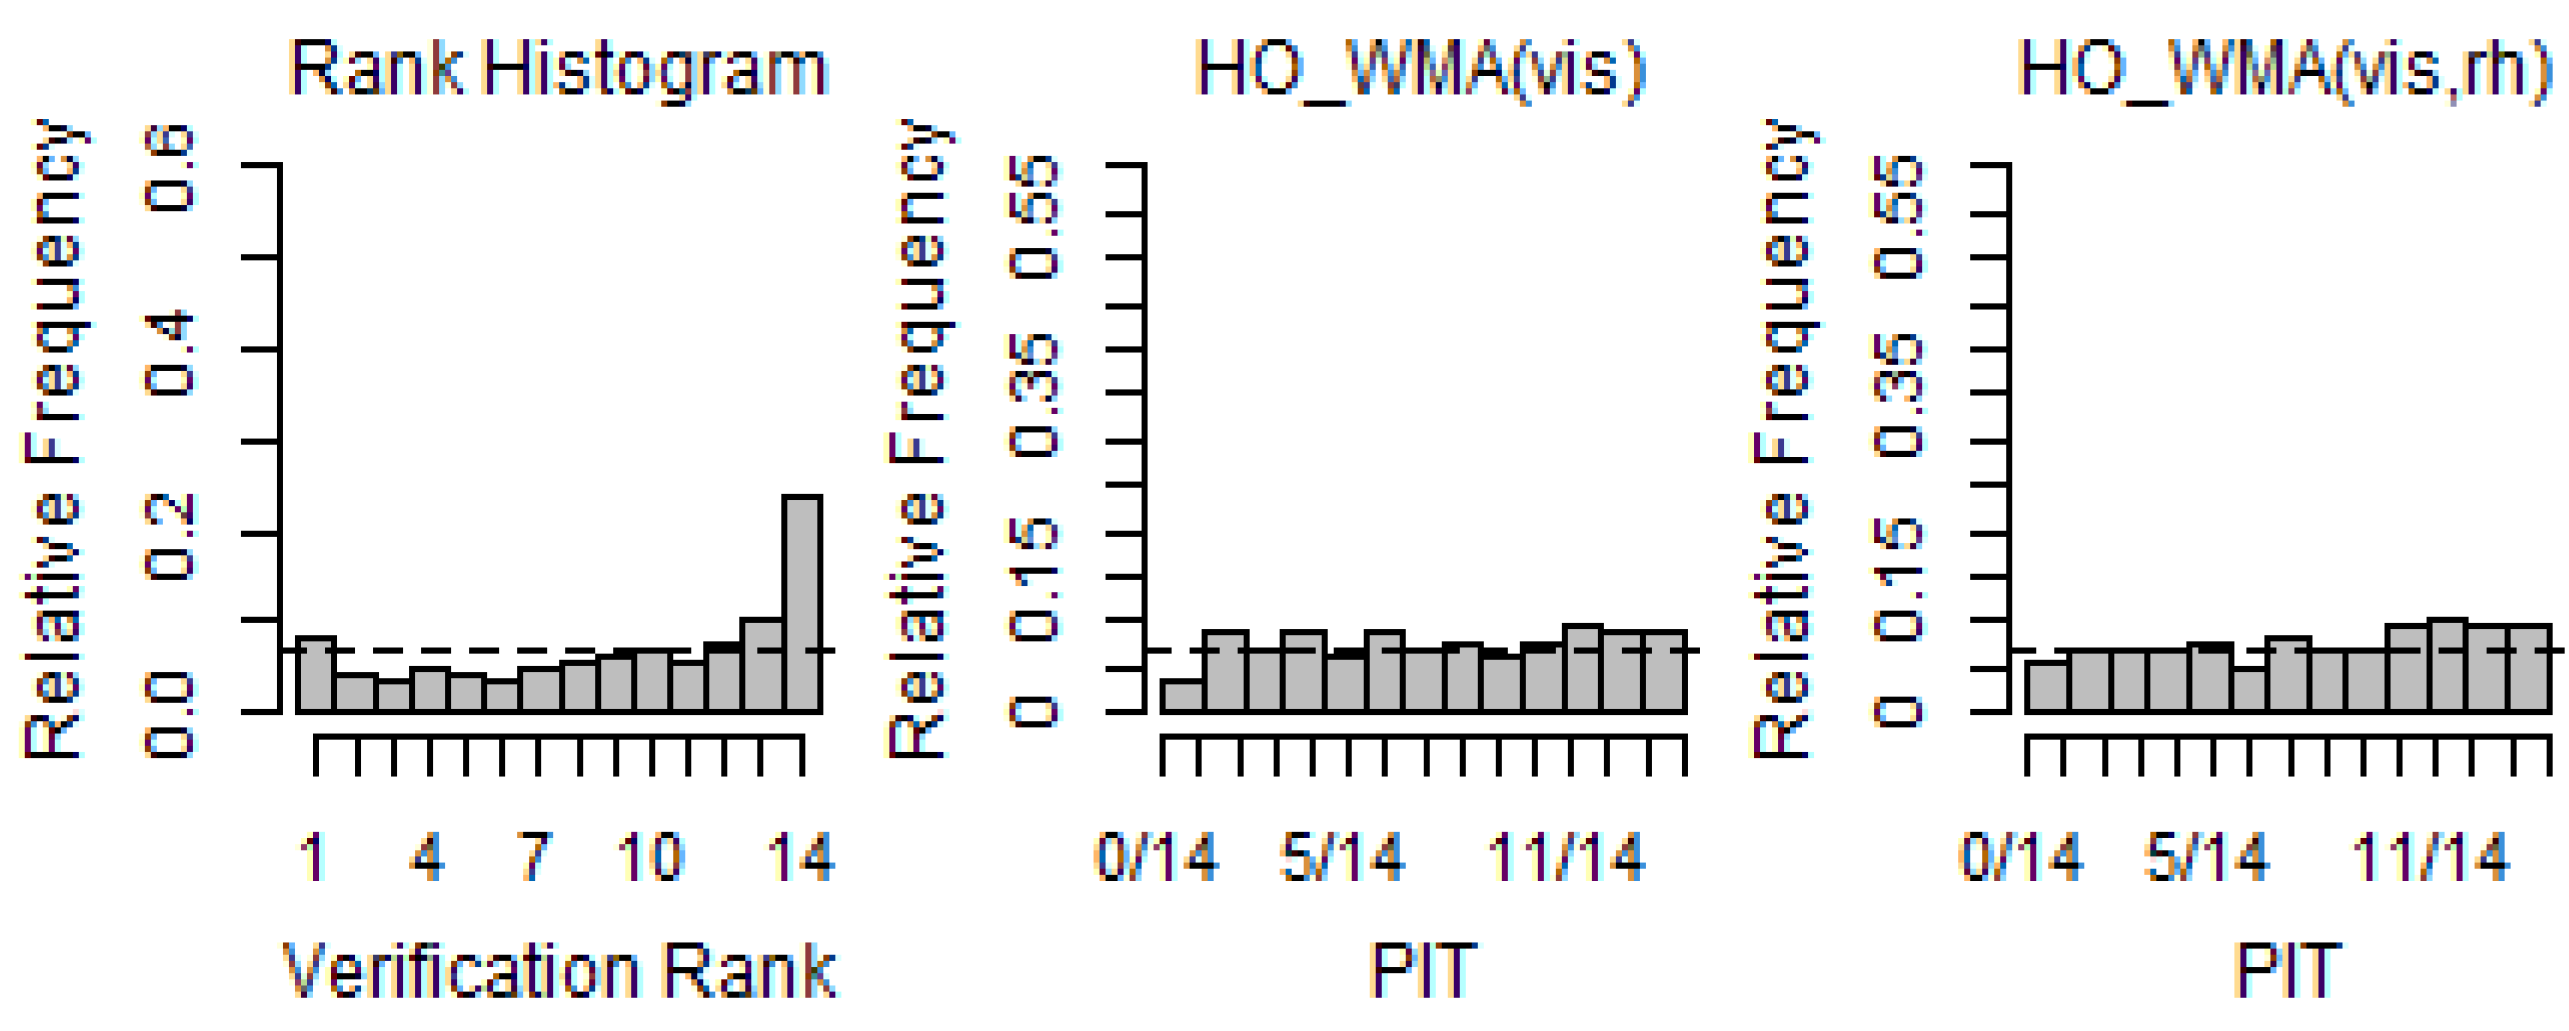
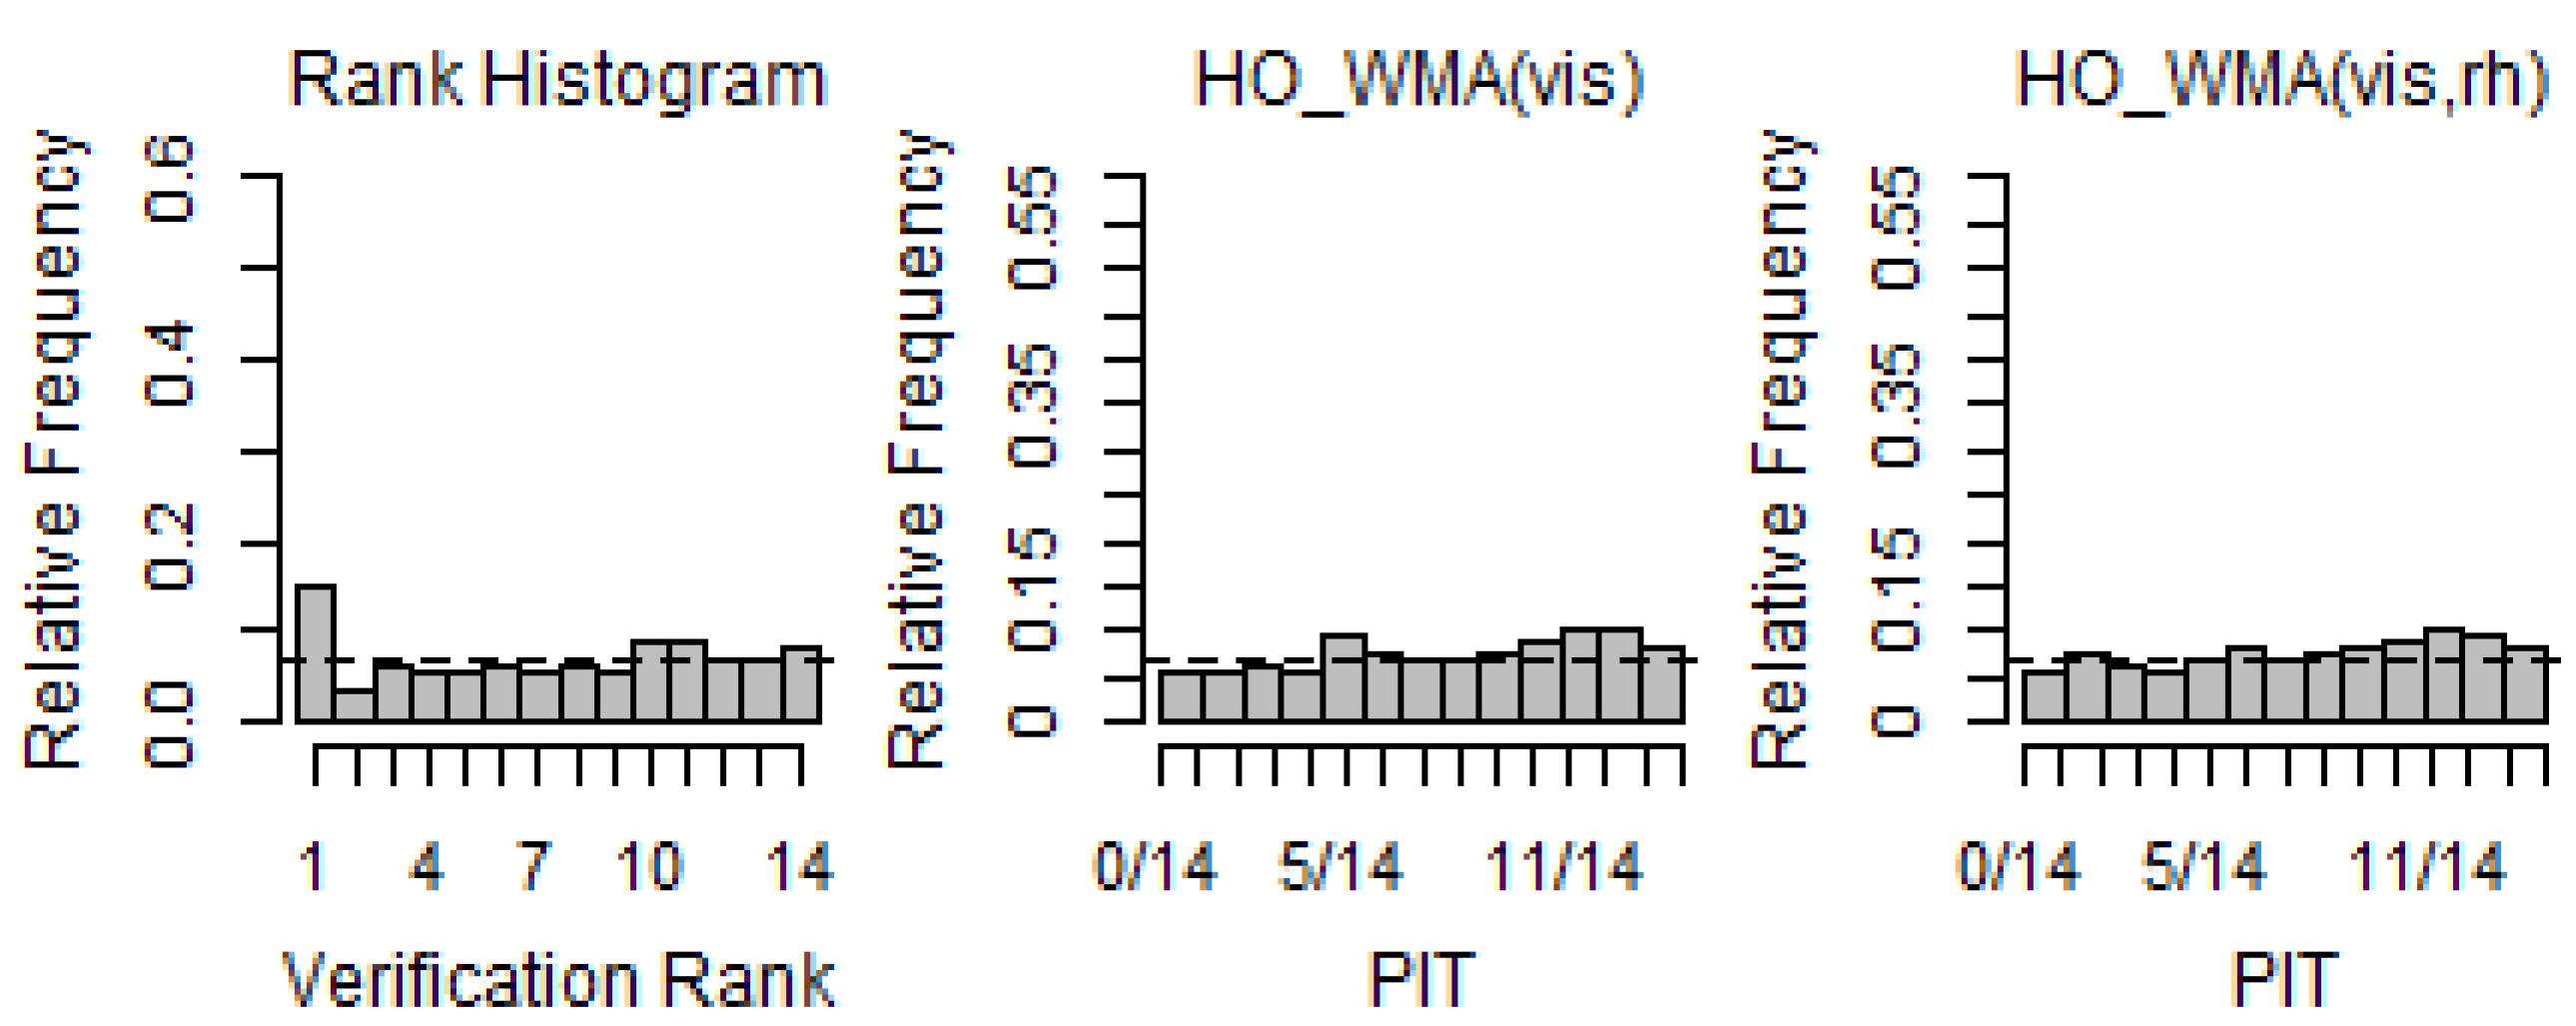
We then evaluated the performance of the complete predictive probability density function generated using the WMA model. Figure 4, Figure 5, Figure 6, Figure 7, Figure 8 and Figure 9 show the verification RHs of the raw ensembles and the probability integral transform (PIT) histograms of the WMA forecasts for each station for winter and spring during the test period. To generate the PIT histograms, each WMA cumulative distribution function was evaluated for the corresponding observation that was less than 10 km. For observations of 10 km, the resulting probability was sampled randomly from a uniform distribution in the interval between the quantity of 1 P ( y = 10 ) and 1.
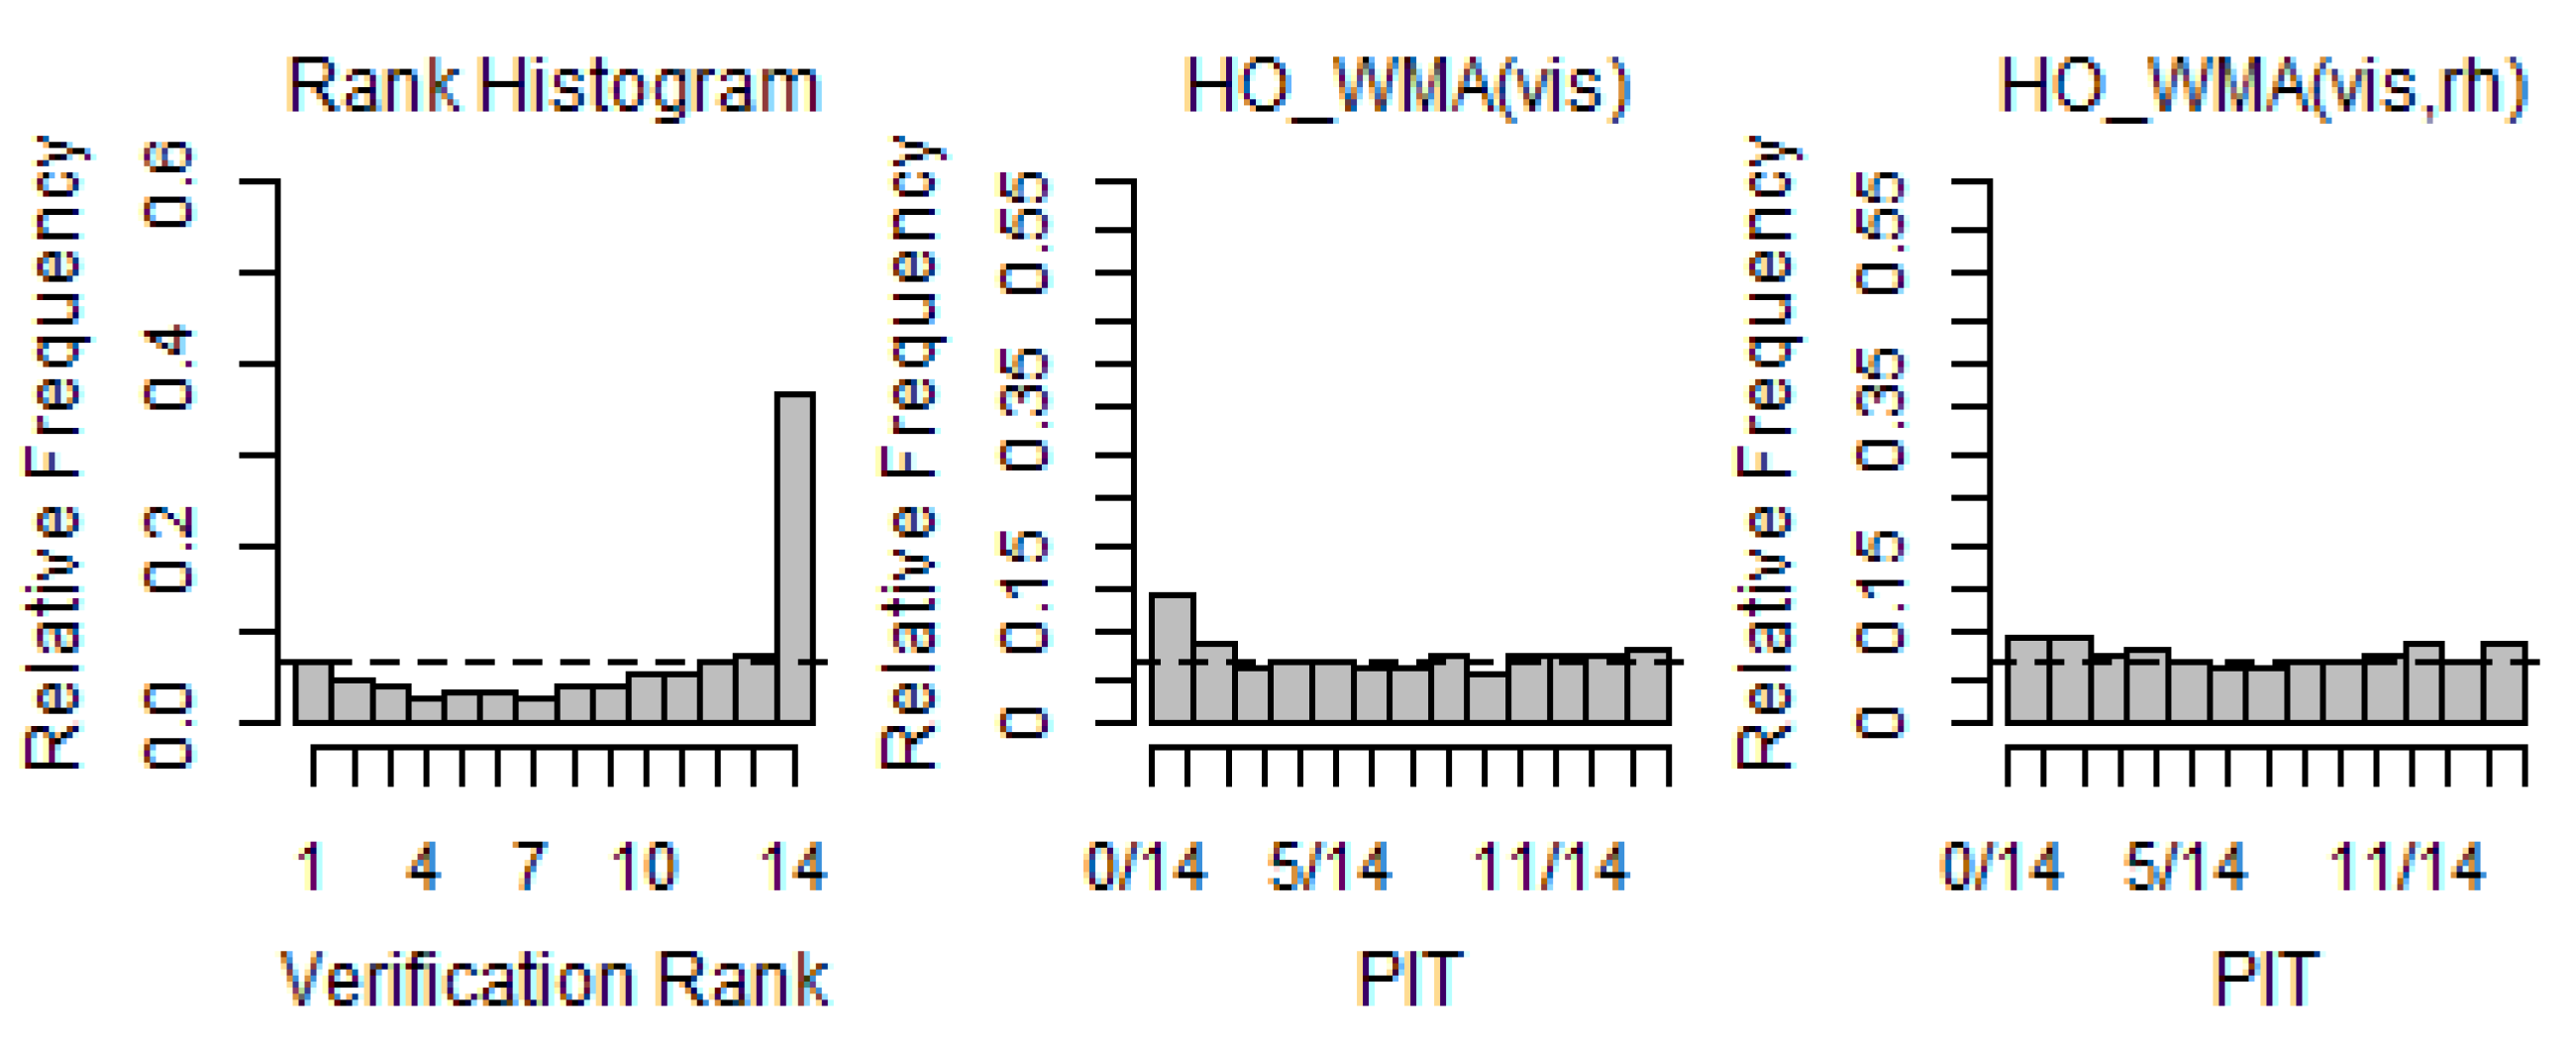
The PIT histograms for the test period were analyzed to evaluate the performance of the complete predictive PDFs of the WMA models. Through the PIT histograms, we could analyze the improvement of the probabilistic forecasts generated with the WMA models compared with the raw ensembles. The RHs of raw ensembles and PIT histograms over the test period for each station in winter are presented in Figure 4, Figure 5 and Figure 6.
First, the RH for Station 110 (Gimpo Airport) showed that raw ensembles had a strong negative bias and weak under-dispersion. The PIT histograms of the WMA forecasts had nearly uniform distributions, indicating that the WMA models were well calibrated and showed substantial improvement over the raw ensembles. In particular, in comparison to the WMA models, it could be seen that the WMA (vis, rh) model was more calibrated than WMA(vis). In the case of Station 113 (Incheon Airport), the RH showed an under-dispersive and weak positive bias. However, the PITs of the WMA forecasts indicated that these biases and dispersions were considerably reduced using the WMA predictive model. In addition, the more uniform patterns of the PIT of WMA (vis, rh) indicated that WMA (vis, rh) was calibrated fairly well. Jeju Airport (182) showed a slightly different pattern from the other two stations. The RH had a slightly higher frequency on the low extreme, but it showed an almost uniform pattern overall. Although there was not much change in the overall pattern of the PIT, we could see that the extreme frequency was decreased using the WMA models. This indicated that the ensemble was less calibrated.
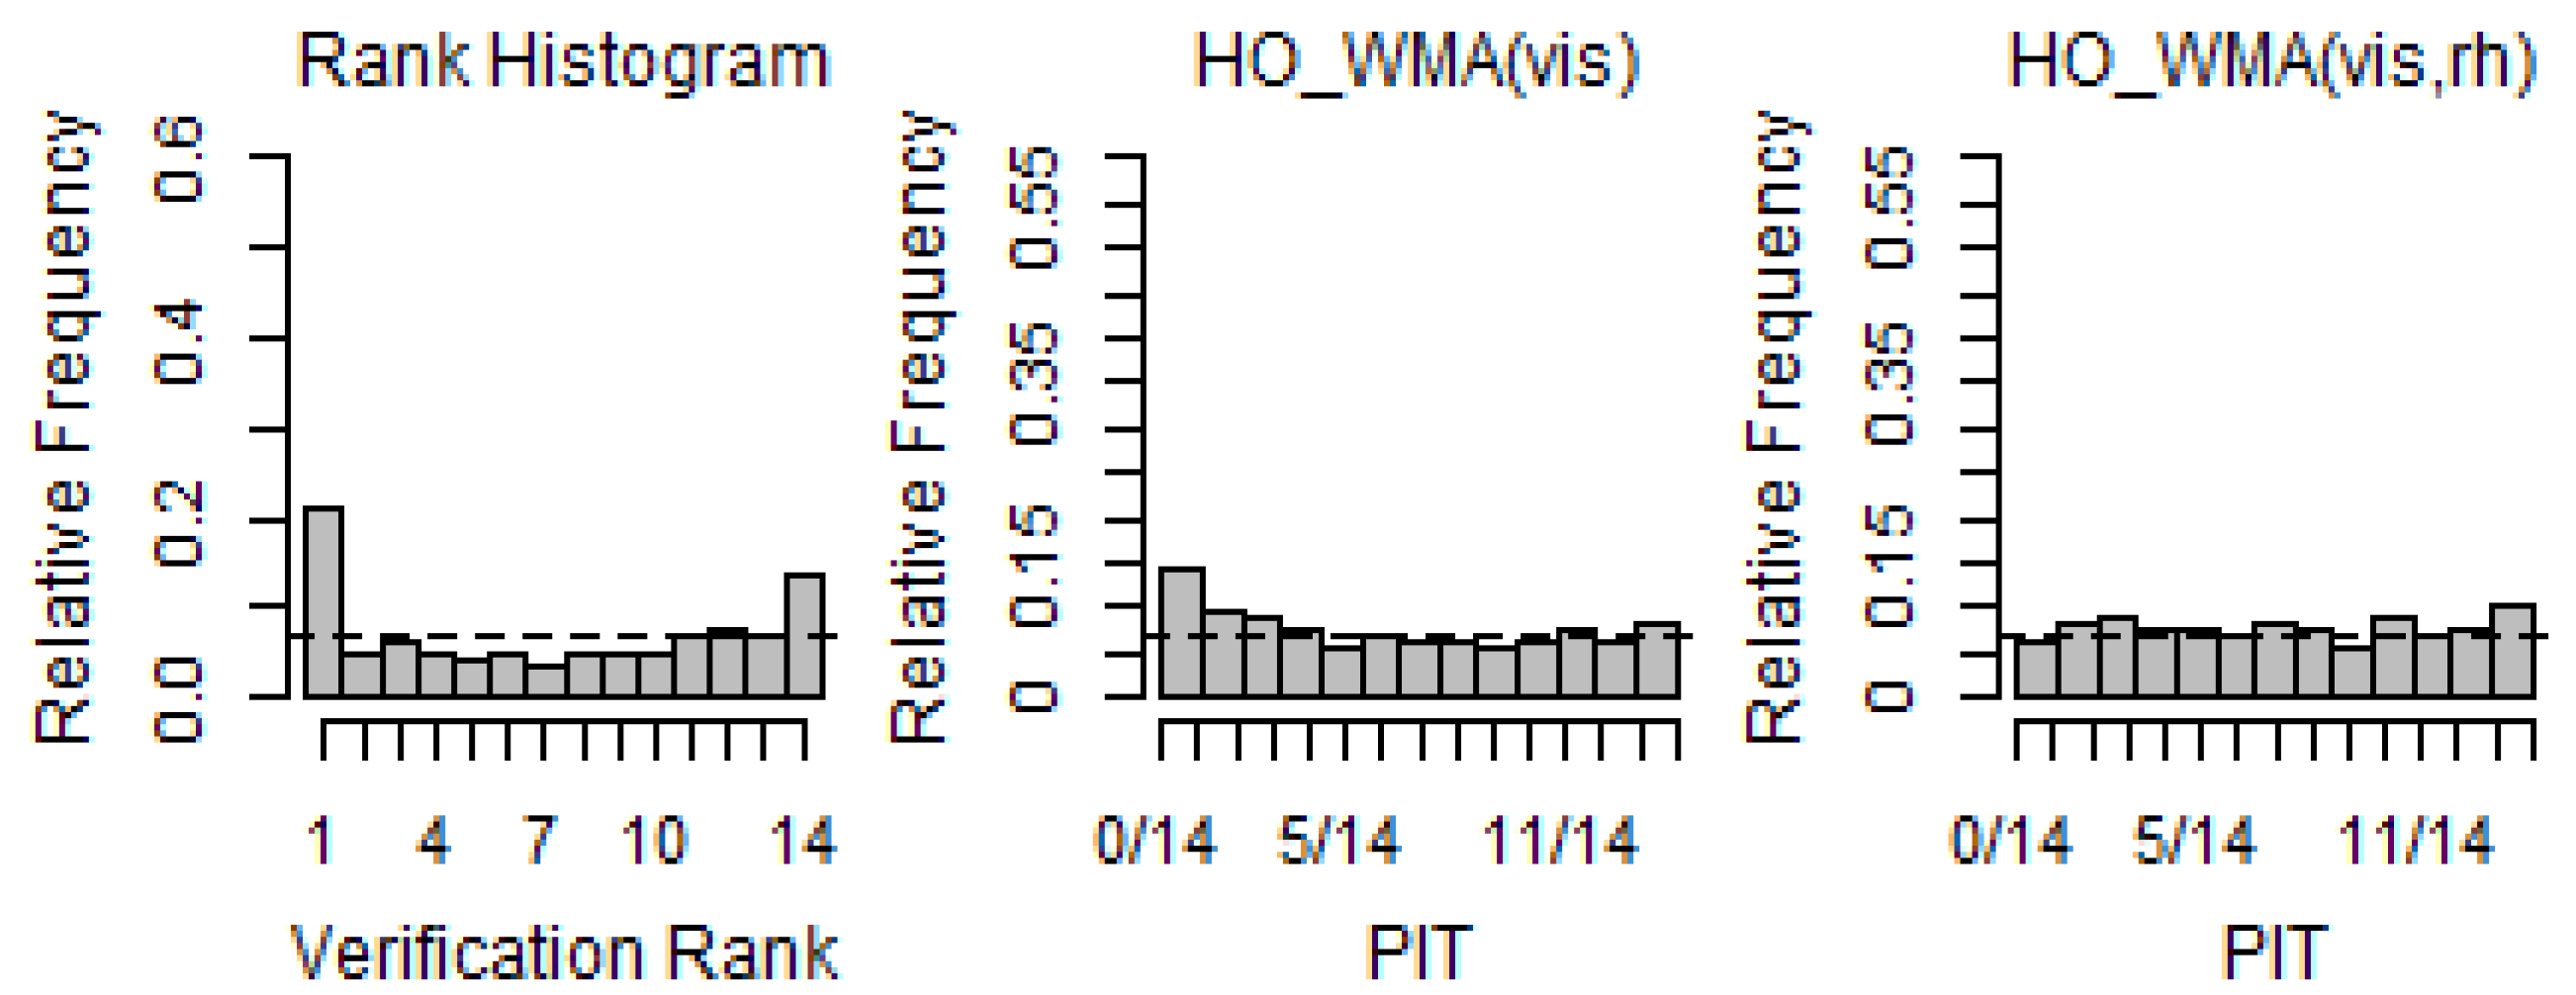
Figure 7, Figure 8 and Figure 9 show the PIT histograms of the WMA forecasts over the test period of spring. As reported in Figure 7, the RH for Station 110 showed a strong negative bias, whereas the PITs of the WMA forecasts showed nearly uniform distributions, implying that WMA was well calibrated over the range of the predictive PDFs. As mentioned above, it could be seen that the WMA(vis, rh) model was better calibrated than WMA(vis). Station 113 had patterns that were almost similar to the spring results analyzed. In the case of Station 182, it could be seen that the PITs for spring were much more calibrated than the PITs for winter. This implied that the prediction error improved significantly for spring compared with winter.

5. Conclusions

As visibility is a risk for the operations and management and causes airplane delays and cancellations, it is one of the important variables in aviation weather. Therefore, significant effort has been made to provide more reliable and accurate visibility forecasts based on ensemble numerical prediction systems. In this respect, this study provides a statistical post-processing method for verifying the performance of an ensemble prediction system and for calibrating the biases and dispersions existing in the ensemble prediction system.
The characteristics of the data from ensemble member forecasts generated using LENS and from observations were examined, and the bias and dispersion existing in the ensemble forecasts were analyzed to construct an appropriate statistical model. Based on these results, we suggested a simple WMA method that provides a fully predictive PDF, making it is easier to estimate the parameters of the model using 13 ensemble member forecasts and relative humidity generated using LENS. WMA is almost similar to BMA; however, WMA can estimate weights more easily.
The resulting WMA predictive PDF was well calibrated with respect to the raw ensembles. The WMA model could resolve the problems arising from ensemble forecasts, including both systematic and random errors, and the discrepancy in scale between ensembles and observations. In addition, we considered additional variables to increase the precision of WMA forecasts. In this application, we found that the relative humidity forecast added some amount of information to the visibility forecasts compared with the use of only visibility ensembles. Because we did not compare the WMA and BMA results, we could not predict the superiority of the prediction performances of these two methods; however, it is known that the WMA model has the advantage of being much easier to apply than the BMA model. In a further study, we aim to compare the performances of the two methods using various scoring rules. Finally, the method based on the presented research is expected to be useful for the bias correction of other aviation variables and for probabilistic forecast analyses.

Author Contributions

Methodology, K.H. and C.K.; Data curation, H.-W.C.; Writing–original draft, C.K. All authors have read and agreed to the published version of the manuscript.

Funding

This work was funded by Korea Meteorological Administration Research and Development Program “Development of Production Techniques on User-Customized Weather Information” (KMA2018-00622) and was supported by the research of grant of Kongju National University in 2022.

Institutional Review Board Statement

Not applicable.

Informed Consent Statement

Not applicable.

Data Availability Statement

Not applicable.

Conflicts of Interest

The authors declare no conflict of interest.

References

  1. Vislocky, R.L.; Fritsch, J.M. An automated, observations-based system for short-term prediction of ceiling and visibility. Weather Forecast. 1997, 12, 116–122. [Google Scholar] [CrossRef]
  2. Leyton, S.M.; Fritsch, J.M. Short-term probabilistic forecasts of ceiling and visibility utilizing high-density surface weather observations. Weather Forecast. 2003, 18, 891–902. [Google Scholar] [CrossRef]
  3. Leyton, S.M.; Fritsch, J.M. The impact of high-frequency surface weather observations on short-term probabilistic forecasts of ceiling and visibility. J. Appl. Meteorol. 2004, 43, 145–156. [Google Scholar] [CrossRef]
  4. Pasini, A.; Pelino, V.; Potesta, S. A neural network model for visibility nowcasting from surface observations: Results and sensitivity to physical input variables. J. Geophys. Res. 2001, 106, 14951–14959. [Google Scholar] [CrossRef]
  5. Bremnes, J.B.; Michaelides, S.C. Probabilistic visibility forecasting using neural networks. Pure Appl. Geophys. 2007, 164, 1365–1382. [Google Scholar] [CrossRef]
  6. Marzban, C.; Leyton, S.M.; Colman, B. Ceiling and visibility forecasts via neural networks. Weather Forecast. 2007, 22, 466–479. [Google Scholar] [CrossRef] [Green Version]
  7. Zhou, B.; Du, J.; McQueen, J.; Dimego, G. Ensemble forecast of ceiling, visibility, and fog with NCEP Short-Range Ensemble Forecast system (SREF). In Proceedings of the Aviation, Range and Aerospace Meteorology Special Symposium on Weather-Air Traffic Management Integration, Phoenix, AZ, USA, 11–15 January 2009. [Google Scholar]
  8. Roquelaure, S.; Bergot, T. A local ensemble prediction system for fog and low clouds: Construction, Bayesian model averaging calibration, and validation. J. Appl. Meteorol. Climatol. 2008, 47, 3072–3088. [Google Scholar] [CrossRef]
  9. Roquelaure, S.; Bergot, T. Contributions from a Local Ensemble Prediction System (LEPS) for improving low cloud forecasts at airports. Weather Forecast. 2009, 24, 39–52. [Google Scholar] [CrossRef] [Green Version]
  10. Roquelaure, S.; Tardif, R.; Remy, S.; Bergot, T. Skill of a ceiling and visibility Local Ensemble Prediction System (LEPS) according to fog-type prediction at Paris-Charles de Gaulle Airport. Weather Forecast. 2009, 24, 1511–1523. [Google Scholar] [CrossRef] [Green Version]
  11. Chmielecki, R.M.; Raftery, A.E. Probabilistic visibility forecasting using Bayesian model averaging. Mon. Weather Rev. 2011, 139, 1626–1636. [Google Scholar] [CrossRef]
  12. Raftery, A.E.; Gneiting, T.; Balabdaoui, F.; Polakowski, M. Using Bayesian model averaging to calibrate forecast ensembles. Mon. Weather Rev. 2005, 133, 1155–1174. [Google Scholar] [CrossRef] [Green Version]
  13. Sloughter, J.M.; Raftery, A.E.; Gneiting, T.; Fraley, C. Probabilistic quantitative precipitation forecasting using Bayesian model averaging. Mon. Weather Rev. 2007, 135, 3209–3220. [Google Scholar] [CrossRef]
  14. Han, K.; Choi, J.; Kim, C. Comparison of prediction performance using statistical postprocessing methods. Asia-Pac. J. Atmos. Sci. 2016, 52, 495–507. [Google Scholar] [CrossRef]
  15. Sloughter, J.M.; Gneiting, T.; Raftery, A.E. Probabilistic wind speed forecasting using ensembles and Bayesian model averaging. J. Am. Stat. Assoc. 2010, 105, 25–35. [Google Scholar] [CrossRef] [Green Version]
  16. Thorarinsdottir, T.L.; Gneiting, T. Probabilistic forecasts of wind speed: Ensemble model output statistics by using heteroscedastic censored regression. J. R. Stat. Soc. 2010, 173, 371–388. [Google Scholar] [CrossRef]
  17. Bao, I.; Gneiting, T.; Grimit, E.P.; Guttorp, P.; Raftery, A.E. Bias correction and Bayesian model averaging for ensemble forecasts of surface wind direction. Mon. Weather Rev. 2010, 138, 1811–1821. [Google Scholar] [CrossRef]
  18. Gneiting, T.; Raftery, A.E.; Westveld, A.H.; Goldman, T. Calibrated probabilistic forecasting using ensemble model output statistics and minimum CRPS estimation. Mon. Weather Rev. 2005, 133, 1098–1118. [Google Scholar] [CrossRef]
  19. Glahan, H.R.; Lowry, D.A. The use of Model Output Statistics (MOS) in objective weather forecasting. J. Appl. Meteorol. 1972, 11, 1203–1211. [Google Scholar] [CrossRef]
  20. Han, K.; Choi, J.; Kim, C. Comparison of statistical post-processing methods for probabilistic wind speed forecasting. Asia-Pac. J. Atmos. Sci. 2018, 54, 91–101. [Google Scholar] [CrossRef]
  21. Murphy, A.H.; Winkler, R.L. A general framework for forecast verification. Mon. Weather Rev. 1987, 115, 1330–1338. [Google Scholar] [CrossRef]
  22. Gneiting, T.; Reftery, A.E. Strictly proper scoring rules, prediction, and estimation. J. Am. Stat. Assoc. 2007, 102, 359–378. [Google Scholar] [CrossRef]
  23. Wilson, D.R.; Ballard, S.P. A microphysically based precipitation scheme for the UK meteorological office unified model. Quart. J. R. Meteorol. Soc. 1999, 125, 1607–1636. [Google Scholar] [CrossRef]
  24. Clark, P.A.; Harcourt, S.A.; Macpherson, B.; Mathison, C.T.; Cusack, S.; Naylor, M. Prediction of visibility and aerosol within the operational Met Office Unified Model. I: Model formulation and variational assimilation. Quart. J. R. Meteorol. Soc. 2008, 134, 1801–1816. [Google Scholar] [CrossRef] [Green Version]
  25. Kim, M.; Lee, K.; Lee, Y.H. Visibility Data Assimilation and Prediction Using an Observation Network in South Korea. Pure Appl. Geophys. 2020, 177, 1125–1141. [Google Scholar] [CrossRef]
  26. Brier, G.W. Verification of forecasts expressed in terms of probability. Mon. Weather Rev. 1950, 78, 1–3. [Google Scholar] [CrossRef]
  27. Murphy, A.H. A new vector partition of the probability score. J. Appl. Meteorol. 1973, 12, 595–600. [Google Scholar] [CrossRef]
  28. Grimit, E.P.; Gneiting, T.; Berrocal, V.I.; Johnson, N.A. The continuous ranked probability score for circular variables and tis application to mesoscale forecast ensemble verification. Quart. J. R. Meteorol. Soc. 2006, 132, 3209–3220. [Google Scholar] [CrossRef] [Green Version]
  29. Hamil, T.M. Interpretation of rank histogram for verifying ensemble forecasts. Mon. Weather Rev. 2001, 129, 550–560. [Google Scholar] [CrossRef]
  30. Wilks, D.S. Statistical Methods in the Atmospheric Sciences, 3rd ed.; Elsevier Academic Press: Amsterdam, The Netherlands, 2011; p. 113. [Google Scholar]
  31. Delle Monache, I.; Hacker, J.P.; Zhou, Z.; Deng, X.; Stull, R.B. Probabilistic aspects of meteorological and ozone regional ensemble forecasts. J. Geophy. Res. 2006, 111, D23407. [Google Scholar] [CrossRef]
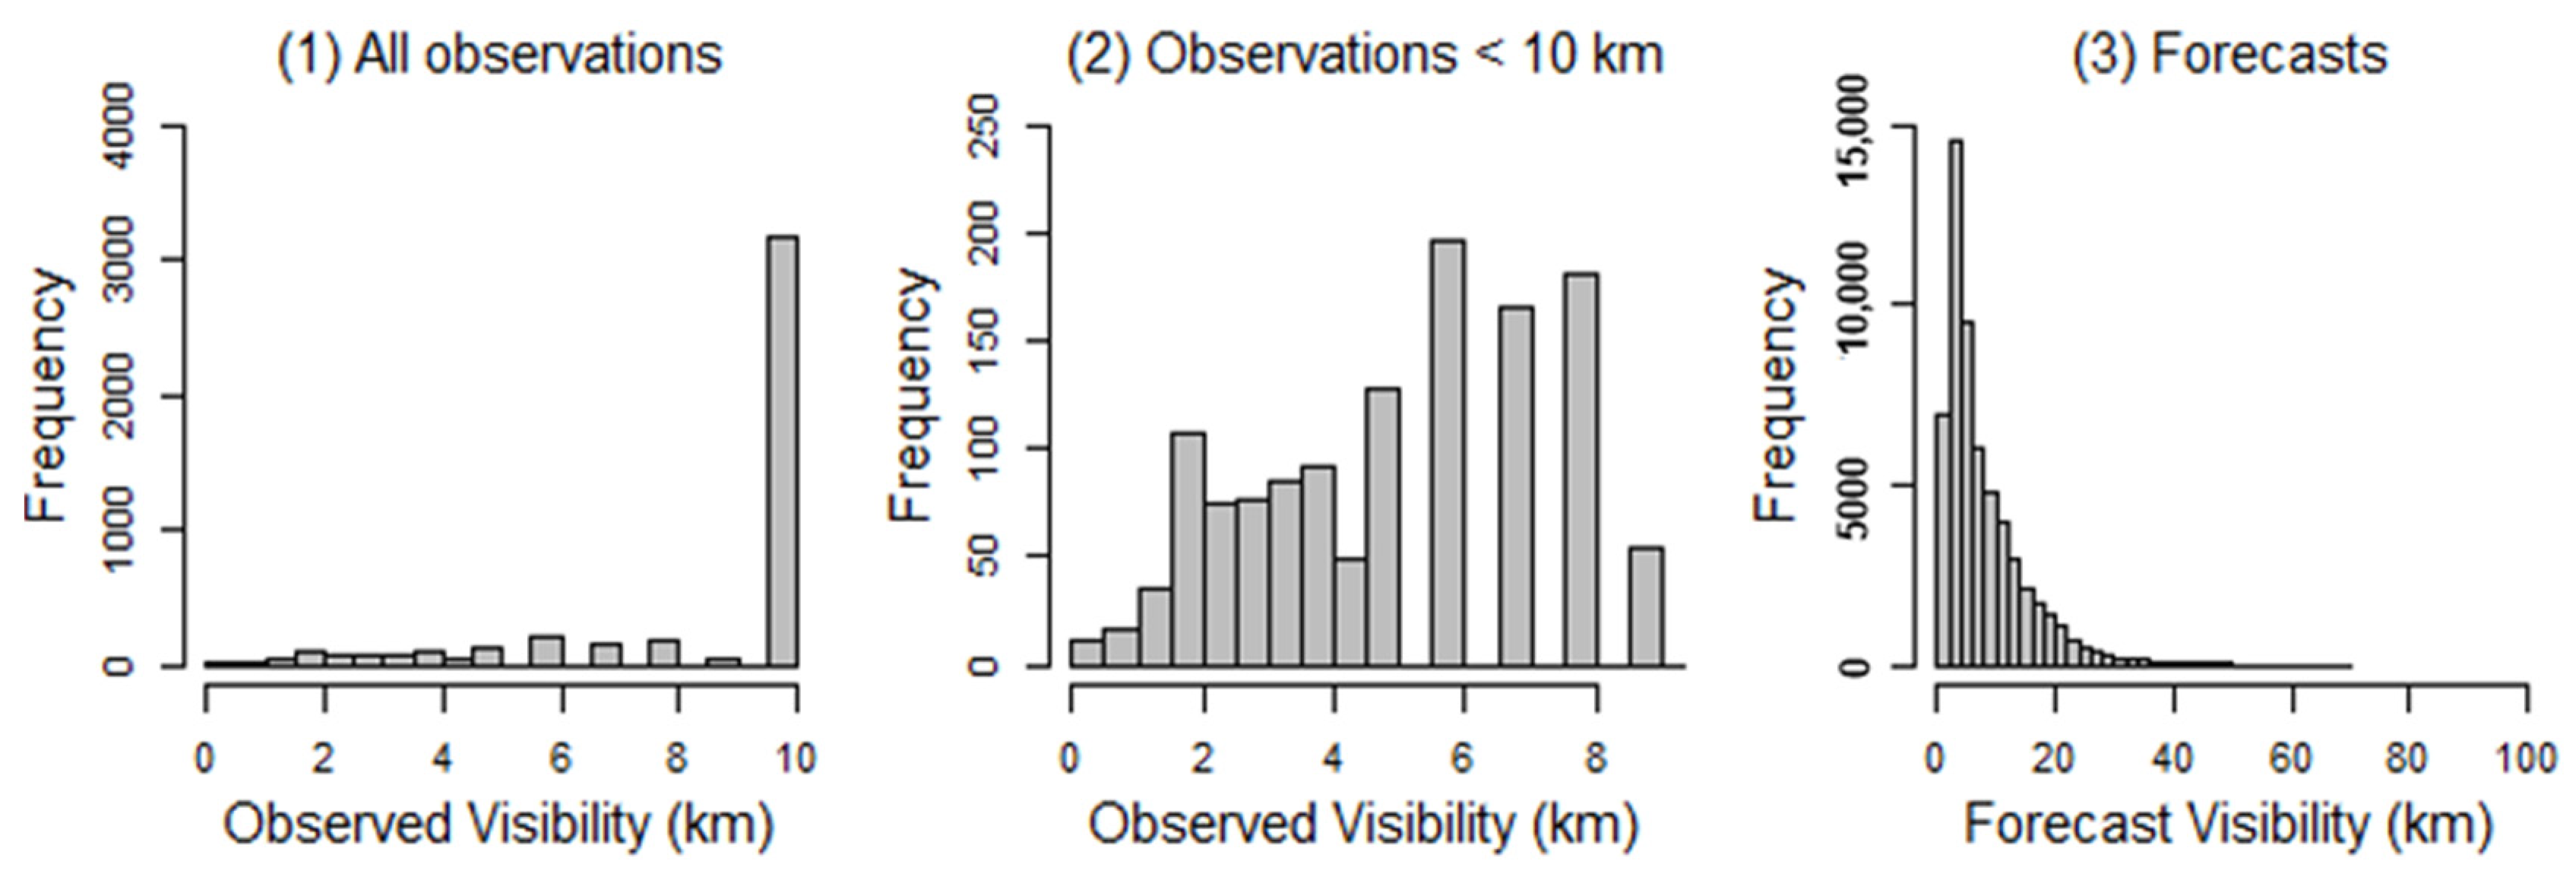
Figure 1. Histograms of visibility observations and forecasts for Station 110: (1) all observations, (2) observations < 10 km, and (3) ensemble forecasts.
Atmosphere 13 01969 g001
Figure 2. Verification rank histograms for (1) Station 110, (2) Station 113, and (3) Station 182.
Atmosphere 13 01969 g002
Figure 3. An example of WMA predictive probability density function (PDF) for Station 110. The vertical line at 10 km represents the WMA probability of visibility of 10 km. The vertical line (red) is the verifying observation; the blue vertical line is the WMA forecast; and the green vertical line is the 10th percentile of the WMA predictive PDF. The thick curve is the WMA predictive PDF of visibility given that it is less than 10 km, and the thin curves represent the individual ensemble contributions toward WMA. Dots represent the ensemble member forecasts.
Atmosphere 13 01969 g003
Figure 4. Verification rank histogram of raw ensemble forecasts and PIT histograms of WMA models for Station 110 (2018–2019 DJF).
Atmosphere 13 01969 g004
Figure 5. Verification rank histogram of raw ensemble forecasts and PIT histograms of WMA models for Station 113 (2018–2019 DJF).
Atmosphere 13 01969 g005
Figure 6. Verification rank histogram of raw ensemble forecasts and PIT histograms of WMA models for Station 182 (2018–2019 DJF).
Atmosphere 13 01969 g006
Figure 7. Verification rank histogram of raw ensemble forecasts and PIT histograms of WMA models for Station 110 (2019 MAM).
Atmosphere 13 01969 g007
Figure 8. Verification rank histogram of raw ensemble forecasts and PIT histograms of WMA models for Station 113 (2019 MAM).
Atmosphere 13 01969 g008
Figure 9. Verification rank histogram of raw ensemble forecasts and PIT histograms of WMA models for Station 182 (2019 MAM).
Atmosphere 13 01969 g009
Table 1. Ensemble prediction system and stations used in the study.
Ensemble Prediction SystemLimited-Area ENsemble Prediction System (LENS) with 13 Ensemble Members
Data Period1 December 2018–30 June 2019
UTC00 UTC
Projection time4 h to 24 h
StationStationLatitudeLongitude
Gimpo Int. Airport (110)37.5126.4
Incheon Int. Airport (113)37.4126.7
Jeju Int. Airport (182)33.5126.5
PredictantVisibility (km)
PredictorsVisibility, relative humidity, and precipitation forecasts generated using LENS
Table 2. Training period and test period for each station.
Year20182019
Mon12123456
Dataset2018–2019 DJFTrainingTest
2019 MAM TrainingTest
Table 3. Reliability index for each station.
Station110113182
Reliability index0.8370.3750.261
Table 4. Comparison of prediction skills of ensemble forecasts in terms of MAE, CRPS, and Brier score (BS) for all data.
StationMAECRPSBS
110 (Gimpo)3.2482.6510.422
113 (Incheon)2.1351.6550.281
182 (Jeju)1.0040.8850.213
Table 5. WMA outputs. The member forecast, WMA median, WMA lower bound, and observation are in units of km.
Station 110 on 5 February 2019 (FT 18)
WMAmvi0mvi1mvi2mvi3mvi4mvi5mvi6mvi7mvi8mvi9mvi10mvi11mvi12
Member forecast 1.4771.2751.0862.671.2441.8641.7932.5990.922.2261.0122.0942.227
WMA weight 00.1310.4160000.09300.05200.02700.28
Member P(y = 10) 0.3330.3330.2170.4350.3950.4240.4110.4270.3130.5190.2850.4940.414
WMA P(y = 10)0.312
WMA median6.055
WMA lower
bound
2.387
Observation7
Table 6. Comparison of prediction skills of WMA and ensemble forecasts according to season.
(a) 2018–2019 December, January, and February (DJF)
MAECRPSBS (y = 10)
StationEnsembleWMAEnsembleWMAEnsembleWMA
1102.8421.6103.9142.8060.3550.211
1132.2631.8543.5023.2720.3020.255
1820.9670.9420.9010.7760.2230.196
(b) 2019 March, April, and May (MAM)
MAECRPSBS (y = 10)
StationEnsembleWMAEnsembleWMAEnsembleWMA
110 3.8430.8473.2480.6770.4890.156
1132.0481.2721.6070.9090.2740.181
1820.7440.5920.6430.5480.1650.138
Table 7. Comparison of model performance in terms of MAE, CRPS, and BS.
2018–2019 DJF2019 MAM
Station110113182110113182
MAEEnsemble2.8422.2630.9673.8432.0490.744
WMA(vis)1.6101.8540.9420.8471.2720.592
(vis, rh)1.2671.3000.9360.7151.2130.593
CRPSEnsemble2.3421.8820.9013.2481.6070.643
WMA(vis)1.1911.4340.7760.6770.9090.548
(vis, rh)0.8980.9010.7860.5450.8550.459
BSEnsemble0.3550.3020.2230.4900.2740.165
WMA(vis)0.2110.2550.1960.1560.1810.138
(vis, rh)0.1600.1440.1960.1190.1660.114
Publisher’s Note: MDPI stays neutral with regard to jurisdictional claims in published maps and institutional affiliations.