Article

Seasonal Variation of Aerosol Composition and Sources of Water-Soluble Organic Carbon in an Eastern City of China

College of Energy Engineering, Zhejiang University, Zheda Road 38, Hangzhou 310027, China
*
Author to whom correspondence should be addressed.
Atmosphere 2022, 13(12), 1968; https://doi.org/10.3390/atmos13121968
Submission received: 19 October 2022 / Revised: 15 November 2022 / Accepted: 16 November 2022 / Published: 25 November 2022

Abstract

:
The mitigation of aerosol pollution is a great challenge in many cities in China, due to the complex sources and formation mechanism of particulate matter (PM) in different seasons. To understand the particular features of pollution in China and formulate different targeted policies, aerosol samples of PM2.5 were collected from January to October of 2018 in Longyou. The temporal profile of the meteorological parameters and the concentrations of water-soluble inorganic ions (WSIs) and organic matter (OM) were characterized. An Aerodyne High-Resolution Time-of-Flight Aerosol Mass Spectrometer (HR-TOF-AMS) was also applied to further analyze the composition of water-soluble organic carbon (WSOC). The sources of WSOC were resolved by positive matrix factorization (PMF) analysis. The origin of air parcels and potential sources of WSOC were analyzed using a backward trajectory and potential source contribution function (PSCF). Winds from the northeast dominated each sampling period, and the relative humidity did not show a significant difference. The results showed that the proportion of OM in PM2.5 was the highest in summer and decreased in spring, autumn, and winter in turn. Four organic aerosol (OA) factors, including a hydrocarbon-like factor, a coal combustion factor, and two oxygenated OA factors, were identified in the WSOC by means of PMF analysis. The hydrocarbon-like OA (HOA) contributed the majority of the WSOC in summer, while the contribution of the coal-combustion OA (CCOA) increased significantly in winter, suggesting the presence of different sources of WSOC in different seasons. The air parcels from the north of China and Zhejiang province contributed to the CCOA in winter, while those from the marine regions in the south and southeast of China mainly contributed to the HOA during spring and summer. The weighted PSCF (WPSCF) analysis showed that the regions of east Zhejiang province were the main contributors, which means that local and regional emissions were the most probable source areas of WSOC. It implied that not only were the emissions control of both local and regional emissions important but also that the transport of pollutants needed to be sufficiently well accounted for to ensure the successful implementation of air pollution mitigation in Longyou.

1. Introduction

Severe haze pollution events, which were mainly generated by a dramatic increase in PM2.5, have occurred in China in recent years [1,2,3]. The origins of PM2.5 have received extensive research interest, due to their impairment to human health and the economy, even affecting climate change [4,5]. However, there were uncertainties when trying to identify the sources of PM2.5, and the factors governing PM2.5 formation remain poorly understood [6,7]. On the one hand, PM2.5 was not only linked with local emissions but was also affected by regional transport [8,9,10,11]. On the other hand, the formation mechanism of PM2.5 is complex and is influenced by the abundance of precursors, meteorological conditions, atmospheric oxidation, etc. [12,13,14]. The sources and formation mechanism could be reflected by the composition of PM2.5, to a certain extent [15,16]. Thus, it is essential to characterize the composition of PM2.5 to gain a greater understanding of its sources and formation mechanism.
The composition of PM2.5 mainly includes nitrate, sulfate, ammonium, carbonaceous species, trace elements, etc. [17,18]. However, it is a challenge to establish the concentrations of these species with high temporal resolution [19]. Aerosol mass spectrometry provides a solution that can acquire the real-time concentrations of compositions in micro or sub-micro PM [20,21]. The Aerodyne aerosol mass spectrometer (AMS) and aerosol chemical speciation monitor (ACSM) are widely used measurement techniques for field and laboratory studies and have been used to characterize the composition of PM in many cities around the world [22,23].
Water-soluble organic carbon (WSOC) is an important component of atmospheric organic aerosols (OA), which could account for 21–86% of OA [24,25,26] and is likely to determine its impacts on visibility, human health, and climate [27]. Many field studies have analyzed the concentration, relative contribution, and seasonal variation of OC in PM2.5 samples [28,29,30]; however, the chemical composition and sources of WSOC were scarcely investigated, which might result in our ignorance of some sources of OA. Thus, a further understanding of the detailed chemical composition of OA is needed to identify the most significant emission sources [31].
A few studies have focused on the source apportionment, oxidation degree, and formation mechanism of WSOC. For example, the authors of [32] applied an offline AMS technique to analyze the composition of WSOC in the PM2.5 samples collected in urban Yangzhou and five sources were identified using PMF analysis. One previous study [25] found that the mass proportion of aqueous-oxygenated OA increased significantly in terms of WSOA during heavy pollution periods in Beijing, suggesting WSOA formation by means of the aqueous-phase process. Although these studies revealed sources based on the chemical composition of WSOC, the characteristics specific to each source in the different seasons were not known [33], and still need further study.
Longyou is a city located in the Jinqu basin in Zhejiang province, China. Due to rapid economic development and complex emission sources, Longyou has been suffering severe haze pollution issues in recent years. In our previous study, we investigated the effects of meteorological conditions and regional transport on haze pollution during the winter months in this city [34]. However, the sources and formation mechanism of PM2.5 in other seasons were minimally investigated, and the dominant factors leading to the issues of haze pollution were yet to be revealed.
In the present study, the PM2.5 samples collected from filters at three sites in Longyou city during the spring (3–9 May), summer (14–20 July), autumn (17–23 October), and winter (11 January–6 February) of 2018 were analyzed using an offline AMS technique. The variations in atmospheric pollutants and the characteristics of chemical composition in each season were summarized. This would improve our understanding of the local haze pollution level and provide a scientific basis for reasonable control and supervision measures in the future.

2. Methods

2.1. Sample Collection and Analysis

The location of the sampling sites, PM2.5 collection, and the analysis methods used have been described in detail in our previous study [34]. To be brief, the samples of PM2.5 were collected at three sites in Longyou (as shown in Figure S1 in the Supplementary Materials): the Jianshe building (JS), Xiajin (XJ), and Huzhen (HZ) sites. JS is located in the center of Longyou, and is surrounded by main roads, businesses, and residential areas. XJ is a rural site located at the west boundary of Longyou, where several plants were producing chemical gases and steel in the west. HZ is an industrial town located on the east boundary of Longyou. PM2.5 samples were collected simultaneously from three sites, using samplers (Thermo Scientific, Partisol 2025i, Franklin, MA, USA) with a flow rate of 16.7 L/min, from 11:00 of one day to 10:00 the next morning. The aerosol was collected on a quartz fiber filter (Pallex, Franklin, MA, USA) with a diameter of 47 mm and was stored at −4 °C before chemical analysis. The water-soluble inorganic ions were measured via ion chromatography (IC, Dionex, ICS-5000, Franklin, MA, USA), and the concentration of carbonaceous species was measured using a carbon analyzer (DRI2001A, Atmoslytic Inc., Calabasas, CA, USA). The concentration of organic matter (OM) was estimated to be 1.6 times that of OC [35]. The analysis procedures were similar to those reported in previous studies (Chen et al., 2017).
It should be mentioned that the concentration of WSOC was not provided in this study, due to the lack of a total water-soluble organic carbon (TOC) analyzer. In order to understand the variation of WSOM in each season, the ratios of 50–82% for WSOM to OM in other Yangtze River Delta (YRD) cities, as reported in previous studies, were applied to calculate the concentration of WSOM [32,36]. In addition, the PM2.5 composition and atmospheric pollutants could change as the regional transport path and meteorological conditions change over different days and seasons. From this perspective, the sampling period was not long enough to investigate the characteristics of PM2.5 composition for each season. Despite these issues, we tried to analyze all the data obtained to characterize the composition of PM2.5, so as to have a greater understanding of the sources occurring in different seasons, as reported by a previous study [36], in which limited samples were also collected over different seasons.

2.2. Offline AMS Analysis

A quarter of each filter loaded with PM2.5 samples was extracted in 15 mL ultrapure water (18.2 MΩ cm) in an ultrasonic generator for 30 min at 0 °C. The extracts were then filtered into the container of an atomizer (7388AGS, A&P Instruments, HK) using 0.45 μm nylon membrane filters. Aerosols were generated by atomizing the aqueous extracts and were subsequently dehumidified by passing through a diffusion dryer filled with silica gel. After drying, the aerosols were sent to the inlet of a HR-TOF-AMS and analyzed by the AMS. The temperature of the vaporizer of the AMS was set to 600 °C for non-refractory submicron aerosol component measurement (including organics, nitrate, ammonium, sulfate, and chloride) [20]. The AMS was operated in V mode, with a temporal resolution of 60 s. Each composite sample was analyzed for ten runs to ensure the reproducibility of the analysis. Between each sample, ultrapure water was atomized and measured via AMS to minimize the effects of the previous sample remaining in the sampling lines and used as a system blank. Offline AMS data were processed and analyzed using the AMS analysis software SQUIRREL v 1.57l and PIKA 1.16l. The molar ratios of hydrogen to carbon (H:C) and of oxygen to carbon (O:C) are determined using the improved ambient (I-A) method recommended by the authors of [37]. A total of 111 filter samples were analyzed, of which the data of 90 samples (14, 14, 14, and 48 for spring, summer, autumn, and winter, respectively) were valid for subsequent analysis.
The HR-MS data matrix derived from the PM2.5 samples was analyzed using the PMF evaluation tool (PET, v2.08D) [38,39] to resolve the different OA factors, which might be representative of specific sources. Any ions with an S/N < 0.2 were removed from the analysis, and the ions where the S/N was 0.2–2 were down-weighted by increasing their error calculations by a factor of 2 [40]. The PMF solutions were resolved by the OA factor numbers (1–6), then the solutions were evaluated by comparing the mass spectral profiles of the output OA factors as a function of the rotational parameter (fpeak). A four-factor solution with fpeak = 0 was selected as our best solution, which was consistent with the previously reported standard mass spectra, as shown in Figure S2 of the Supplementary Materials.

2.3. Regional Transport Analysis

The 48-h backward trajectories of air parcels were analyzed using the hybrid single-particle Lagrangian integrated trajectory (HYSPLIT) model. Different arrival heights had been chosen for the previous studies [41,42,43], depending on the purpose of the analysis. Generally, heights of 500 m or greater are regarded as being in the open height of the planetary boundary layer (PBL) and are more useful for long-range transport. An arrival height of 500 m above ground level (AGL) was chosen for target analysis, to diminish the effects of surface friction and to consider the effects of long-range transport [44]. The input to the model was in the form of 0.5° latitude-longitude gridded meteorological parameters of the meteorological dataset from the global data assimilation system (GDAS). The 48-h backward trajectories of the air parcels, the arrival times of which were at 19:00 (local time), were generated for each day of the sampling periods.
PSCF analysis was also performed to reveal the potential source areas through which the air parcels passed. The details of the PSCF model have been precisely described in a previous study [45]. In order to reduce the uncertainty brought about by high PSCF values corresponding to low endpoint values in some grid cells, a weighing function was introduced into the PSCF model to better reflect the uncertainty in the values for these cells [46,47]:
W = 1 ,     n ij     0 . 85   max ( log ( n + 1 ) ) 0 . 7 ,   0 . 6   max ( log ( n + 1 ) )     n ij   <   0 . 85   max ( log ( n + 1 ) ) 0 . 42 ,     0 . 35   max ( log ( n + 1 ) )     n ij   <   0 . 6   max ( log ( n + 1 ) ) 0 . 17 ,   n ij   <   0 . 35   max ( log ( n + 1 ) )
where n ij is the total number of back trajectories passing through each ij-th cell. The arbitrary threshold was set to be the 75th percentile of the WSOC concentration during the sampling periods for the different seasons. The estimated WSOC concentration was the upper bound of OC, as described in Section 3.2.

3. Results

3.1. General Characteristics of the Meteorological Conditions and Pollutant Concentrations

The temporal profile of meteorological parameters and the concentrations of gaseous pollutants, PM2.5, and PM10 during the sampling periods are illustrated in Figure 1. The mean temperatures were 21.9 ± 2.2, 31.5 ± 0.5, 17.2 ± 0.4, and 5.7 ± 4.4 °C during spring, summer, autumn, and winter, respectively. The relative humidity, however, did not show a significant difference and the average values were 82.6 ± 13.6, 69.7 ± 1.5, 89.4 ± 10.5, and 78.7 ± 15.5% in each season. The wind from the northeast dominated each sampling period, and the average speeds were 1.0 ± 0.3, 1.1 ± 0.1, 0.9 ± 0.3, and 0.8 ± 0.2 m/s, respectively (as shown in Figure S3 in the Supplementary Materials).
The average concentration of PM2.5 was the highest in winter (69 ± 25.6 μg/m3), followed by autumn (37.9 ± 8.9 μg/m3) and spring (27.9 ± 10.4 μg/m3), and the lowest value was observed in summer (12.6 ± 5.5 μg/m3). The seasonal variation of SO2 and NO2 were the same with PM2.5, indicating that the atmosphere was more polluted in winter compared with other seasons, whereas the average O3 concentration was the highest during the sampling periods in spring and then in autumn, followed by summer, as summarized in Table S1 in the Supplementary Materials. The factors influencing O3 formation are yet to be revealed in future studies.

3.2. Seasonal Variation of PM2.5 Composition

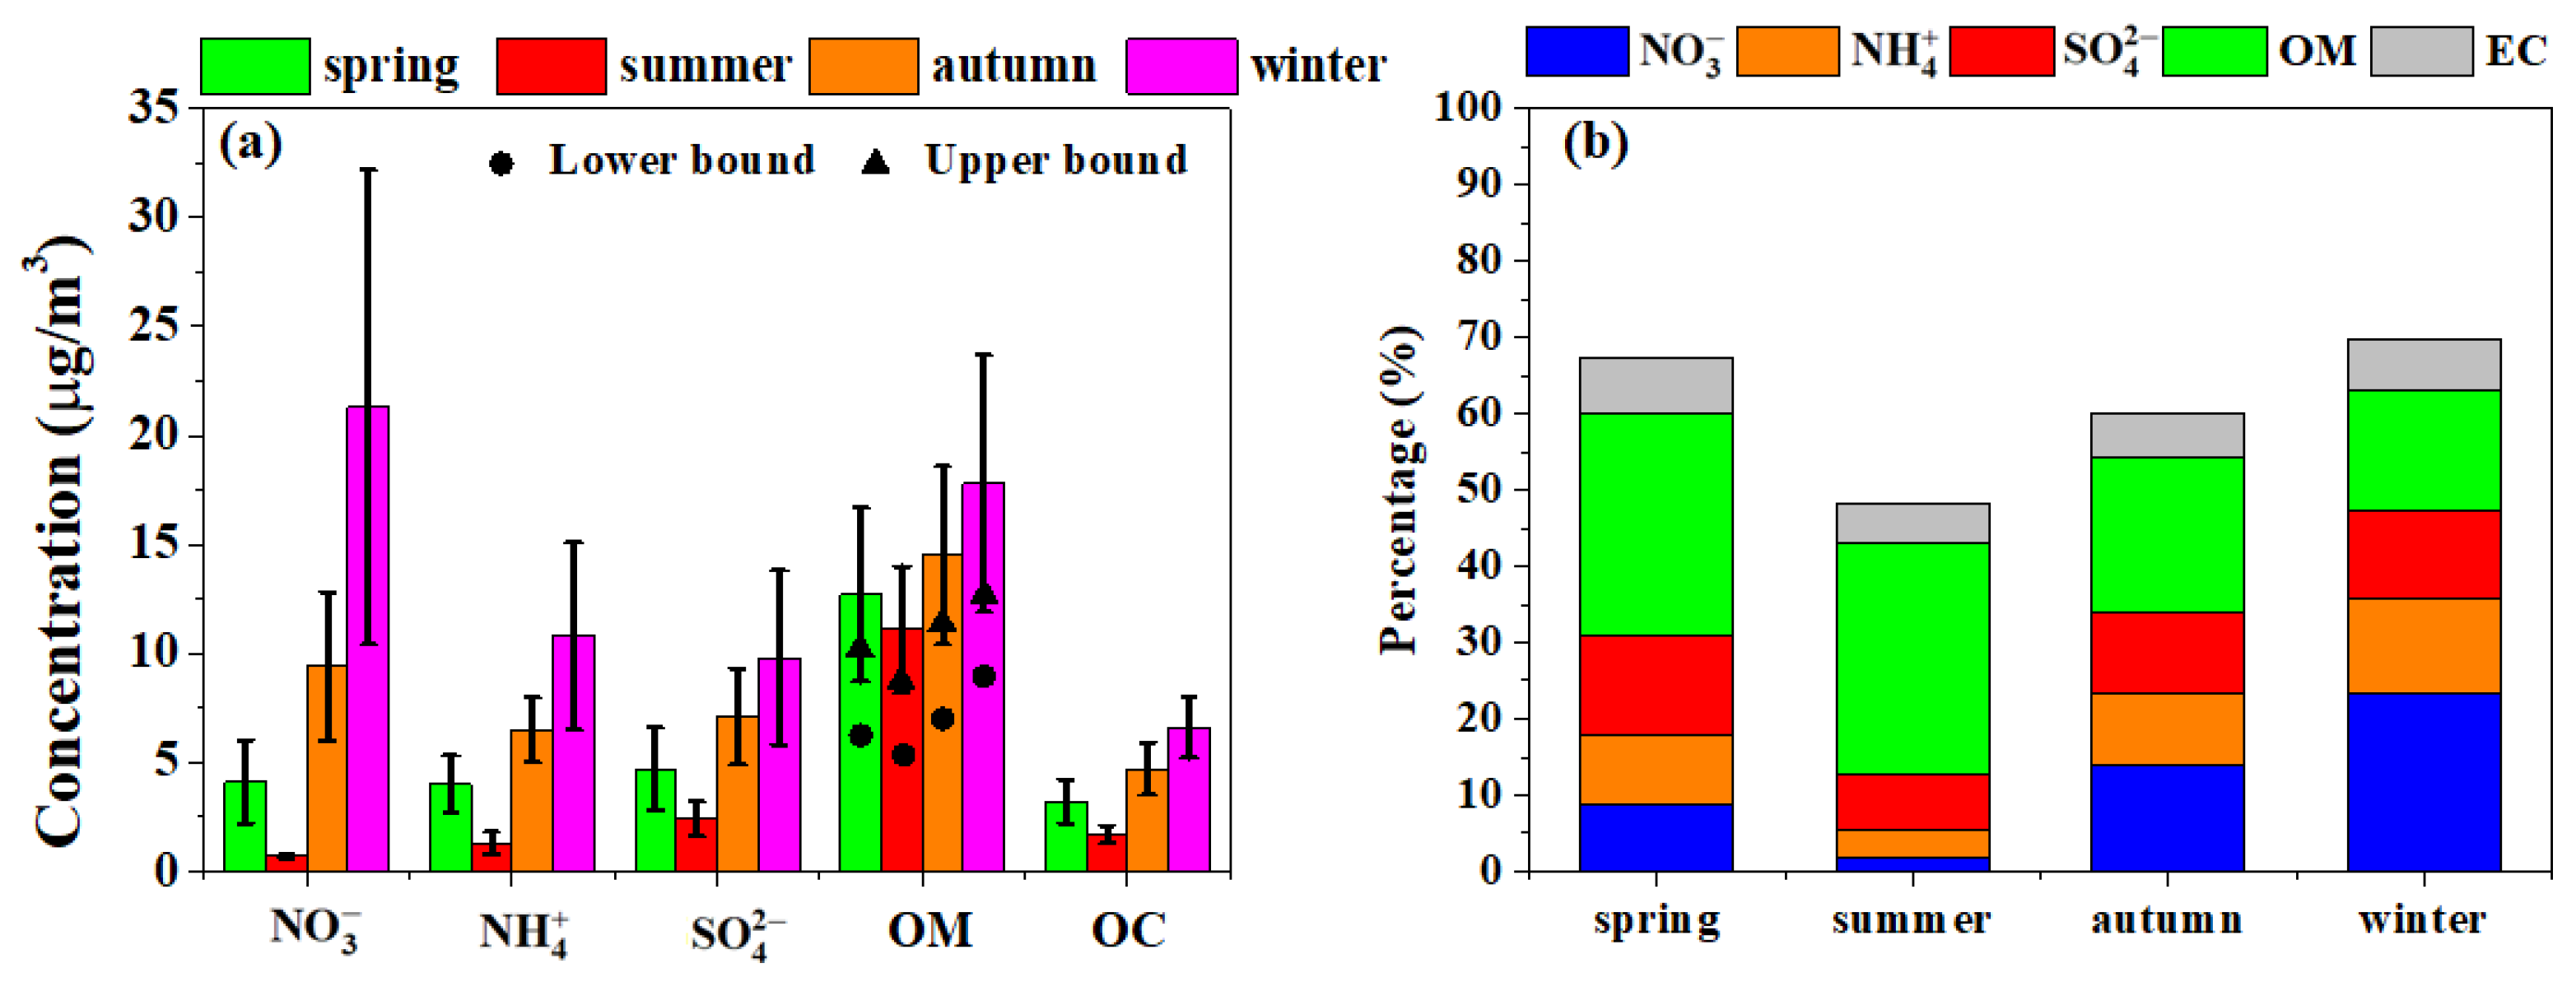
The major composition of PM2.5 was NO 3 , NH 4 + , SO 4 2 , OM, WSOM, and EC in each season, which took up 50–70% of PM2.5. Each component had the highest concentration in winter, followed by autumn, spring, and summer, which is consistent with the seasonal variation of PM2.5, as illustrated in Figure 2a. The relative contribution of each component was different (Figure 2b). The relative contribution of the organic species was almost equal to the inorganic species in spring (~29%) and increased in summer. However, the percentage of organic species in PM2.5 decreased in autumn and winter, which was the same as in previous studies [48,49]. In inorganic species, the contribution of NO 3 , NH 4 + , and SO 4 2 decreased in summer compared to spring and increased in autumn and winter. The proportions of NO 3 and NH 4 + increased most significantly in autumn and winter, indicating that the increase in PM2.5 was likely due to the formation of NO 3 and NH 4 + in these seasons. The higher levels of NO 3 and NH 4 + in winter may be related to the higher stability of NH4NO3 at low temperatures.

3.3. WSOC Composition, Resolved by AMS

The mass spectra of WSOC in the different seasons is illustrated in Figure S4 in the Supplementary Materials. The mass spectra were similar among the different seasons. The most abundant fragments were at m/z = 28, 29, 43, and 44, which were mainly from the fragmentation of carboxylic acids, aldehydes, and ketones [50,51]. However, the fragments of m/z > 100 were more abundant in autumn and winter compared with spring and summer, suggesting that the composition was more complicated in autumn and winter. It was probable that the organic aerosol had fewer primary combustion sources in spring and summer [9], making its composition not as complicated as in autumn and winter, during which period biomass burning and coal combustion could make a significant contribution to organic aerosols, as shown in Figure S5 in the Supplementary Materials. The fragments with m/z > 100 tended to have stronger signals in the biomass-burning OA and coal-combustion OA [25]. In addition, the aqueous phase reaction and heterogeneous reaction could also make the OA composition more complicated in autumn and winter [7,52].
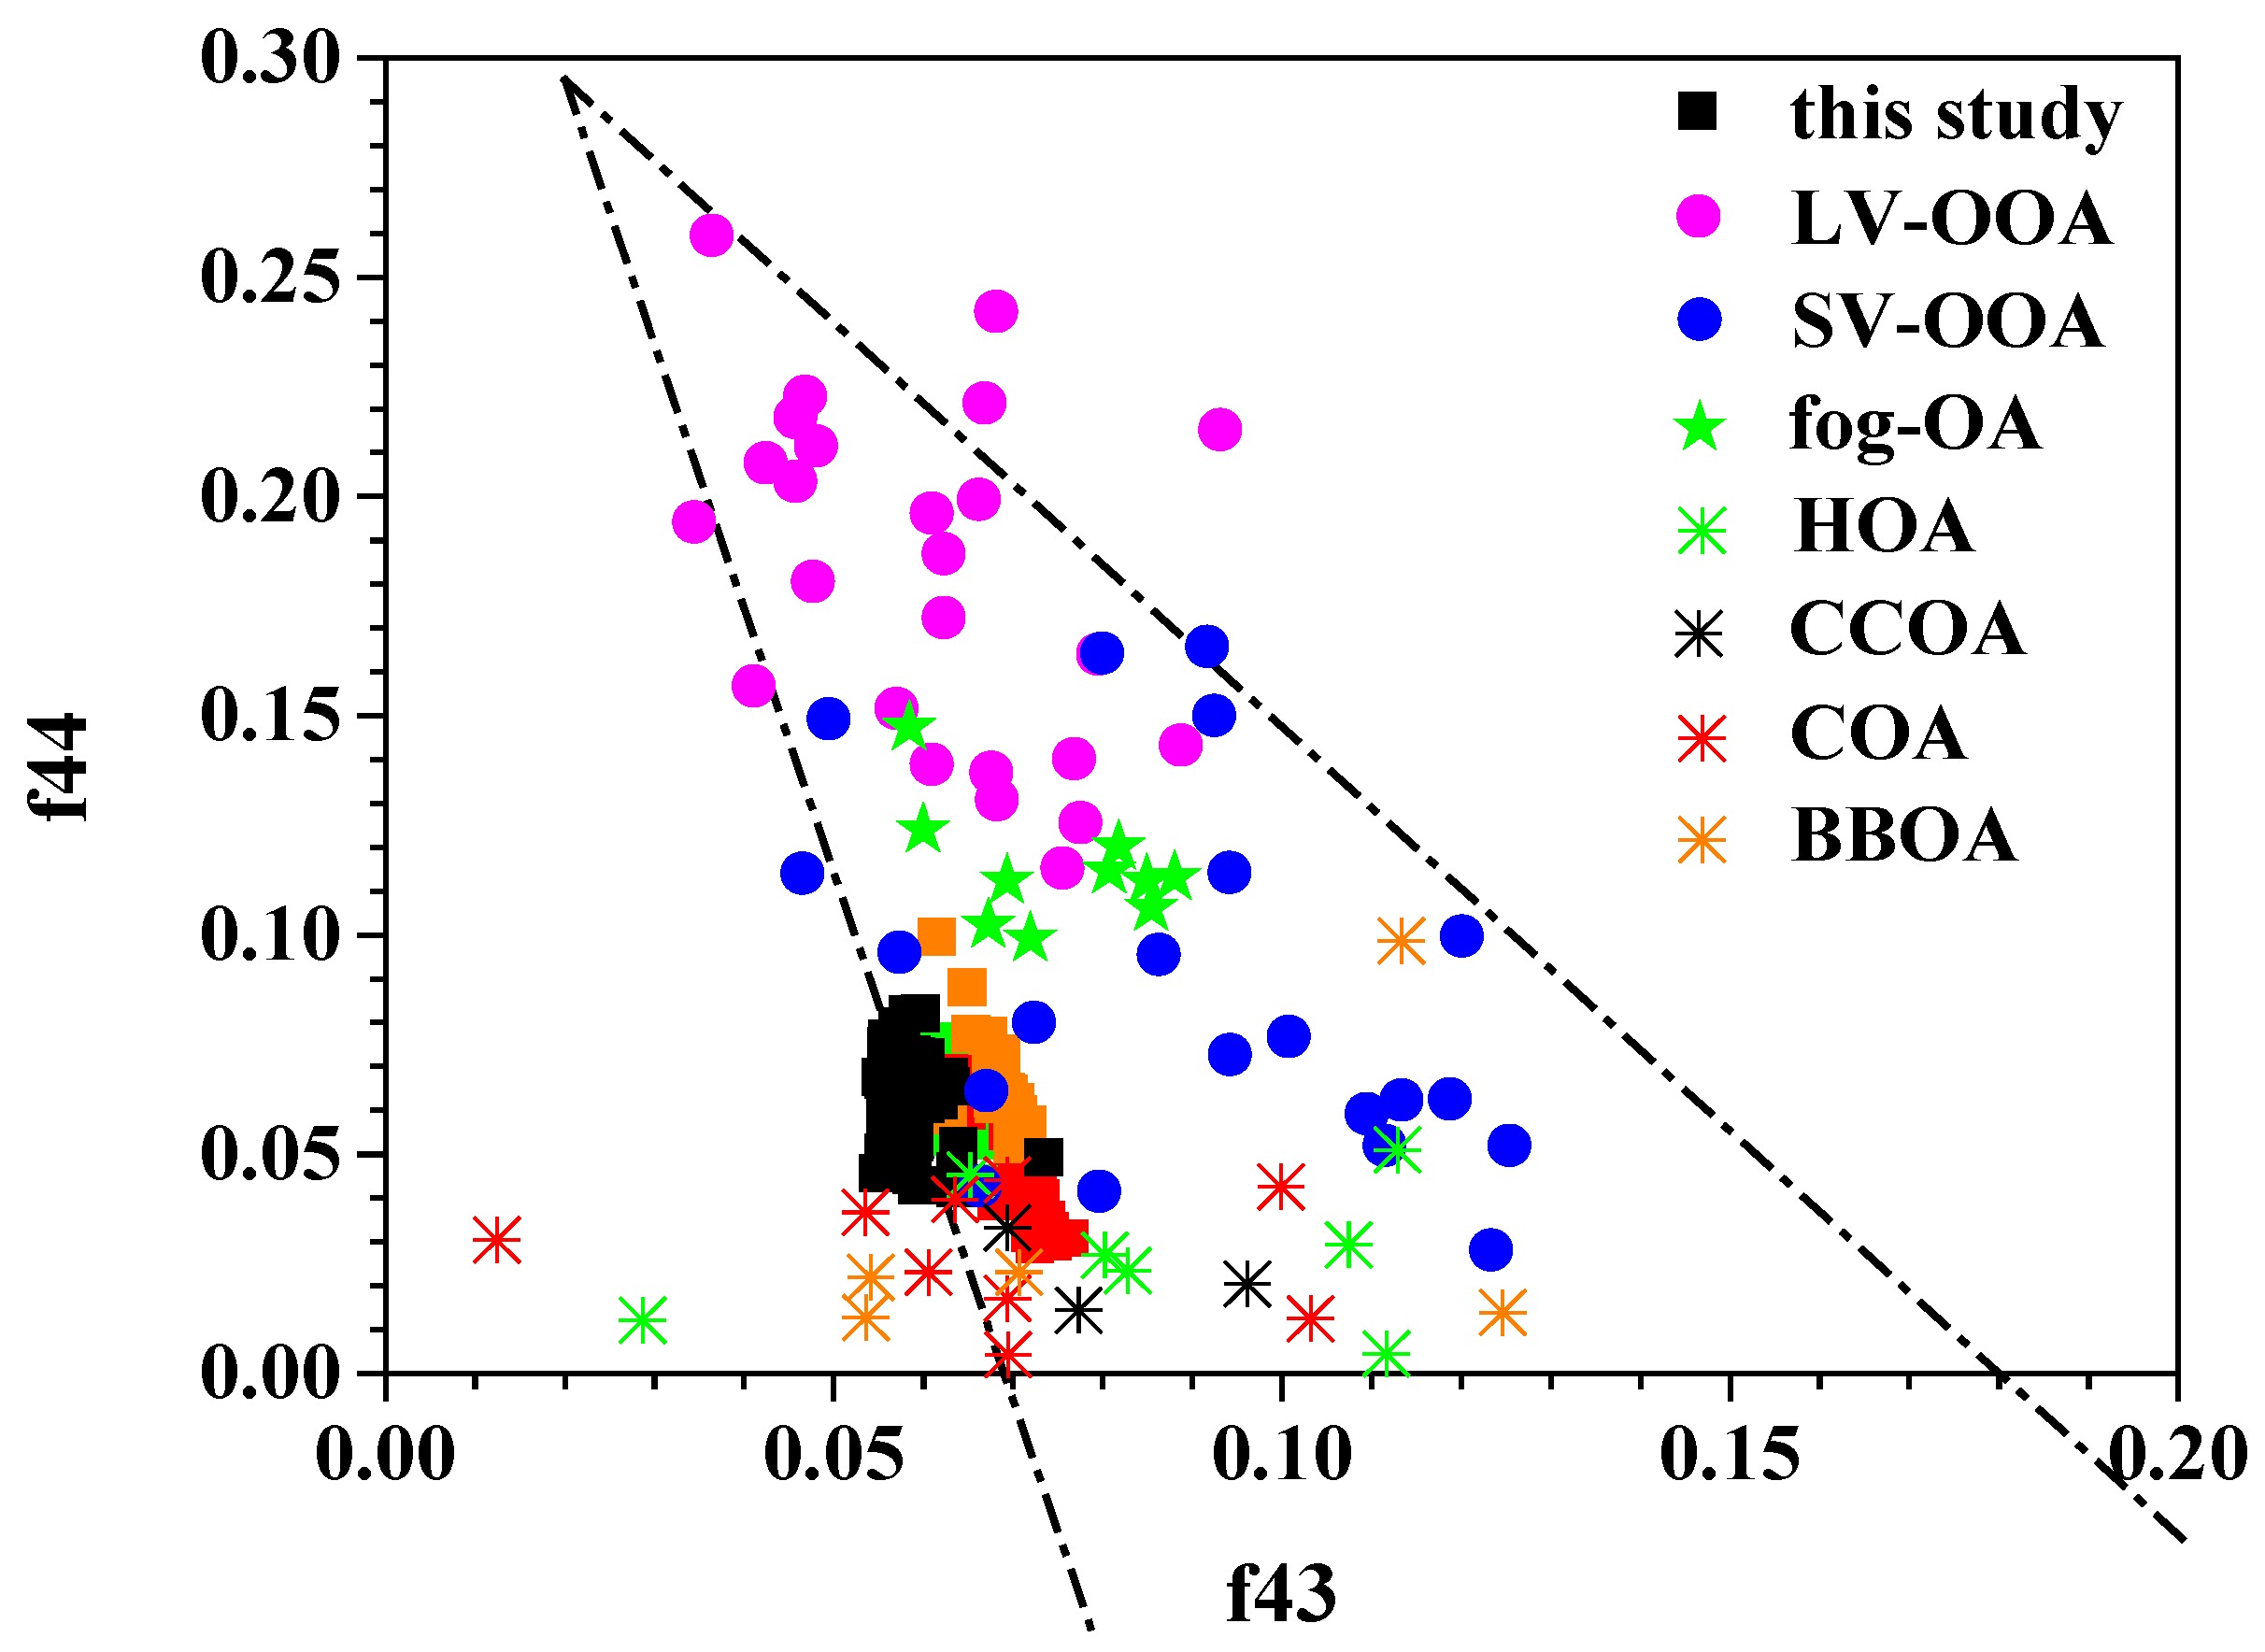
The f44 vs. f43 for the WSOC during each sampling period in different seasons are illustrated in Figure 3. The average f43 values were 0.064 ± 0.002, 0.071 ± 0.002, 0.062 ± 0.003, 0.059 ± 0.003, and the average f44 values were 0.061 ± 0.01, 0.044 ± 0.012, 0.067 ± 0.012, and 0.063 ± 0.011 during spring, summer, autumn, and winter, respectively, showing that the fragments of m/z = 44 in spring, autumn and winter were more abundant than in summer, also indicating that the organic aerosols were more oxygenated [53]. The values of f44 and f43 were all centered near the left guideline of the triangle plot and were within the ranges of HOA (hydrocarbon-like organic aerosol), CCOA (coal-combustion organic aerosol), COA (cooking-related organic aerosol), BBOA (biomass-burning organic aerosol) and SV-OOA (semi-volatile oxygenated organic aerosol) reported in previous studies (as summarized in Tables S2 and S3 in the Supplementary Materials), suggesting the likely contributions of these sources to WSOC.
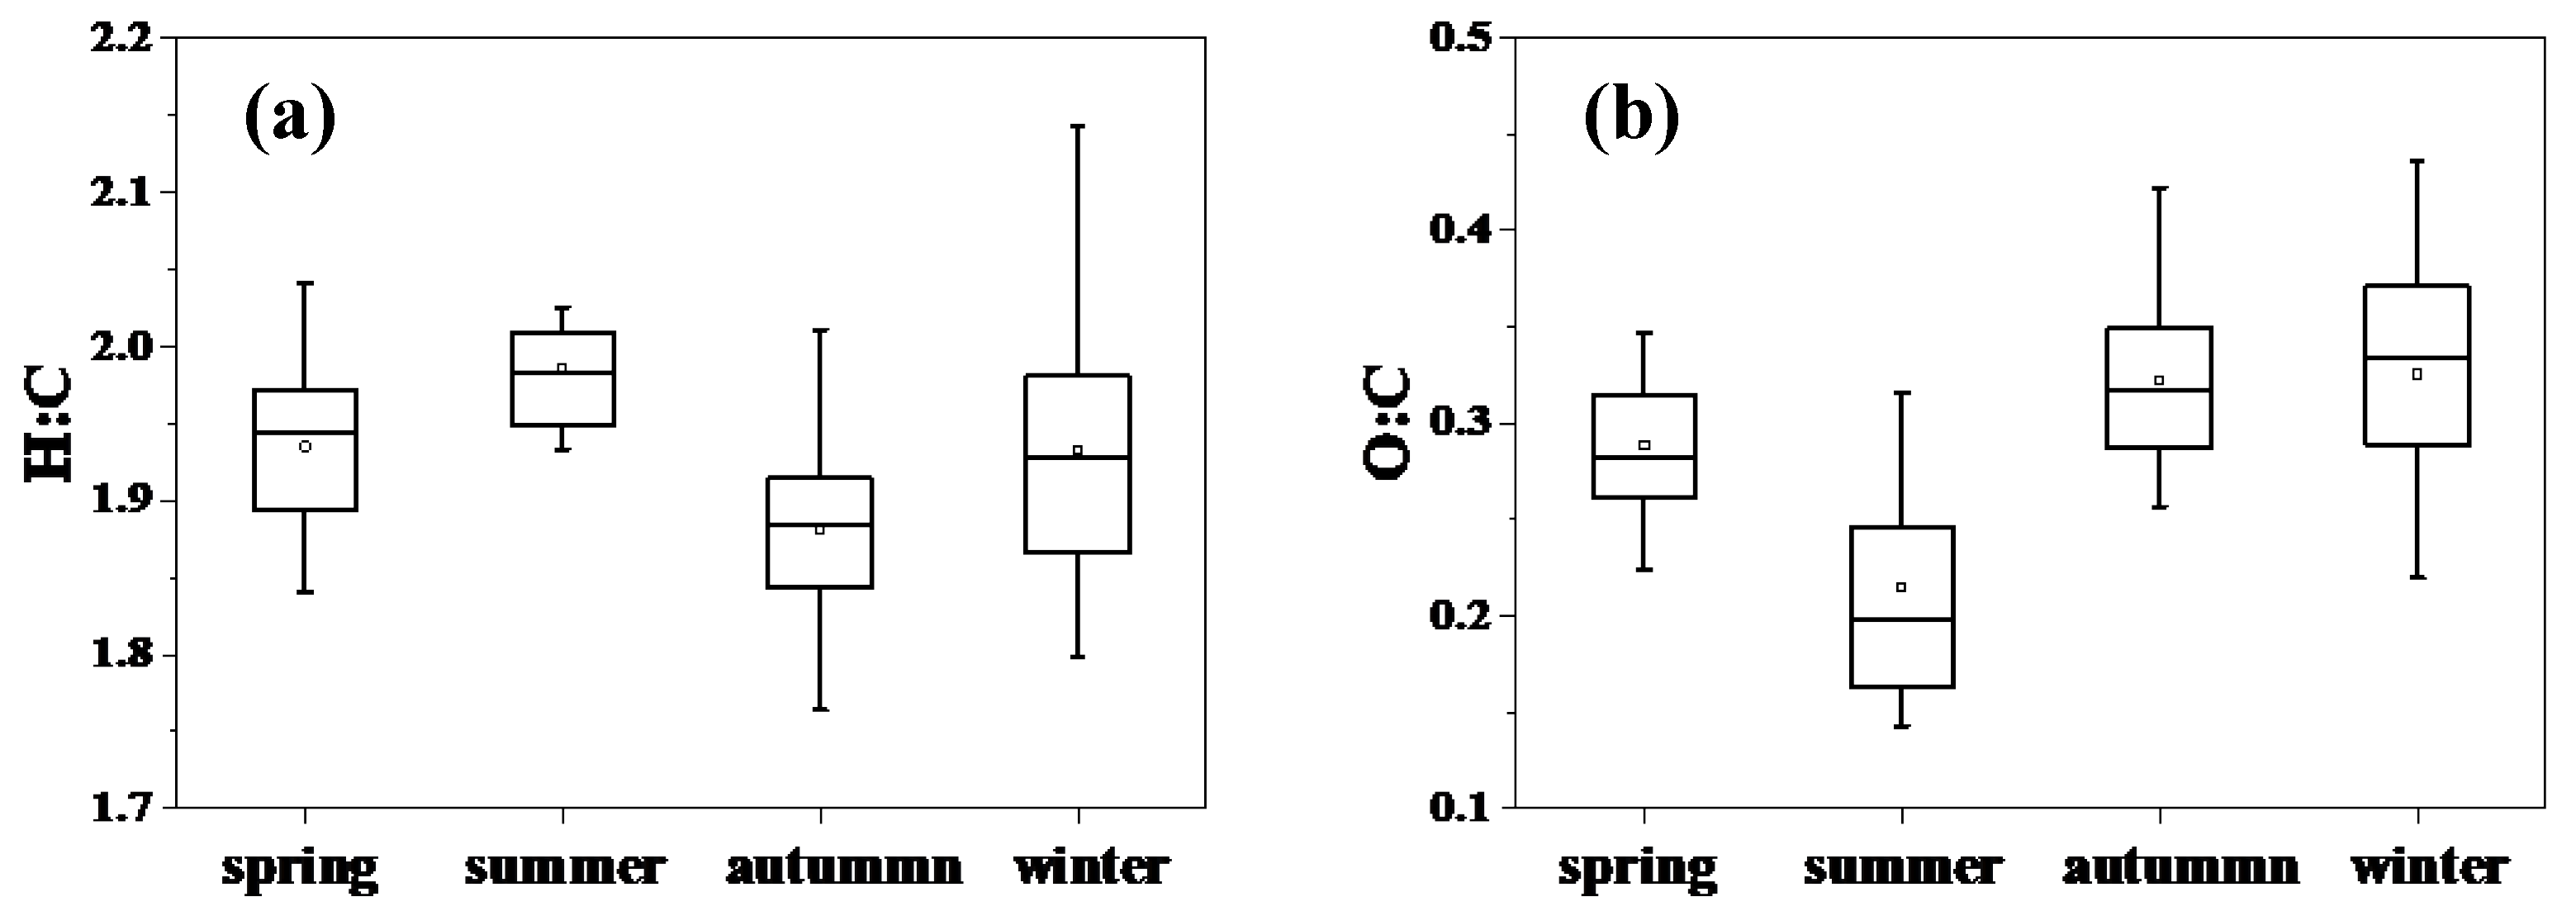
The elemental ratios of atomic hydrogen-to-carbon (H:C) and oxygen-to-carbon (O:C) in the different seasons are shown in Figure 4. The average H:C were 1.94 ± 0.05, 1.99 ± 0.04, 1.88 ± 0.06, and 1.84 ± 0.05 in spring, summer, autumn, and winter, respectively. The O:C values showed a different variation trend with H:C. The average O:C values were 0.32 ± 0.04, 0.30 ± 0.05, 0.29 ± 0.03, and 0.22 ± 0.06 in autumn, winter, spring and summer, respectively. The high H:C and low O:C values in spring and summer suggested that the organic aerosols were less aged compared to autumn and winter. It was likely due to the higher proportion of less-oxidized OA in spring and summer, while the OA in autumn and winter were more oxidized, as discussed in Section 3.2.
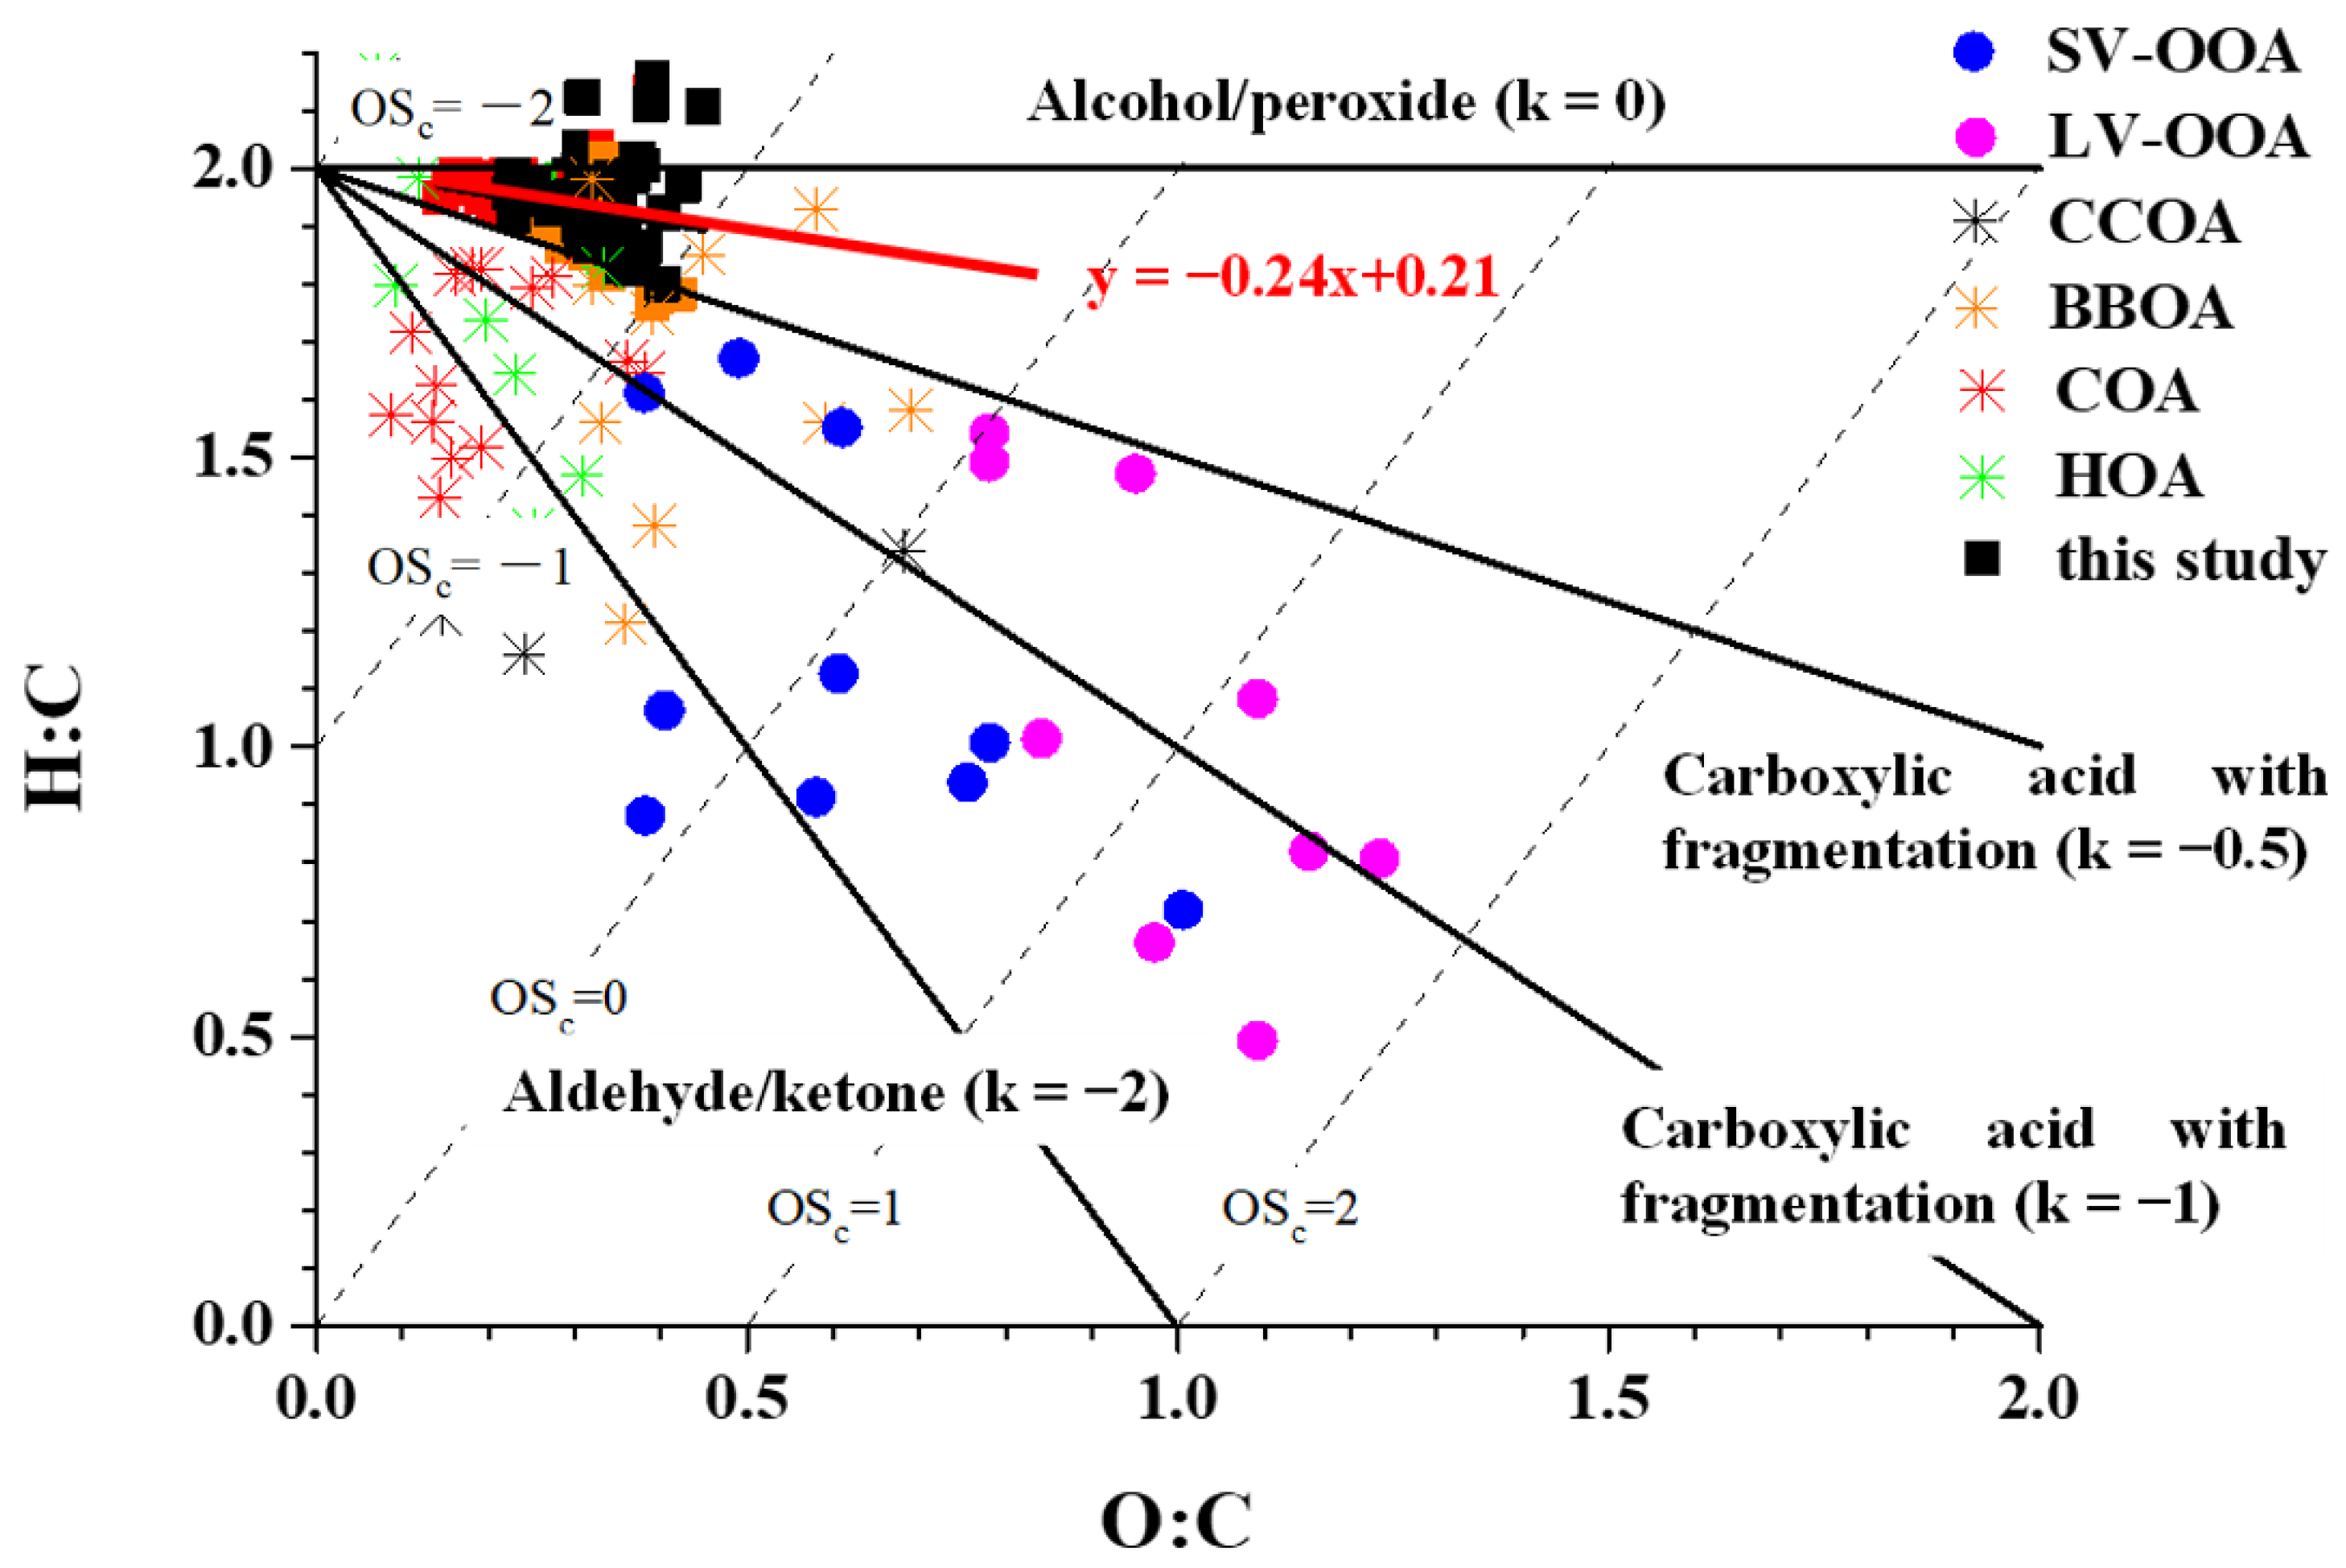
The data points of H:C and O:C distribution in each season are displayed in the VK- OS ¯ c space in Figure 5. The slopes of the fitting lines of H:C versus O:C plotted in the VK- OS ¯ c space could indicate the aging pathways of OA [55,56]. Most of the data points of H:C and O:C were all located in the region between the lines, with a slope = 0 and a slope = −0.5, and the slope of the linear fitting line for these data points was −0.24, suggesting that both the replacement of the alcohol groups (–OH) and carboxylic acid functional groups (–COOH) contributed to the formation of WSOC [56]. Compared with previous studies, the distributions of H:C and O:C in the VK- OS ¯ c space for the different seasons were narrower, which indicated that the composition of WSOC was similar during the sampling periods throughout the year.
The oxidation state of carbon ( OS ¯ c     2 O : C - H : C ) is a useful metric describing the oxidation degree of organic aerosols and has been widely applied in field studies [57,58,59]. The average OS ¯ c of the OA was the lowest in summer (−1.55 ± 0.11), followed by spring (−1.34 ± 0.11), while the average OS ¯ c were similar in autumn and winter (−1.24 ± 0.12 and −1.27 ± 0.14, respectively) and higher than those in spring and summer, showing that the WSOCs were more oxidized in autumn and winter, which is consistent with the results of f44 vs. f43. The OS ¯ c had similar values with the HOA and COA, although they were smaller than the OOAs observed in Beijing [52], Changzhou [36], and Hangzhou [60], suggesting that the WSOC were fresh aerosols and were derived mainly from primary emissions [61], especially in summer.

3.4. Source Analysis of WSOC

3.4.1. PMF Analysis

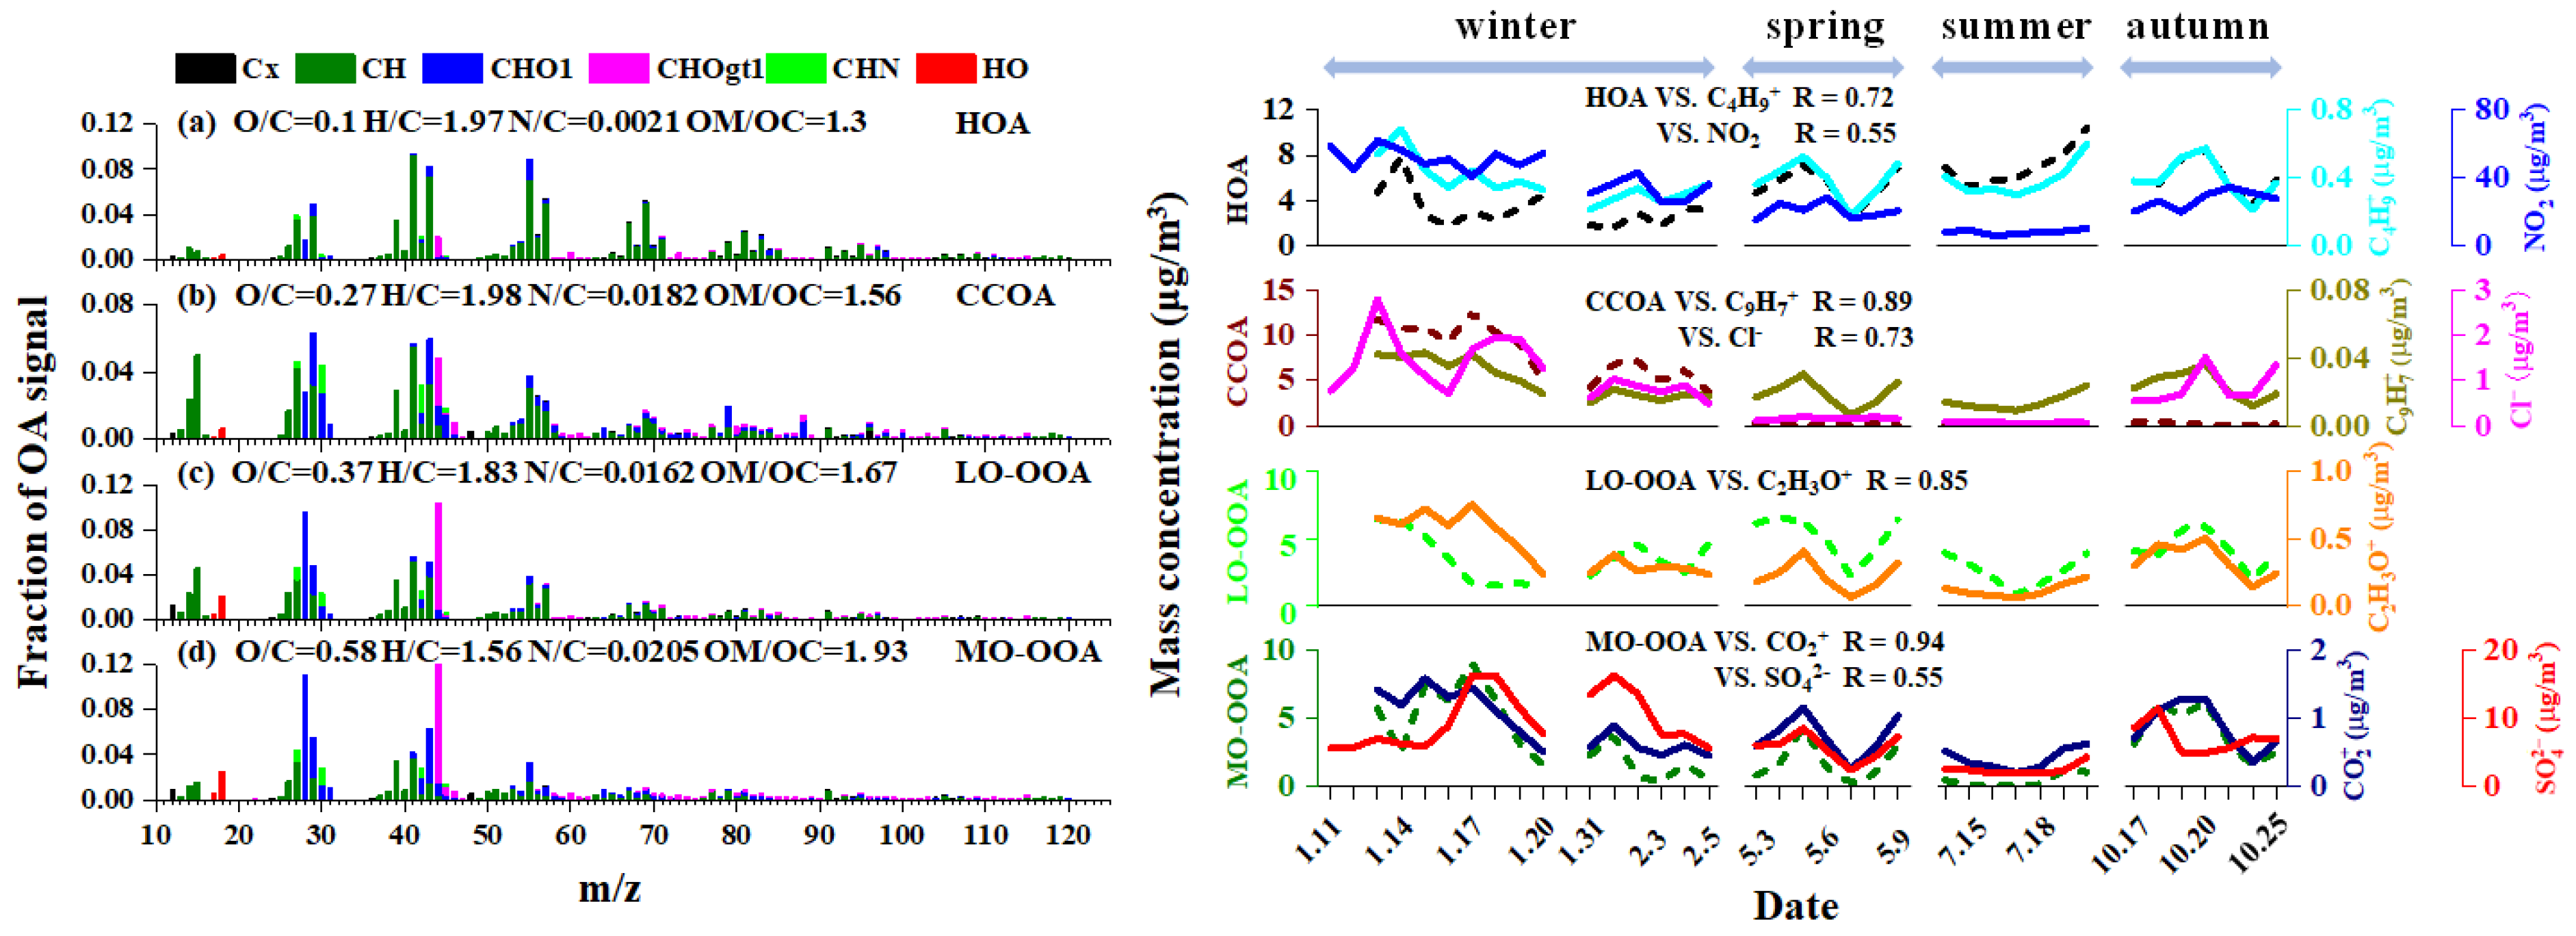
Four OA factors were identified by PMF analysis, including an HOA, a CCOA, a less oxidized oxygenated organic aerosol (LO-OOA), and a more oxidized oxygenated organic aerosol (MO-OOA), as shown in Figure 6. The C x H y + fragments had a proportion of 84% in the HOA spectrum, which was higher than the results in Changzhou and Yangzhou [26,32], indicating that HOA was primarily from fresh emissions [61]. The O:C of HOA was 0.1 in this study, which is consistent with previous urban studies [62,63]. The HOA showed a good correlation with the C 4 H 9 + fragment (r = 0.72, p < 0.05), which has been widely used as a tracer of traffic emissions for AMS data [61,64], suggesting the likely contribution of traffic emission. However, HOA did not have a significant correlation efficiency with the daily average concentrations of NO2, especially during the sampling periods in autumn. On the one hand, the deficiency in HOA concentrations might contribute to the low correlation efficiency between HOA and NO2. On the other hand, NO2 included substantial interferences by NOx oxidation products [65] and was also emitted by biomass burning, especially in autumn. Therefore, NOx was not a perfect traffic marker and HOA should also not be equated with pure vehicle exhaust in this study [66].
The secondary factor also had a relatively low O:C value (0.27) and its mass spectrum was similar to the mass profile of coal combustion organic aerosols (r = 0.86, p < 0.05). The factor correlated well with chloride (r = 0.73, p < 0.05) and ion C 9 H 7 + (r = 0.89, p < 0.05), a coal combustion tracer, suggesting that coal burning contributed to WSOC. Therefore, this factor was defined as CCOA. It should be noted that the correlation efficiencies between CCOA and chloride, CCOA, and m/z 115 were obtained from their concentrations during the sampling period in winter because the concentrations of CCOA were too low in spring, summer, and autumn.
The spectral profiles of the third and fourth factors were similar (r = 0.92, p < 0.05), both of which were dominated by the signal intensities at m/z 28 (mainly CO+), m/z 29 (mainly CHO+), m/z 43 (mainly C2H3O+), and m/z 44 (mainly CO 2 + ). The C2H3O+ fragment was usually used as a tracer for LO-OOA, as suggested by previous studies [36,60,67]. The third factor showed a good correlation with C2H3O+ (r = 0.85, p < 0.05); thus, it was treated as LO-OOA, even though it was poorly correlated with nitrate. The authors of another study [60] also reported that LO-OOA did not correlate well with nitrate in Hangzhou, but they still regarded that factor as LO-OOA, based on its good correlation with C2H3O+. The O:C value of LO-OOA was 0.37, lower than the samples from the North China Plain (0.38–0.84) [52,68,69,70,71] but within the range of those observed in other Yangtze River Delta (YRD) cities (0.32–0.53) [32,36,60,67], likely due to the difference in atmospheric oxidation in the different areas [14].
The fragments of C x H y O z + in the fourth factor had a higher fraction than those in LO-OOA, and the O:C value in MO-OOA was also higher. The CO 2 + fragment was often treated as a tracer for MO-OOA, and the correlation coefficient between CO 2 + and this factor was 0.94 (p < 0.05). Therefore, this factor was defined as MO-OOA. Similar to LO-OOA, the O:C of MO-OOA (0.58) was lower than those observed in north China (0.78–1.3), while they were close to that observed in Nanjing [67]. The MO-OOA had a better correlation with sulfate (r = 0.55, p < 0.05) than with nitrate (r = 0.44, p < 0.05), which is consistent with the results reported by the author of [67],.wherein the correlation efficiencies between MO-OOA and sulfate and between MO-OOA and nitrate were 0.25 and 0.11, respectively.
The HOA and CCOA, which are usually considered to be from primary emissions, made significant contributions to WSOC in the different seasons (as shown in Figure 7), especially in summer and winter, verifying the speculation regarding the results from the VK- OS ¯ c diagram. The fractions of the different factors in WSOC were distinguished for each season. HOA had the highest proportion of WSOC in summer (~70%), due to the decrease in LO-OOA and MO-OOA, compared to other seasons. The fraction of HOA decreased and took up ~42% of the WSOC in spring and autumn, suggesting both primary and secondary organic aerosols were important to WSOC in these seasons. CCOA had the least share in spring, summer, and autumn, and increased significantly in winter, probably due to the increasing demand for heating. LO-OOA had the highest fraction in spring and decreased in other seasons. On the contrary, MO-OOA appeared to increase from spring to winter. The authors of [22,60] and suggested that MO-OOA could be produced via the oxidation of LO-OOA. The increase in the MO-OOA fraction might be due to the transformation of LO-OOA to MO-OOA.

3.4.2. Geographical Origins of WSOC

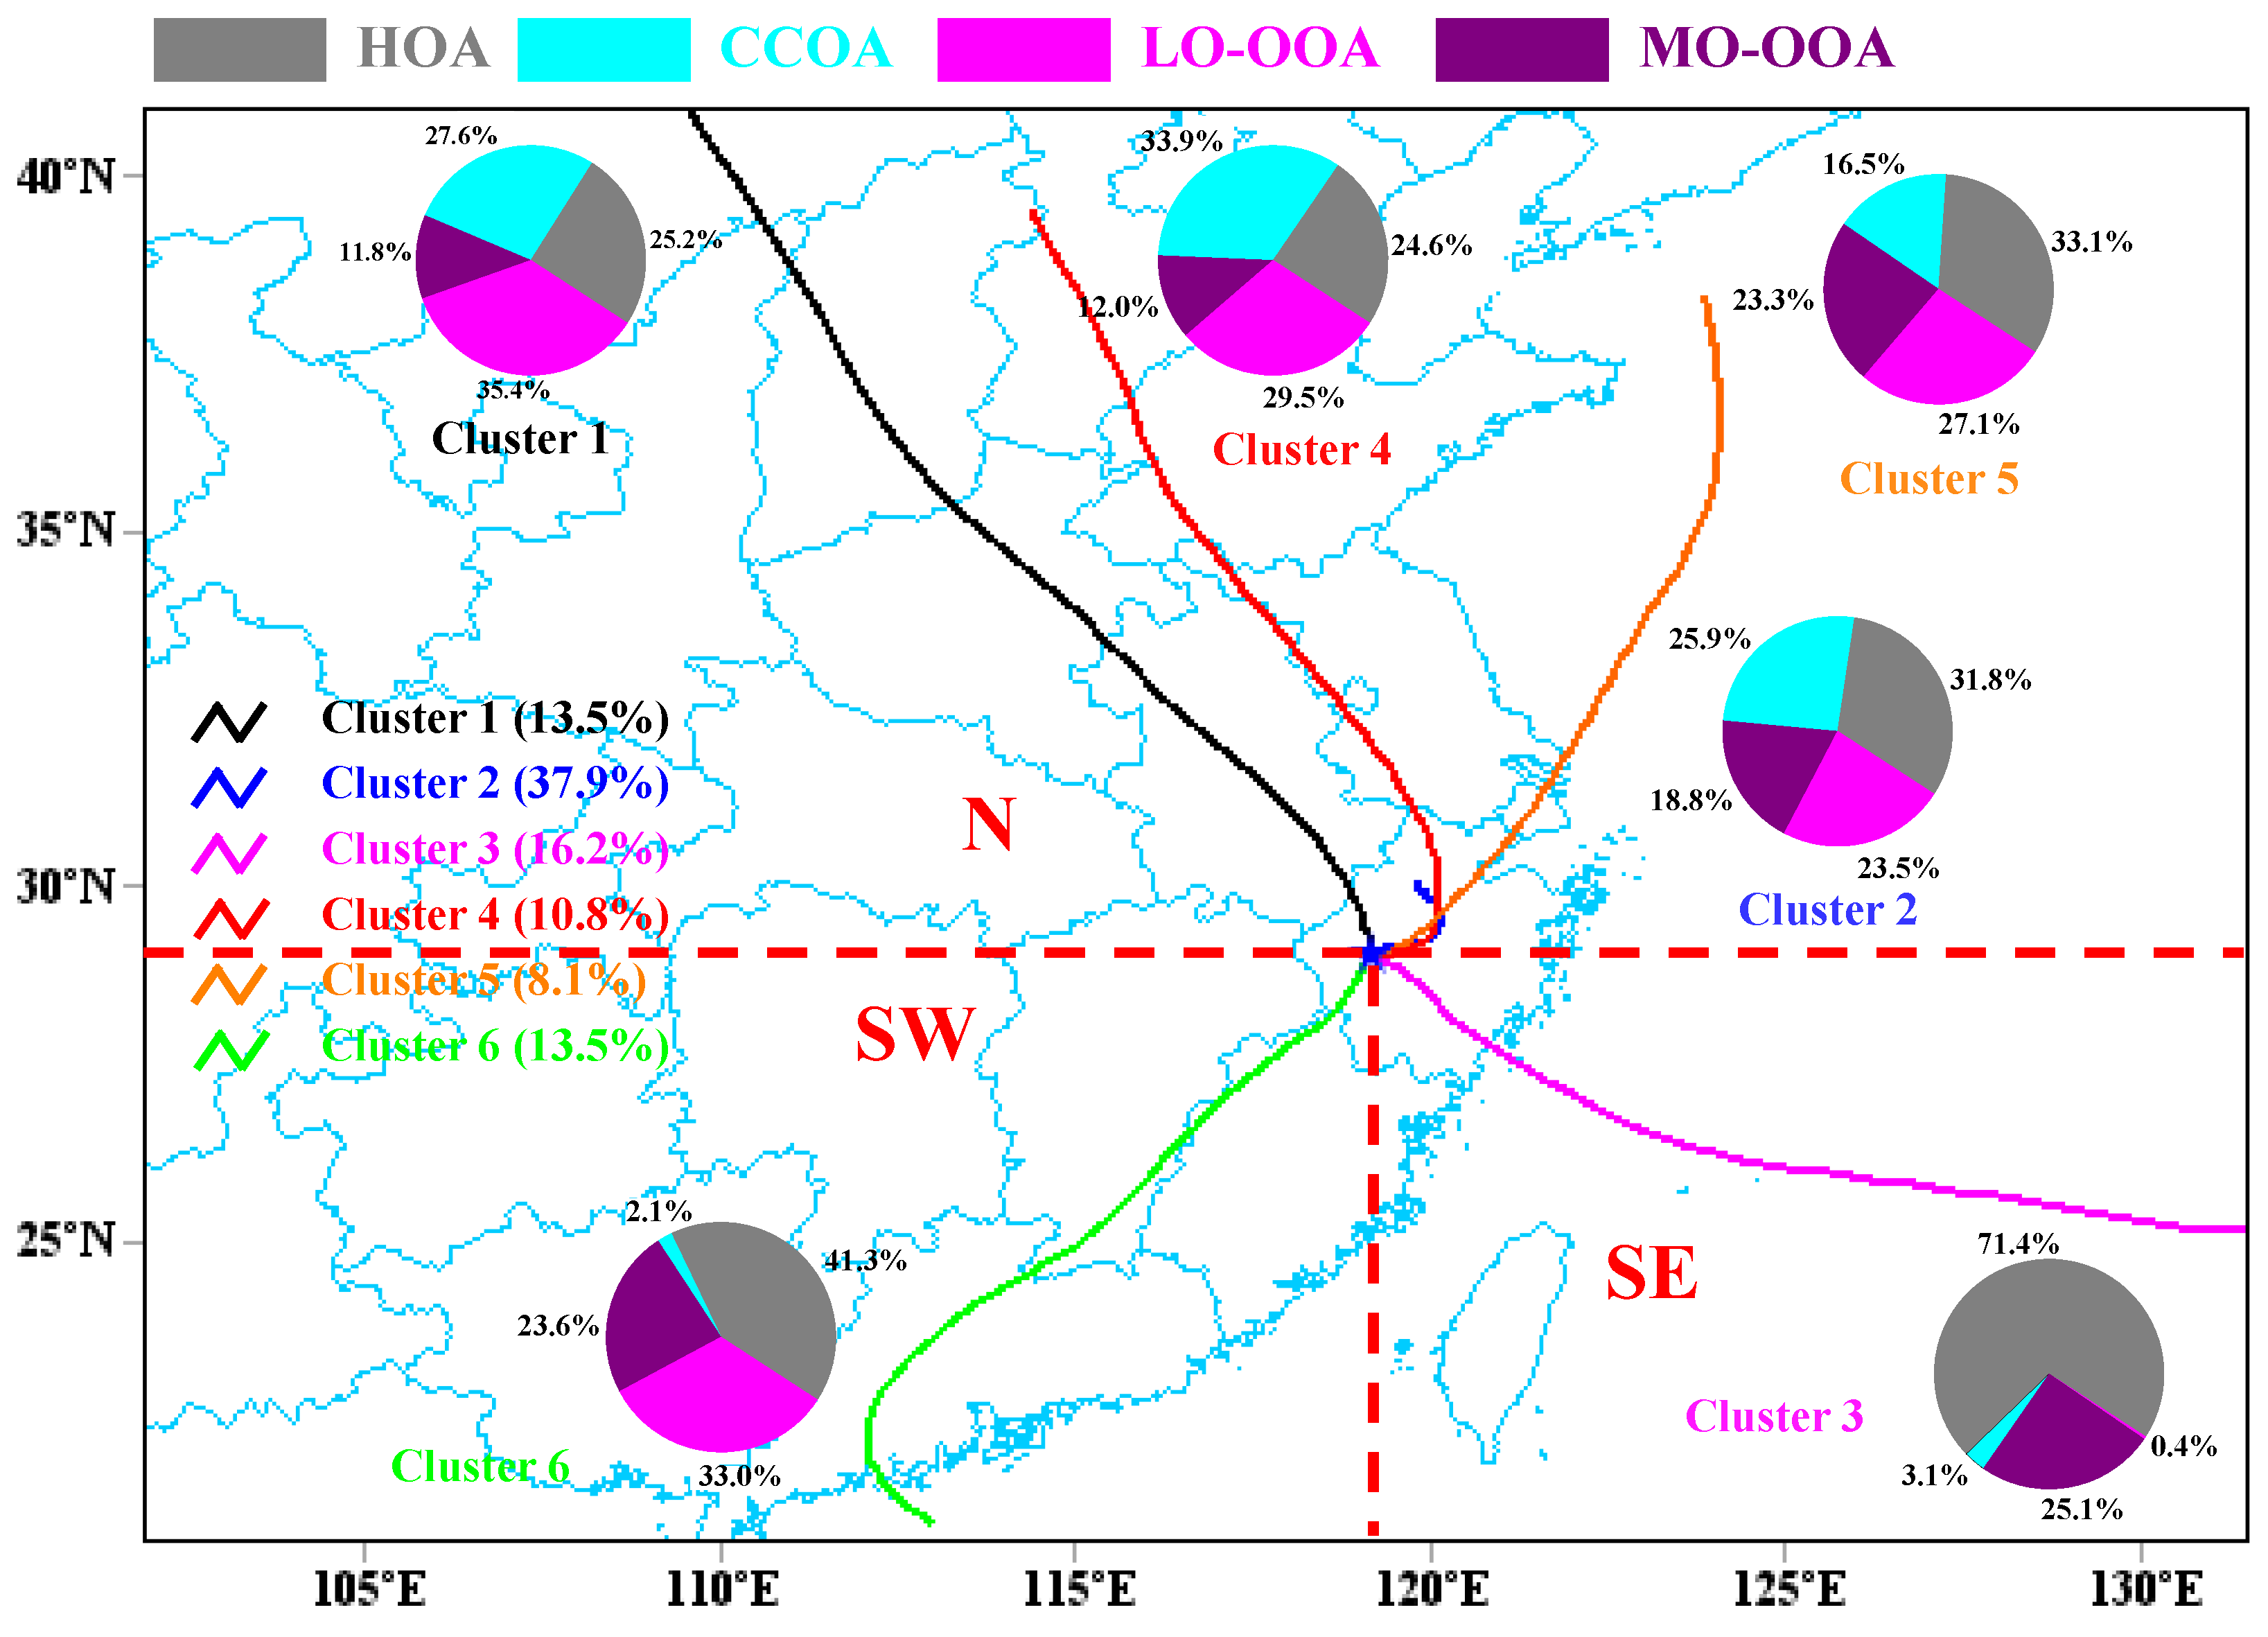
The 48-h backward trajectories of the air parcels during the sampling periods in each season were grouped into six clusters, as shown in Figure 8. The geographical areas, which the air parcels passed through, were divided into three parts according to their directions relative to Longyou: north, southwest, and southeast. The trajectories of clusters 1, 2, 4, and 5 were from the north part and took up 13.5%, 37.9%, 10.8%, and 8.1% of all trajectories, respectively, and the arrival time of the responding air parcels was mainly in winter, as illustrated in Figure S6 in the Supplementary Materials. It can be seen that the CCOA made significant contributions to the aerosols from these regions, especially for inland areas (cluster 1, 2, and 4), probably due to the increasing demand for heating in north China during the winter. The trajectories of cluster 3, which accounted for 16.2% of all trajectories, were from the marine area of east China, and the arrival times of these air parcels were mainly in summer. The HOA was the dominant component in the WSOC originating from these areas, suggesting that the aerosols were fresh and were not highly oxidized along the transport path, which might be one of the reasons why HOA had the highest proportion in summer. The air parcels of cluster 6, where the arrival times were mainly in autumn, stemmed from the sea to the south of Guangdong province, and their trajectories took up 13.5% of all trajectories. Although the HOA also had a large proportion of the WSOC, the contribution of LO-OOA increased significantly compared to the aerosols in cluster 3, which might be as a result of the oxidation of HOA.
The spatial distribution of the WPSCF values of the WSOC for each sampling period during the different seasons are shown in Figure 9. It can be seen that the regions around Longyou did not seem to be potential source areas of WSOC in spring and summer because the WPSCF values were typically less than 0.2. During the sampling period in autumn, the areas of east Longyou appeared to be potential source regions of WSOC, with WPSCF values of ~0.5. The WPSCF values were also high over the locations around Longyou and east Zhejiang province in winter, indicating that these locations were likely to be source areas of WSOC.

4. Conclusions

The seasonal variations in atmospheric pollutants and WSOC composition were analyzed during the spring, summer, autumn, and winter of 2018 in Longyou, a city suffering from aerosol pollution in eastern China. The highest concentration of PM2.5, with an average of 69 ± 25.6 μg/m3, was observed in winter. Correspondingly, the concentrations of nitrate, ammonium, sulfate, OM, and EC were also the highest in winter, followed by autumn, spring, and summer, suggesting that winter was the most polluted season in Longyou.
Based on the spectra of WSOC analyzed by AMS, the fragments of m/z > 100 were more abundant in autumn and winter, compared with spring and summer, which suggested that the composition was more complicated in autumn and winter. This may be due to the higher contribution made by biomass burning and coal burning in autumn and winter than in spring and summer.
Four OA factors were identified via PMF analysis. The HOA had the highest proportion of WSOC in summer and it decreased in autumn and winter. The relative contribution of CCOA to WSOC could be almost ignored in spring, summer, and autumn, while it increased significantly in winter, probably due to the increasing local and regional emissions because of the increased demand for heating. The LO-OOA might transfer to MO-OOA from spring to winter, resulting in an increase in the MO-OOA contribution in terms of WSOC.
The air parcels from north Zhejiang province and north China during the winter brought coal combustion aerosols to Longyou along their transport path and resulted in a sharp increase in CCOA. The air parcels, which originated from the sea in east and south China in spring and summer, mainly contributed to HOA. The PSCF analyses showed that the regions around Longyou did not seem to have significant effects on WSOC in spring and summer, while the regions around Longyou and east Zhejiang province were potential source areas of WSOC in the autumn and winter. It is evident that, in order to successfully implement air pollution mitigation in Longyou, it is necessary to take into consideration the transit of pollutants, as well as the need for controlling local and regional emissions.

Supplementary Materials

The following supporting information can be downloaded at: https://www.mdpi.com/article/10.3390/atmos13121968/s1, Figure S1: Locations of sampling sites in Longyou; Figure S2: Summary of key diagnostic plots of the PMF results for the HR-ToF-AMS dataset derived from the PM2.5 samples collected in different seasons: (a) Q/Qexp as a function of number of factors selected for PMF modelling. For the four-factor solution: (b) Q/Qexp as a function of FPEAK, (c) the box and whiskers plot showing the distributions of scaled residuals for each m/z, and (d) the Q/Qexp values for each m/z; Figure S3: Wind frequency rose during the sampling periods of (a) spring, (b) summer, (c) autumn and (d) winter; Figure S4: Mass spectra of water-soluble organic carbon during the sampling periods of (a) spring, (b) summer, (c) autumn and (d) winter; Figure S5: Fire map of areas around Longyou during the aerosol sampling period of (a) spring and summer, (b) autumn and winter. The Fire Maps were acquired from Fire Information for Resource Management System (FIRMS) developed by the National Aeronautics and Space Administration (NASA). The data of VIIRS (375m) was used (https://firms.modaps.eosdis.nasa.gov/active_fire/ (accessed on 10 October 2022)); Figure S6: Arrival time (local time) of the trajectories of each cluster during each sampling period. Different colors represent different clusters; Table S1: Summary of average meteorological parameters, mass concentrations of atmospheric pollutants and PM2.5 composition for three sites during sampling periods in each season; Table S2: Summary of the f43, f44 and elemental ratios derived from PMF-resolved OA factors for different cities in previous studies; Table S3: Summary of the f43, f44 and elemental ratios derived from PMF-resolved OA factors for Beijing in previous studies.

Author Contributions

Conceptualization, L.C.; methodology, Z.B.; software, X.Z.; validation, Z.B.; formal analysis, J.L.; investigation, H.X.; resources, Z.B.; data curation, X.Z.; writing—original draft preparation, J.L.; writing—review and editing, J.L.; visualization, J.L.; supervision, K.C.; project administration, X.G.; funding acquisition, L.C. All authors have read and agreed to the published version of the manuscript.

Funding

This research was funded by National Natural Science Foundation of China, grant number 51876190; the project of Hangzhou Technology, grant number 20201203B126; the Innovative Research Groups of the National Natural Science Foundation of China, grant number 51621005; the program on Introducing Talents of Discipline to University, grant number BP0820002.

Data Availability Statement

The data presented in this study are openly available in zenodo at https://doi.org/10.5281/zenodo.7344270.

Conflicts of Interest

The authors declare no conflict of interest.

References

  1. Cheng, Y.; Yan, L.; Huang, Y.; Wang, Q.; Morawska, L.; Zhaolin, G.; Cao, J.; Zhang, L.; Li, B.; Wang, Y. Characterization of particle size distributions during winter haze episodes in urban air. Atmos. Res. 2019, 228, 55–67. [Google Scholar] [CrossRef]
  2. Li, X.; Jiang, L.; Bai, Y.; Yang, Y.; Liu, S.; Chen, X.; Xu, J.; Liu, Y.; Wang, Y.; Guo, X.; et al. Wintertime aerosol chemistry in Beijing during haze period: Significant contribution from secondary formation and biomass burning emission. Atmos. Res. 2019, 218, 25–33. [Google Scholar] [CrossRef]
  3. Wu, X.; Xin, J.; Zhang, X.; Klaus, S.; Wang, Y.; Wang, L.; Wen, T.; Liu, Z.; Si, R.; Liu, G.; et al. A new approach of the normalization relationship between PM2.5 and visibility and the theoretical threshold, a case in north China. Atmos. Res. 2020, 245, 105054. [Google Scholar] [CrossRef]
  4. Zhang, R.; Wang, G.; Guo, S.; Zamora, M.L.; Ying, Q.; Lin, Y.; Wang, W.; Hu, M.; Wang, Y. Formation of urban fine particulate matter. Chem. Rev. 2015, 115, 3803–3855. [Google Scholar] [CrossRef] [PubMed]
  5. Yue, H.; He, C.; Huang, Q.; Yin, D.; Bryan, B.A. Stronger policy required to substantially reduce deaths from PM2.5 pollution in China. Nat. Commun. 2020, 11, 1462–1472. [Google Scholar] [CrossRef] [PubMed] [Green Version]
  6. Huang, R.; Zhang, Y.; Bozzetti, C.; Ho, K.; Cao, J.; Han, Y.; Daellenbach, K.R.; Slowik, J.G.; Platt, S.M.; Canonaco, F. High secondary aerosol contribution to particulate pollution during haze events in China. Nature 2014, 514, 218. [Google Scholar] [CrossRef] [Green Version]
  7. Wang, G.; Zhang, R.; Gomez, M.E.; Yang, L.; Levy, Z.M.; Hu, M.; Lin, Y.; Peng, J.; Guo, S.; Meng, J. Persistent sulfate formation from London Fog to Chinese haze. Proc. Natl. Acad. Sci. USA 2016, 48, 13630–13635. [Google Scholar] [CrossRef] [Green Version]
  8. Li, J.; Liu, Z.; Cao, L.; Gao, W.; Yan, Y.; Mao, J.; Zhang, X.; He, L.; Xin, J.; Tang, G.; et al. Highly time-resolved chemical characterization and implications of regional transport for submicron aerosols in the North China Plain. Sci. Total Environ. 2020, 705, 135803. [Google Scholar] [CrossRef]
  9. Park, S.; Son, S.; Lee, S. Characterization, sources, and light absorption of fine organic aerosols during summer and winter at an urban site. Atmos. Res. 2018, 213, 370–380. [Google Scholar] [CrossRef]
  10. Hong, Q.; Liu, C.; Hu, Q.; Xing, C.; Tan, W.; Liu, H.; Huang, Y.; Zhu, Y.; Zhang, J.; Geng, T.; et al. Evolution of the vertical structure of air pollutants during winter heavy pollution episodes: The role of regional transport and potential sources. Atmos. Res. 2019, 228, 206–222. [Google Scholar] [CrossRef]
  11. Śliwiński, D.; Konieczna, A.; Roman, K. Geostatistical Resampling of LiDAR-Derived DEM in Wide Resolution Range for Modelling in SWAT: A Case Study of Zgłowiączka River (Poland). Remote Sens. 2022, 14, 1281. [Google Scholar] [CrossRef]
  12. Zheng, G.J.; Duan, F.K.; Su, H.; Ma, Y.L.; Cheng, Y.; Zheng, B.; Zhang, Q.; Huang, T.; Kimoto, T.; Chang, D.; et al. Exploring the severe winter haze in Beijing: The impact of synoptic weather, regional transport and heterogeneous reactions. Atmos. Chem. Phys. 2015, 15, 2969–2983. [Google Scholar] [CrossRef] [Green Version]
  13. Li, K.; Chen, L.; White, S.J.; Han, K.; Lv, B.; Bao, K.; Wu, X.; Gao, X.; Azzi, M.; Cen, K. Effect of nitrogen oxides (NO and NO2) and toluene on SO 2 photooxidation, nucleation and growth: A smog chamber study. Atmos. Res. 2017, 192, 38–47. [Google Scholar] [CrossRef]
  14. Yang, Y.; Wang, Y.; Yao, D.; Zhao, S.; Yang, S.; Ji, D.; Sun, J.; Wang, Y.; Liu, Z.; Hu, B.; et al. Significant decreases in the volatile organic compound concentration, atmospheric oxidation capacity and photochemical reactivity during the National Day holiday over a suburban site in the North China Plain. Environ. Pollut. 2020, 263, 114657. [Google Scholar] [CrossRef] [PubMed]
  15. An, J.; Cao, Q.; Zou, J.; Wang, H.; Duan, Q.; Shi, Y.; Chen, C.; Wang, J. Seasonal Variation in Water-Soluble Ions in Airborne Particulate Deposition in the Suburban Nanjing Area, Yangtze River Delta, China, During Haze Days and Normal Days. Arch. Environ. Contam. Toxicol. 2018, 74, 1–15. [Google Scholar] [CrossRef]
  16. Pathak, R.K.; Wu, W.S.; Wang, T. Summertime PM2.5 ionic species in four major cities of China: Nitrate formation in an ammonia-deficient atmosphere. Atmos. Chem. Phys. 2008, 9, 1711–1722. [Google Scholar] [CrossRef] [Green Version]
  17. Sun, Y.; He, Y.; Kuang, Y.; Xu, W.; Song, S.; Ma, N.; Tao, J.; Cheng, P.; Wu, C.; Su, H.; et al. Chemical Differences Between PM1 and PM2.5 in Highly Polluted Environment and Implications in Air Pollution Studies. Geophys. Res. Lett. 2020, 47, e2019GL086288. [Google Scholar] [CrossRef]
  18. Wang, W.; Yu, J.; Cui, Y.; He, J.; Xue, P.; Cao, W.; Ying, H.; Gao, W.; Yan, Y.; Hu, B.; et al. Characteristics of fine particulate matter and its sources in an industrialized coastal city, Ningbo, Yangtze River Delta, China. Atmos. Res. 2018, 203, 105–117. [Google Scholar] [CrossRef]
  19. Salih, M.Q.; Hamadamin, R.R.; Hama, J.R. Emission and exposure of hydrogen sulfide in the air from oil refinery: Spatiotemporal field monitoring. Int. J. Environ. Sci. Technol. 2022, 1, 1–10. [Google Scholar] [CrossRef]
  20. Canagaratna, M.R.; Jayne, J.T.; Jimenez, J.L.; Allan, J.D.; Alfarra, M.R.; Zhang, Q.; Onasch, T.B.; Drewnick, F.; Coe, H.; Middlebrook, A.; et al. Chemical and microphysical characterization of ambient aerosols with the aerodyne aerosol mass spectrometer. Mass Spectrom. Rev. 2007, 26, 185–222. [Google Scholar] [CrossRef]
  21. Jayne, J.T.; Leard, D.C.; Zhang, X.; Davidovits, P.; Smith, K.A.; Kolb, C.E.; Worsnop, D.R. Development of an Aerosol Mass Spectrometer for Size and Composition Analysis of Submicron Particles. Aerosol Sci. Technol. 2000, 33, 49–70. [Google Scholar] [CrossRef] [Green Version]
  22. Zhang, J.; Lance, S.; Brandt, R.; Marto, J.; Ninneman, M.; Schwab, J. Observed below-Cloud and Cloud Interstitial Submicron Aerosol Chemical and Physical Properties at Whiteface Mountain, New York, during August 2017. ACS Earth Space Chem. 2019, 3, 1438–1450. [Google Scholar] [CrossRef]
  23. Jimenez, J.L.; Canagaratna, M.R.; Donahue, N.M.; Prevot, A.S.H.; Zhang, Q.; Kroll, J.H.; DeCarlo, P.F.; Allan, J.D.; Coe, H.; Ng, N.L.; et al. Evolution of Organic Aerosols in the Atmosphere. Science 2009, 326, 1525–1529. [Google Scholar] [CrossRef] [PubMed]
  24. Qiu, Y.; Xie, Q.; Wang, J.; Xu, W.; Li, L.; Wang, Q.; Zhao, J.; Chen, Y.; Chen, Y.; Wu, Y.; et al. Vertical Characterization and Source Apportionment of Water-Soluble Organic Aerosol with High-resolution Aerosol Mass Spectrometry in Beijing, China. ACS Earth Space Chem. 2019, 3, 273–284. [Google Scholar] [CrossRef]
  25. Hu, R.; Xu, Q.; Wang, S.; Hua, Y.; Bhattarai, N.; Jiang, J.; Song, Y.; Daellenbach, K.R.; Qi, L.; Prevot, A.S.H.; et al. Chemical characteristics and sources of water-soluble organic aerosol in southwest suburb of Beijing. J. Environ. Sci. 2020, 95, 95–110. [Google Scholar] [CrossRef]
  26. Ye, Z.; Li, Q.; Liu, J.; Luo, S.; Zhou, Q.; Bi, C.; Ma, S.; Chen, Y.; Chen, H.; Li, L.; et al. Investigation of submicron aerosol characteristics in Changzhou, China: Composition, source, and comparison with co-collected PM2.5. Chemosphere 2017, 183, 176–185. [Google Scholar] [CrossRef]
  27. Ervens, B. Influence of water-soluble organic carbon on cloud drop number concentration. J. Geophys. Res. 2005, 110, 1–14. [Google Scholar] [CrossRef]
  28. Izhar, S.; Gupta, T.; Panday, A.K. Scavenging efficiency of water soluble inorganic and organic aerosols by fog droplets in the Indo Gangetic Plain. Atmos. Res. 2020, 235, 104767. [Google Scholar] [CrossRef]
  29. Meng, J.; Liu, X.; Hou, Z.; Yi, Y.; Yan, L.; Li, Z.; Cao, J.; Li, J.; Wang, G. Molecular characteristics and stable carbon isotope compositions of dicarboxylic acids and related compounds in the urban atmosphere of the North China Plain: Implications for aqueous phase formation of SOA during the haze periods. Sci. Total Environ. 2020, 705, 135256. [Google Scholar] [CrossRef]
  30. Ding, X.; Qi, J.; Meng, X. Characteristics and sources of organic carbon in coastal and marine atmospheric particulates over East China. Atmos. Res. 2019, 228, 281–291. [Google Scholar] [CrossRef]
  31. Zheng, M.; Cass, G.R.; Schauer, J.J.; Edgerton, E.S. Source Apportionment of PM2.5 in the Southeastern United States Using Solvent-Extractable Organic Compounds as Tracers. Environ. Sci. Technol. 2002, 36, 2361–2371. [Google Scholar] [CrossRef] [PubMed]
  32. Ge, X.; Li, L.; Chen, Y.; Chen, H.; Wu, D.; Wang, J.; Xie, X.; Ge, S.; Ye, Z.; Xu, J.; et al. Aerosol characteristics and sources in Yangzhou, China resolved by offline aerosol mass spectrometry and other techniques. Environ. Pollut. 2017, 225, 74–85. [Google Scholar] [CrossRef] [PubMed]
  33. Liu, Z.; Gao, W.; Yu, Y.; Hu, B.; Xin, J.; Sun, Y.; Wang, L.; Wang, G.; Bi, X.; Zhang, G.; et al. Characteristics of PM2.5 mass concentrations and chemical species in urban and background areas of China: Emerging results from the CARE-China network. Atmos. Chem. Phys. 2018, 18, 8849–8871. [Google Scholar] [CrossRef] [Green Version]
  34. Bao, Z.; Chen, L.; Li, K.; Han, L.; Wu, X.; Gao, X.; Azzi, M.; Cen, K. Meteorological and chemical impacts on PM2. 5 during a haze episode in a heavily polluted basin city of eastern China. Environ. Pollut. 2019, 250, 520–529. [Google Scholar] [CrossRef] [PubMed]
  35. Xing, L.; Fu, T.; Cao, J.J.; Lee, S.C.; Wang, G.H.; Ho, K.F.; Cheng, M.; You, C.; Wang, T.J. Seasonal and spatial variability of the OM/OC mass ratios and high regional correlation between oxalic acid and zinc in Chinese urban organic aerosols. Atmos. Chem. Phys. 2013, 13, 4307–4318. [Google Scholar] [CrossRef] [Green Version]
  36. Ye, Z.; Liu, J.; Gu, A.; Feng, F.; Liu, Y.; Bi, C.; Xu, J.; Li, L.; Chen, H.; Chen, Y.; et al. Chemical characterization of fine particulate matter in Changzhou, China, and source apportionment with offline aerosol mass spectrometry. Atmos. Chem. Phys. 2017, 17, 2573–2592. [Google Scholar] [CrossRef] [Green Version]
  37. Canagaratna, M.R.; Jimenez, J.L.; Kroll, J.H.; Chen, Q.; Kessler, S.H.; Massoli, P.; Hildebrandt Ruiz, L.; Fortner, E.; Williams, L.R.; Wilson, K.R.; et al. Elemental ratio measurements of organic compounds using aerosol mass spectrometry: Characterization, improved calibration, and implications. Atmos. Chem. Phys. 2015, 15, 253–272. [Google Scholar] [CrossRef] [Green Version]
  38. Paatero, P.; Tapper, U. Positive matrix factorization: A non-negative factor model with optimal utilization of error estimates of data values. Environmetrics 1994, 5, 111–126. [Google Scholar] [CrossRef]
  39. Ulbrich, I.M.; Canagaratna, M.R.; Zhang, Q.; Worsnop, D.R.; Jimenez, J.L. Interpretation of organic components from Positive Matrix Factorization of aerosol mass spectrometric data. Atmos. Chem. Phys. 2009, 9, 2891–2918. [Google Scholar] [CrossRef] [Green Version]
  40. Sun, Y.L.; Zhang, Q.; Schwab, J.J.; Demerjian, K.L.; Chen, W.N.; Bae, M.S.; Hung, H.M.; Hogrefe, O.; Frank, B.; Rattigan, O.V.; et al. Characterization of the sources and processes of organic and inorganic aerosols in New York city with a high-resolution time-of-flight aerosol mass apectrometer. Atmos. Chem. Phys. 2011, 11, 1581–1602. [Google Scholar] [CrossRef]
  41. Wang, Y.; Bao, S.; Wang, S.; Hu, Y.; Shi, X.; Wang, J.; Zhao, B.; Jiang, J.; Zheng, M.; Wu, M.; et al. Local and regional contributions to fine particulate matter in Beijing during heavy haze episodes. Sci. Total Environ. 2017, 580, 283–296. [Google Scholar] [CrossRef] [PubMed]
  42. Tao, J.; Zhang, L.; Engling, G.; Zhang, R.; Yang, Y.; Cao, J.; Zhu, C.; Wang, Q.; Luo, L. Chemical composition of PM2.5 in an urban environment in Chengdu, China: Importance of springtime dust storms and biomass burning. Atmos. Res. 2013, 122, 270–283. [Google Scholar] [CrossRef]
  43. Wang, H.; Tian, M.; Chen, Y.; Shi, G.; Liu, Y.; Yang, F.; Zhang, L.; Deng, L.; Yu, J.; Peng, C.; et al. Seasonal characteristics, formation mechanisms and source origins of PM2.5 in two megacities in Sichuan Basin, China. Atmos. Chem. Phys. 2018, 18, 865–881. [Google Scholar] [CrossRef] [Green Version]
  44. Polissar, A.V.; Hopke, P.K.; Harris, J.M. Source Regions for Atmospheric Aerosol Measured at Barrow, Alaska. Environ. Sci. Technol. 2001, 35, 4214–4226. [Google Scholar] [CrossRef] [PubMed]
  45. Wang, Y.Q.; Zhang, X.Y.; Arimoto, R. The contribution from distant dust sources to the atmospheric particulate matter loadings at XiAn, China during spring. Sci. Total Environ. 2006, 368, 875–883. [Google Scholar] [CrossRef] [PubMed]
  46. Waked, A.; Favez, O.; Alleman, L.Y.; Piot, C.; Petit, J.E.; Delaunay, T.; Verlinden, E.; Golly, B.; Besombes, J.L.; Jaffrezo, J.L.; et al. Source apportionment of PM10 in a north-western Europe regional urban background site (Lens, France) using positive matrix factorization and including primary biogenic emissions. Atmos. Chem. Phys. 2014, 14, 3325–3346. [Google Scholar] [CrossRef] [Green Version]
  47. Petit, J.E.; Favez, O.; Albinet, A.; Canonaco, F. A user-friendly tool for comprehensive evaluation of the geographical origins of atmospheric pollution: Wind and trajectory analyses. Environ. Model. Softw. 2017, 88, 183–187. [Google Scholar] [CrossRef] [Green Version]
  48. Huang, W.; Saathoff, H.; Shen, X.; Ramisetty, R.; Leisner, T.; Mohr, C. Seasonal characteristics of organic aerosol chemical composition and volatility in Stuttgart, Germany. Atmos. Chem. Phys. 2019, 19, 11687–11700. [Google Scholar] [CrossRef] [Green Version]
  49. Dai, Q.; Schulze, B.C.; Bi, X.; Bui, A.A.T.; Guo, F.; Wallace, H.W.; Sanchez, N.P.; Flynn, J.H.; Lefer, B.L.; Feng, Y.; et al. Seasonal differences in formation processes of oxidized organic aerosol near Houston, TX. Atmos. Chem. Phys. 2019, 19, 9641–9661. [Google Scholar] [CrossRef] [Green Version]
  50. Liu, T.; Huang, D.D.; Li, Z.; Liu, Q.; Chan, M.; Chan, C.K. Comparison of secondary organic aerosol formation from toluene on initially wet and dry ammonium sulfate particles at moderate relative humidity. Atmos. Chem. Phys. 2018, 18, 5677–5689. [Google Scholar] [CrossRef]
  51. Alfarra, M.R.; Paulsen, D.; Gysel, M.; Garforth, A.A.; Dommen, J.; Prévôt, A.S.H.; Worsnop, D.R.; Baltensperger, U.; Coe, H. A mass spectrometric study of secondary organic aerosols formed from the photooxidation of anthropogenic and biogenic precursors in a reaction chamber. Atmos. Chem. Phys. 2006, 6, 5279–5293. [Google Scholar] [CrossRef] [Green Version]
  52. Zhao, J.; Qiu, Y.; Zhou, W.; Xu, W.; Wang, J.; Zhang, Y.; Li, L.; Xie, C.; Wang, Q.; Du, W.; et al. Organic Aerosol Processing During Winter Severe Haze Episodes in Beijing. J. Geophys. Res. Atmos. 2019, 124, 10248–10263. [Google Scholar] [CrossRef]
  53. Duplissy, J.; DeCarlo, P.F.; Dommen, J.; Alfarra, M.R.; Metzger, A.; Barmpadimos, I.; Prevot, A.S.H.; Weingartner, E.; Tritscher, T.; Gysel, M.; et al. Relating hygroscopicity and composition of organic aerosol particulate matter. Atmos. Chem. Phys. 2011, 11, 1155–1165. [Google Scholar] [CrossRef] [Green Version]
  54. Ng, N.L.; Canagaratna, M.R.; Zhang, Q.; Jimenez, J.L.; Tian, J.; Ulbrich, I.M.; Kroll, J.H.; Docherty, K.S.; Chhabra, P.S.; Bahreini, R.; et al. Organic aerosol components observed in Northern Hemispheric datasets from Aerosol Mass Spectrometry. Atmos. Chem. Phys. 2010, 10, 4625–4641. [Google Scholar] [CrossRef] [Green Version]
  55. Docherty, K.S.; Corse, E.W.; Jaoui, M.; Offenberg, J.H.; Kleindienst, T.E.; Krug, J.D.; Riedel, T.P.; Lewandowski, M. Trends in the oxidation and relative volatility of chamber-generated secondary organic aerosol. Aerosol Sci. Technol. 2018, 52, 992–1004. [Google Scholar] [CrossRef]
  56. Heald, C.L.; Kroll, J.H.; Jimenez, J.L.; Docherty, K.S.; DeCarlo, P.F.; Aiken, A.C.; Chen, Q.; Martin, S.T.; Farmer, D.K.; Artaxo, P. A simplified description of the evolution of organic aerosol composition in the atmosphere. Geophys. Res. Lett. 2010, 37, 1–5. [Google Scholar] [CrossRef] [Green Version]
  57. Kroll, J.H.; Donahue, N.M.; Jimenez, J.L.; Kessler, S.H.; Canagaratna, M.R.; Wilson, K.R.; Altieri, K.E.; Mazzoleni, L.R.; Wozniak, A.S.; Bluhm, H.; et al. Carbon oxidation state as a metric for describing the chemistry of atmospheric organic aerosol. Nat. Chem. 2011, 3, 133–139. [Google Scholar] [CrossRef] [Green Version]
  58. Mandariya, A.K.; Gupta, T.; Tripathi, S.N. Effect of aqueous-phase processing on the formation and evolution of organic aerosol (OA) under different stages of fog life cycles. Atmos. Environ. 2019, 206, 60–71. [Google Scholar] [CrossRef]
  59. Chen, C.; Li, L.; Tang, P.; Cocker, D.R. SOA formation from photooxidation of naphthalene and methylnaphthalenes with m-xylene and surrogate mixtures. Atmos. Environ. 2018, 180, 256–264. [Google Scholar] [CrossRef] [Green Version]
  60. Li, K.; Chen, L.; White, S.J.; Zheng, X.; Lv, B.; Lin, C.; Bao, Z.; Wu, X.; Gao, X.; Ying, F.; et al. Chemical characteristics and sources of PM1 during the 2016 summer in Hangzhou. Environ. Pollut. 2018, 232, 42–54. [Google Scholar] [CrossRef]
  61. Sun, Y.; Du, W.; Fu, P.; Wang, Q.; Li, J.; Ge, X.; Zhang, Q.; Zhu, C.; Ren, L.; Xu, W.; et al. Primary and secondary aerosols in Beijing in winter: Sources, variations andprocesses. Atmos. Chem. Phys. 2016, 16, 8309–8329. [Google Scholar] [CrossRef] [Green Version]
  62. Ng, N.L.; Canagaratna, M.R.; Jimenez, J.L.; Zhang, Q.; Ulbrich, I.M.; Worsnop, D.R. Real-Time Methods for Estimating Organic Component Mass Concentrations from Aerosol Mass Spectrometer Data. Environ. Sci. Technol. 2011, 45, 910–916. [Google Scholar] [CrossRef]
  63. Xu, W.Q.; Sun, Y.L.; Chen, C.; Du, W.; Han, T.T.; Wang, Q.Q.; Fu, P.Q.; Wang, Z.F.; Zhao, X.J.; Zhou, L.B.; et al. Aerosol composition, oxidation properties, and sources in Beijing: Results from the 2014 Asia-Pacific Economic Cooperation summit study. Atmos. Chem. Phys. 2015, 15, 13681–13698. [Google Scholar] [CrossRef] [Green Version]
  64. Canagaratna, M.R.; Jayne, J.T.; Ghertner, D.A.; Herndon, S.; Shi, Q.; Jimenez, J.L.; Silva, P.J.; Williams, P.; Lanni, T.; Drewnick, F.; et al. Chase Studies of Particulate Emissions from in-use New York City Vehicles. Aerosol Sci. Technol. 2004, 38, 555–573. [Google Scholar] [CrossRef]
  65. Steinbacher, M.; Zellweger, C.; Schwarzenbach, B.; Bugmann, S.; Buchmann, B.; Ordóñez, C.; Prevot, A.S.H.; Hueglin, C. Nitrogen oxide measurements at rural sites in Switzerland: Bias of conventional measurement techniques. J. Geophys. Res. 2007, 112, 1–13. [Google Scholar] [CrossRef] [Green Version]
  66. Lanz, V.A.; Alfarra, M.R.; Baltensperger, U.; Buchmann, B.; Hueglin, C.; Prévôt, A.S.H. Source apportionment of submicron organic aerosols at an urban site by factor analytical modelling of aerosol mass spectra. Atmos. Chem. Phys. 2007, 7, 1503–1522. [Google Scholar] [CrossRef] [Green Version]
  67. Wang, J.; Ge, X.; Chen, Y.; Shen, Y.; Zhang, Q.; Sun, Y.; Xu, J.; Ge, S.; Yu, H.; Chen, M. Highly time-resolved urban aerosol characteristics during springtime in Yangtze River Delta, China: Insights from soot particle aerosol mass spectrometry. Atmos. Chem. Phys. 2016, 16, 9109–9127. [Google Scholar] [CrossRef] [Green Version]
  68. Huang, X.F.; He, L.Y.; Hu, M.; Canagaratna, M.R.; Sun, Y.; Zhang, Q.; Zhu, T.; Xue, L.; Zeng, L.W.; Liu, X.G.; et al. Highly time-resolved chemical characterization of atmospheric submicron particles during 2008 Beijing Olympic Games using an Aerodyne High-Resolution Aerosol Mass Spectrometer. Atmos. Chem. Phys. 2010, 10, 8933–8945. [Google Scholar] [CrossRef] [Green Version]
  69. Xu, W.; Xie, C.; Karnezi, E.; Zhang, Q.; Wang, J.; Pandis, S.N.; Ge, X.; Zhang, J.; An, J.; Wang, Q.; et al. Summertime aerosol volatility measurements in Beijing, China. Atmos. Chem. Phys. 2019, 19, 10205–10216. [Google Scholar] [CrossRef] [Green Version]
  70. Xu, W.; Sun, Y.; Wang, Q.; Zhao, J.; Wang, J.; Ge, X.; Xie, C.; Zhou, W.; Du, W.; Li, J.; et al. Changes in Aerosol Chemistry From 2014 to 2016 in Winter in Beijing: Insights from High-Resolution Aerosol Mass Spectrometry. J. Geophys. Res. Atmos. 2019, 124, 1132–1147. [Google Scholar] [CrossRef]
  71. Zhao, J.; Du, W.; Zhang, Y.; Wang, Q.; Chen, C.; Xu, W.; Han, T.; Wang, Y.; Fu, P.; Wang, Z.; et al. Insights into aerosol chemistry during the 2015 China Victory Day parade: Results from simultaneous measurements at ground level and 260 m in Beijing. Atmos. Chem. Phys. 2017, 17, 3215–3232. [Google Scholar] [CrossRef]
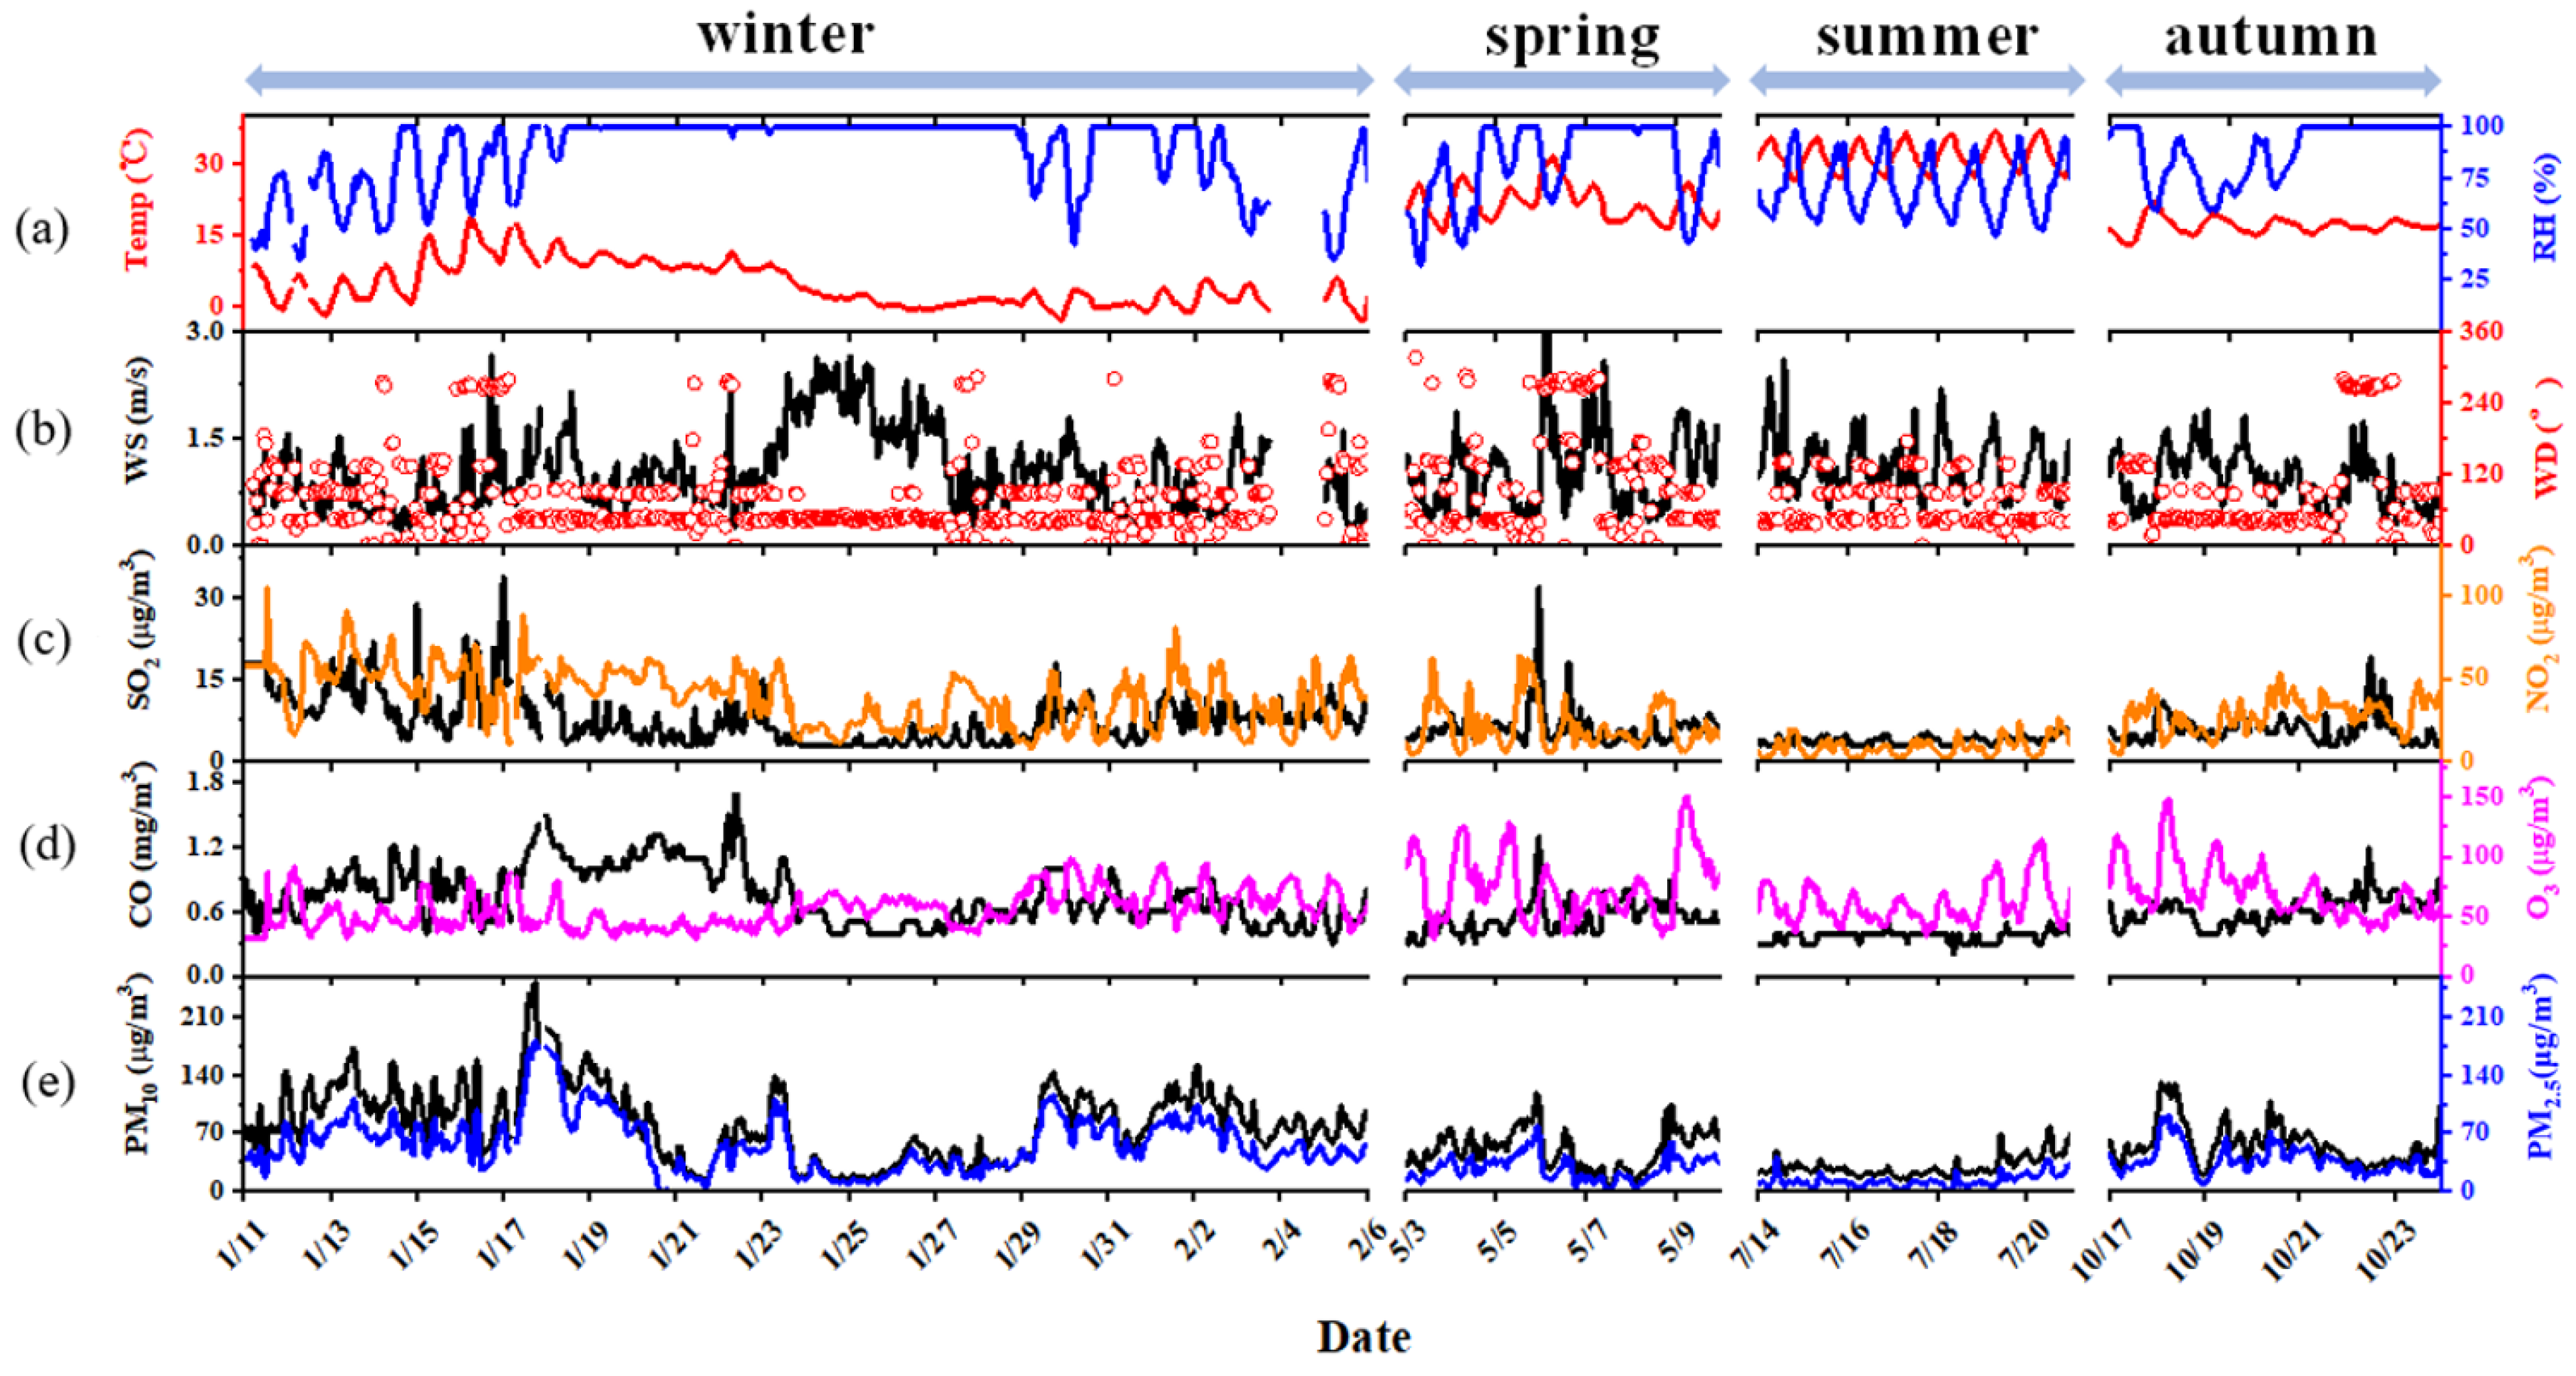
Figure 1. Time series of (a) relative humidity (RH) and temperature; (b) wind direction and wind speed; (c,d) mass concentrations of CO, NO2, SO2, and O3 (hourly data); (e) PM10 and PM2.5 mass concentration during the sampling periods of spring, summer, autumn, and winter.
Atmosphere 13 01968 g001
Figure 2. (a) Concentrations and (b) relative contribution of NO 3 , NH 4 + , SO 4 2 and carbonaceous species during the sampling periods of different seasons. The circle and triangle dots represent the lower and upper bounds of WSOM concentrations.
Atmosphere 13 01968 g002
Figure 3. Triangle plot of f44 vs. f43 during the sampling periods of different seasons. The solid rectangles in green, red, orange, and black represent the data from the spring, summer, autumn, and winter of this study. Other symbols represent the data of different types of organic aerosol in the literature and the detailed information is summarized in Tables S2 and S3 of the Supplementary Materials. The fog-OA data were from the field observation results in the San Joaquin Valley, California. The dashed guidelines were derived from the data reported by [54]. The LO-OOA and MO-OOA in some studies were treated as SV-OOA and LV-OOA, as suggested by [32].
Atmosphere 13 01968 g003
Figure 4. Seasonal variations of average (a) H:C and (b) O:C.
Atmosphere 13 01968 g004
Figure 5. The Van Krevelen- OS ¯ c diagram. The meanings of the symbols are the same as those in Figure 3, and the detailed information is also summarized in Tables S2 and S3 in the Supplementary Materials. The dashed lines represent the average carbon oxidation state [57] and the slopes represent the different functionalization processes of organic species [56].
Atmosphere 13 01968 g005
Figure 6. The mass spectra of HOA, CCOA, LO-OOA, and MO-OOA, as resolved by PMF. The time series of the four factors and the corresponding tracer ions are shown in the right panel. The correlation coefficients (R) between OA factors and tracers are also shown.
Atmosphere 13 01968 g006
Figure 7. The relative contribution of LO-OOA, MO-OOA, CCOA, and HOA to WSOC during the sampling periods in different seasons.
Atmosphere 13 01968 g007
Figure 8. The simulation results of the cluster-mean trajectories during the sampling periods. The dashed lines divide the areas through which the air parcels passed.
Atmosphere 13 01968 g008
Figure 9. The simulation results of the WPSCF during the sampling periods of (a) spring, (b) summer, (c) autumn, and (d) winter.
Atmosphere 13 01968 g009
Publisher’s Note: MDPI stays neutral with regard to jurisdictional claims in published maps and institutional affiliations.