Article

Spatial-Temporal Variations of Extreme Precipitation Characteristics and Its Correlation with El Niño-Southern Oscillation during 1960–2019 in Hubei Province, China

1
China Communications Construction Company Second Harbour Consultants Co., Ltd., Wuhan 430071, China
2
State Key Laboratory of Water Resources and Hydropower Engineering Scinece, Wuhan University, Wuhan 430000, China
*
Authors to whom correspondence should be addressed.
Atmosphere 2022, 13(11), 1922; https://doi.org/10.3390/atmos13111922
Submission received: 4 September 2022 / Revised: 5 November 2022 / Accepted: 8 November 2022 / Published: 18 November 2022
(This article belongs to the Section Meteorology)

Abstract

:
Extreme precipitation could result in many disasters, such as floods, drought, and soil erosion, further bringing severe economic loss. Based on the daily precipitation records during 1960–2019 of 26 stations obtained from the National Meteorological Science Data Center of China, 10 extreme precipitation indices (EPIs: annual total precipitation (PRCPTOT), max-1-day precipitation amount (RX1day), max-5-day precipitation amount (RX5day), number of heavy rain days (R10), number of very heavy rain days (R10), simple daily intensity index (SDII), consecutive dry days (CDD), continued wet days (CWD), very wet days (R95p) and extremely wet days (R99p)) were chosen and used to analyze the spatial-temporal variation of extreme precipitation within Hubei province, China, which is an important industrial and agricultural base in China. Finally, the correlation between El Niño-Southern Oscillation and EPIs was analyzed by cross-wavelet analysis. Results showed that the annual EPIs varied obviously during 1960–2019, and CWD decreased significantly (p < 0.05). The chosen EPIs were higher in eastern and southwestern Hubei compared to other regions, and RX1day, RX5day, R95p, and R99p were increased in most regions. The spatial-temporal variations of spring and summer EPIs were more obvious than those on an annual scale. In summer, all EPIs except CDD should increase in the near future. More attention should be paid to Wuhan, Enshi, and Macheng, where the RX1day, RX5day, R95p, and R99p will increase in these regions. Finally, the RX1day and R10 were positively correlated with MEI (p < 0.05), while the RX5day, CDD, CWD, and R99p were negatively correlated with MEI (p < 0.05). The extreme precipitation events within Hubei were affected by the El Niño-Southern Oscillation. The results could provide a possible driving factor for precipitation prediction and natural hazard prevention within Hubei province, China.

1. Introduction

In the context of global warming, evaporation has increased in most regions [1], and water vapor circulation speeds up in different regions with different change trends in the world [2]. According to the existing precipitation observation data, the balance of precipitation distribution in many regions has been affected [3]. Abnormal extreme precipitation events that occurred in recent years have led to rare flood disasters in the world such as in China [4], Japan [5], America [6], and India [7]. Existing study indicates that the intensity and frequency of extreme precipitation events in the mid-latitudes may further increase in the future [8]. In city areas, extreme events could result in problems such as urban waterlogging [9] and economic loss [10], while in rural areas, extreme precipitation would affect normal farming activity, reducing crop yields [11] and resulting in severe soil erosion [12].
Under the background of global climate change, the variations of extreme precipitation have been investigated worldwide recently [13,14,15]. In recent decades, extreme precipitation characteristics have changed around the world. On a country scale, Fu et al. [16] analyzed the temporal variation of extreme precipitation events within China based on the site-measured rainfall data during 1961–2009, and results showed that the selected extreme precipitation indices had changed differently in different regions within China; Dey et al. [13] analyzed the extreme precipitation variation within Australia, and found that extreme precipitation events could appear in Australia in any time of a year, and extreme precipitation more likely occurred in southern Australia during summer; Vu et al. [17] analyzed the variation of extreme precipitation frequency based on unusual extreme precipitation events over more than a thousand years in the past within the United States, and results show that the return periods of extreme precipitation events have been significantly reduced. On a basin scale, Srivastava et al. [7] analyzed the long-term trend of extreme precipitation events during 1901–2016 within the Kosi River Basin in India, and results revealed that the changing trend of some extreme precipitation indices varied within the basin; Zhao et al. [18] analyzed the changing trend of extreme precipitation during 1961–2016 within the Yellow River Basin in China, and results showed that most extreme precipitation was decreased and that the average precipitation indices and extreme precipitation indices are significantly correlated both seasonally and annually; Yin et al. [19] has analyzed the variations of extreme precipitation during 1960–2014 within the Huai River Basin in China, and results showed that extreme precipitation events will increase and were closely correlated with the flood/drought disasters in the HRB. These results all provide theoretical suggestions for further prevention of the loss brought about by extreme precipitation events for local organizations.
Besides the simple analysis of the changing trend of extreme precipitation, some scholars also have investigated the causes of these changes. Many studies have pointed out that the anomalies in large-scale climate circulations were the main cause of the changes in extreme precipitation all over the world [20,21,22,23]. Grimm et al. [20] found that the El Niño and La Niña episodes affected the frequency of extreme precipitation events significantly in several regions of South America. In the study conducted by King et al. [24], a nonlinear relationship was shown to exist between extreme precipitation and the El Niño–Southern Oscillation in Australia, and that the magnitude of La Niña events affected extreme precipitation intensity. Li et al. [25] tried to determine the sources of the extreme precipitation in the lower reaches of the Yangtze River during May 2016, and results showed that the strong El Niño of 2015–2016 may have been the main attribution for extreme precipitation event in 2016. In the existing literature, the El Niño-Southern Oscillation has been identified as the main driving factor for the changes in extreme precipitation in most regions worldwide.
Hubei province is one of the important industrial and agricultural bases in China. The annual precipitation in the province has obvious seasonal variation, and the summer precipitation accounts for about 40% of the annual precipitation [26]. In recent years, extreme precipitation events occurred continually in Hubei province. In June 2020, an extraordinary rainstorm happened in Yichang city [27] and resulted in severe economic loss; subsequent, in August 2021, an extraordinary rainstorm occurred in Suizhou city, Xiangyang city, and Xiaogan city, et al. [28]. Some towns and villages were flooded during these extraordinary rainstorm events, and these extreme precipitation events mainly occurred in spring and summer. Hence, it is important to investigate the spatial-temporal variations of extreme precipitation and its correlation with large-scale atmospheric circulation for a better understanding of extreme precipitation events within these regions. However, no such study has been conducted in the Hubei province, China.
The purposes of this paper were: (1) to analyze the spatial-temporal variations of the annual extreme precipitation indices within Hubei province during 1960–2019; (2) to analyze the spatial-temporal variations of the extreme precipitation indices in spring and summer within Hubei province during 1960–2019; and (3) to investigate the relationship between the extreme precipitation indices and El Niño-Southern Oscillation within the Hubei province.

2. Study Area

Hubei province is located in middle China, between 29°02′–33°07′ N, 108°21′–116°08′ E, with an area of ~186,000 km2 (Figure 1). The elevation within Hubei province is ranged from −96 to 3052 m and is dominated by mountainous topography in the western regions while the plain is distributed widely in the middle and eastern regions. Within the whole Hubei province, the mountains, hills, and plain lakes covered about 56%, 24%, and 20%, respectively. Hubei province is located in the subtropical climate zone, except for the alpine areas belonging to the alpine climate, most areas belong to the subtropical monsoon humid climate. The average precipitation in the region is 800–1600 mm, decreasing from south to north with an obvious seasonal variation.
Hubei Province is rich in water resources. Except for the mainstream Yangtze river and the Han river, there are 4228 rivers with a length of more than 5 km and a total length of 59,200 km. Besides, there are 755 lakes with a surface area of ~2707 km2. According to the statistics of the Water Resources Bulletin of Hubei province in 2020, the water resources amount was ~175.5 billion m3. Since the South to North Water Diversion project was launched in 2014, the middle route of the project has transported an average of 5.6 billion m3 of water to northern China every year. In addition, Hubei province is one of the important industrial and agricultural bases in China. The extreme precipitation events that happened in recent years have brought severe economic loss to the residents. It is important to investigate the spatial-temporal variations of extreme precipitation and its correlation with large-scale atmospheric circulation for better extreme precipitation prediction, further benefiting water resource management and natural hazard prevention.

3. Data and Methods

3.1. Data Sources and Processing

The main relevant data are daily precipitation from 1960–2019 within the Hubei province, the Multivariate El Niño/Southern Oscillation (ENSO) index (MEI) index series from 1960–2019, and the El Niño and La Niña Years and Intensities data. The daily precipitation is obtained from the National Meteorological Science Data Center (https://data.cma.cn/, accessed on 5 March 2020), and 26 stations (Table 1) within Hubei province are used for this study. The MEI index is a multivariate ENSO index developed by Wolter and Timlin to express the phase and intensity of the ENSO phenomenon [29]. The MEI is calculated from six key variables characterizing the tropical Pacific environment (sea surface temperature, surface air temperature, sea-level pressure, and total cloudiness fraction). This study used the MEI series during 1979–2019 to describe the El Niño-Southern Oscillation characteristic, and it was obtained from the website (https://psl.noaa.gov/enso/mei/, accessed on 2 June 2021). Finally, the El Niño and La Niña years and intensities data were obtained from the Golden Gate Weather Services (https://ggweather.com/enso/oni.htm, accessed on 1 August 2022). The strong and very strong El Niño and La Niña Years were taken into consideration for the analysis of correlations between El Niño-Southern Oscillation and EPIs in the discussion section.

3.2. Extreme Precipitation Index

In total, 10 extreme precipitation indices (EPI) suggested by the Expert Team on Climate Change Detection and Indices (ETCDI) [30] were adopted in this study to represent the extreme precipitation characteristics (Table 2). According to the definitions of EPI, they can be divided into four categories: persistence indices, adiabatic indices, relative indices, and intensity indices. The persistence indices were represented by consecutive dry days (CDD) and continued wet days (CWD). The adiabatic indices were represented by the number of heavy rain days (R10), the number of very heavy rain days (R20), and annual total precipitation (PRCPTOT). The relative indices were mainly represented by very wet days (R95p) and extremely wet days (R99p). The intensity indices were mainly represented by max-1-day precipitation amount (RX1day), max-5-day precipitation amount (RX5day), and simple daily intensity index (SDII). These EPIs have been widely used in previous research [31,32,33,34] and can represent extreme precipitation events properly. In this study, these 10 EPIs were calculated on the annual and seasonal scale for each station; then, the station values were interpolated into grid values with a spatial resolution of 1 km using inverse distance weighted (IDW) methods [12]. The grid values within the Hubei province were averaged to obtain the average value of EPIs of Hubei province, and finally, the average of EPIs series for the total Hubei province was used to analyze the extreme precipitation characteristic within this region. For spatial analysis, the average value was calculated for each grid with a spatial resolution of 1 km to obtain the spatial distribution of each EPI on annual, spring, and summer scales.

3.3. Analysis Methods

In this study, the linear regression analysis [35] was adopted to analyze the historical change trend of these EPIs, and the F-test [36] was used to test the significance of these trends for each EPI. These methods have been widely used and achieved good performance in previous studies [12,37,38]. In this study, the EPIs series calculated based on the daily precipitation records during 1961–2019 of the precipitation stations within the Hubei province was used as the dependent variable and the year was used as the independent variable to exam the trend of EPIs by the linear regression analysis and F-test. The Moving T test [39] was used to discuss the abrupt change point for each EPI during 1960–2019, which was widely used for detecting trends in the time series [40,41,42]. The Hurst exponent index (H) was calculated with the rescaled range analysis (R/S) method to analyze the future trends for each EPI in each station within Hubei province, which was applied maturely in previous studies [43,44] and the details of this method can be referred to in [45]. The value of H ranged from 0 to 1, which was widely used to reveal the strength of the (anti) persistent trend of the historical trend for series. In general, when the value of H was closer to 0, the trend in the future was opposite to that during history; when the value of H was closer to 1, the trend in the future was the same as that in the historical data; when the value of H was closer to 0.5, the future randomness of the series was large. The cross-wavelet analysis [29] was adopted to analyze the correlation between the EPIs and El Niño-Southern Oscillation, which has been widely used to reveal the historical correlation between different factors in meteorological fields [46,47]. The detailed basic description of this method can be referred to in [48]. In this study, the regional average EPIs series and MEI series were used to conduct the cross-wavelet analysis to reveal the relationship between the EPIs and ENSO.

4. Results

4.1. Spatial-Temporal Variations of EPIs on the Annual Scale

4.1.1. Temporal Variations

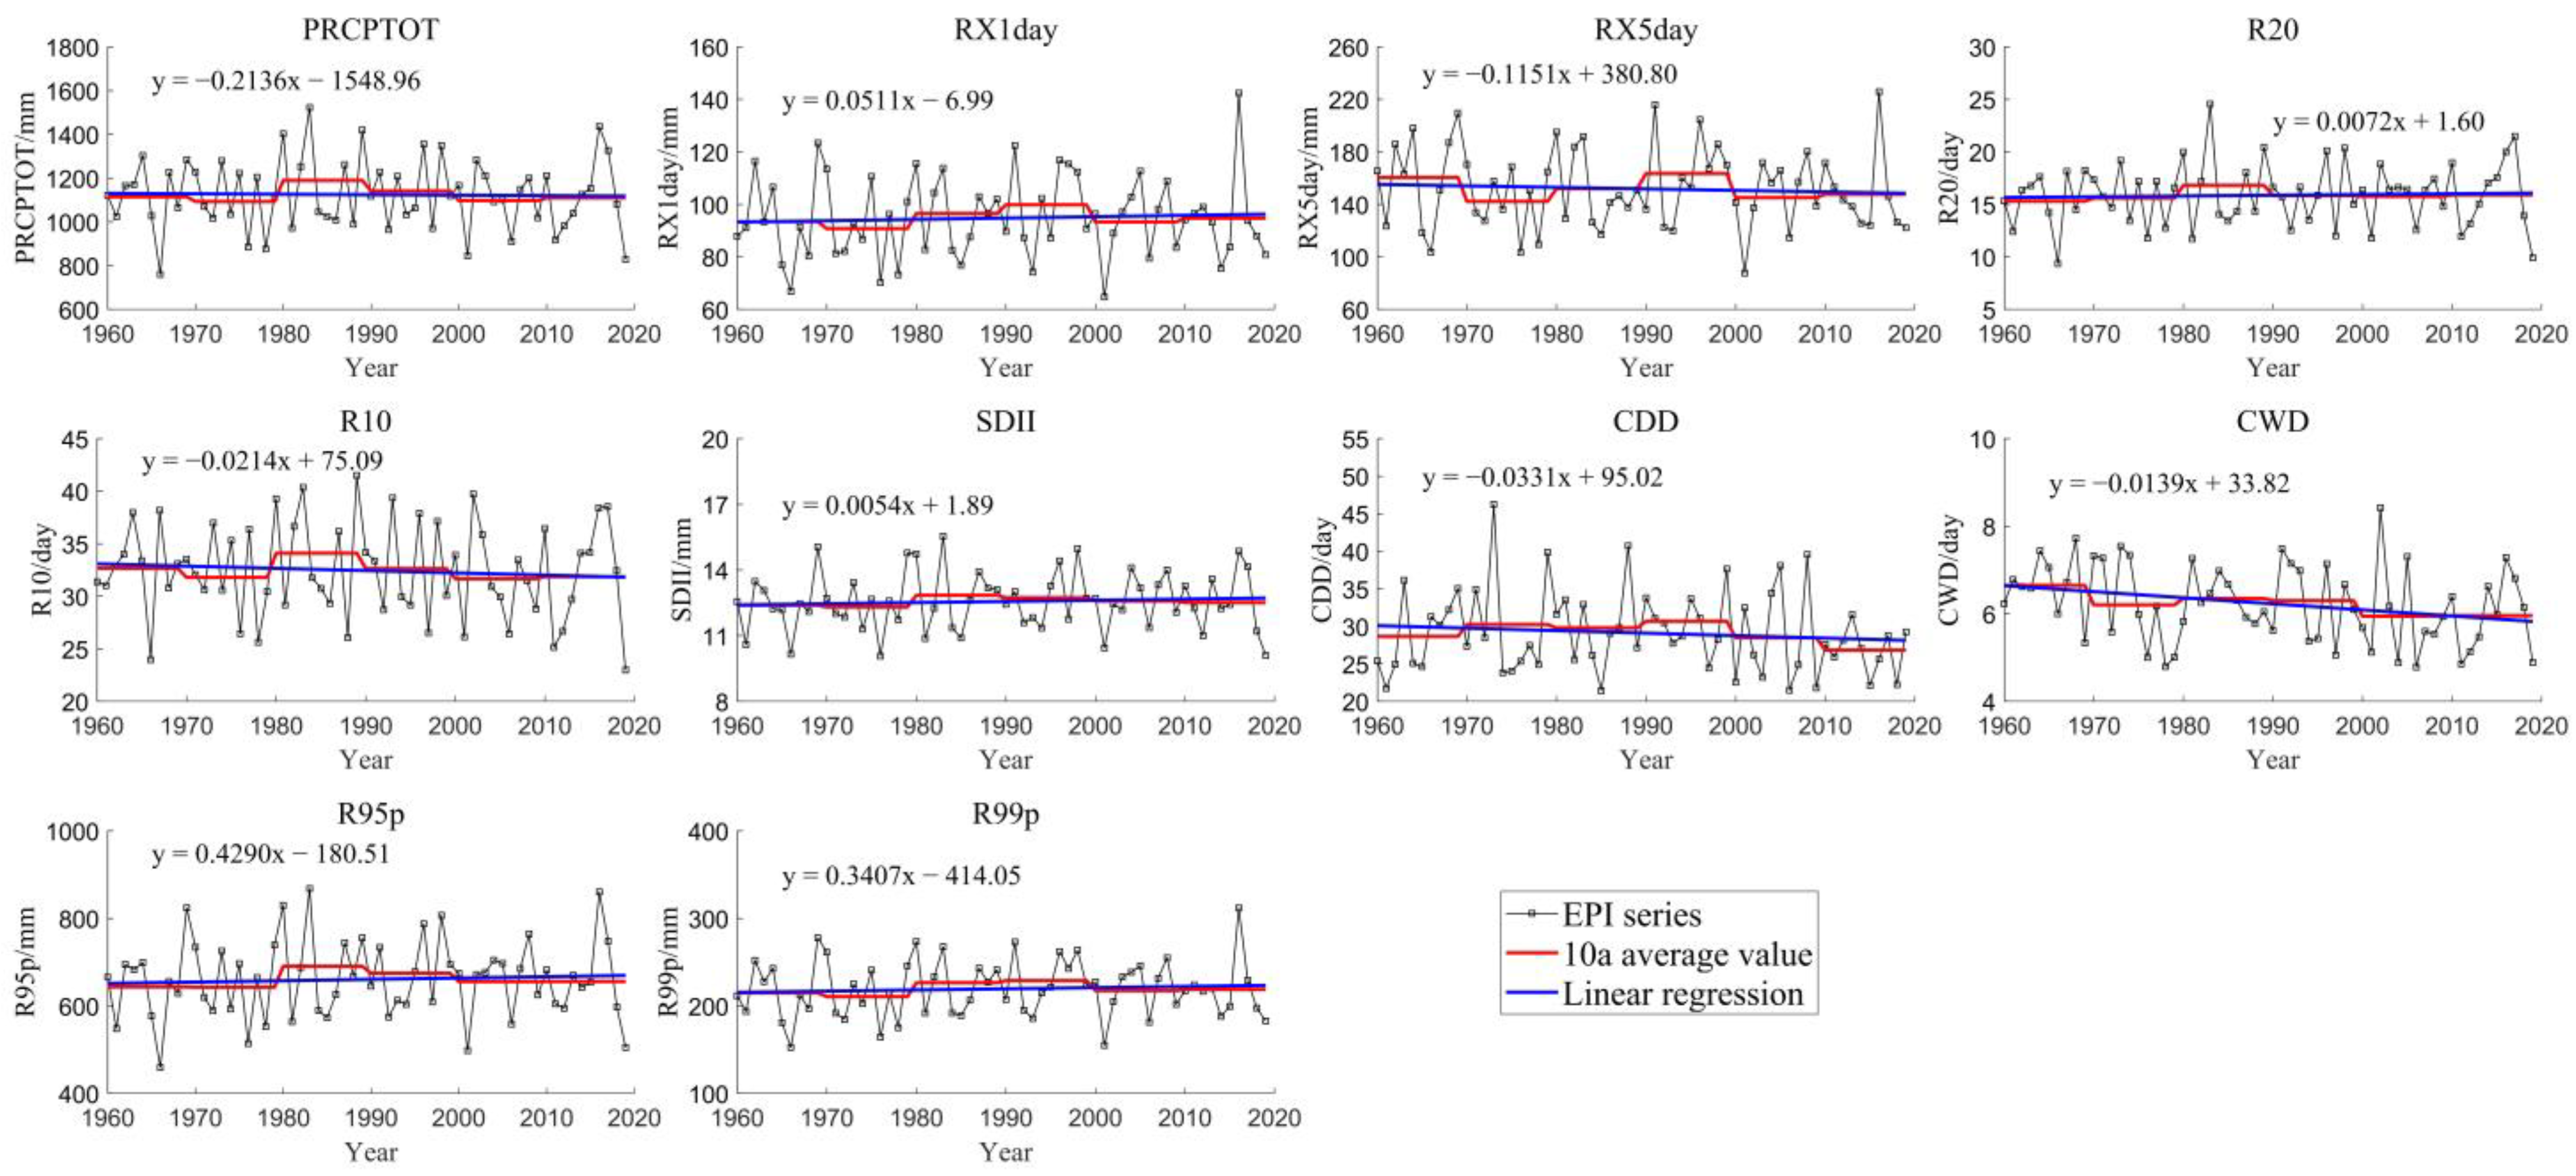
As shown in Figure 2 and Table 3, the average value of PRCPTOT, RX1day, RX5day, SDII, R95p, and R99p is 1124.08, 95.75, 152.83, 12.56, 660.36, and 219.43 mm, respectively; the average value of R10, R20, CDD, and CWD is 32.45, 15.86, 29.11, and 6.23 day, respectively. During 1960–2019, the highest value of PRCPTOT, RX1day, RX5day, R95p, and R99p is 1522.55, 142.35, 225.74, 867.85, and 311.88 mm, respectively; the highest value of R10, R20, CDD, and CWD is 41.49, 24.56, 46.25, and 8.42 day, respectively.
During 1960–2019, the RX1day, SDII, R95p, and R99p increased with a trend of 0.0511, 0.0054, 0.3065, and 0.1344 mm per year, respectively; the PRCPTOT and RX5day decreased with a trend of 0.2136 and 0.1151 mm per year, respectively; the R20 was increased with a trend of 0.00722 days per year; while the R10, CDD, and CWD were decreased with a trend of 0.0214, 0.0331, and 0.0139 days per year, respectively. The CWD decreased significantly (p < 0.05) during 1960–2019, and it would decrease in the recent future. Besides, in the recent future, the PRCPTOT, RX5day, R10, R95p, and R99p would increase, while the RX1day, R20, SDII, and CDD would decrease. The decade average values of RX1day, RX5day, and R10 were obviously changed between near decades, while other EPIs showed no trend similar to this.
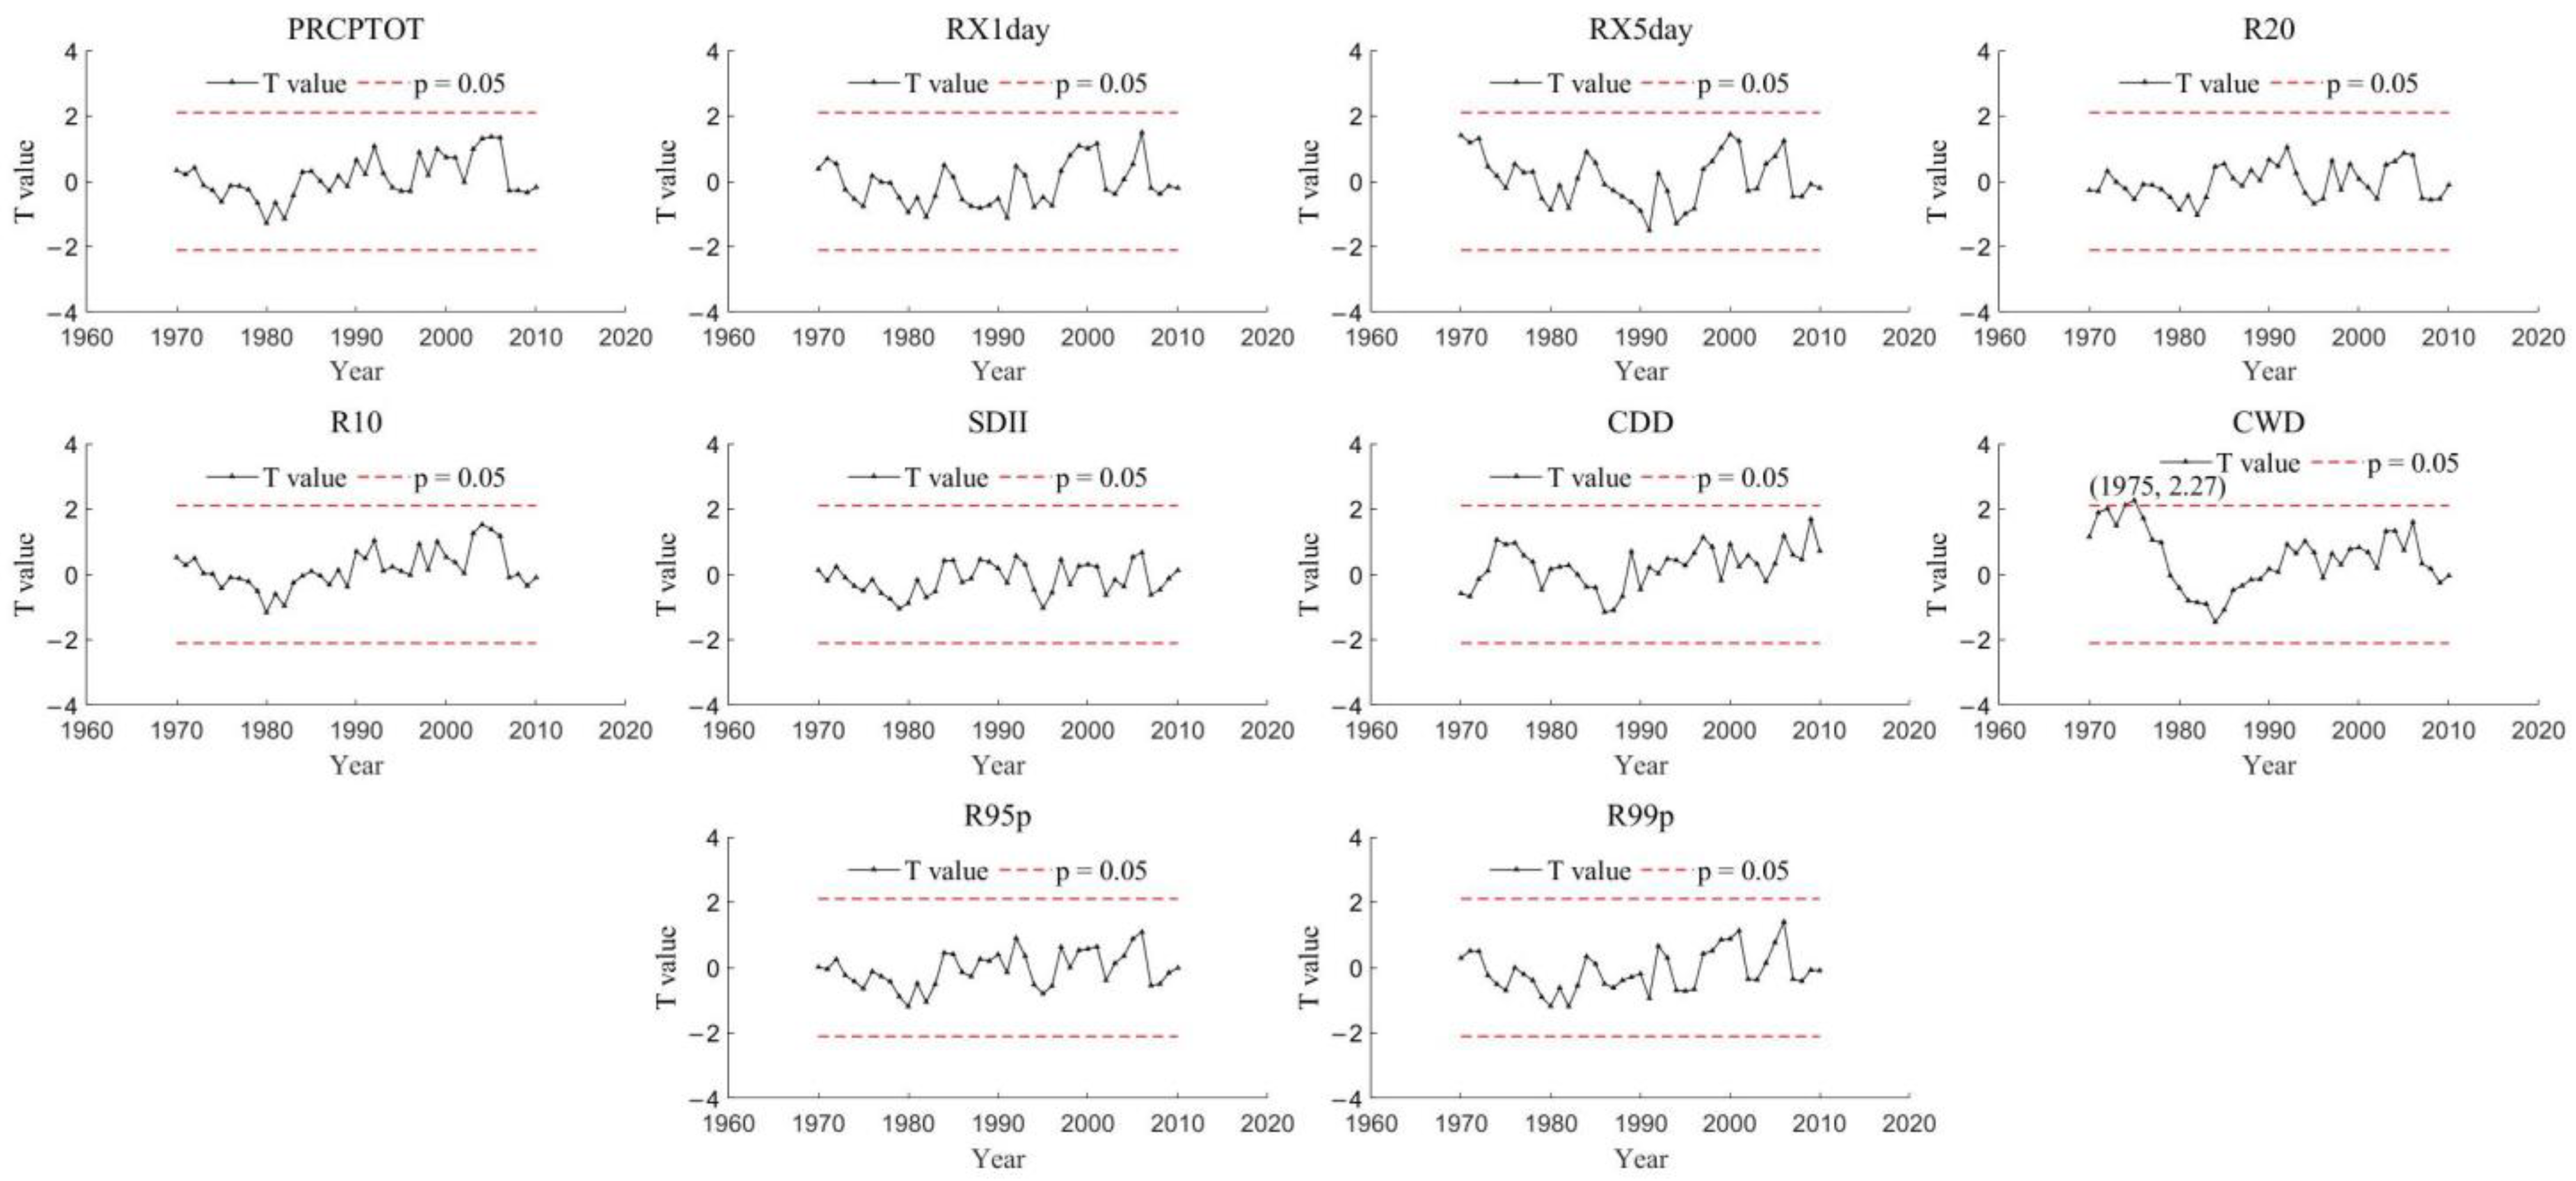
As shown in Figure 3, among these 10 EPIs, only the CWD has a significant abrupt change point in 1975, with a t value of 2.27. Other EPIs had no significant change point during 1960–2019.

4.1.2. Spatial Variations

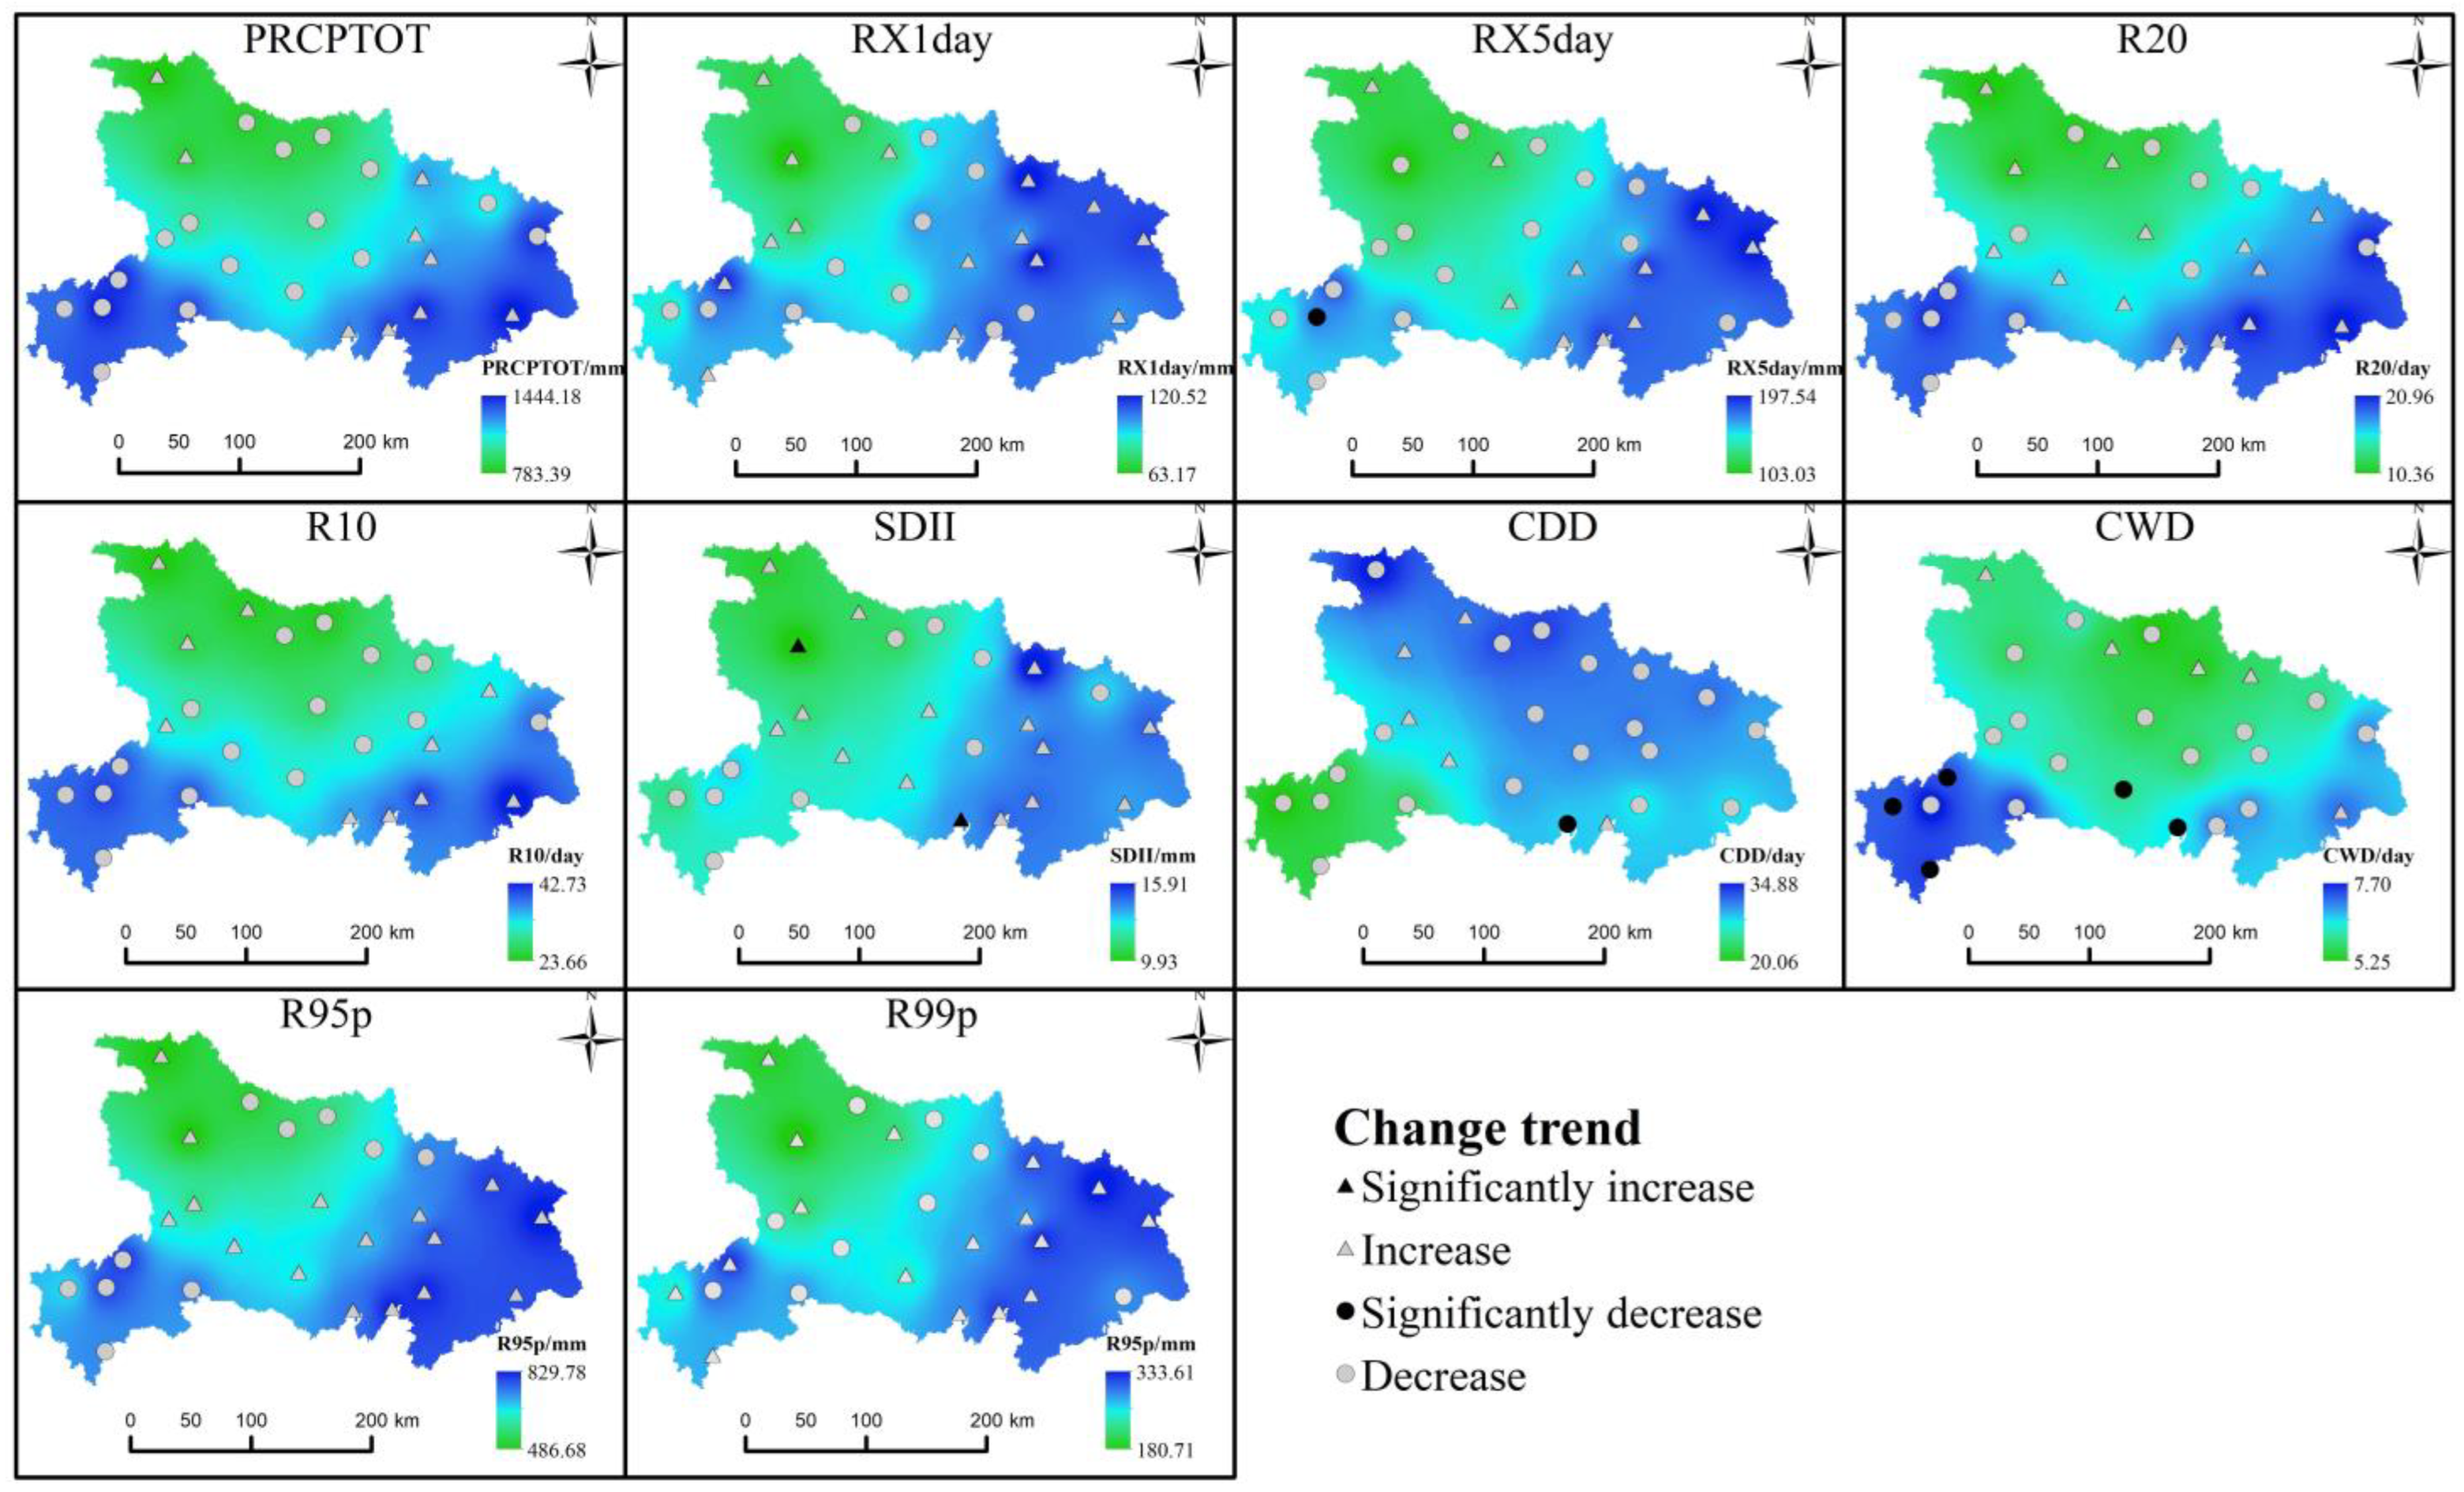
As shown in Figure 4, there were obvious differences in EPIs in different regions of Hubei. The annual average value of PRCPTOT, RX1day, RX5day, SDII, R95p, and R99p varied 783.39–1444.18, 63.17–120.52, 103.03–197.54, 9.93–15.91, 486.68–829.78, and 180.71–333.61 mm, respectively. The annual average value of R10, R20, CDD, and CWD varied from 23.66–42.73, 10.36–20.96, 20.06–34.88, and 5.25–7.7 days, respectively.
The variations of PRCPTOT, RX1day, RX5day, SDII, R95p, and R99p are similar, which are higher in the eastern and southwestern Hubei, and lower in the middle and northern Hubei. Especially, Wuhan, Macheng, Yingshan, and Jianshi stations with the highest PRCPTOT, RX1day, RX5day, R95p, and R99p simultaneously. This indicated that these regions are at greater risk of extreme rainfall events, and more attention should be paid to better disaster prevention. The variations of CDD and CWD are almost opposite within Hubei, the CDD was obviously lower in southwestern Hubei compared to other regions, while the CWD was much higher in southwestern Hubei compared to other regions. This may be caused by the difference in terrain, the mountain was dominated in the southwestern Hubei, while the plain was dominated in the middle and eastern Hubei.
As to the extreme event, the highest PRCPTOT occurred at Yingshan, Jianshi, and Yangxin, in 1983 (2182.1 mm), 1983 (2131.5 mm), and 1999 (2128.3 mm), respectively; the highest RX1day occurred at Yangxin, Xunxi, and Dawu, in 1994 (538.7 mm), 1997 (340.9 mm), and 2016 (333.6 mm), respectively; the highest RX5day was occurred at Yangxin, Jiayu, and Honghu, in 1994 (585.1 mm), 1964 (560.8 mm), and 1996 (550.6 mm), respectively; the highest R95p occurred at Macheng, Dawu, and Yangxin, in 2016 (1364.2 mm), 2016 (1283.5 mm), and 1999 (1281.2 mm), respectively; the highest R99p occurred at Yangxin, Mcheng, and Dawu, in 1994 (719.3 mm), 2016 (632.4 mm), and 1999 (625.6 mm), respectively; the highest CDD occurred at Macheng, Wuhan, and Xiaogan, in 1973 (80 days), 1973 (80 days), and 1973 (80 days), respectively.
The changing trends of each EPI are different at different stations. The number of stations that was increased in PRCPTOT, RX1day, RX5day, R10, R20, SDII, CDD, CWD, R95p, and R99p was 9, 15, 10, 14, 10, 16, 5, 5, 16, and 17, respectively; the number of stations that were decreased in PRCPTOT, RX1day, RX5day, R10, R20, SDII, CDD, CWD, R95p, and R99p was 17, 11, 16, 12, 16, 10, 21, 21, 10, and 9, respectively. In addition, during 1960–2019, RX5day decreased significantly at Enshi station, SDII increased significantly at Fangxian and Jianli stations, CDD decreased significantly at Jianli station, and CWD decreased significantly at Lichuan, Jianshi, Jingzhou, Laifeng, and Jianli stations. In addition, the Wuhan, Yingshan, and Macheng are increased in RX1day, RX5day, R95p, and R99p, with a much higher annual average value compared to other stations within Hubei province. These regions are more at risk of extreme precipitation disasters compared to other regions.

4.2. Spatial-Temporal Variations of EPIs in Spring and Summer

The precipitation, especially extreme precipitation events in Hubei mainly concentrated during spring and summer, hence, the EPIs characteristics in spring and summer within Hubei province were also discussed in this paper.

4.2.1. Temporal Variations

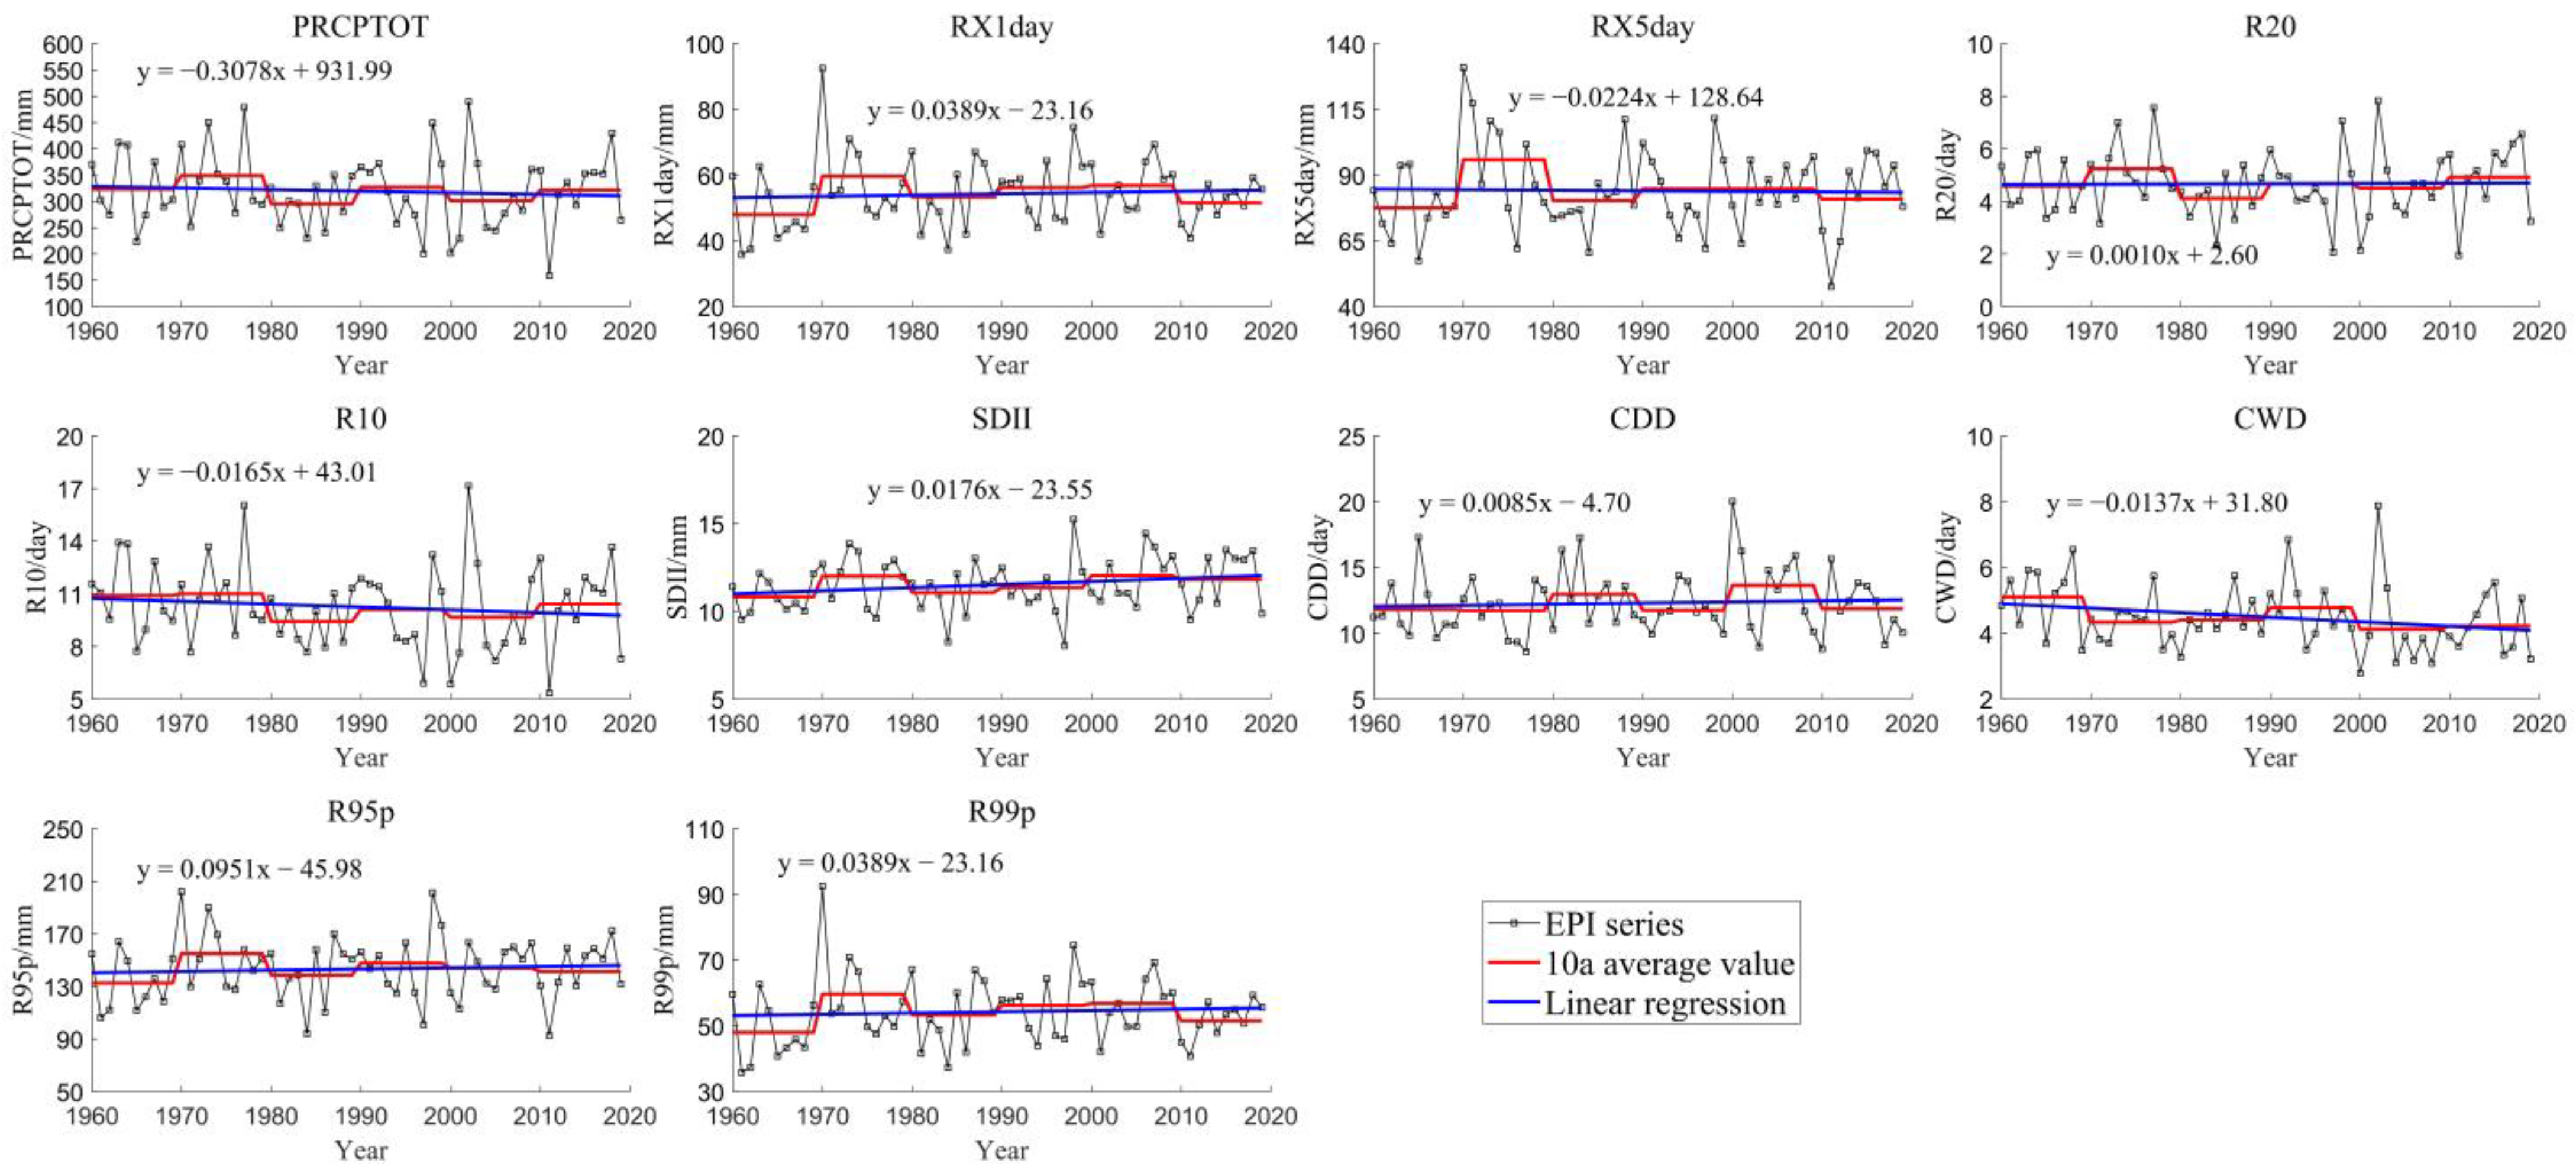
In spring, as shown in Figure 5 and Table 4, the overall trend of each EPIs in spring was similar to those on the annual scale during 1960–2019. The average value for PRCPTOT, RX1day, RX5day, SDII, R95p, and R99p in spring was 319.55, 54.27, 84.04, 11.52, 143.23, and 54.27 mm, respectively; the average value for R10, R20, CDD, and CWD was 10.26, 4.67, 12.29, and 4.49 day, respectively. During 1960–2019, R1day, R20, SDII, CDD, R95p, and R99p in spring increased, while PRCPTOT, RX5day, R10, and CWD in spring decreased. The changing trend of EPIs in spring is similar to those on an annual scale, but the future trends of EPIs in spring are quite different from those on an annual scale. In the near future, RX1day, R20, SDII, CDD, and R99p could be increased, while PRCPTOT, RX5day, R10, CWD, and R95p could be decreased. This may indicate that the extreme precipitation will be increased in spring within Hubei.
Compared the Figure 2 and Figure 5, the decade changes in spring EPIs are more obvious compared to annual EPIs during 1960–2019. Average spring RX1day in the 1970s was much higher than that in the 1960s and 1980s, average spring RX5day in the 1970s was much higher than that in other periods, and spring CWD kept decreasing from the 1960s to the 2010s. During 1990–2019, changes in spring PRCPTOT, RX5day, R20, SDII, and R95p were weak, and spring RX1day and R99p decreased in the 2010s compared to that during 1990–2010. Especially, the decade variations of Average spring CDD were obviously shocking during 1980–2019. This may indicate that the 10a average spring CDD showed a cycle of “down-up-down-up” trend during this period, and in the next decade (the 2020s) the CDD may be lower than that during the 2010s.
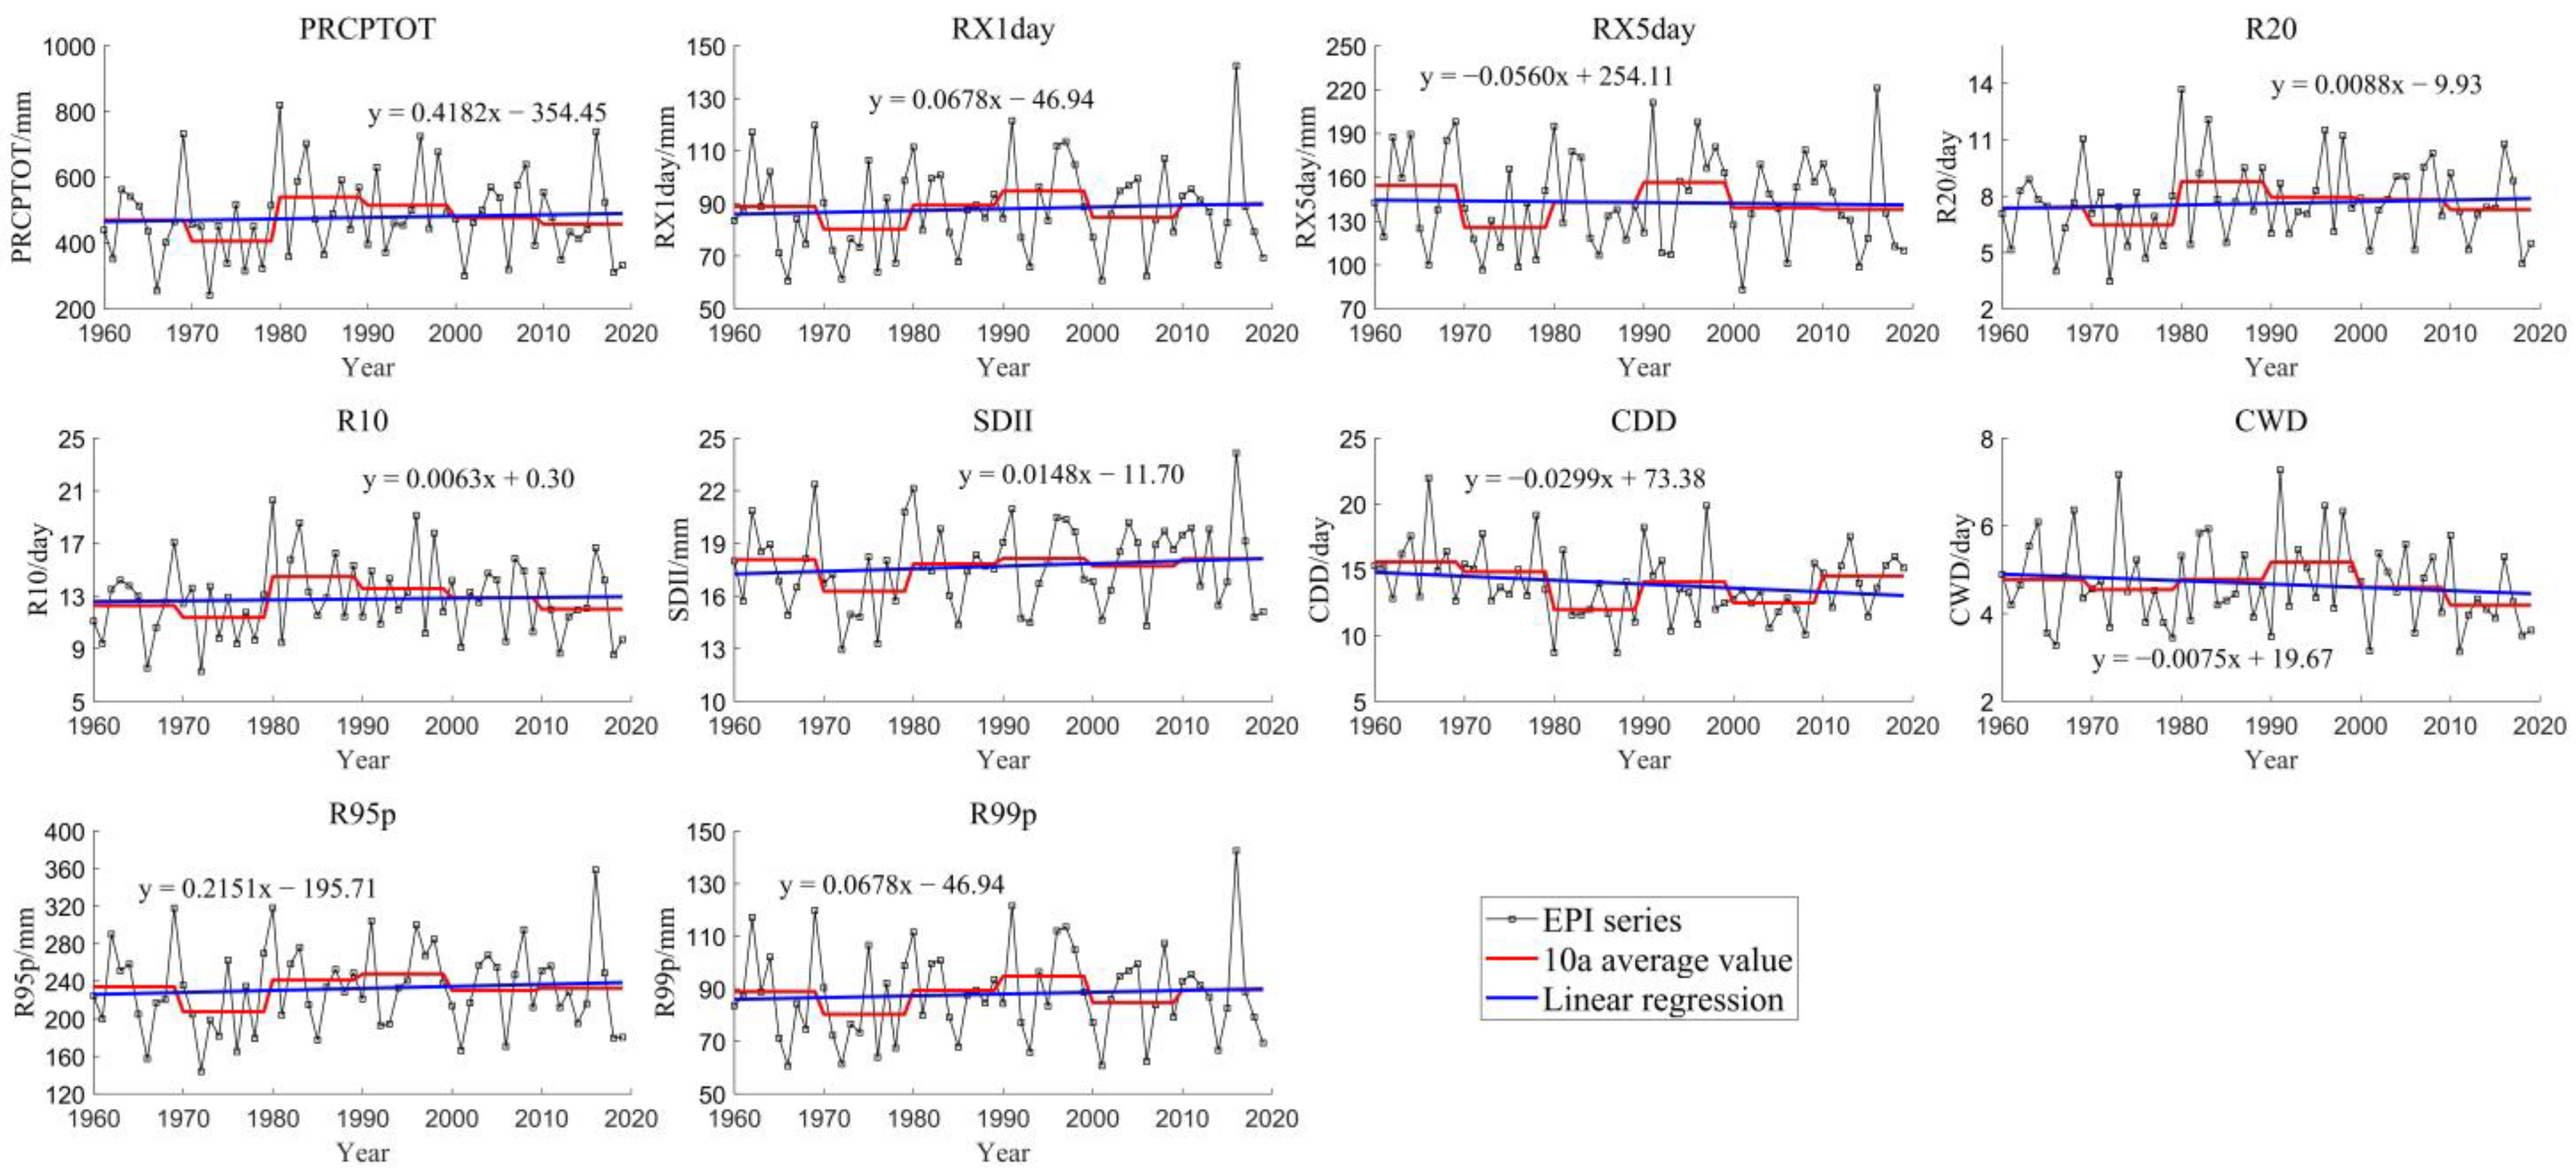
In summer, as shown in Figure 6 and Table 5, the overall trend of each summer EPIs were differ from those in the spring and annual scale during 1960–2019. The average value for PRCPTOT, RX1day, RX5day, SDII, R95p, and R99p in summer was 477.52, 87.96, 142.79, 17.70, 232.27, and 87.96 mm, respectively; the average value for R10, R20, CDD, and CWD was 12.77, 7.61, 13.92, and 4.68 days, respectively. During 1960–2019, RX5day, CDD, and CWD in summer decreased, while PRCPTOT, RX1day, R10, R20, SDII, R95p, and R99p in summer were increased. Almost all EPIs will be increased in the near future except CDD. The EPIs such as RX1day, RX5day, R95p, and R99p in summer was much higher than that in spring, which indicated that the risk of suffering extreme precipitation disaster is higher in summer than in spring within Hubei province. As for CDD and CWD, they were close in spring and summer.
As shown in Figure 6, the changes in decade average summer EPIs are obvious compared to those in spring and annual scale. Almost all EPIs except CDD and CWD in summer were lowest in the 1970s compared to other periods during 1960–2019. During 1980–2019, the decade average summer PRCPTOT, R10, and R20 kept a decreasing trend, the decade average summer RX1day, RX5day, CDDD, and R99p show a sudden change, while the decade average summer SDII and R95p were almost consistent with minor variations.
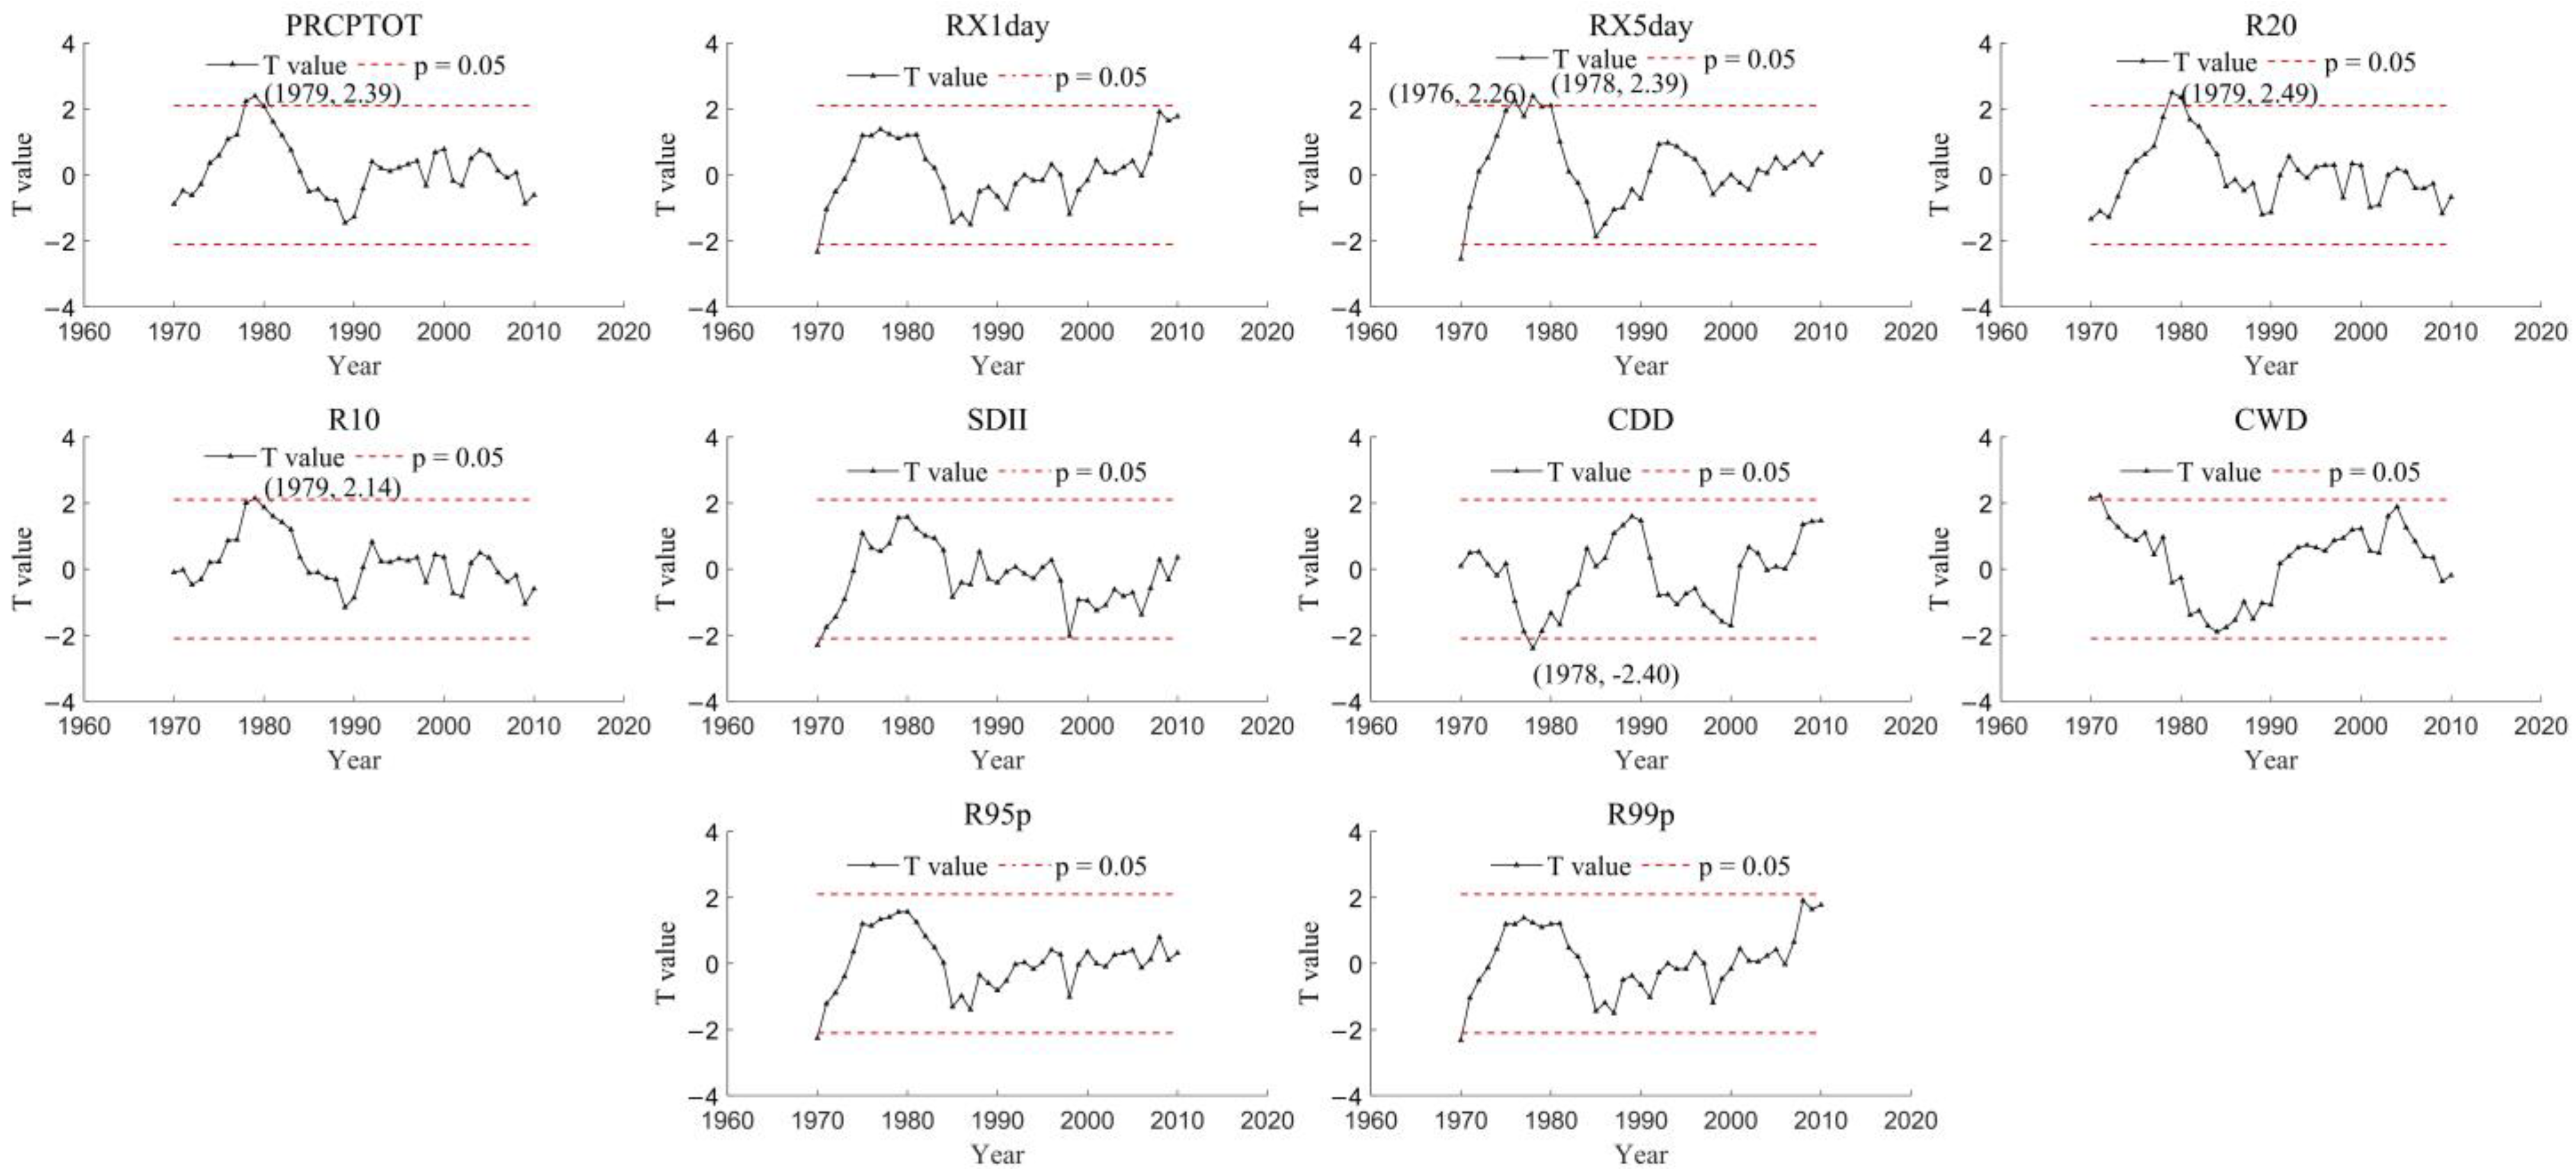
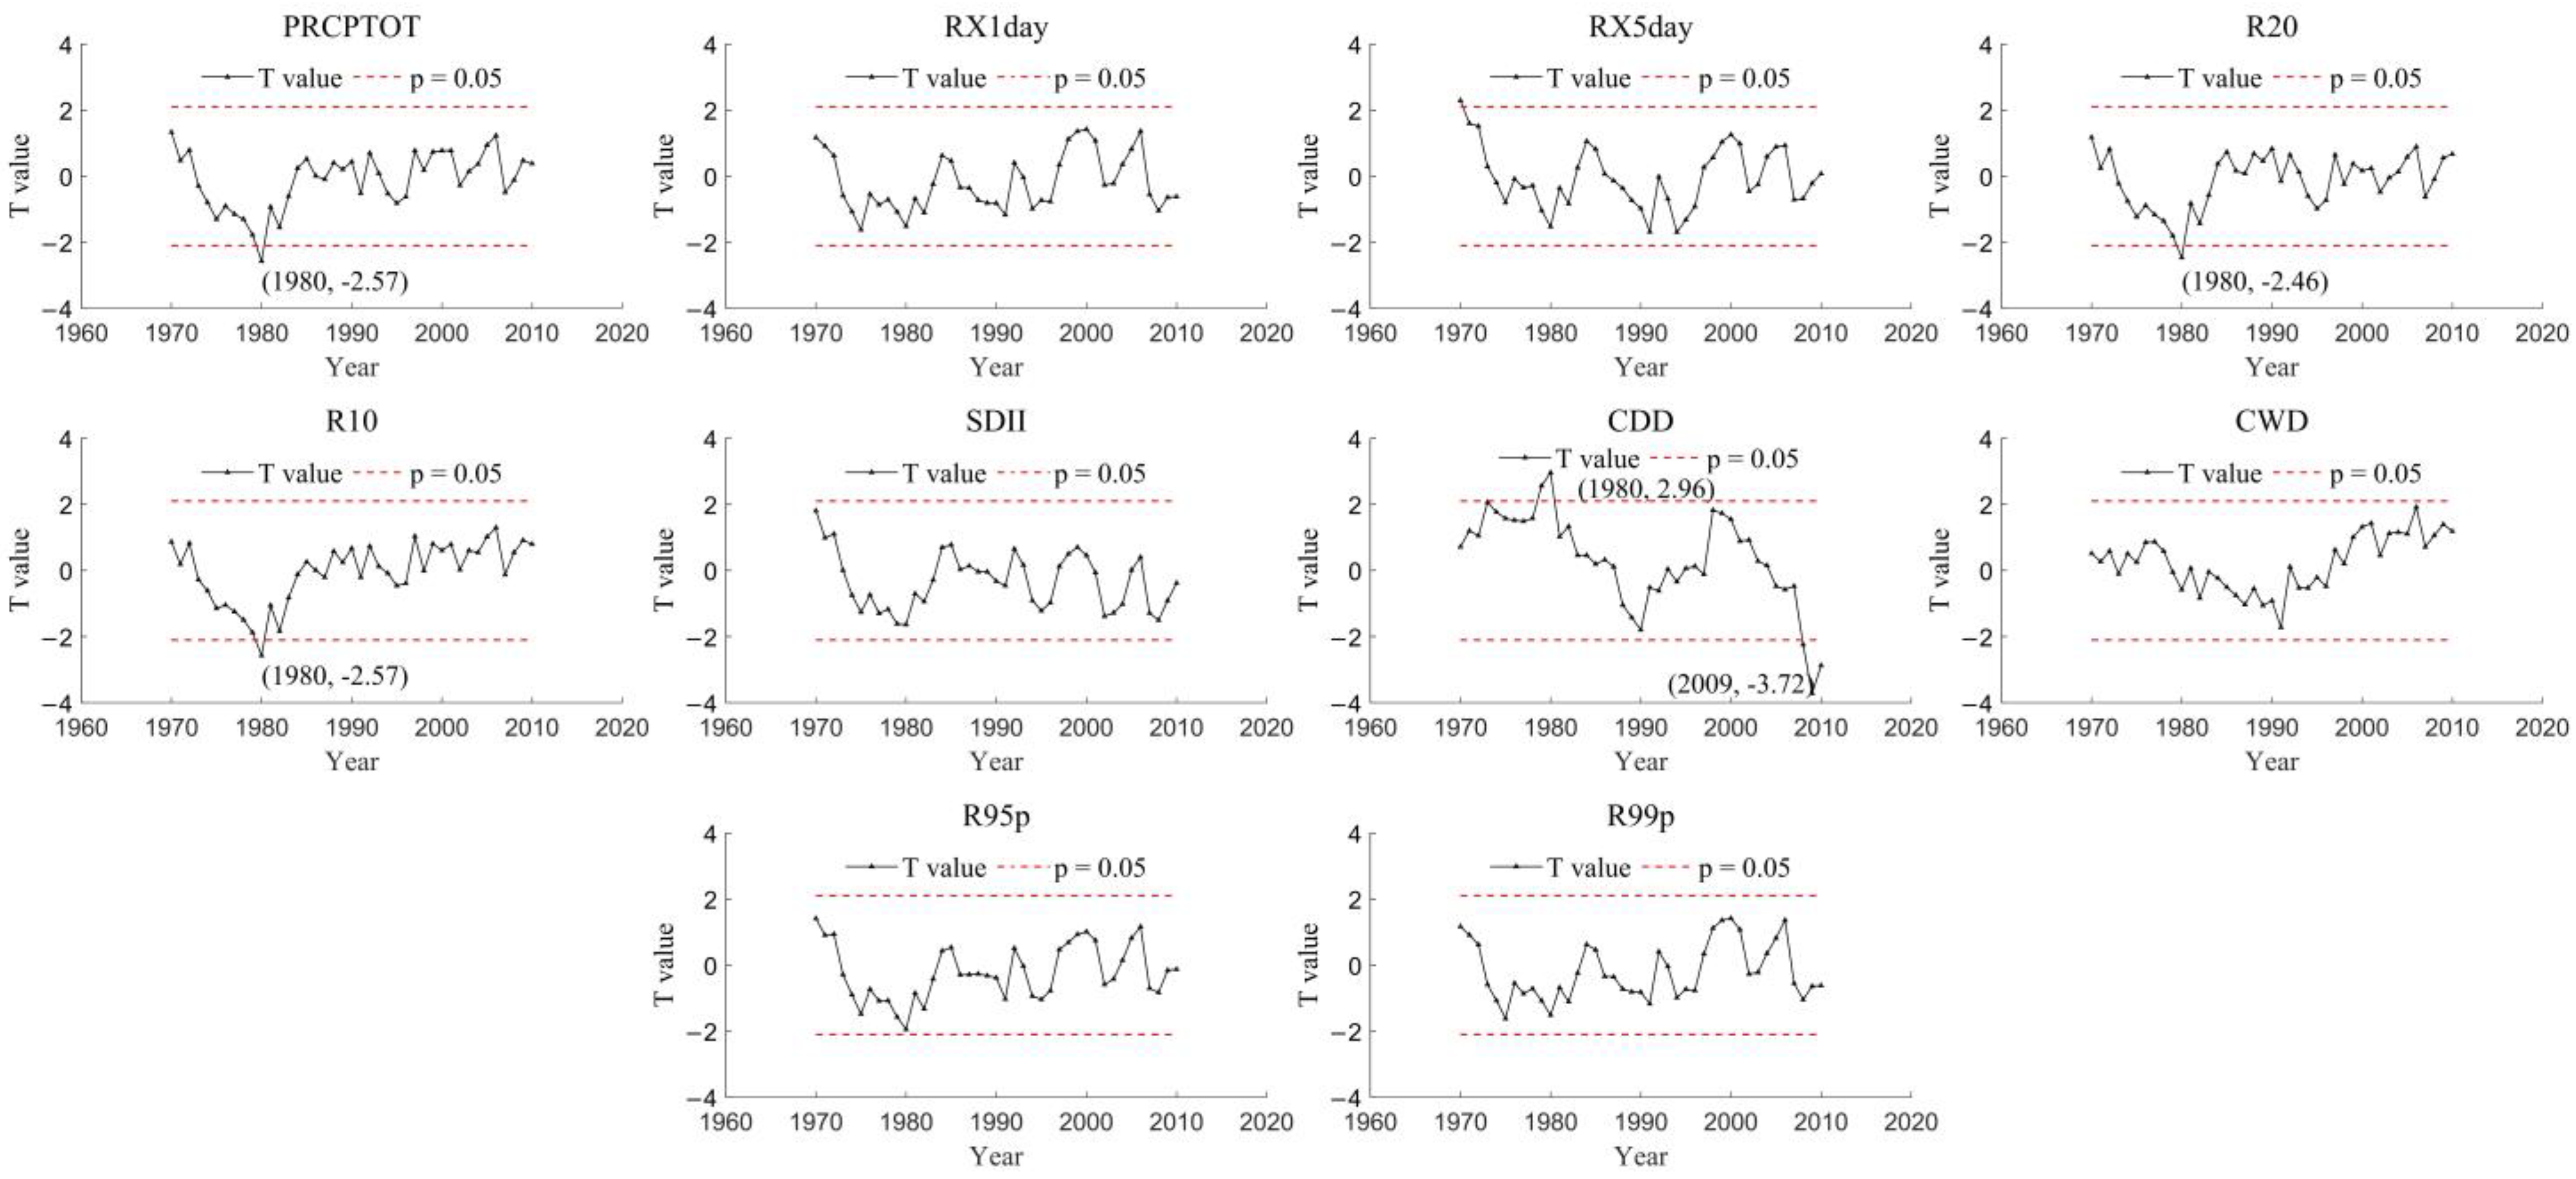
As shown in Figure 7 and Figure 8, the abrupt change point of EPIs in spring and summer was more than that on an annual scale. In spring, PRCPTOT has a significant abrupt change point in 1979, with a t value of 2.39; RX5day has two significant abrupt change points in 1976 and 1978, with a t value of 2.36 and 2.39, respectively; R10 and R20 have a significant abrupt change point in 1979, with a t value of 2.14 and 2.49, respectively; CDD has a significant abrupt change point in 1978, with a t value of −2.40. In summer, PRCPTOT, R10, and R20 have a significant abrupt change point in 1980, with a t value of −2.57, −2.46, and −2.57, respectively; CDD has two significant abrupt change points in 1980 and 2009, with a t value of 2.96 and −3.72, respectively. The abrupt change point for PRCPTOT, R10, R20, and CDD are almost opposite in spring and summer. For example, spring PRCPTOT, R10, and R20 increased before 1980 and decreased after 1980, but summer PRCPTOT, R10, and R20 decreased before 1979 and increased after 1979. This may indicate that the EPIs change trends were quite different in spring and summer.

4.2.2. Spatial Variations

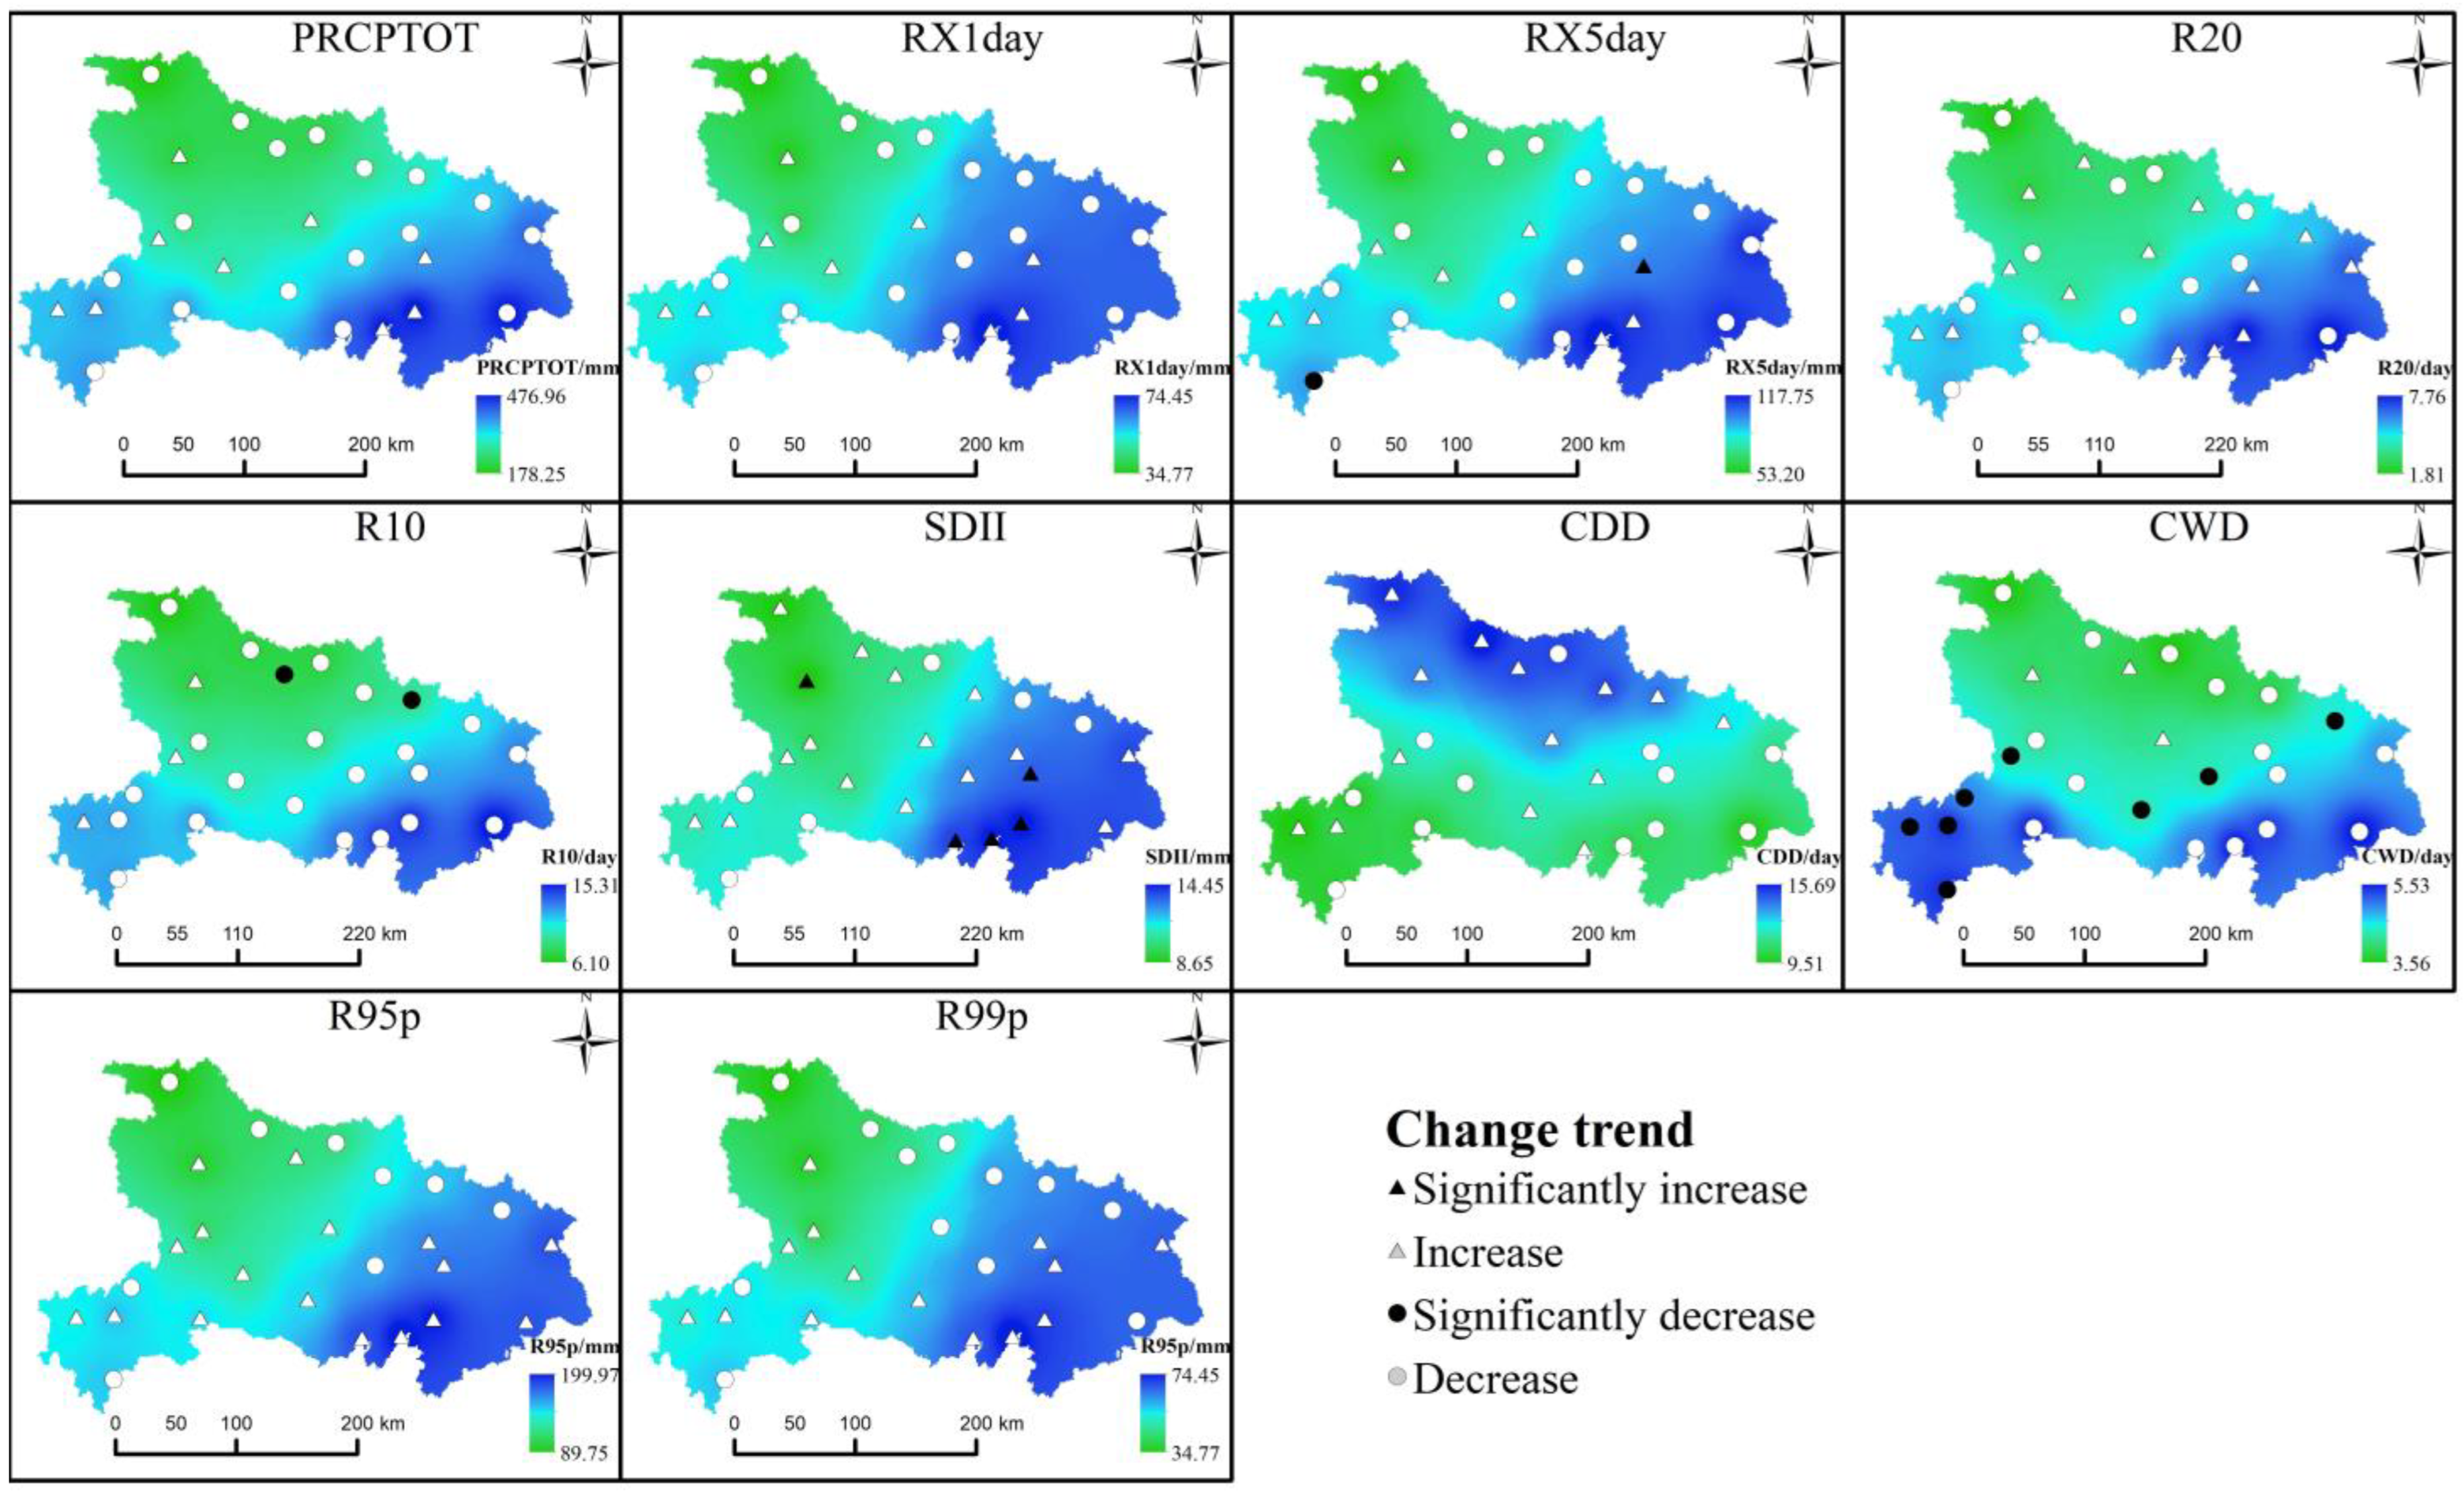
In spring, as shown in Figure 9, RX1day, RX5day, R10, R20, R95p, and R99p in spring were lower in the southwestern Hubei compared to that on an annual scale, and CWD in spring was higher in the southeastern Hubei compared to that on an annual scale. There is an obvious difference in the distribution of CDD in the spring and annual scale. In spring, the CDD was higher in northern Hubei, while CDD was higher in most regions and lower in southwestern Hubei on an annual scale.
The spatial variations of spring PRCPTOT and R20 value were obvious compared to those of annual PRCPTOT, the highest and lowest spring PRCPTOT was 476.96 and 178.25 mm, respectively, and the highest and lowest spring R20 was 7.76 and 1.81 day, respectively. This indicates that the spatial variability of spring precipitation was greater than that of the annual precipitation. The highest RX1day, RX5day, R95p, and R99p were 74.45, 117.75, 199.97, and 74.45 mm, respectively, occurred at Honghu station. This indicates that the Honghu region suffers a higher risk of extreme precipitation in spring compared to other regions within Hubei province.
The changing trend of spring EPIs was also different than those on an annual scale. The number of stations that were increased in summer PRCPTOT, RX1day, RX5day, R10, R20, SDII, CDD, CWD, R95p, and R99p was 9, 14, 11, 3, 14, 20, 14, 3, 17, and 14, respectively; the number of stations that was decreased in summer PRCPTOT, RX1day, RX5day, R10, R20, SDII, CDD, CWD, R95p, and R99p was 17, 12, 15, 23, 12, 6, 12, 23, 9, and 12, respectively. Besides, during 1960–2019, spring RX5day was significantly increased at Wuhan station and significantly decreased at Laifeng station, spring R10 was significantly decreased at Xiangyang and Dawu stations, and spring SDII was significantly increased at Fangxian, Wuhan, Jianli, Honghu, and Jiayu stations, spring CWD was significantly decreased at Badong, Macheng, Lichuan, Jianshi, Enshi, Jingzhou, Tianmen, and Laifeng stations. This indicated that Enshi city (Concluding Badong, Lichuan, Jianshi, and Enshi stations) would be increased in CWD during spring, further indicating that these regions would be wetter in spring compared to in the future.
In summer, as shown in Figure 10, EPIs like RX1day, RX5day, R10, R20, R95p, and R99p in summer were higher in the southwestern Hubei compared to that in spring, and CWD in summer was lower in the southeastern Hubei compared to that in spring. There is an obvious difference in the distribution of CDD in summer and spring. In summer, the CDD was higher in the mid-eastern Hubei, while CDD was higher in most regions and lower in northern Hubei in spring.
The highest summer PRCPTOT and R20 was 647.00 mm and 10.33 day, respectively, occurred at Jianshi station; and the lowest PRCPTOT and R20 were 322.16 mm and 4.95 days, respectively, occurred at Laohekou station. The highest summer RX1day, RX5day, R95p, and R99p were 112.91, 187.18, 293.21, and 112.90 mm, respectively, occurred at Macheng station. This indicates that the Macheng region suffers a higher risk of extreme precipitation in summer compared to other regions within Hubei province.
The number of stations that were increased in summer PRCPTOT, RX1day, RX5day, R10, R20, SDII, CDD, CWD, R95p, and R99p was 16, 16, 12, 14, 16, 15, 6, 8, 17, and 16, respectively; the number of stations that was decreased in summer PRCPTOT, RX1day, RX5day, R10, R20, SDII, CDD, CWD, R95p, and R99p was 10, 10, 14, 12, 10, 11, 20, 18, 9, and 10, respectively. Besides, during 1960–2019, summer RX1day was significantly increased at Macheng station, summer R10 was significantly increased at Xunxi stations, summer SDII was significantly increased at Macheng station, summer CDD was significantly decreased at Wuhan, Jianli, and Jiayu stations, summer CWD was significantly decreased at Zhongxiang and Yichang stations. In addition, summer PRCPTOT, RX1day, RX5day, R10, R20, SDII, R95p, and R99p were all increased at Xunxi, Fangxian, Laohekou, Macheng, Jingzhou, Xiaogan, Wuhan, and Jianli stations. This may indicate that these regions could be more at risk of extreme precipitation events in the future.

4.3. Correlation between the EPIs and MEI Index

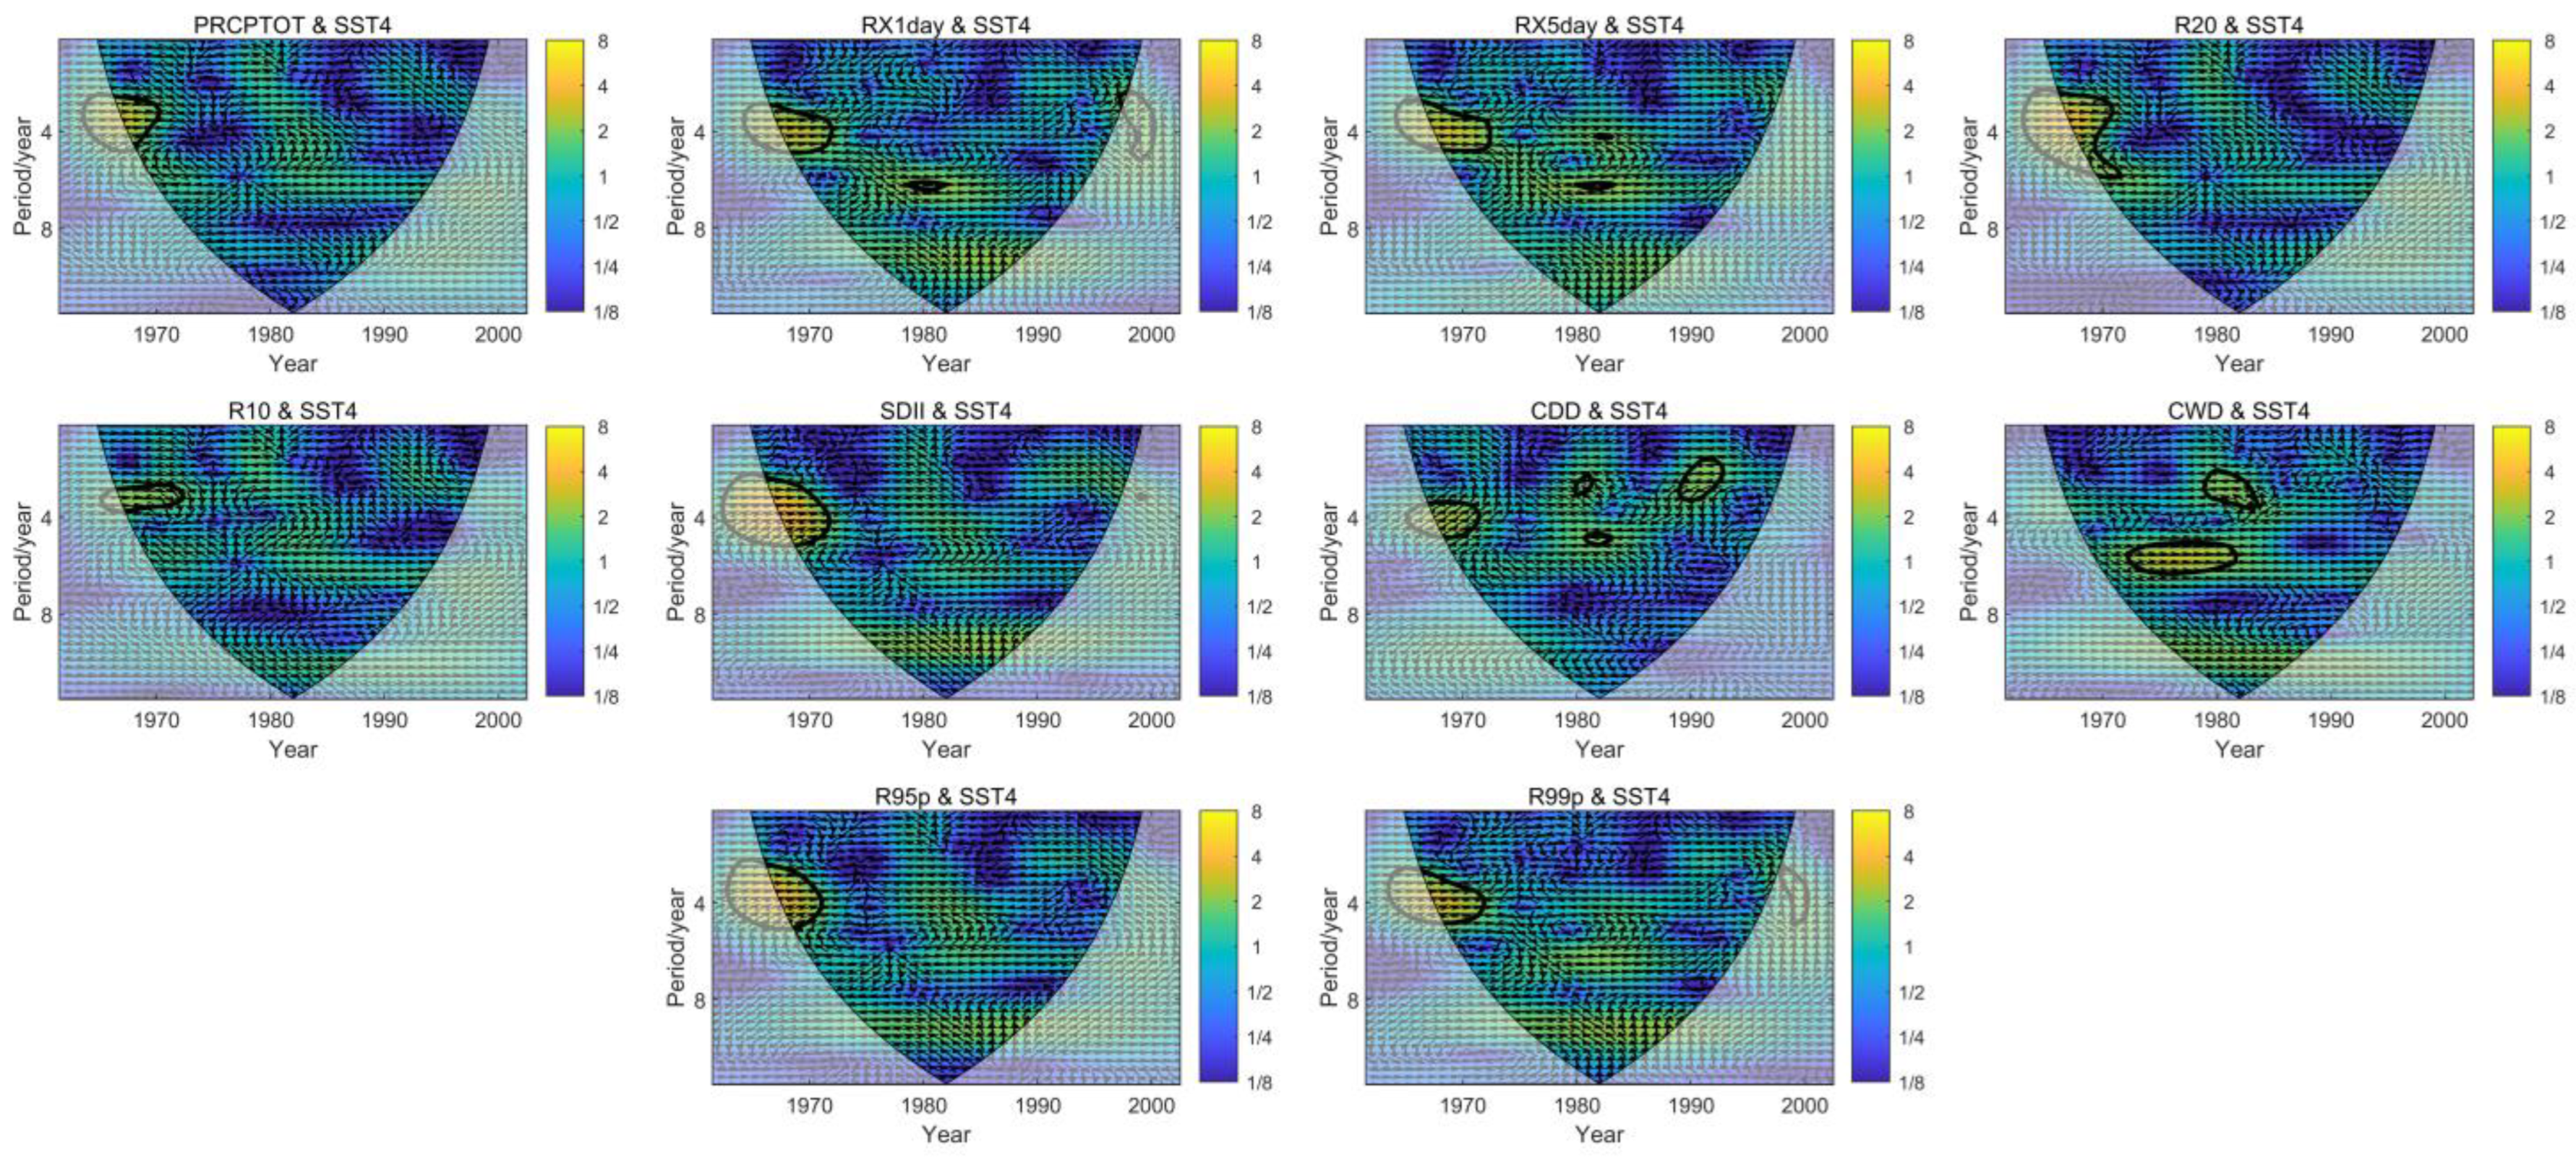
Figure 11 shows the correlation between annual EPIs and MEI from time-frequency space by varying the power spectrum and phase structure. These figures show the wavelet power spectrum as colorful stripes, and the resonant period that passed a 95% significance test is shown as a thick black contour. Arrows show the link between the respective phases: “→” indicates that the variation of the MEI and EPIs are positively correlated; “←” indicates that the variation of the MEI and EPIs are negatively correlated; “↓” indicates that the variation of the EPIs lags behind that of the MEI with one-fourth of the resonant period; and “↑” indicates that the variation of the EPIs is ahead of the MEI with one-fourth of the resonant period [49].
As shown in Figure 11, almost all EPIs had a significant (p < 0.05) relationship with MEI except PRCPTOT, R20, SDII, and R95p. A significant resonant period of six years exists between RX1day and MEI during 1987–2001. During this period, the RX1day was positively correlated with MEI synchronously. A significant resonant period for six years exists between RX5day and MEI during 1999–2002. During this period, the RX5day was positively correlated with MEI synchronously. A significant resonant period for three to four years exists between R10 and MEI during 1984–1994. During this period, the R10 was positively correlated with MEI with a short lag time. Three significant resonant periods exist between CDD and MEI: A short-term period of three years, five years, and two to three years occurred during 1999–2001, 2000–2002, and 2007–2012, respectively. During 1999–2001, the CDD was negatively correlated with MEI with a lead time; during 2000–2002, the CDD was negatively correlated with MEI synchronously; while during 2007–2012, the CDD was negatively correlated with MEI with a lag time. Two significant resonant periods exist between CWD and MEI: A short-term period of five to six years and two to four years occurred during 1991–2002 and 1997–2004, respectively. During 1991–2002, the CWD was negatively correlated with MEI synchronously; while during 1997–2004, the CWD was negatively correlated with MEI with a lead time. A significant resonant period of three to five years exists between R99p and MEI during 1999–2004. During this period, the R99p was negatively correlated with MEI with a lead time.

5. Discussion

5.1. Important Changes in the EPIs within Hubei Province and Their Effects

Based on the daily site measured precipitation records during 1960–2019, 10 EPIs (PRCPTOT, RX1day, RX5day, R10, R20, SDII, CDD, CWD, R95p, and R99p) are chosen to be analyzed the spatial-temporal variations of extreme precipitation on annual and seasonal (spring and summer) scale within the Hubei province in this paper. As analyzed in the previous section, the extreme precipitation characteristics within the Hubei province varied in different regions.
The annual average value of R95p and R99p within the Hubei province was 660.36 and 219.43 mm, respectively, and it all would be increased in the future. This indicated that the possibility of extremely heavy precipitation events in the regions will increase in recently future since 2019. As reported in 2020 and 2021, Wuhan city, Yichang city, Suizhou city, Xiangyang city, and Xiaogan city all experienced extremely heavy precipitation which resulted in severe economic loss [27,28]. These frequent extreme precipitation events have proved that the probability of extreme rainstorms in Hubei province has increased. Within the Hubei province, the SDII presents an increasing trend while the PRCPTOT shows a decreasing trend, this indicates that the precipitation has been more concentrated. The decrease in CWD further verified this result. The CWD decreased while the PRCPTOT increased, this suggests that the precipitation concentration increased. The R95p and R99p also increased, these changes increase the possibility of extreme precipitation.
The extreme precipitation events mainly occurred in the eastern and southwestern Hubei compared to other regions, and more than half of the regions would be increased in R95p and R99p. One thing to note is that the regions where R95p and R99p increased are mainly distributed in eastern Hubei, where the R95p and R99p are already higher than in other regions. Especially, Wuhan, Macheng, Yingshan, and Jianshi stations with the highest PRCPTOT, RX1day, RX5day, R95p, and R99p simultaneously. This may indicate that these regions are at great risk of extreme precipitation events, and more attention should be paid to them. Besides, almost all the EPIs show a decreasing trend within the southwestern Hubei province, this indicates that the probability of suffering extreme precipitation events decreased, and the amount of water resources decreased simultaneously. For some middle regions, the PRCPTOT and SDII decreased and increased, respectively, and the R95p and R99p also increased. Thus, these regions may suffer more extreme precipitation events in the future and their water resources could be reduced.
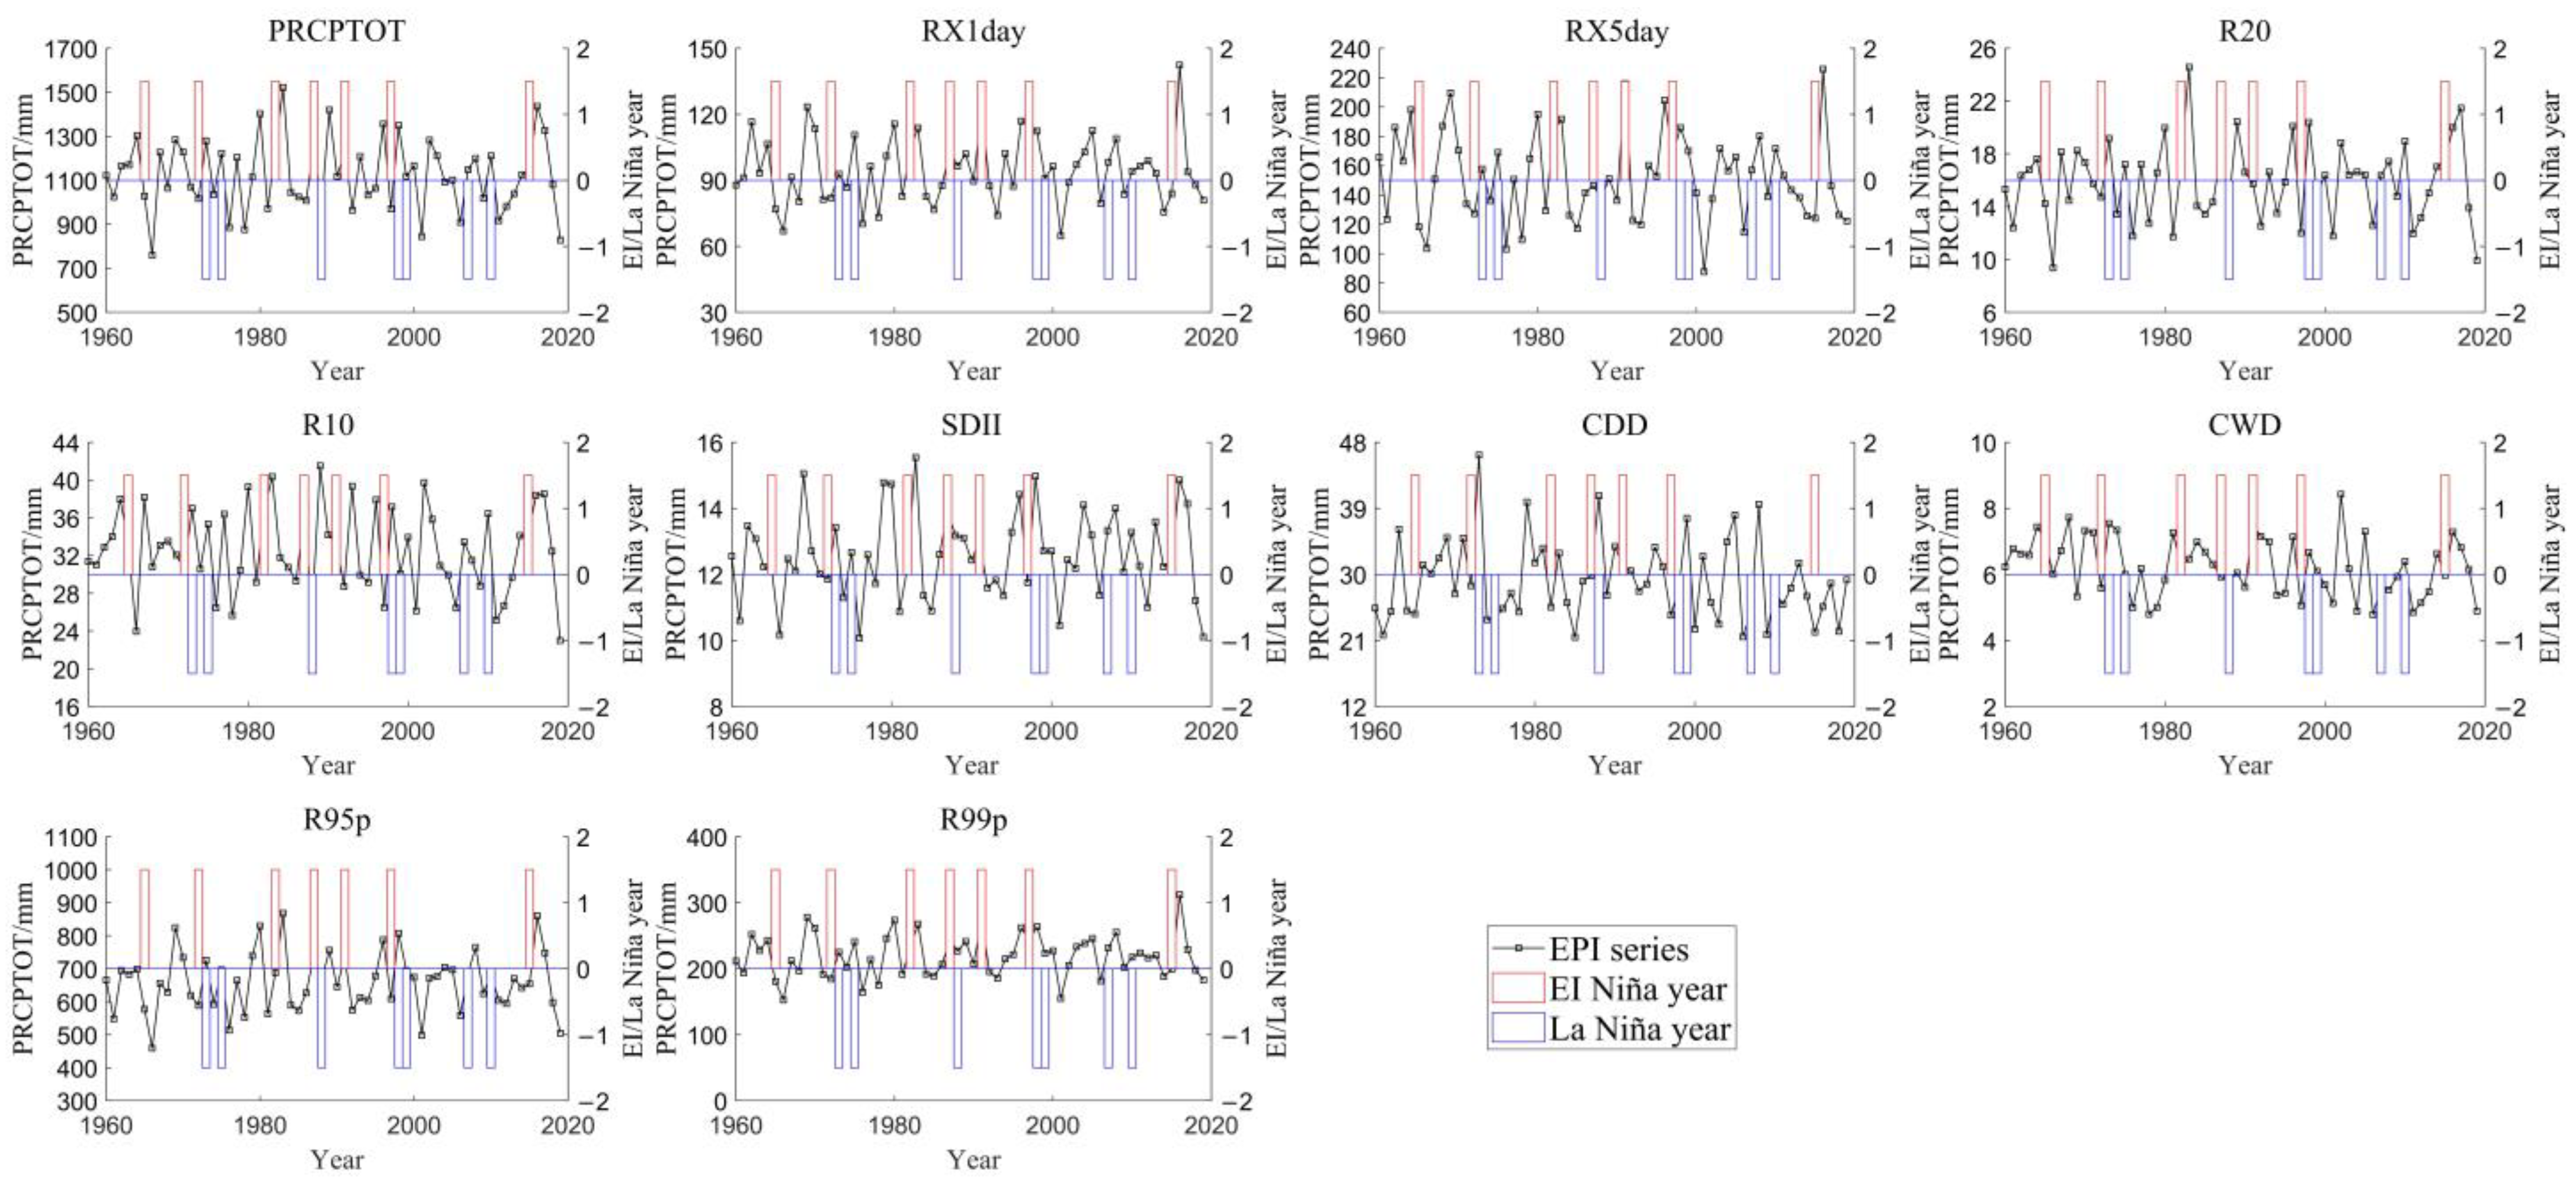
For the long-term, some EPIs such as RX1day, RX5day, and R10 shown an interdecadal fluctuation (Figure 2). This indicates that the precipitation randomness and precipitation intensity in the Hubei province is complex. In other investigations, the interdecadal fluctuation phenomenon was also found [50]. The EPIs variations in spring and summer were different, this may be influenced by the ENSO and Meiyu. In Hubei province, the Meiyu is mainly during early summer, which would bring some extreme long-term or heavy rainfall events [51], this may result in the special variation for EPIs in summer. Besides, the ENSO has been reported as an important influencing factor on seasonal precipitation variations in China [52]. And during 1960–2019, the 1970s and 2000s were dominated by El Niño year, while the 1980s were dominated by La Niña year (Figure 12), which would further affect the EPIs. These combined factors influence the temporal variations of EPIs.
The spatial variations of EPIs are greater on the seasonal scale than that on the annual scale. Especially, the spring RX1day and R99p would increase in the future, and all EPIs would increase in the future except CDD. These indicate that the extremely heavy rain would occur more frequently in both spring and summer, while almost all EPIs events will increase in the future in the summer period. One thing that needs to be noted is that Wuhan city will experience increases in PRCPTOT, RX1day, RX5day, R95p, and R99p. It is an important city for Hubei, but may suffer a more severe risk of extreme precipitation in the nearfuture. The research conducted by Xiong et al. [53] also indicated that the extreme precipitation volume has increased than before, which would aggravate the pressure on the drainage infrastructure of Wuhan city. Besides, almost all cities within Hubei are developing infrastructure, especially Wuhan. This may increase the probability of the occurrence of environmental problems, such as soil erosion, water pollution, et al. [54]. Hubei province is also an important crop production base, extreme precipitation events would also affect the farmers’ income [55]. More attention should be paid to these regions (Wuhan, Suizhou, Yichang, Macheng, Jianshi, Jianli) where there is more risk of EPIs events.
In addtion, compared to artificial intelligence-based methods (e.g., deep learning methods [56], the machine learning methods [57], and the ACANN model [58]), which have been popular in recent studies and do well in revealing the relationship between multiple variables, a simple linear regression method was adopted in this study. In the future, more studies should be done based on various artificial intelligence-based methods to reveal a more complicated trend of EPIs within the Hubei province.

5.2. Connections between the El Niño-Southern Oscillation and EPIs and Its Prediction Function

As discussed in the previous section, some EPIs (RX1day, RX5day, R10, CDD, CWD, and R99p) exist in relationship with El Niño-Southern Oscillation. The resonant period between these EPIs and MEI mainly varied between three and six years, which may indicate that the correlation between EPIs and El Niño-Southern Oscillation exists in short term. In Hubei province, RX1day and R10 were positively correlated with MEI, while RX5day, CDD, CWD, and R99p were negatively correlated with MEI. These indicate that the MEI could be an indicator for EPIs in Hubei, the increase in MEI may result in the reduction of continued heavy rain and an increase of extreme short rainfall events.
The EI Niño and La Niña are the main phenomenons caused by the El Niño-Southern Oscillation, the series of annual EPIs of Hubei from 1979 to 2019, and the statistics of El Niño and La Niña years during this period are shown in Figure 12. From Figure 12, we could find that there exists consistency between most EPIs and the El Niño and La Niña years in most cases. For example, PRCPTOT, RX1day, RX5day, R10, SDII, and R99p would be extremely higher when near the El Niño years, and RX5day, SDII, CDD, and R95p would be lower when near the La Niña years. This indicates that El Niño could increase the occurrence probability of EPIs events within Hubei province. In previous research, similar findings were found. Li et al. [25] found that the strong El Niño of 2015–2016 may be the main cause of the extreme precipitation event in the Yangtze River regions in 2016, which means that the El Niño would increase the magnitude of extreme precipitation. Xiao et al. [59] found that the ENSO would lead a seasonal precipitation variability over middle China. Fu et al. [16] revealed that the ENSO could exert an important effect on the East Asian monsoon and further influence the extreme events in China. In the Philippines, statistically significant changes in extreme precipitation were detected and were further linked to ENSO [21]. Many related results were obtained in other literature [60,61,62]. The influence of the El Niño-Southern Oscillation on EPIs is complicated and differs in regions, and more in-depth investigations should be conducted to reveal the mechanistic connection between them.

6. Conclusions

The spatial-temporal variations of extreme precipitation during 1960–2019 were analyzed within Hubei province, China, and the correlations between extreme precipitation indices and El Niño-Southern Oscillation were examined. The main results were as follows:
(1)
The annual average value of PRCPTOT, RX1day, RX5day, SDII, R95p, and R99p is 1124.08, 95.75, 152.83, 12.56, 660.36, and 219.43 mm, respectively; the annual average value of R20, R10, CDD, and CWD is 15.86, 32.45, 29.11, and 6.23 day, respectively. The CWD decreased significantly (p < 0.05) during 1960–2019, and it would decrease in the recent future. The annual EPIs were higher in the eastern and southwestern Hubei compared to other regions, and extreme precipitation events will be increased in most regions;
(2)
The changing trend of EPIs in spring and summer was more obvious compared to that on an annual scale, both in temporal and space. The spring RX1day and R99p will be increased in the near future, which indicates that extreme rainstorm events may be increased in spring. Almost all EPIs except CDD would be increased in the recent future, showing that more attention should be paid in summer to the disaster prevention caused by extreme precipitation events;
(3)
In Hubei province, RX1day and R10 were positively correlated with El Niño-Southern Oscillation, while RX5day, CDD, CWD, and R99p were negatively correlated with El Niño-Southern Oscillation. MEI could be an indicator for EPIs in Hubei, the increase in MEI will result in the reduction of continued heavy rain and an increase of extreme short rainfall events;
(4)
More attention should be paid to meteorological observations and rainstorm predictions in Wuhan, Enshi, and Macheng (especially in summer) where there may be an increase in the intensity indices of extreme precipitation (RX1day, RX5day, R95p, and R99p). This may help to reduce the economic losses brought about by extreme precipitation events.

Author Contributions

Conceptualization, W.W. and H.T.; methodology, H.T.; software, Y.H.; validation, Y.H., J.L. and W.W.; formal analysis, W.W.; investigation, H.T.; resources, H.T.; data curation, H.T.; writing—original draft preparation, H.T.; writing—review and editing, H.T.; visualization, H.T.; supervision, H.T.; project administration, W.W. All authors have read and agreed to the published version of the manuscript.

Funding

This research received no external funding.

Institutional Review Board Statement

Not applicable.

Informed Consent Statement

Not applicable.

Conflicts of Interest

The authors declare no conflict of interest.

References

  1. Chen, H.; Chen, Y.; Li, D.; Li, W. Effect of sub-cloud evaporation on precipitation in the Tianshan Mountains (Central Asia) under the influence of global warming. Hydrol. Process. 2020, 34, 5557–5566. [Google Scholar] [CrossRef]
  2. Papalexiou, S.M.; Montanari, A. Global and regional increase of precipitation extremes under global warming. Water Resour. Res. 2019, 55, 4901–4914. [Google Scholar] [CrossRef]
  3. O’Gorman, P.A. Precipitation extremes under climate change. Curr. Clim. Chang. Rep. 2015, 1, 49–59. [Google Scholar] [CrossRef] [PubMed] [Green Version]
  4. Xu, H.; Duan, Y.; Li, Y.; Wang, H. Indirect Effects of Binary Typhoons on an Extreme Rainfall Event in Henan Province, China from 19 to 21 July 2021: 2. Numerical Study. J. Geophys. Res.-Atmos. 2022, 127, e2021JD036265. [Google Scholar] [CrossRef]
  5. Kazama, S.; Sato, A.; Kawagoe, S. Evaluating the cost of flood damage based on changes in extreme rainfall in Japan. Sustain. Sci. 2009, 4, 61–69. [Google Scholar] [CrossRef]
  6. Smith, J.A.; Baeck, M.L.; Yang, L.; Signell, J.; Morin, E.; Goodrich, D.C. The Paroxysmal Precipitation of the Desert: Flash Floods in the Southwestern United States. Water Resour. Res. 2019, 55, 10218–10247. [Google Scholar] [CrossRef]
  7. Srivastava, P.K.; Pradhan, R.K.; Petropoulos, G.P.; Pandey, V.; Gupta, M.; Yaduvanshi, A.; Jaafar, W.Z.W.; Mall, R.K.; Sahai, A.K. Long-Term Trend Analysis of Precipitation and Extreme Events over Kosi River Basin in India. Water 2021, 13, 1695. [Google Scholar] [CrossRef]
  8. Yan, C.; Pinhong, H.; Xuedong, Z.; Jie, Y. Influence of climate change on the volume capture ratio of annual rainfall’s partition. Clim. Chang. Res. 2021, 17, 525–536. [Google Scholar]
  9. Ma, M.; Wang, H.; Jia, P.; Liu, R.; Hong, Z.; Labriola, L.G.; Hong, Y.; Miao, L. Investigation of inducements and defenses of flash floods and urban waterlogging in Fuzhou, China, from 1950 to 2010. Nat. Hazards 2018, 91, 803–818. [Google Scholar] [CrossRef]
  10. Liang, X.-Z. Extreme rainfall slows the global economy. Nature 2022, 601, 193–194. [Google Scholar] [CrossRef]
  11. Li, M.-F.; Luo, W.; Li, H.; Liu, E.; Li, Y. Daily extreme precipitation indices and their impacts on rice yield-A case study over the tropical island in China. Theor. Appl. Climatol. 2018, 132, 503–513. [Google Scholar] [CrossRef]
  12. Wei, C.; Dong, X.; Yu, D.; Zhang, T.; Zhao, W.; Ma, Y.; Su, B. Spatio-temporal variations of rainfall erosivity, correlation of climatic indices and influence on human activities in the Huaihe River Basin, China. Catena 2022, 217, 106486. [Google Scholar] [CrossRef]
  13. Dey, R.; Bador, M.; Alexander, L.V.; Lewis, S.C. The drivers of extreme rainfall event timing in Australia. Int. J. Clim. 2021, 41, 6654–6673. [Google Scholar] [CrossRef]
  14. Ojara, M.A.; Lou, Y.; Babaousmail, H.; Wasswa, P. Trends and zonal variability of extreme rainfall events over East Africa during 1960–2017. Nat. Hazards 2021, 109, 33–61. [Google Scholar] [CrossRef]
  15. Henny, L.; Thorncroft, C.D.; Hsu, H.-H.; Bosart, L.F. Extreme Rainfall in Taiwan: Seasonal Statistics and Trends. J. Clim. 2021, 34, 4711–4731. [Google Scholar] [CrossRef]
  16. Fu, G.; Yu, J.; Yu, X.; Ouyang, R.; Zhang, Y.; Wang, P.; Liu, W.; Min, L. Temporal variation of extreme rainfall events in China, 1961–2009. J. Hydrol. 2013, 487, 48–59. [Google Scholar] [CrossRef]
  17. Vu, T.M.; Mishra, A.K. Nonstationary frequency analysis of the recent extreme precipitation events in the United States. J. Hydrol. 2019, 575, 999–1010. [Google Scholar] [CrossRef]
  18. Zhao, Y.; Xu, X.; Huang, W.; Wang, Y.; Xu, Y.; Chen, H.; Kang, Z. Trends in observed mean and extreme precipitation within the Yellow River Basin, China. Theor. Appl. Climatol. 2019, 136, 1387–1396. [Google Scholar] [CrossRef] [Green Version]
  19. Yin, Y.; Pan, X.; Yang, X.; Wang, X.; Wang, G.; Sun, S. Spatiotemporal Changes and Frequency Analysis of Multiday Extreme Precipitation in the Huai River Basin during 1960 to 2014. Adv. Meteorol. 2019, 2019, 6324878. [Google Scholar] [CrossRef] [Green Version]
  20. Grimm, A.M.; Tedeschi, R.G. ENSO and Extreme Rainfall Events in South America. J. Clim. 2009, 22, 1589–1609. [Google Scholar] [CrossRef]
  21. Villafuerte, M.Q., II; Matsumoto, J. Significant Influences of Global Mean Temperature and ENSO on Extreme Rainfall in Southeast Asia. J. Clim. 2015, 28, 1905–1919. [Google Scholar] [CrossRef]
  22. Cao, F.; Gao, T.; Dan, L.; Xie, L.; Gong, X. Variability of Summer Precipitation Events Associated with Tropical Cyclones over Mid-Lower Reaches of Yangtze River Basin: Role of the El Nino-Southern Oscillation. Atmosphere 2019, 10, 256. [Google Scholar] [CrossRef] [Green Version]
  23. Xia, J.; Yang, X.-y.; Liu, J.; Wang, M.; Li, J. Dominant change pattern of extreme precipitation and its potential causes in Shandong Province, China. Sci. Rep. 2022, 12, 858. [Google Scholar] [CrossRef] [PubMed]
  24. King, A.D.; Alexander, L.V.; Donat, M.G. Asymmetry in the response of eastern Australia extreme rainfall to low-frequency Pacific variability. Geophys. Res. Lett. 2013, 40, 2271–2277. [Google Scholar] [CrossRef]
  25. Li, C.; Tian, Q.; Yu, R.; Zhou, B.; Xia, J.; Burke, C.; Dong, B.; Tett, S.F.B.; Freychet, N.; Lott, F.; et al. Attribution of extreme precipitation in the lower reaches of the Yangtze River during May 2016. Environ. Res. Lett. 2018, 13, 014015. [Google Scholar] [CrossRef]
  26. Wang, R.; Li, C. Spatiotemporal analysis of precipitation trends during 1961-2010 in Hubei province, central China. Theor. Appl. Climatol. 2016, 124, 385–399. [Google Scholar] [CrossRef]
  27. The Second Flood of 2020 Has Formed and Hubei is Experiencing the Ninth Round of Rainfall, and the Flood Control Situation Is Still Grim. Available online: https://baijiahao.baidu.com/s?id=1672527549078333503&wfr=spider&for=pc (accessed on 21 June 2022).
  28. Suizhou in Hubei Province Has Been Hit by Heavy Rains, with Some Areas Seeing 2.46 Meters of Water. Available online: http://finance.sina.com.cn/jjxw/2021-08-13/doc-ikqcfncc2556772.shtml (accessed on 4 September 2022).
  29. Xu, Z.; Pan, B.; Han, M.; Zhu, J.; Tian, L. Spatial-temporal distribution of rainfall erosivity, erosivity density and correlation with El Nino-Southern Oscillation in the Huaihe River Basin, China. Ecol. Inform. 2019, 52, 14–25. [Google Scholar] [CrossRef]
  30. Zhang, X.; Alexander, L.; Hegerl, G.C.; Jones, P.; Tank, A.K.; Peterson, T.C.; Trewin, B.; Zwiers, F.W. Indices for monitoring changes in extremes based on daily temperature and precipitation data. Wiley Interdiscip. Rev. Clim. Chang. 2011, 2, 851–870. [Google Scholar] [CrossRef]
  31. Westra, S.; Alexander, L.V.; Zwiers, F.W. Global increasing trends in annual maximum daily precipitation. J. Clim. 2013, 26, 3904–3918. [Google Scholar] [CrossRef] [Green Version]
  32. Donat, M.G.; Lowry, A.L.; Alexander, L.V.; O’Gorman, P.A.; Maher, N. More extreme precipitation in the world’s dry and wet regions. Nat. Clim. Chang. 2016, 6, 508–513. [Google Scholar] [CrossRef]
  33. Kim, Y.-H.; Min, S.-K.; Zhang, X.; Sillmann, J.; Sandstad, M. Evaluation of the CMIP6 multi-model ensemble for climate extreme indices. Weather Clim. Extrem. 2020, 29, 100269. [Google Scholar] [CrossRef]
  34. Faye, A.; Akinsanola, A.A. Evaluation of extreme precipitation indices over West Africa in CMIP6 models. Clim. Dyn. 2022, 58, 925–939. [Google Scholar] [CrossRef]
  35. Weisberg, S. Applied Linear Regression; John Wiley & Sons: Hoboken, NJ, USA, 2005; Volume 528. [Google Scholar]
  36. Tiku, M. Tables of the power of the F-test. J. Am. Stat. Assoc. 1967, 62, 525–539. [Google Scholar] [CrossRef]
  37. Güner Bacanli, Ü. Trend analysis of precipitation and drought in the A egean region, Turkey. Meteorol. Appl. 2017, 24, 239–249. [Google Scholar] [CrossRef]
  38. Baig, M.R.I.; Naikoo, M.W.; Ansari, A.H.; Ahmad, S.; Rahman, A. Spatio-temporal analysis of precipitation pattern and trend using standardized precipitation index and Mann–Kendall test in coastal Andhra Pradesh. Model. Earth Syst. Environ. 2022, 8, 2733–2752. [Google Scholar] [CrossRef]
  39. Zhao, F.; Xu, Z.; Huang, J. Long-term trend and abrupt change for major climate variables in the upper Yellow River Basin. Acta Meteorol. Sin.-Engl. Ed. 2007, 21, 204. [Google Scholar]
  40. Da-Quan, Z.; Guo-Lin, F.; Jing-Guo, H. Trend of extreme precipitation events over China in last 40 years. Chin. Phys. B 2008, 17, 736. [Google Scholar] [CrossRef]
  41. Dong, D.; Tao, W.; Lau, W.K.; Li, Z.; Huang, G.; Wang, P. Interdecadal variation of precipitation over the Hengduan Mountains during rainy seasons. J. Clim. 2019, 32, 3743–3760. [Google Scholar] [CrossRef]
  42. Cao, Q.; Hao, Z.; Yuan, F.; Su, Z.; Berndtsson, R.; Hao, J.; Nyima, T. Impact of ENSO regimes on developing-and decaying-phase precipitation during rainy season in China. Hydrol. Earth Syst. Sc. 2017, 21, 5415–5426. [Google Scholar] [CrossRef] [Green Version]
  43. Wu, S.; Hu, Z.; Wang, Z.; Cao, S.; Yang, Y.; Qu, X.; Zhao, W. Spatiotemporal variations in extreme precipitation on the middle and lower reaches of the Yangtze River Basin (1970–2018). Quat. Int. 2021, 592, 80–96. [Google Scholar] [CrossRef]
  44. Sun, J.; Wang, X.; Yin, Y.; Shahid, S. Analysis of historical drought and flood characteristics of Hengshui during the period 1649–2018: A typical city in North China. Nat. Hazards 2021, 108, 2081–2099. [Google Scholar] [CrossRef]
  45. Granero, M.S.; Segovia, J.T.; Pérez, J.G. Some comments on Hurst exponent and the long memory processes on capital markets. Phys. A Stat. Mech. Its Appl. 2008, 387, 5543–5551. [Google Scholar] [CrossRef]
  46. Wu, Y.; Xu, Y. Assessing the Climate Tendency over the Yangtze River Delta, China: Properties, Dry/Wet Event Frequencies, and Causes. Water 2020, 12, 2734. [Google Scholar] [CrossRef]
  47. Li, M.; Cao, F.; Wang, G.; Chai, X.; Zhang, L. Evolutional Characteristics of Regional Meteorological Drought and Their Linkages with Southern Oscillation Index across the Loess Plateau of China during 1962–2017. Sustainability 2020, 12, 7237. [Google Scholar] [CrossRef]
  48. Torrence, C.; Compo, G.P. A practical guide to wavelet analysis. Bull. Am. Meteorol. Soc. 1998, 79, 61–78. [Google Scholar] [CrossRef]
  49. Ren, L.; Dong, X. Spatio-Temporal Characteristics of Drought and Its Relationship with El Niño-Southern Oscillation in the Songhua River Basin from 1960 to 2019. Water 2022, 14, 866. [Google Scholar] [CrossRef]
  50. Yang, X.; Wu, J.; Liu, J.; Ye, X. Changes of Extreme Precipitation and Possible Influence of ENSO Events in a Humid Basin in China. Atmosphere 2021, 12, 1522. [Google Scholar] [CrossRef]
  51. Jiang, Y.; Wang, Y. Numerical Simulation on the Formation of Mesoscale Vortex in Col Field. Acta Meteorol. Sin. 2012, 26, 112–128. [Google Scholar] [CrossRef]
  52. Wei, W.; Zhang, R.; Wen, M.; Rong, X.; Li, T. Impact of Indian summer monsoon on the South Asian High and its influence on summer rainfall over China. Clim. Dyn. 2014, 43, 1257–1269. [Google Scholar] [CrossRef]
  53. Xiong, L.; Yan, L.; Du, T.; Yan, P.; Li, L.; Xu, W. Impacts of climate change on urban extreme rainfall and drainage infrastructure performance: A case study in Wuhan City, China. Irrig. Drain 2019, 68, 152–164. [Google Scholar] [CrossRef]
  54. Doyle, M.W.; Havlick, D.G. Infrastructure and the environment. Annu. Rev. Environ. Resour. 2009, 34, 349–373. [Google Scholar] [CrossRef] [Green Version]
  55. Wei, C.; Dong, X.; Yu, D.; Liu, J.; Reta, G.; Zhao, W.; Kuriqi, A.; Su, B. An alternative to the Grain for Green Program for soil and water conservation in the upper Huaihe River basin, China. J. Hydrol. Reg. Stud. 2022, 43, 101180. [Google Scholar] [CrossRef]
  56. Skrobek, D.; Krzywanski, J.; Sosnowski, M.; Kulakowska, A.; Zylka, A.; Grabowska, K.; Ciesielska, K.; Nowak, W. Prediction of sorption processes using the deep learning methods (long short-term memory). Energies 2020, 13, 6601. [Google Scholar] [CrossRef]
  57. Sosnowski, M.; Krzywanski, J.; Ščurek, R. Artificial intelligence and computational methods in the modeling of complex systems. Entropy 2021, 23, 586. [Google Scholar] [CrossRef] [PubMed]
  58. Krzywanski, J.; Sztekler, K.; Bugaj, M.; Kalawa, W.; Grabowska, K.; Chaja, P.R.; Sosnowski, M.; Nowak, W.; Mika, Ł.; Bykuć, S. Adsorption chiller in a combined heating and cooling system: Simulation and optimization by neural networks. Bull. Pol. Acad. Sci. Tech. Sci. 2021, 69, e137054. [Google Scholar]
  59. Xiao, M.; Zhang, Q.; Singh, V.P. Influences of ENSO, NAO, IOD and PDO on seasonal precipitation regimes in the Yangtze River basin, China. Int. J. Clim. 2015, 35, 3556–3567. [Google Scholar] [CrossRef]
  60. Villafuerte, M.Q., II; Matsumoto, J.; Kubota, H. Changes in extreme rainfall in the Philippines (1911–2010) linked to global mean temperature and ENSO. Int. J. Clim. 2015, 35, 2033–2044. [Google Scholar] [CrossRef]
  61. Wang, Y.; Zhang, Q.; Singh, V.P. Spatiotemporal patterns of precipitation regimes in the Huai River basin, China, and possible relations with ENSO events. Nat. Hazards 2016, 82, 2167–2185. [Google Scholar] [CrossRef]
  62. Agilan, V.; Umamahesh, N.V. El Nino Southern Oscillation cycle indicator for modeling extreme rainfall intensity over India. Ecol. Indic. 2018, 84, 450–458. [Google Scholar] [CrossRef]
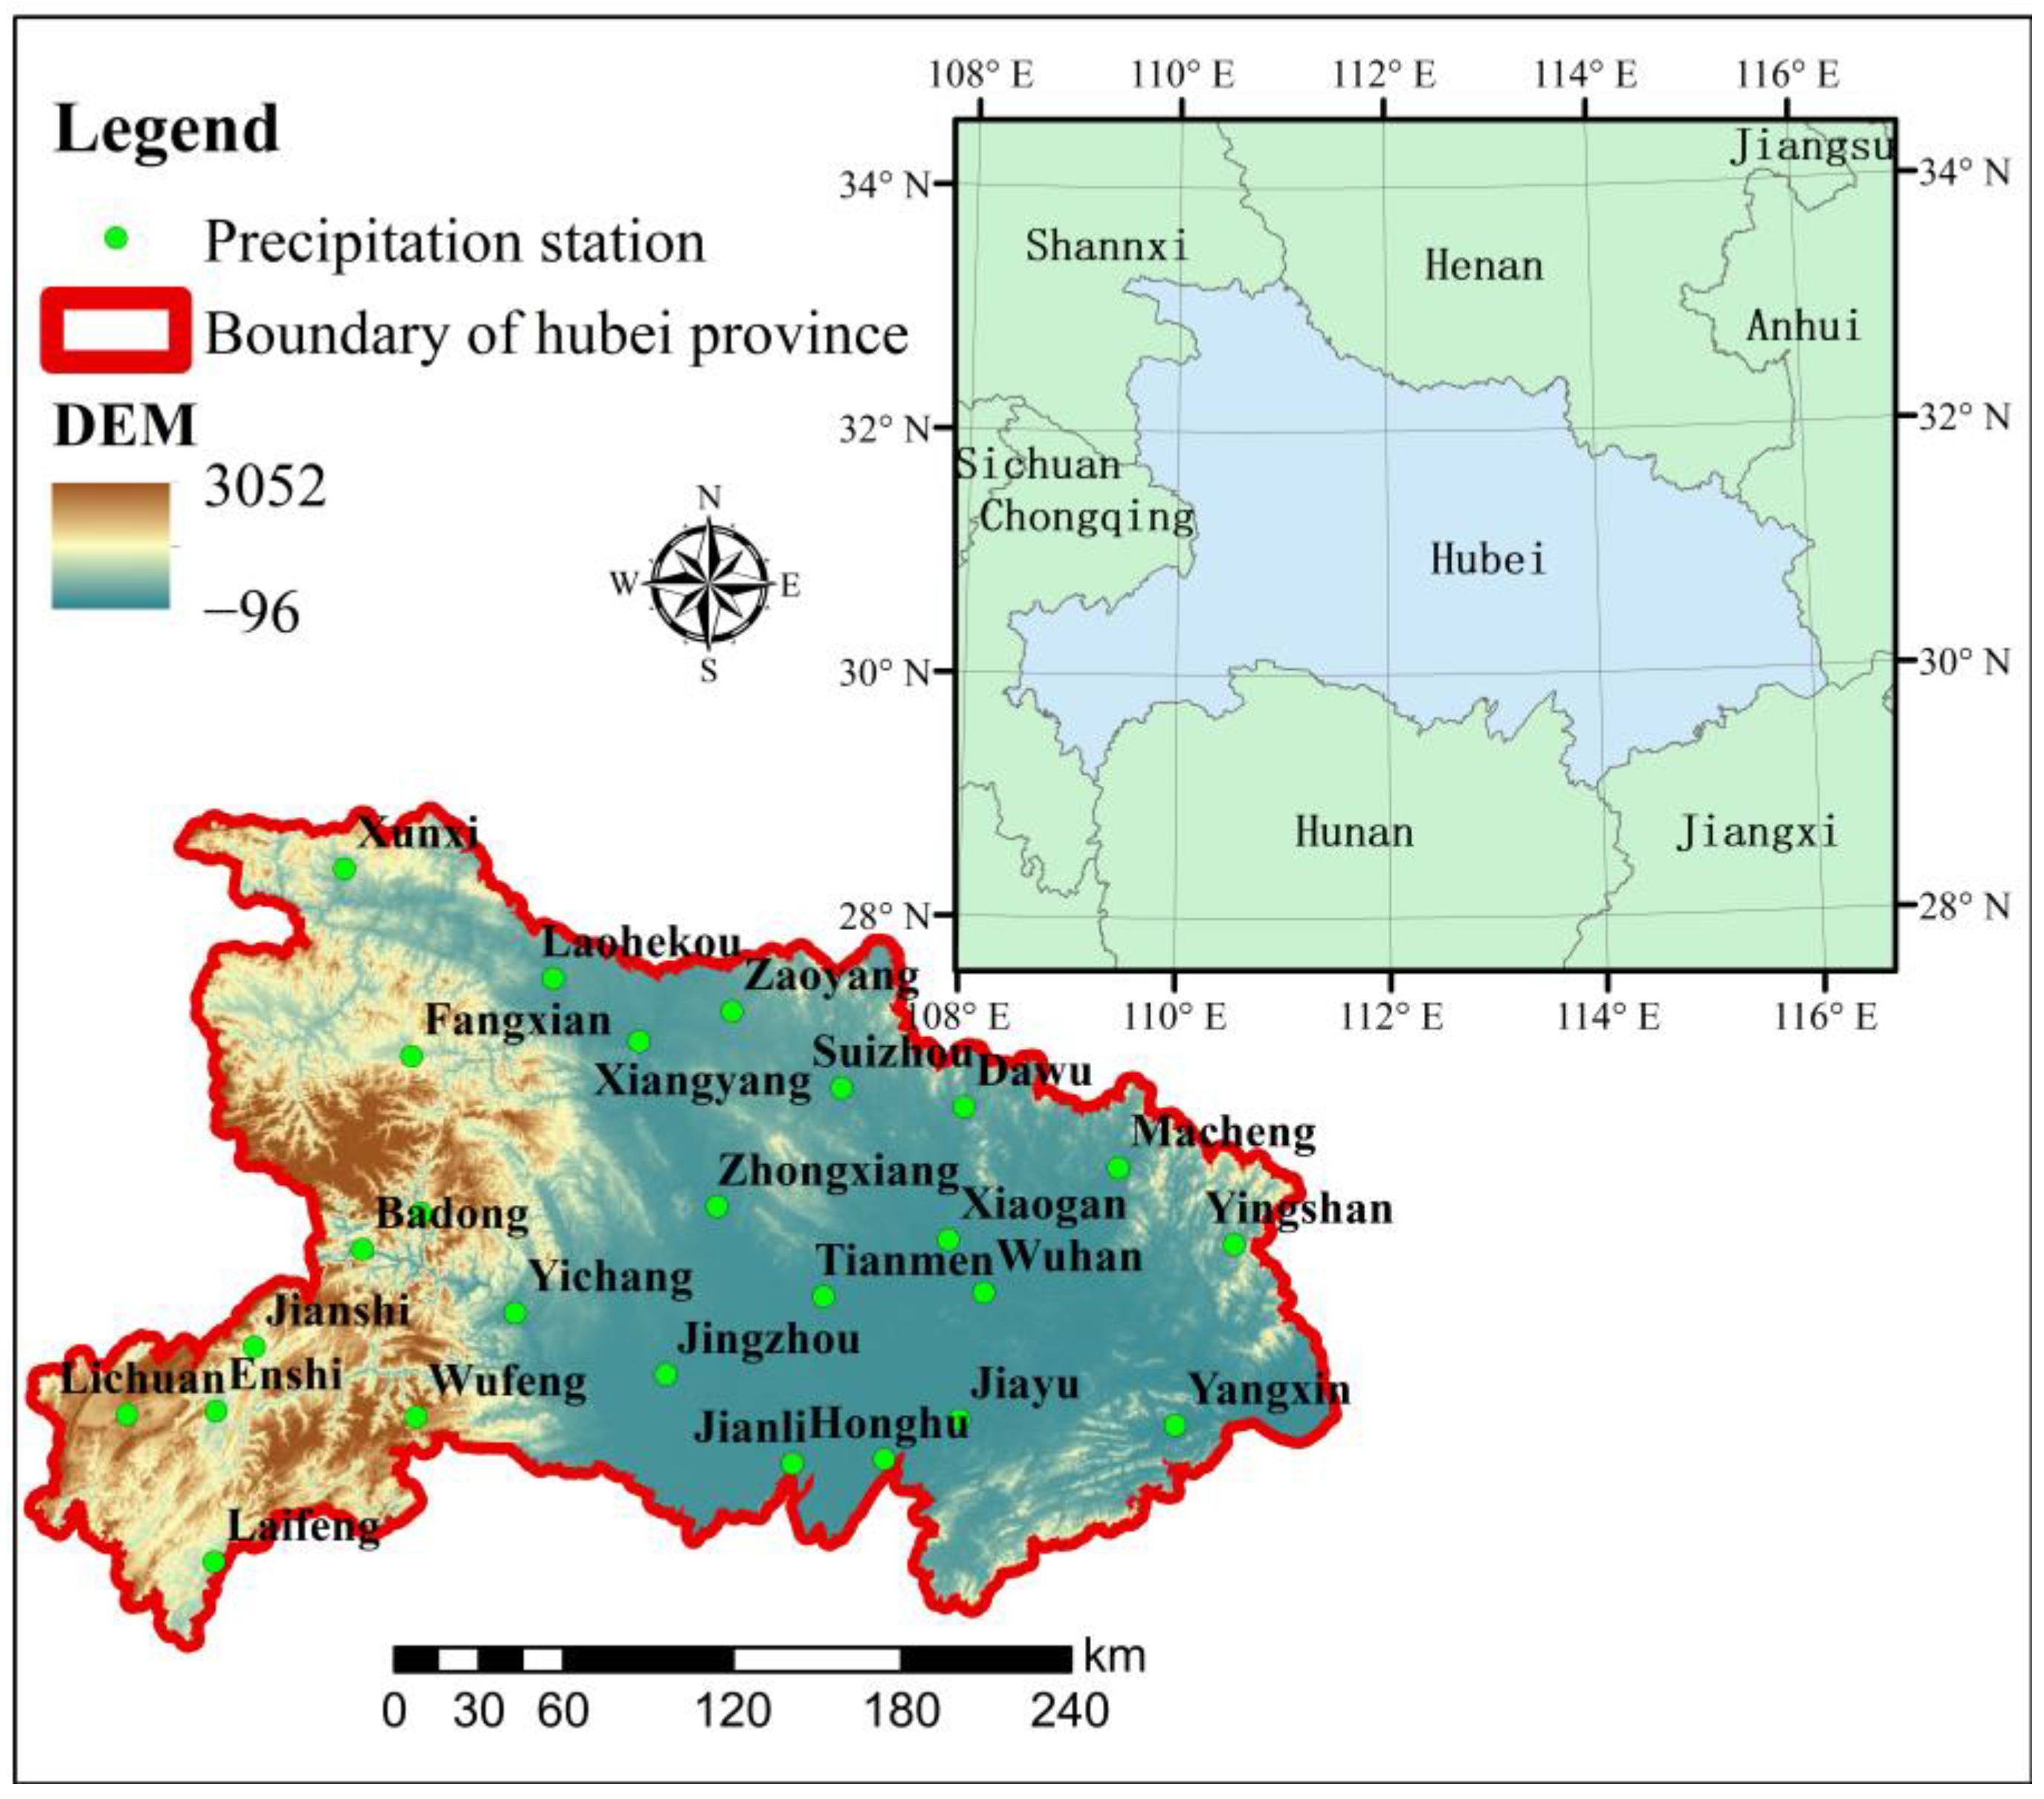
Figure 1. Overview of the Hubei province, China.
Atmosphere 13 01922 g001
Figure 2. Trend and 10a average value of EPIs within Hubei province on the annual scale during 1960–2019.
Atmosphere 13 01922 g002
Figure 3. Moving T-test for each EPI within Hubei province on the annual scale during 1960–2019.
Atmosphere 13 01922 g003
Figure 4. Spatial variations of annual average EPIs and the changing trend of annual EPIs for each station within the Hubei province.
Atmosphere 13 01922 g004
Figure 5. Trend and 10a average value of EPIs within Hubei province in spring during 1960–2019.
Atmosphere 13 01922 g005
Figure 6. Trend and 10a average value of EPIs within Hubei province in summer during 1960–2019.
Atmosphere 13 01922 g006
Figure 7. Moving T-test for each EPI within Hubei province in spring during 1960–2019.
Atmosphere 13 01922 g007
Figure 8. Moving T-test for each EPI within Hubei province in summer during 1960–2019.
Atmosphere 13 01922 g008
Figure 9. Spatial variations of spring average EPIs and the changing trend of spring EPIs for each station within Hubei province.
Atmosphere 13 01922 g009
Figure 10. Spatial variations of summer average EPIs and the changing trend of spring EPIs for each station within Hubei province.
Atmosphere 13 01922 g010
Figure 11. Correlations between the MEI and EPIs on a yearly scale. A bold black contour represents the 95 percent significance threshold against red noise; a thin black line represents the cone of influence (COI) and bold arrows reflect phase change.
Atmosphere 13 01922 g011
Figure 12. The annual EPIs and El Niño and La Niña years from 1960 to 2019 in Hubei province.
Atmosphere 13 01922 g012
Table 1. Descriptions of the meteorological stations within Hubei province.
No.Station NameLongitudeLatitudeElevationNo.Station NameLongitudeLatitudeElevation
1Xunxi33°00′110°25′249 m14Enshi30°17′109°28′457 m
2Fangxian32°02′110°46′427 m15Wufeng30°12′110°40′620 m
3Laohekou32°23′111°40′90 m16Yichang30°42′111°18′133 m
4Xiangyang32°02′112°10′70 m17Jingzhou30°21′112°09′32 m
5Zaoyang32°09′112°45′125 m18Xiaogan30°54′113°57′24 m
6Badong31°02′110°22′334 m19Tianmen30°40′113°10′34 m
7Xingshan31°14′110°46′252 m20Wuhan30°37′114°08′23 m
8Zhongxiang31°10′112°34′66 m21Laifeng29°31′109°25′460 m
9Suizhou31°43′113°23′86 m22Jianli29°50′112°54′31 m
10Dawu31°34′114°07′102 m23Honghu29°49′113°27′24 m
11Macheng31°11′115°01′60 m24Jiayu29°59′113°55′36 m
12Lichuan30°17′108°56′1086 m25Yingshan30°44′115°40′124 m
13Jianshi30°36′109°43′559 m26Yangxin29°51′115°12′42 m
Table 2. Definition of each extreme precipitation indices.
Type of IndicesName of IndicesAbbreviationDefinition
Persistence indicesContinued drought days/dCDDMaximum number of continued days when precipitation < 1 mm
Continued wet days/dCWDMaximum number of continued days when precipitation > 1 mm
Adiabatic indicesNumber of heavy rain days/dR10Annual count when precipitation ≥ 10 mm
Number of very heavy rain days/dR20Annual count when precipitation ≥ 20 mm
Annual total precipitation/mmPRCPTOTAnnual total precipitation when daily precipitation ≥ 1 mm
Relative indicesVery wet days/mmR95pAnnual total precipitation from days > 95th percentile
Extremely wet days/mmR99pAnnual total precipitation from days > 99th percentile
Intensity indicesMax-1-day precipitation amount/mmRX1dayMaximum 1-day precipitation
Max-5-day precipitation amount /mmRX5dayMaximum continued 5-day precipitation
Simple daily intensity index/(mm/d)SDIIThe ratio of annual total precipitation to the number of wet days ≥ 1 mm
Table 3. Statistic of change trend of each EPI within Hubei province on the annual scale during 1960–2019.
EPIAverage ValueChange Rate/per Yearp Value for F-TestHurst ValueFuture Trend
PRCPTOT1124.08 mm−0.21360.860.44Up
RX1day95.75 mm0.05110.660.43Down
RX5day152.83 mm−0.11510.610.37Up
R2015.86 day0.00720.750.36Down
R1032.45 day−0.02140.530.43Up
SDII12.56 mm0.00540.590.49Down
CDD29.11 day−0.03310.420.51Down
CWD6.23 day−0.01390.030.68Down
R95p660.36 mm0.30650.650.51Up
R99p219.43 mm0.13440.580.51Up
Table 4. Statistic of change trend of each EPI within Hubei province in spring during 1960–2019.
EPIAverage ValueChange Rate/per Yearp Value for F-TestHurst ValueFuture Trend
PRCPTOT319.55 mm−0.30780.550.54Down
RX1day54.27 mm0.03890.610.57Up
RX5day84.04 mm−0.02240.850.59Down
R204.67 day0.00100.910.55Up
R1010.26 day−0.01650.360.59Down
SDII11.52 mm0.01780.110.53Up
CDD12.29 day0.00850.630.53Up
CWD4.49 day−0.01370.060.59Down
R95p143.23 mm0.09510.590.47Down
R99p54.27 mm0.03890.610.57Up
Table 5. Statistic of change trend of each EPI within Hubei province in summer during 1960–2019.
EPIAverage ValueChange Rate/per Yearp Value for F-TestHurst ValueFuture Trend
PRCPTOT477.52 mm0.41820.650.67Up
RX1day87.96 mm0.06780.600.56Up
RX5day142.79 mm−0.05600.820.49Up
R207.61 day0.00880.570.66Up
R1012.77 day0.00630.770.74Up
SDII17.70 mm0.01480.410.56Up
CDD13.92 day−0.02990.120.80Down
CWD4.68 day−0.00750.300.48Up
R95p232.27 mm0.21510.510.61Up
R99p87.96 mm0.06780.600.56Up
Publisher’s Note: MDPI stays neutral with regard to jurisdictional claims in published maps and institutional affiliations.