Article

Assessment of Two Drought Indices to Quantify and Characterize Drought Incidents: A Case Study of the Northern Part of Burundi

1
College of Hydraulic Science and Engineering, Yangzhou University, Yangzhou 225009, China
2
Department of Geography Bujumbura, Burundi University, Bujumbura P.O. Box 5142, Burundi
*
Author to whom correspondence should be addressed.
Atmosphere 2022, 13(11), 1882; https://doi.org/10.3390/atmos13111882
Submission received: 25 September 2022 / Revised: 28 October 2022 / Accepted: 2 November 2022 / Published: 11 November 2022
(This article belongs to the Section Climatology)

Abstract

:
Droughts are natural catastrophes that cost the health and wealth of humans due to their harmful effects on the natural environment, ecology, hydrology, and agriculture in particular. Droughts are recurring incidents that last for prolonged periods of time in the northern part of Burundi. Despite the region being prone to drought and often suffering from dry conditions, drought has not been widely investigated. For the quantification and characterization of dryness conditions, this research utilized two drought indices, the Standardized Precipitation Evapotranspiration Index (SPEI) and the Standardized Precipitation Index (SPI), at 2-, 6-, 24-, and 48-month timescales, where 2-, 6-, 24-, and 48-months correspond to agricultural and hydrological droughts, respectively. The two drought indices were compared, and the difference between SPEI and SPI was illustrated by quantifying and characterizing drought incidents. The findings revealed that different types of droughts threatened the northern part of Burundi during the periods of 1993–2000 and 2002–2009. Both indices illustrated that 2005, 2006, and 2007 were extremely dry years. The drought incidents detected by the SPEI index were classified into moderate and severe categories, characterized by long duration and greater magnitude. In contrast, the drought incidents detected by SPI were classified into the “extremely dry” category, characterized by limited duration and lower magnitude but with higher intensities. This research highlighted that SPEI differs from SPI in quantifying and characterizing droughts and highly suggests the use of both SPEI and SPI when assessing droughts. The outcome of this study will be useful in drought prevention and mitigation strategies across Burundi, specifically for agricultural purposes.

1. Introduction

Drought is one of the greatest natural catastrophes, and its effects on both human societies and the environment are greater than any other natural disaster [1]. Drought harms humanity directly or unintentionally through food insecurity, conflicts among individuals or communities, economic losses, and diseases [2,3]. Since drought can develop gradually and softly [4,5], it can be difficult to identify its exact onset and end, unlike many natural disasters that hit the region and have immediate and noticeable consequences, such as floods, landslides, earthquakes, and windstorms. It is indispensable to capture the onset of drought within a week for better extension forecasts that describe changes in drought situations over a sub-seasonal timescale [6] because duration and severity are the characteristics of drought that significantly influence adaptability and preparation for drought [7]. Various drought indexes have been introduced in the academic literature [8,9], however, the Standardized Precipitation Index (SPI) and Palmer Drought Severity Index (PDSI) have been the most widely used worldwide [10,11]. SPI is a simplified index that requires one single parameter, precipitation, while the PDSI integrates different variables such as moisture supply, evaporation, precipitation, and runoff. In recent decades, the Standardized Precipitation Evapotranspiration Index (SPEI), pioneered by Vicente-Serrano et al. [12], has needed two input variables: precipitation, and temperature, which have received more attention in monitoring and the assessment of drought [13,14,15,16]. Droughts are a frequent and recurring event in Eastern Africa, particularly in Burundi, with harmful implications for agricultural production, socio-economic activities, and the natural environment [17]. Even though the northern and northeastern regions of Burundi are susceptible to droughts and continue to suffer from their consequences, the country lacks essential management tools for monitoring and predicting drought phenomena. A significant number of the region’s residents are entirely reliant on rain-fed agriculture for sustenance. In addition to agricultural irrigation water demand, the region’s water resources are under increased pressure because of rapid population growth, development projects, and the expansion of cities [18]. Therefore, it is crucial to have sufficient drought monitoring and analysis tools available that can accurately generate reliable information for the assistance of decision-makers at all levels and in all sectors of the country for better management of water resources. The northern part of Burundi has a considerable impact on Burundi’s economy due to its agricultural production of coffee and tea, which are the main income generators for many farmers, and the hydropower station at Rwegura, which provides electricity for many cities across Burundi. Many Burundians who live in the northern part, such as those who live in other parts of Burundi, rely on natural resources [19], especially water resources, for different purposes, for instance industrialization, agriculture, mining, and daily life. Even though the region is strongly dependent on water resources, the region is threatened by natural climatological variabilities, which are exacerbated by a changing climate, therefore intensifying the occurrence of extremely dry incidents and leading to the occurrence of different types of droughts. Many researchers have employed SPI across East Africa and Burundi in particular [20,21,22,23], and Uwimbabazi et al. [24] used both SPEI and SPI to examine changes in meteorological drought in Rwanda, and the overall analysis of the study highlighted the characteristics of SPEI and illustrated that Rwanda is less disposed to severe and extreme drought incidents than moderate drought events. In the meantime, other studies illustrated the influence of evapotranspiration on drought [25] and the robustness of the SPEI index [14]. Due to global warming and the coincidence of an increase in temperature [26], evapotranspiration significantly influences the conditions of drought. For quantification and characterization of drought, the incorporation of evapotranspiration might consider the impact of other parameters such as temperature, relative humidity, wind speed, and solar radiation. Then, using both evapotranspiration and precipitation parameters to quantify and characterize drought incidents may generate more reliable characteristics of drought compared to precipitation alone [27], since the formulations of the SPEI and SPI indexes differ [28,29]. This research aimed at comparing SPEI and SPI illustrates their performance in quantifying and characterizing droughts. This is the first study that evaluates the performance of drought indices in the assessment, quantification, and characterization of drought incidents over the northern part of Burundi. It will provide information that aids decision-makers in better managing water resources across the region and executing policies and strategies for drought risk management and drought mitigation.

2. Study Area and Methods

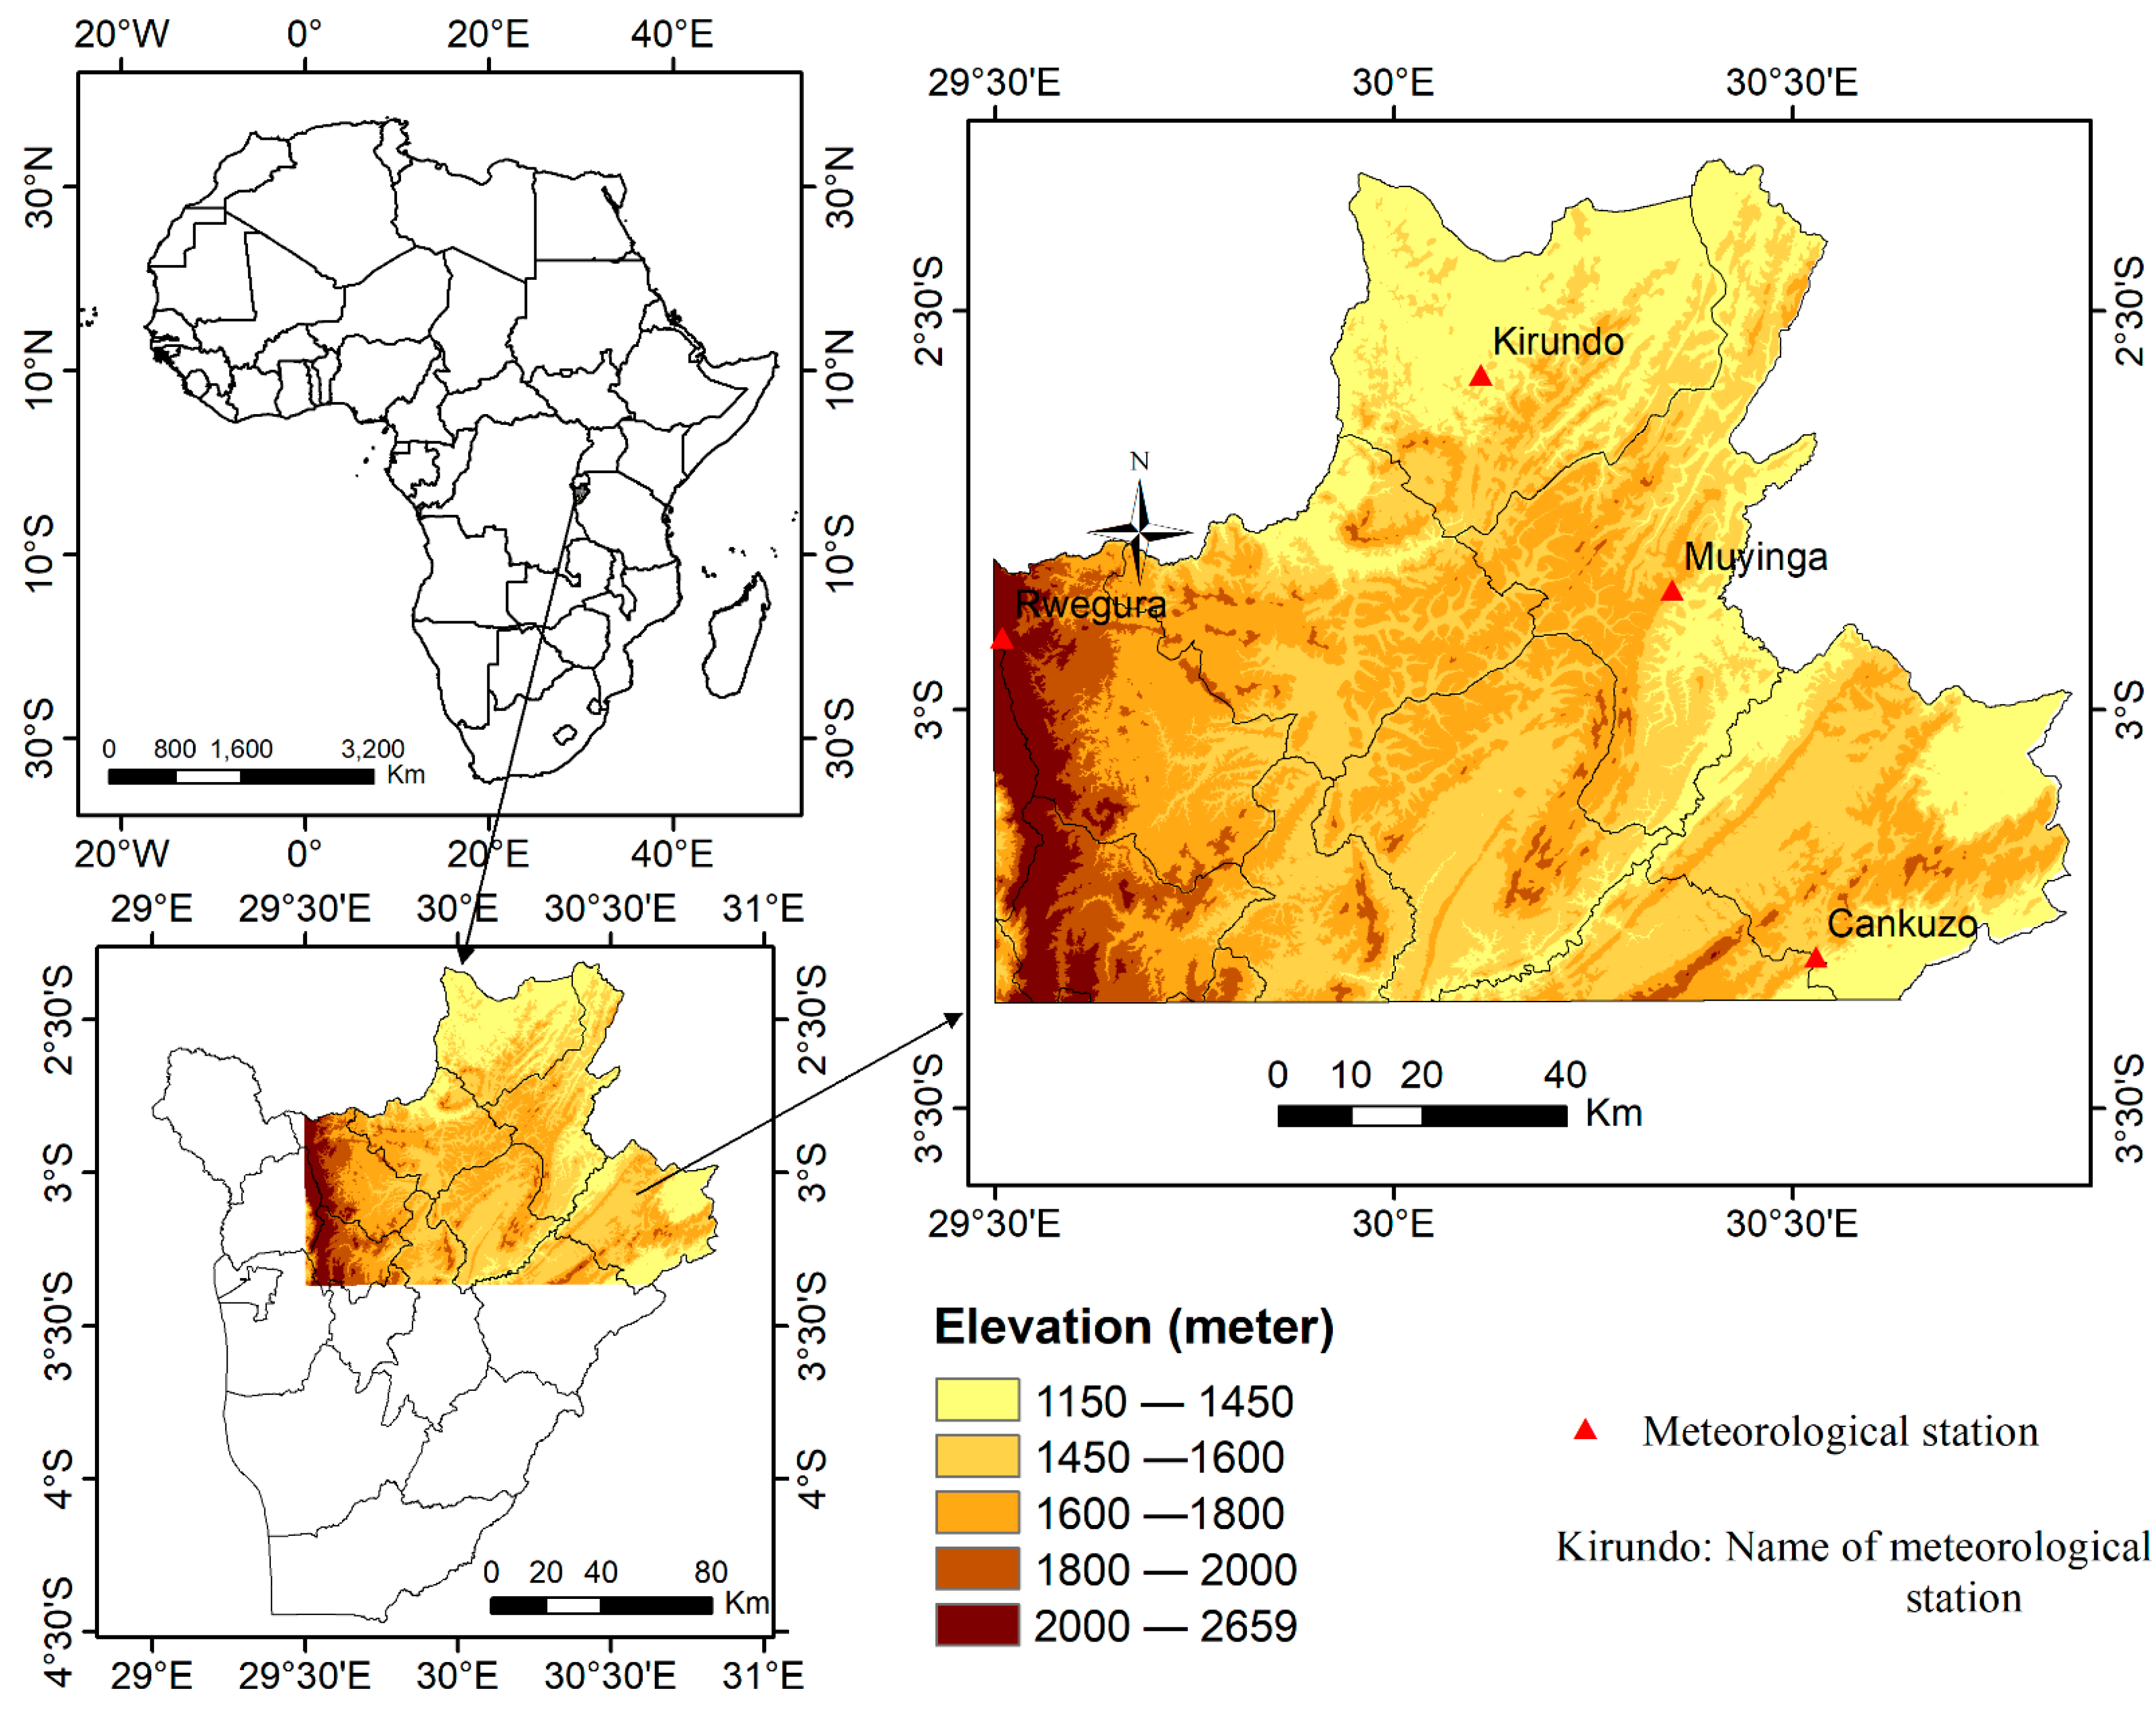
2.1. The Study Area’s Description and Datasets

Burundi is one of the landlocked countries covering 27,834 km2, situated in the central-east of Africa that lies between 2.3° and 4.45° south latitude and 28.8° and 30.9° east longitude, sharing borders with Tanzania from the east to the south, Rwanda to the north, and the Democratic Republic of the Congo (DRC) to the west.
The northern part of Burundi plays a significant role in the economy of Burundi due to its agricultural production, especially the production of tea, coffee, and beans.
The northern part of Burundi is composed of many provinces (Figure 1). It is defined by latitude 2°30′–3°30′ S and longitude 29°30′–30°30′ E. The climate differs depending on the topography. As a result, the northern part, a mountainous and plateau region, benefits from the Congo–Nile Ridge zone rainfall, where precipitation ranges from 1400 to 1600 mm and above. The study domain benefits from a tropical climate because of Burundi’s special geographic location in the equatorial band. The Inter-Tropical Convergence Zone (ITCZ) crosses Burundi twice a year and is a major factor in determining precipitation seasonality [30]. Similar to the entire country of Burundi, the northern part of Burundi is normally characterized by four distinct seasons classified into A, B, C, and D seasons [31]. Season A runs for four months: September, October, November, and December (SOND), widely known as the short rain season. Season B runs for three months: March, April, and May (MAM), which is typically regarded as the longest rainy season. Both rain seasons are separated by season C, which runs from June to August (JJA), and season D, which runs in mid-January and February (JF), known as the shortest dry season. The region is extremely densely populated, and approximately 90% of the population settles in countryside areas involved in agropastoral activities [32]. The study used meteorological data (monthly average precipitation and maximum and minimum temperatures) ranging from January 1981 to December 2020 (Table 1). The data was obtained from the Burundi Geographical Institute (IGEBU). Four meteorological stations (Muyinga, Kirundo, Cankuzo, and Rwegura) were purposely considered based on the availability of both precipitation and temperature data that are required for the computation of the SPEI and SPI indices to analyze and assess the characteristics of drought. Within these selected meteorological stations, no missing data could significantly disturb the analysis, and the missing data were filled under the linear mean. The IGEBU processed the initially observed data through standard quality control.

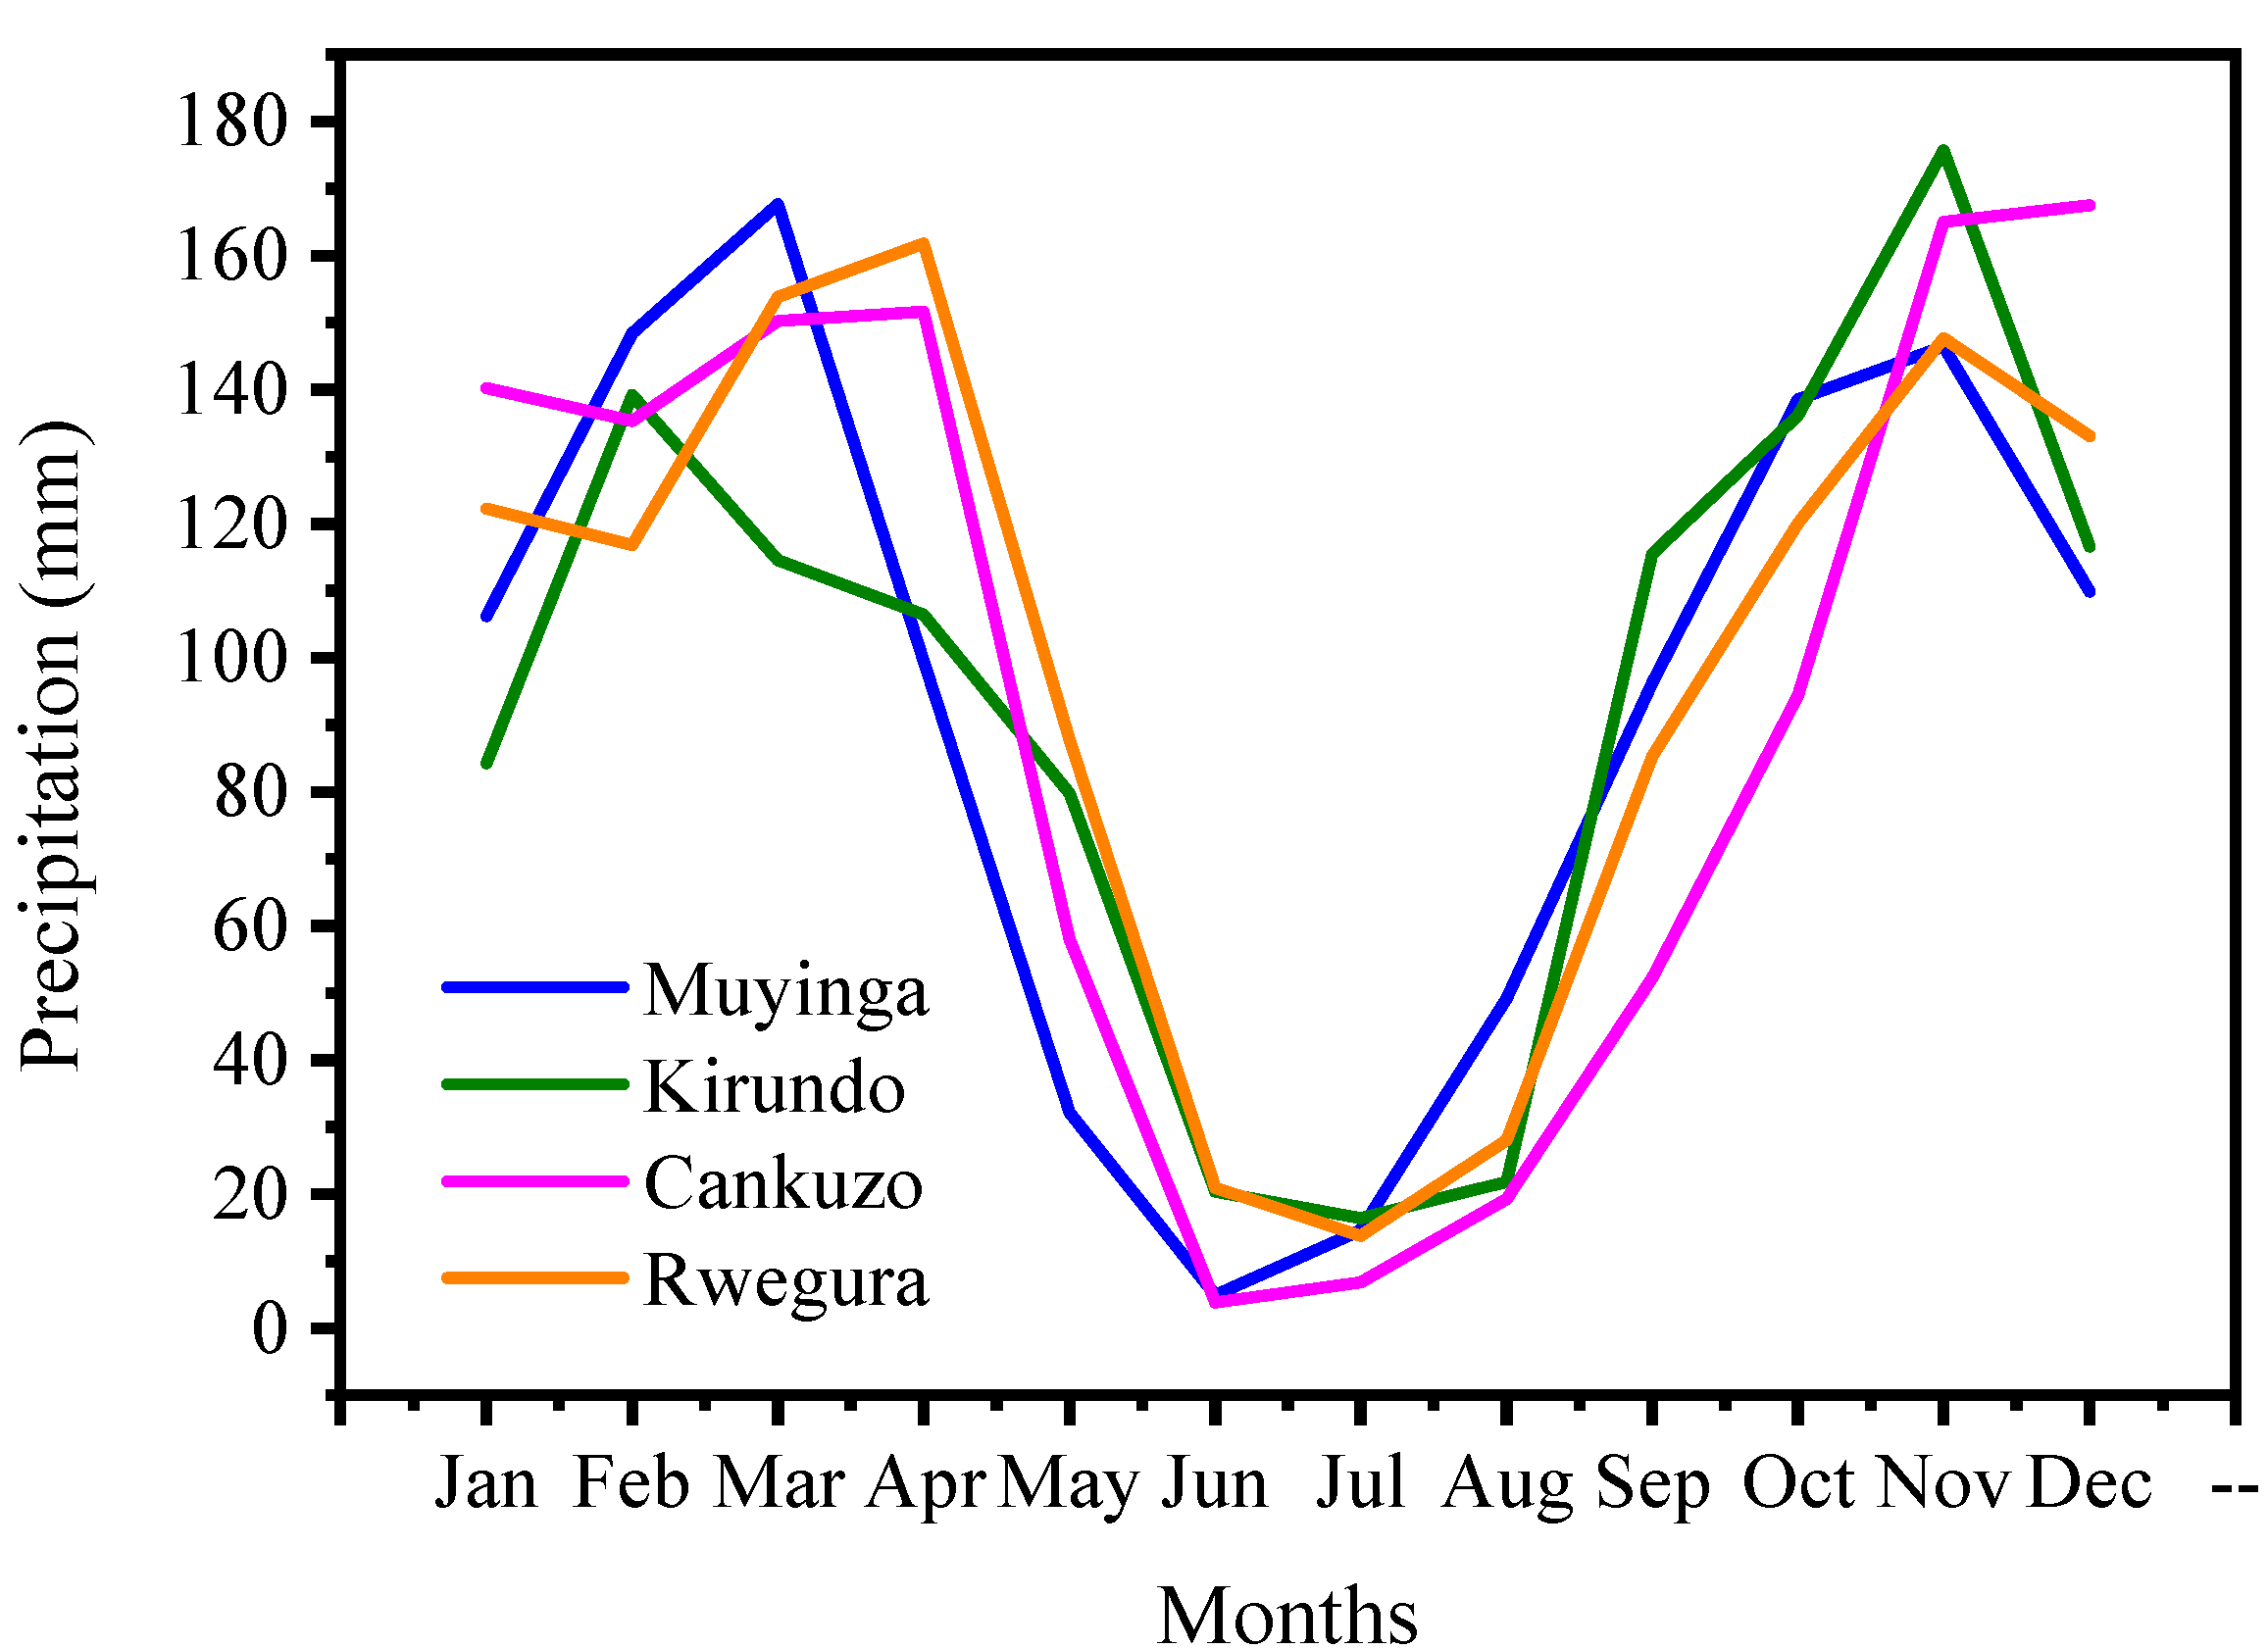
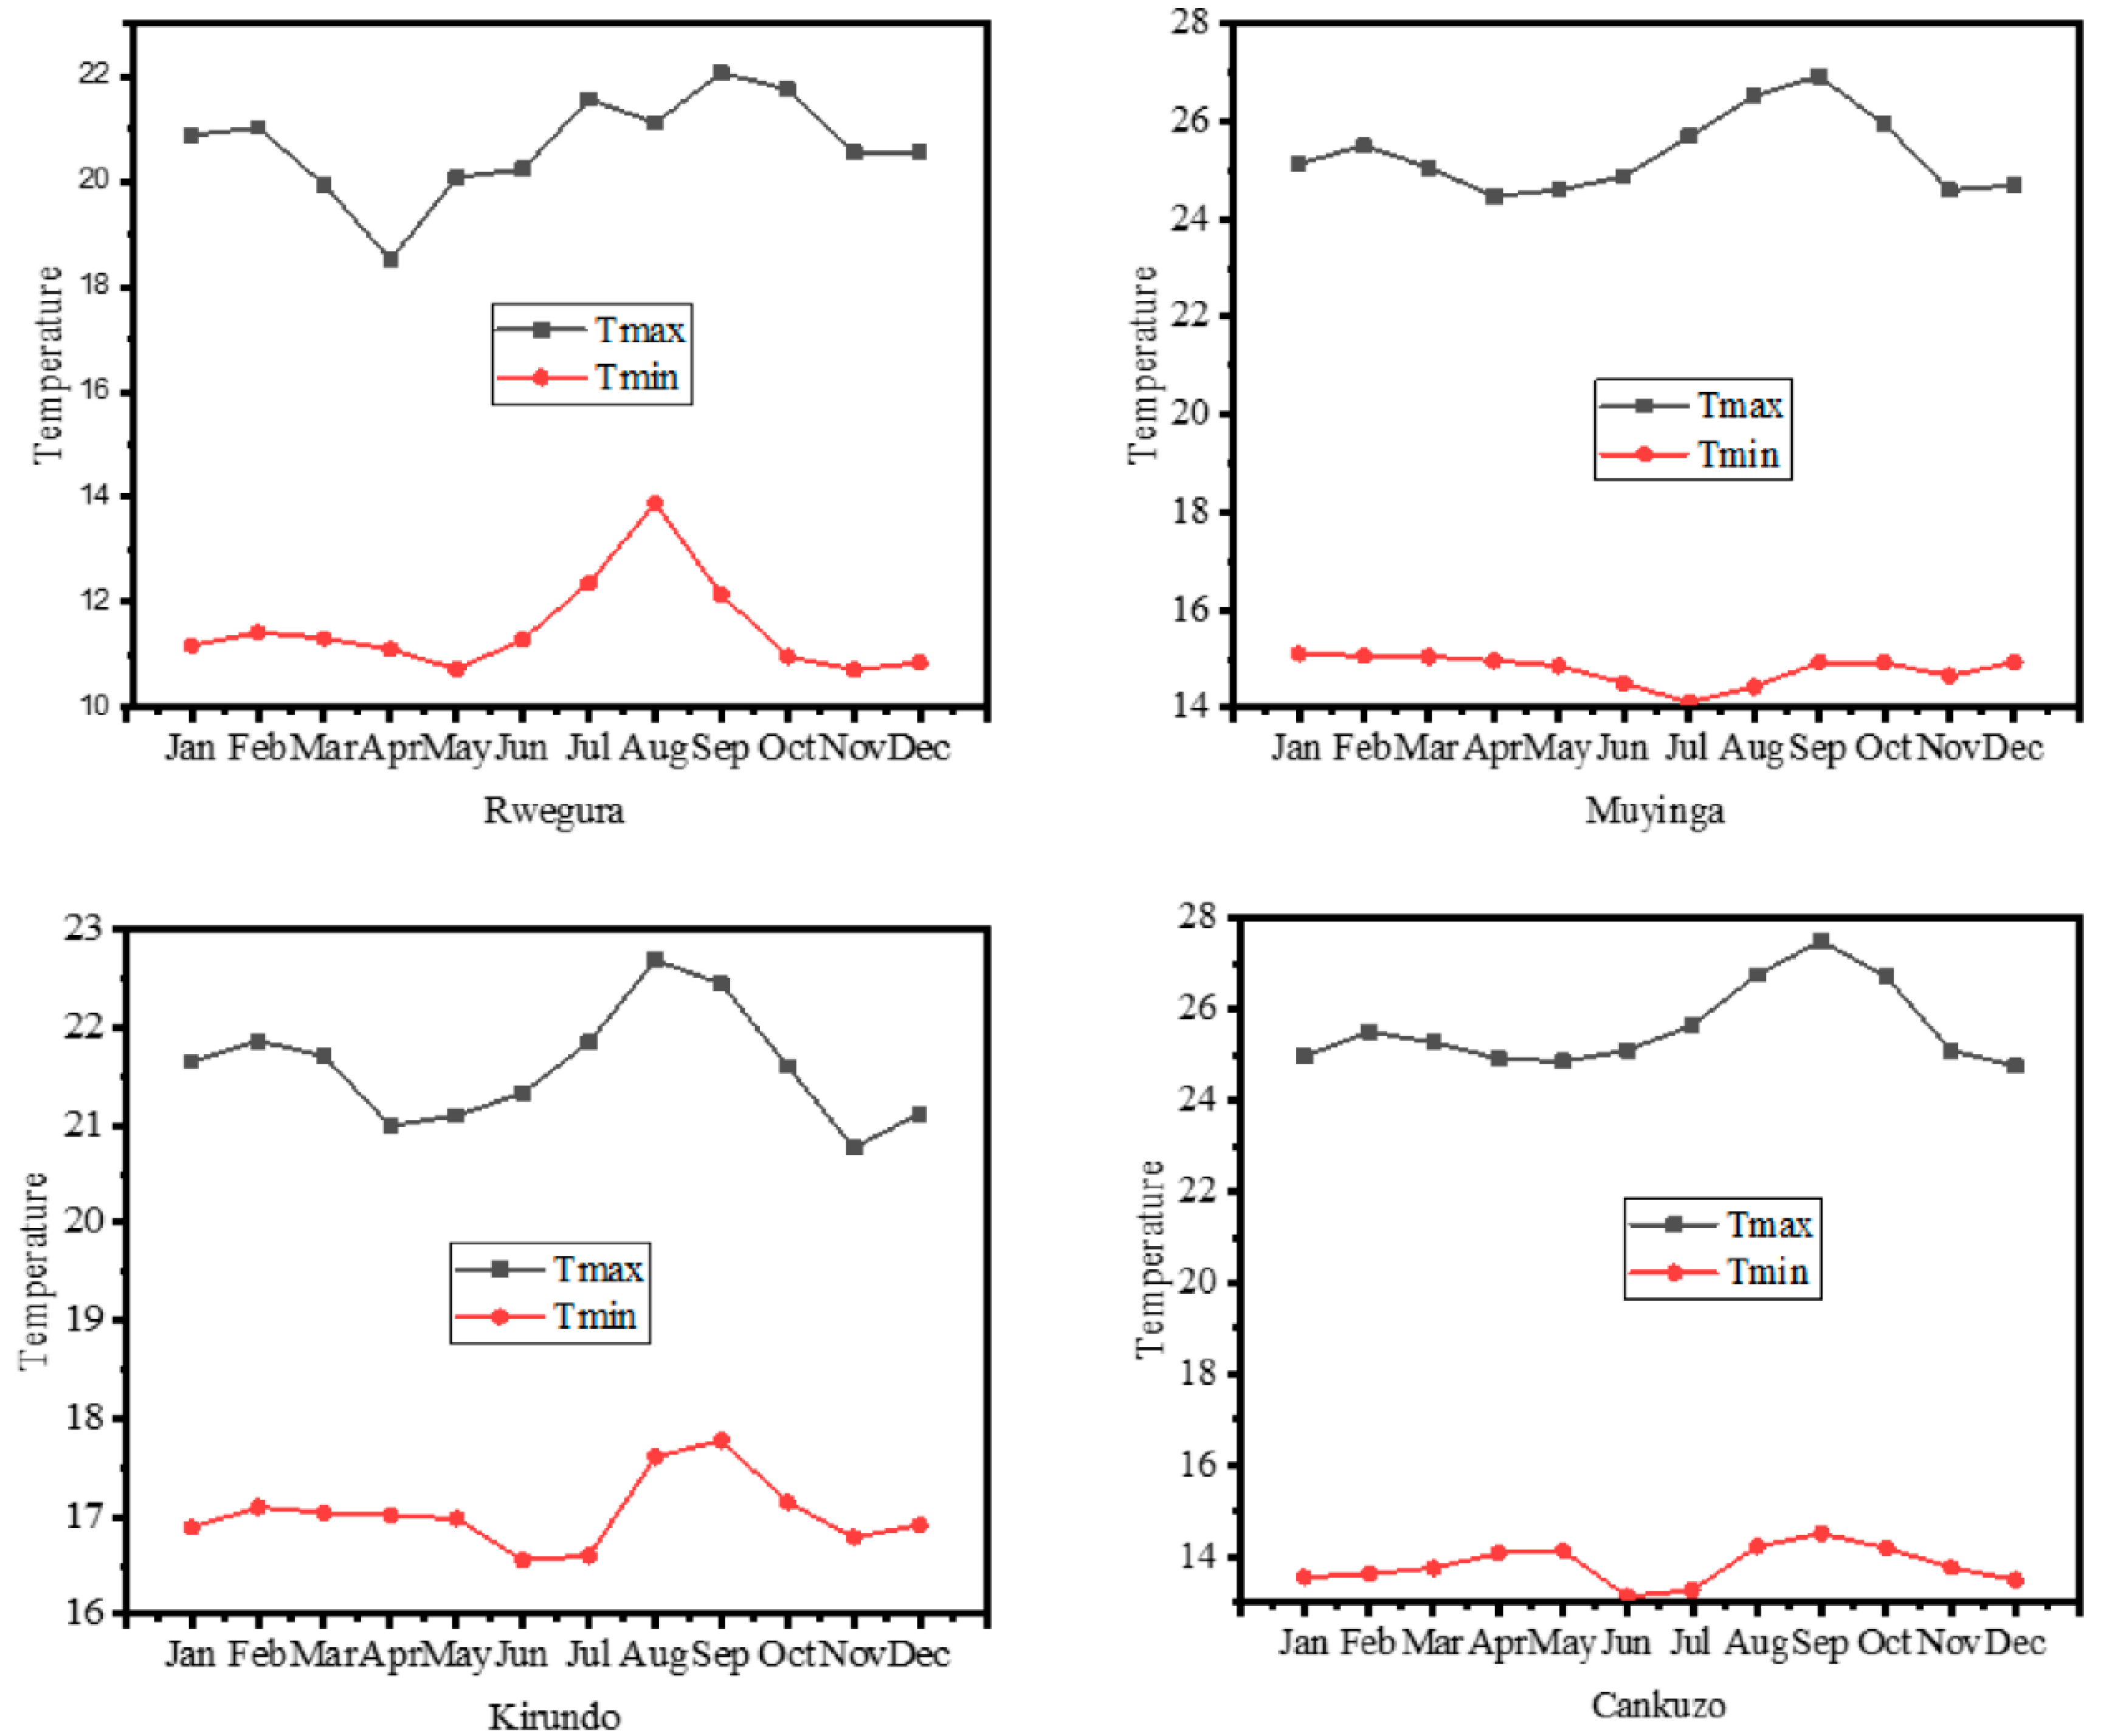
2.2. Climate and Topography

The research domain is located in the mountainous and plateau regions, which are among the highest altitudes in the country. It comprises the central plateau and the northern part of the Congo–Nile Ridge. The altitudes range from 2000 to 2300 m. The northern and eastern parts of the country are prone to drought in contrast to the western parts, where floods frequently occur [33]. In the area of focus, the average temperature varies between 11 and 21 °C. The region’s precipitation varies between 1300 and 1600 mm, and the dry season runs between three and four months. Figure 2 and Figure 3 present the annual mean precipitation and the maximum and minimum average temperatures, respectively.

3. SPEI and SPI Indices of Drought

The SPEI and SPI were compared and used to identify, characterize, and quantify drought incidents. The analyses were carried out at various timescales (2, 6, 24, and 48 months) from 1981 to 2020. The 2-, 6-, 24-, and 48-month timescales correspond to agriculture based on the fact that most cultivated plants need 2 to 6 months to fully develop and hydrological droughts, respectively [34]. Monitoring drought at different timescales enables the identification of short-term wet periods within long-term droughts and dry spells within long-term wet periods [35,36]. The SPEI and SPI were calculated utilizing the SPEI package found in the R software version 4.1.0 (Auckland, New Zealand, Robert Gentleman and Ross Ihaka) [12,37]. The SPEI package offers various options for generating SPEI and SPI values.

3.1. SPI

The SPI is a major meteorological drought calculation tool. Due to its simplicity and effectiveness in quantifying, identifying, and assessing meteorological drought, the SPI is a well-known and widely used indicator. To begin, SPI, as introduced by Mckee et al. [10], enables the detection and monitoring of various drought variables such as frequency, intensity, and duration over time in a specific region. The use of the SPI to measure drought changes linked to climate variations has gotten a lot of attention in many regions of the world [38,39,40,41]. It has been recommended by the World Meteorological Organization (WMO) as one of the best tools for monitoring drought incidents. It shall be recalled that a drought event begins when the SPI value reaches –1.0 and ends when the SPI value returns to positive again; therefore, monthly rainfall data is collected, and time series are created in order to calculate this index. In this study, SPI values are generated utilizing the following equation:
S P I   value   = X i X ¯ σ
where X i represents precipitation of the particular month, X ¯ represents the longest mean precipitation, and σ represents the standard deviation for the determined period.

3.2. SPEI

The SPEI, an evolution of the well-established SPI recognized by the World Meteorological Organization (WMO), was first developed by Vicente et al. [12]. It is based on precipitation and potential evapotranspiration (PET) input data to calculate climatic water balance, which makes it different from SPI. The SPEI index has been widely used to monitor drought/flood conditions [14,42,43,44,45,46,47], and for instance, ref. [48,49] conducted a study to examine dry and wet conditions in Kenya from 1981 to 2016. Their study highlighted the good performance and effectiveness of SPEI in detecting dry and wet conditions. It is calculated using monthly precipitation and air temperature. The climatic water balance equation is as follows:
D i = P i P E T i
where P and P E T denote rainfall and potential evapotranspiration, respectively, D denotes the difference between P and P E T , and i denotes the number of months counted. Several methods have been introduced to calculate PET and some researchers have compared the effectiveness of those methods [49,50]. The Hargreaves method, which does not have the fundamental limits of the Thornthwaite method and whose performance is nearly comparable to the criteria of the FAO Penman-Monteith (PM) methods, was utilized for the calculation of PET [37,42,51].
The determination of the cumulative difference between precipitation and PET at various timescales (2-, 6-, 24-, 48-month) is as follows:
X s , j n = t = 13 n + j 12 D s 1 , t + t = 1 j D s , j   if   j n X s , j n = s = j n + 1 j D s , j   if   j n
where X s , j n represents the accumulations of the difference between P and P E T  at the n-month timescale during the j-month of the s-th year and  D s ,   t is the difference between monthly precipitation and PET in the t-month of the s-th year.
Due to the fact that the original may contain negative values, the SPEI utilizes the three parameters of log-logistic probability distribution proposed by [12]. For the data sequences of all timescales, the cumulative function of the log-logistic probability distribution F G is presented as:
F G = 1 + α g γ β 1
where α ,   β ,   and   γ represent the scale, shape, and locality parameters, respectively. The calculation can be done utilizing the equations introduced by [12].
The probability of a definite X s , j n value is p .
p = 1 F G
If p ≤ 0.5,
w = 2 l n p
S P E I = W C 0 + C 1 W + C 2 W 2 1 + d 1 W + d 2 W 2 + d 3 W 3
If p > 0.5
w = 2 l n 1 p
S P E I = W C 0 + C 1 W + C 2 W 2 1 + d 1 W + d 2 W 2 + d 3 W 3
where C 0 = 2.515517, C 1 = 0.802853, C 2 = 0.010328, d 1 = 1.432788, d 2   = 0.189269, and d 3 = 0.001308 [12,52,53].
The generated values of SPEI and SPI are categorized in Table 2 and are utilized to evaluate the condition of dryness across the study area in terms of drought characteristics such as frequency, durability, severity, and intensity. The number of consecutive months during which SPEI and SPI values are equal to or less than a thresholding level. In this research, the criterion for the indication of dry incidents is when both SPEI and SPI values ≤ −1. See Table 2.
The severity (S) is the accumulative sum of the index values across the time of the event. The intensity (I) of an incident is obtained from the division of its severity by the time. Incidents with short periods and significantly larger severities will always have higher intensities. The calculation is as follows:
S = i = 1 T i m e I n d e x
I = S e v e r i t y T i m e

4. Results and Discussion

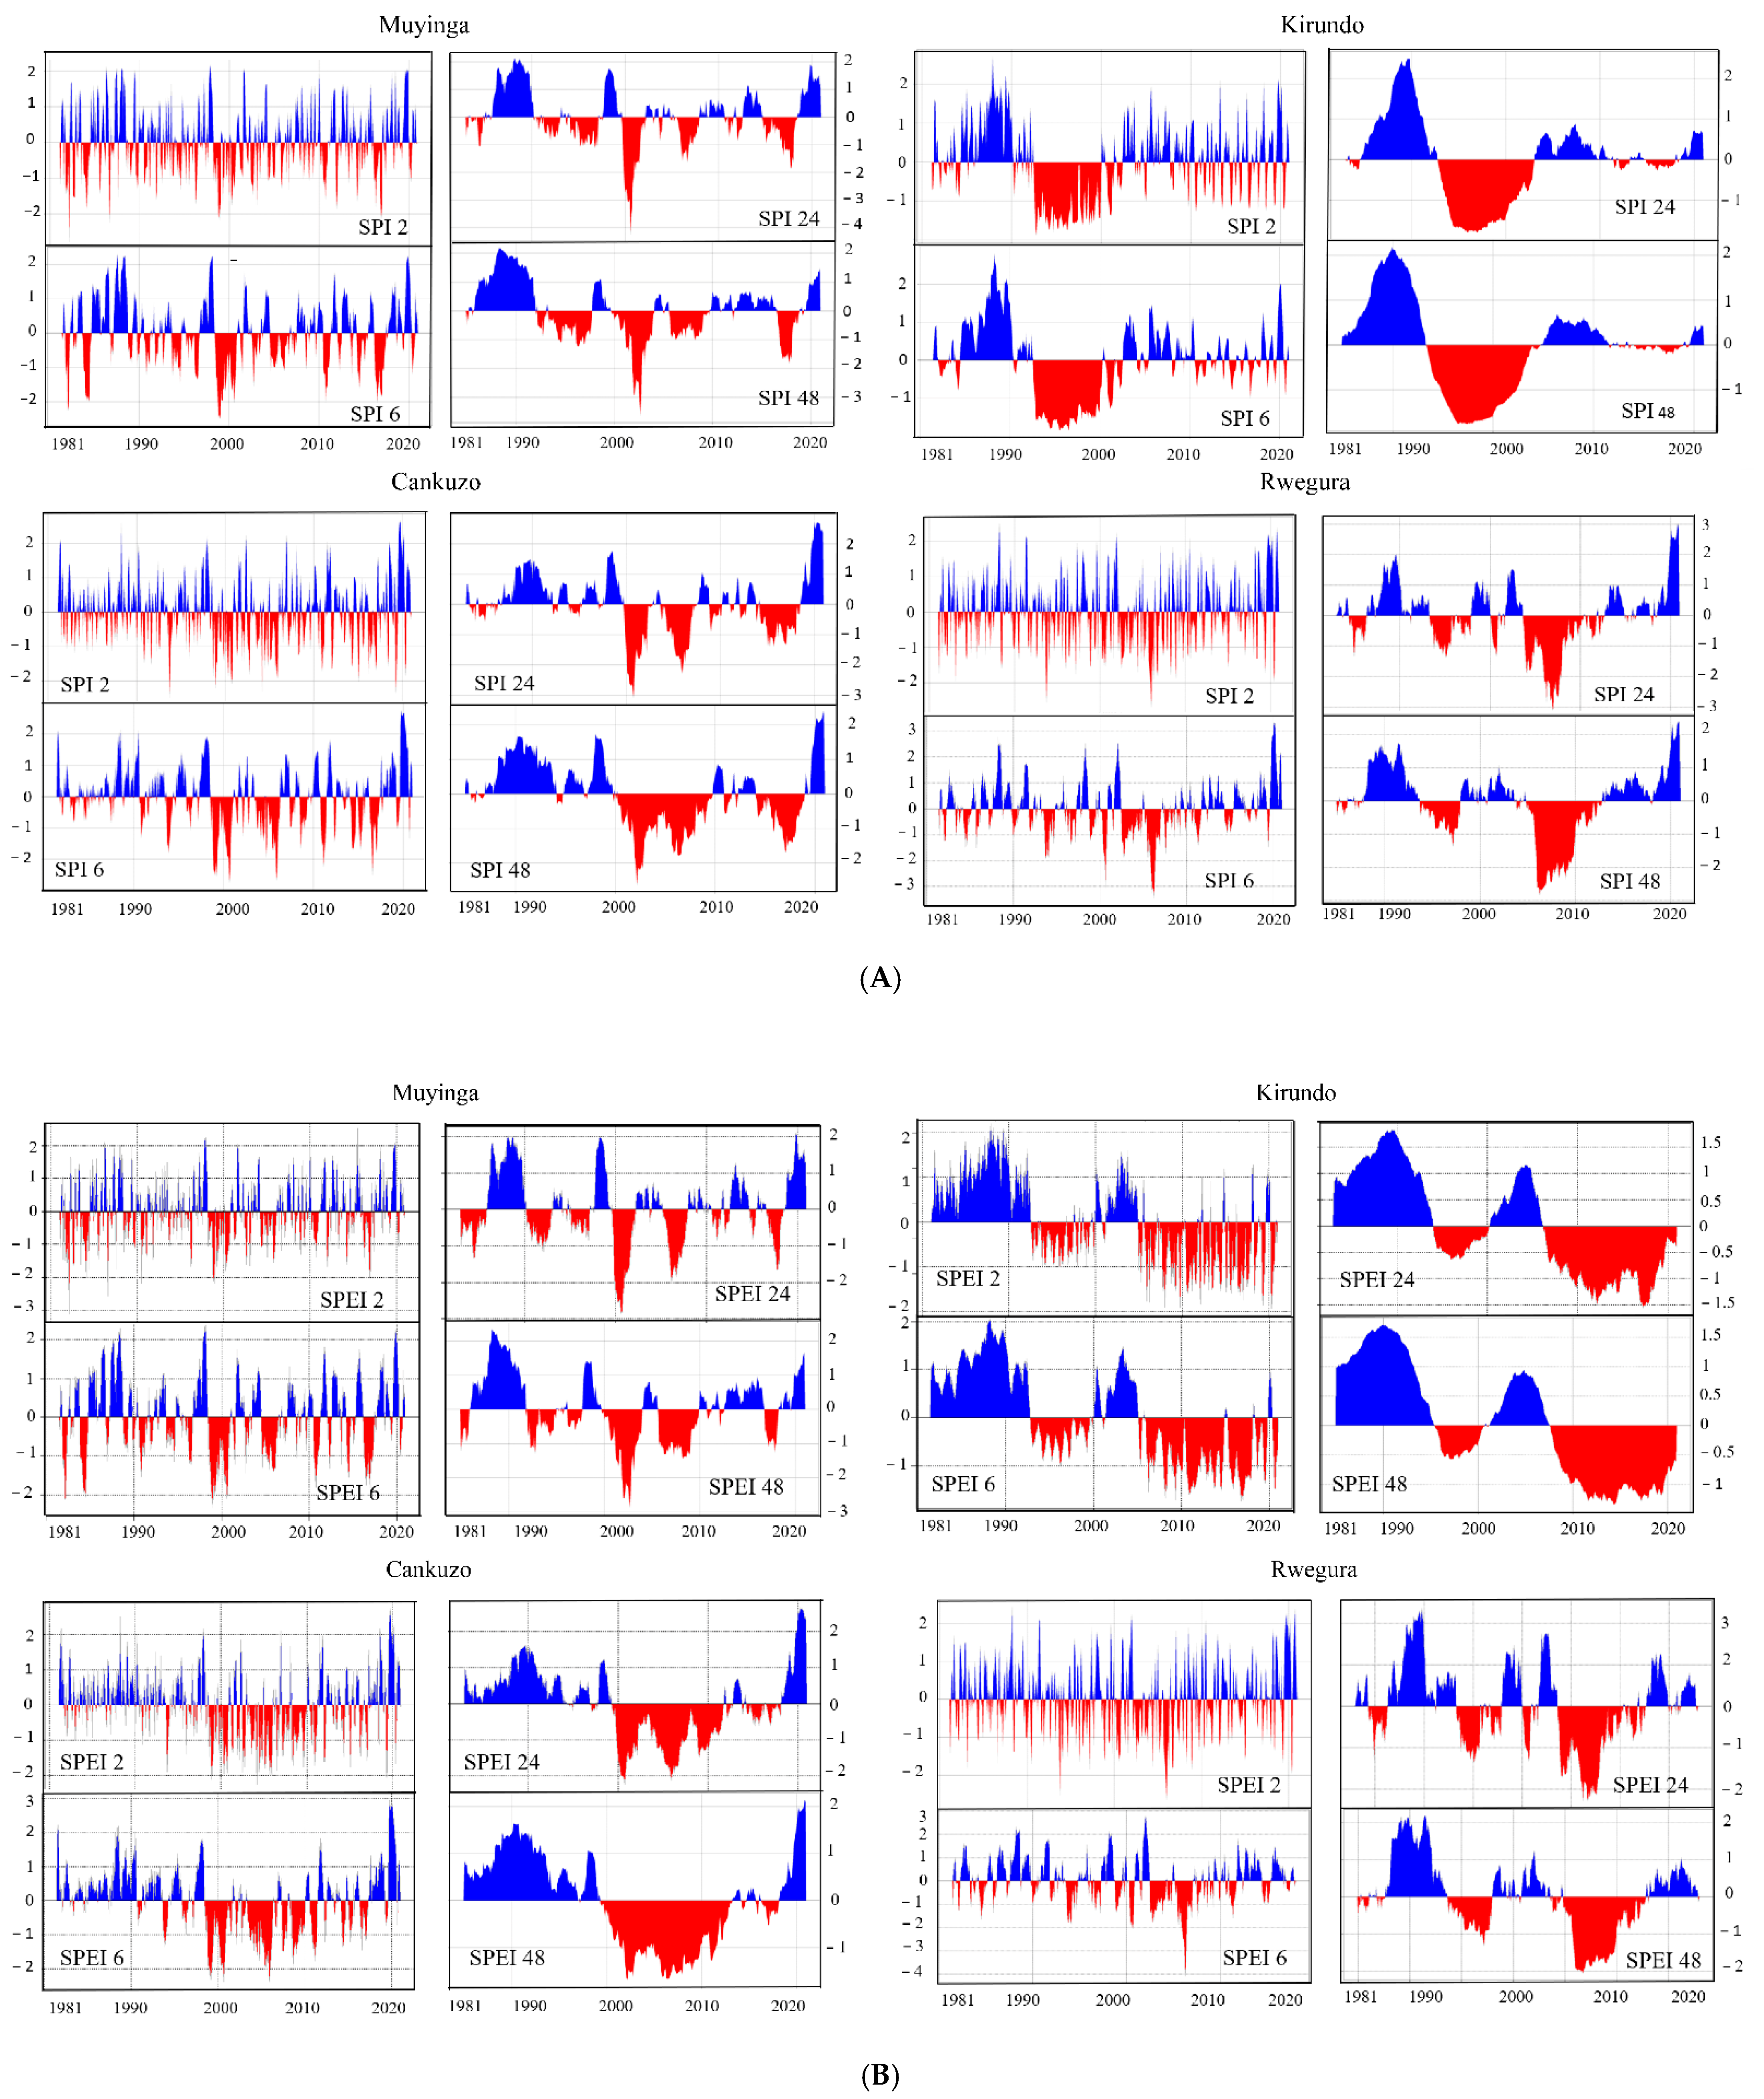
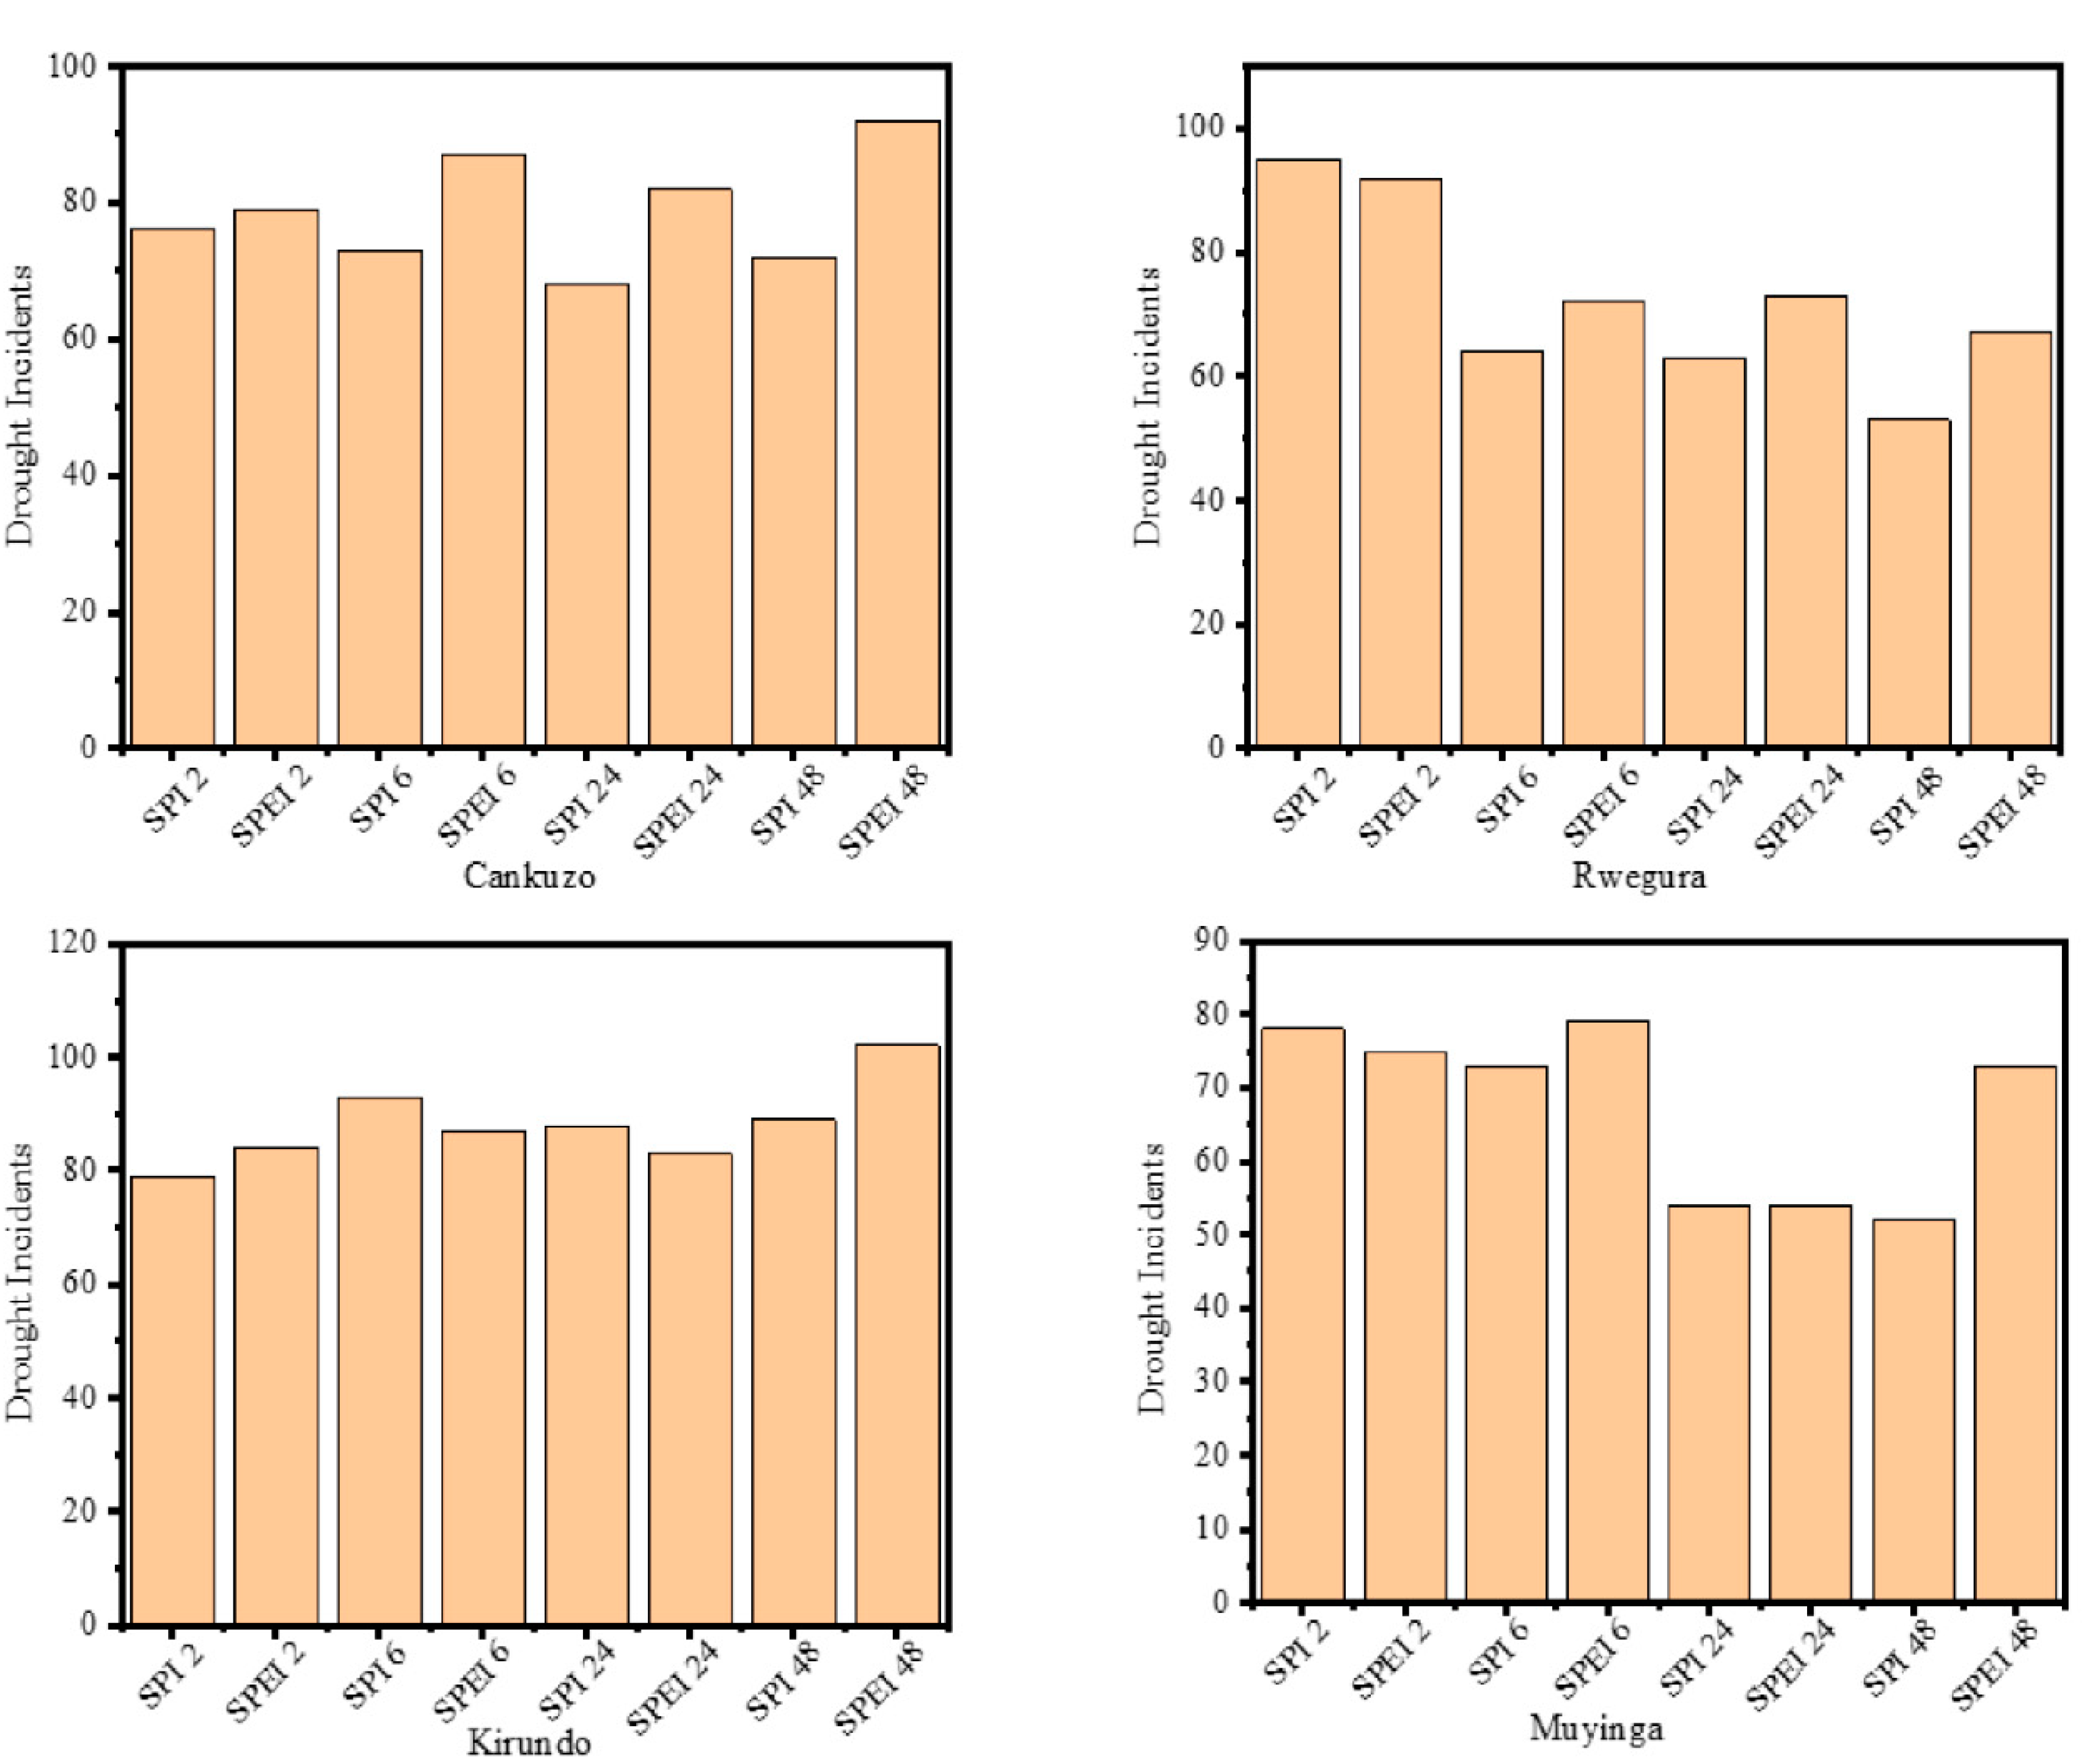
4.1. Presentation of Temporal Variability of Drought Incidence at Different Timescales

In order to illustrate historical variabilities of drought incidents at various timescales (2-, 6-, 24-, and 48- months) in the northern part of Burundi, the two drought indices, SPI and SPEI values, were calculated based on the meteorological station’s records for Muyinga, Kirundo, Cankuzo, and Rwegura, as indicated in Figure 4A,B. According to the findings, the two indices demonstrate similarities in patterns of change over timescales, although they are at variance in terms of persistence and magnitude of drought. Considering that most cultivated crops need 2 to 6 months to develop completely, an accumulation of at least 2 months of water deficit during the crop growth stage will negatively affect crop production, resulting in an agricultural drought. Given that drought expands over time, it is reasonable to assume that the prolonged periods of drought at longer timescales result from the cumulative effects of predecessors’ water shortages over time, which may be exacerbated by the persistent and continuous absence of precipitation. Furthermore, drought occurs when seasonal precipitation patterns shift. For example, the rains are hampered, resulting in threatening activities that are heavily reliant on the start of precipitation incidents. When comparing SPEI and SPI, distinctions were noticed in some years and across timescales. The longest drought incidents that occurred were detected under SPEI at all time scales. The drought lasted longer as the number of drought months increased annually over the time series. For several years, the region had already experienced drought conditions according to SPI, and the drought magnitude was intensified when identified by SPEI. The increased magnitude of droughts generated by the SPEI can sometimes be explained by the fact that the SPEI incorporates evapotranspiration, and evapotranspiration places a demand on water availability. Its effects are experienced mostly in water-scarce circumstances [54,55]. In Burundi, the mountainous regions experience natural climatic changes, which can be the provenance of drought variability. Drought occurs more frequently on a shorter timescale, typically one month of dominating water deficit for a meteorological drought. In contrast to a meteorological drought, a hydrological drought necessitates a prolonged period of water deficit or a considerable decline in water storage to arise. Thus, meteorological droughts on a 2-month timescale are most frequent, followed by agricultural droughts on 6-month timescales and hydrological droughts on 24- and 48-months. Still, at the higher timescale of 24-months, the drought persists longer, and the magnitude expands. On the other hand, on a 48-month timescale, the drought months are more severe and extremely dry, but with a lower magnitude.

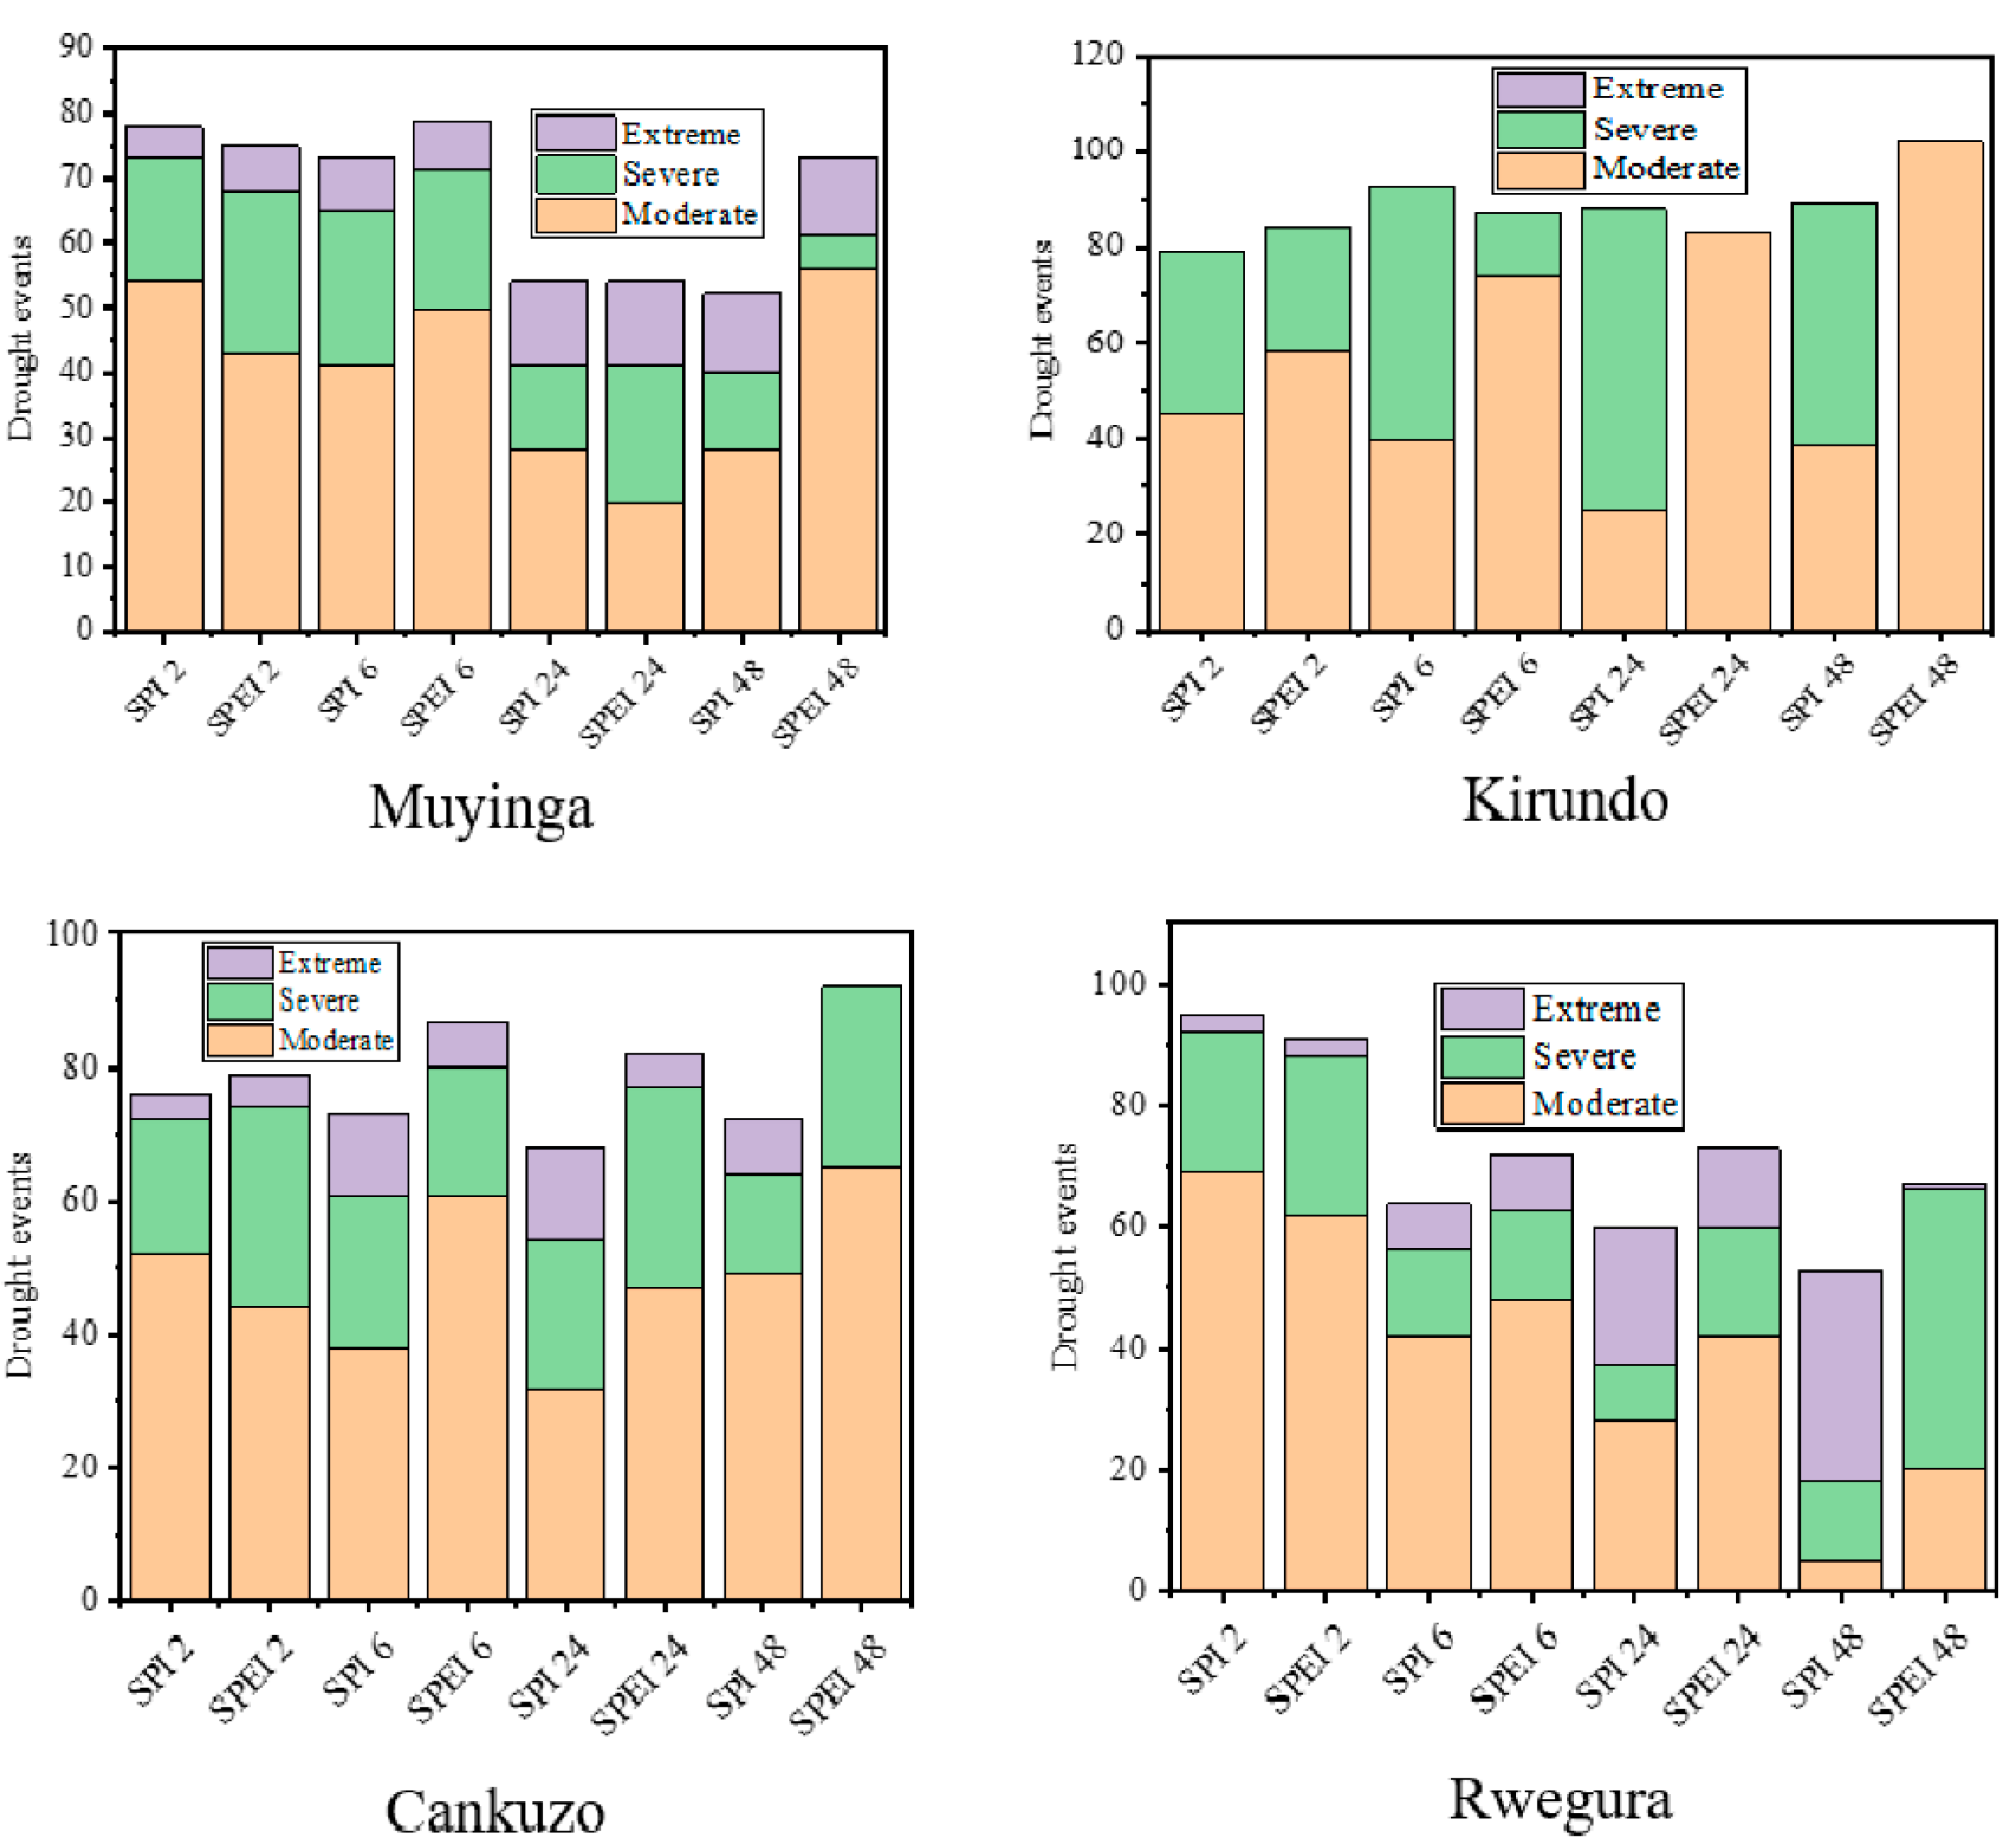
4.2. Characteristics of Drought and Date of Occurrence Patterns

The SPEI and SPI indices were utilized to detect drought duration, severity, intensity, and date of occurrence over the past 40 years in the northern part of Burundi. Those characterizations of drought are presented in Table 3 and Table 4 based on 2-, 6-, 24-, and 48-month timescales. SPEI- and SPI-series permitted to identify in which months or years the study domain experienced moderately, severely, or extremely dry incidents. The overall analysis demonstrated that both categories of drought had struck the region. Based on the SPEI and SPI on a two-month timescale, however, the SPEI generated many drought months. Within the study period, in Kirundo station, SPEI generates 102 dry months, all classified as moderately dry. The years 1993, 1997, 2004, 2005, 2006, and 2007 are recorded as dry periods. SPEI recorded two dry periods of long duration but low intensity, whereas SPI recorded one dry period of limited duration but high intensity. SPI generates 57 dry months: 31 moderately dry, 16 severely dry, and 10 extremely dry; where the years 2005 and 2006 were identified as dry years. According to the drought events generated by the two drought indices, the SPEI index can more accurately assess meteorological drought compared to the SPI index. According to the results generated by SPEI-2, the years 1993, 2000, 2003, 2005, 2006, 2007, and 2008 were dry. On the other side, SPI-2 illustrated that 1993, 2000, 2005, and 2006 were extremely dry. SPI-2 presented two extremely dry incidents: one of three consecutive months occurred from September 1993 to November 1993 with an intensity of 2.19, and the second appeared from October 2005 to April 2006, seven consecutive dry months with an intensity of 2.19. These two incidents highly affected the agriculture sector. Since September to December and March to May are the rainy seasons in northern Burundi, the second drought incident affects two successive crop-growing seasons. The revelations of both SPEI and SPI on 2- and 6-month timescales have some correspondence with the previous highlights of the study conducted by Nkunzimana et al. [27]. This assistance identified agricultural droughts that resulted in crop failure and livestock losses, particularly in northern Burundi, resulting in considerable family hunger. Thousands of people got sick, and some died because of thirst and hunger-related diseases and there was the immigration of people moving from the provinces that are located in the northern part of Bujumbura. It also strengthens the fact that drought indices on a 2-month timescale characterize a perfectly agricultural drought. With SPEI-6 detection of moderately and severely dry years, the years 1993, 1994, 2000, 2002, 2003, 2005, and 2006 were recorded as extremely dry years, and the dryness incident from June 2005 to December 2006 lasted for 19 months with an intensity of 2.00. The analysis of SPI-6 at Rwegura station showed moderately dry periods during 1999 and 2002; the year 2000 was identified as severely dry, while the years 2005 and 2006 were extremely dry, with a drought incident occurring from September 2005 to June 2006, ten consecutive months with a drought intensity of 2.47 for the station of Rwegura. The analysis of the SPEI and SPI at higher timescales is crucial to identifying the occurrence of hydrological drought. On a 24-month timescale, they generated almost the same number of drought months, for moderately dry and extremely dry conditions, respectively. On 24- and 48-month timescales, both SPEI and SPI indicated that the years 1994, 2003, 2004, 2005, 2006, 2007, 2008, and 2009 were extremely dry. The SPEI index generated more moderately and severely dry months, while SPI detected more extremely dry months with a higher intensity than SPEI. Table 3 and Table 4 show how the two indices differ in characterizing drought incidents.

4.3. Evaluation of Drought on Yearly Scales with SPEI and SPI Indices

The number of drought months annually, together with the drought classifications for the meteorological stations of Rwegura, Muyinga, Kirundo, and Cankuzo, are illustrated for the period under investigation (1981–2020) for both the SPEI index and the SPI index. Significant meteorological, agricultural, and hydrological droughts were noticed in 1993–1994, 1998, 2000, and 2002–2009 years, and Figure 5 shows the quantified drought months during the study period. Dryness incidents that struck the northern part of Burundi during the 2000–2010 decades were also identified in bordering counties, specifically Tanzania [56] and Rwanda [57]. The intensification and prolonged drought incidents across the study domain highly affected Burundi’s economy. A severe hydrological drought caused a severe water depletion of the Rwegura hydroelectric reservoir. The Rwegura hydropower station generates over 30% of Burundi’s electricity [20]. With water shortages in the reservoir leading to an insufficiency of electricity in many cities, most of the societal and economic activities that require electricity were paralyzed.

4.4. The Effectiveness of SPEI and SPI in Identifying Drought Months

The SPEI index identified more drought months over the study domain than the SPI index under both moderately and severely dry classes for all the various timescales used for this research, except for the station of Kirundo, where there was no drought incident that was classified as extremely dry for all timescales, as shown in Figure 6. The findings demonstrate that, even though lack of rainfall is the principal cause of droughts, the consequence of temperature throughout the climatic water balance plays a significant role in drought determination. When only precipitation was considered, more drought months were categorized as “extremely dry” than when potential evapotranspiration (PET) was incorporated, especially for the station of Rwegura under a 48-month timescale. Generally, Figure 6 indicates the number of drought months detected at all timescales in the northern part of Burundi during the study period of 1981–2020.

5. Conclusions

This paper compared the SPEI and SPI indices in quantifying droughts characterizing the extremely dry incidents in the northern part of Burundi based on 2-, 6-, 24-, and 48-month timescales for the period 1981–2020 for both SPI and SPEI. As pointed out by the various timescales, the two drought indices captured historical variations of droughts, and they could detect various types of droughts. Evidently, SPEI identified the occurrence of droughts characterized by a long duration and increased magnitude but with lower intensity. This might be due to the fact that global warming increases the level of potential evapotranspiration and changes precipitation patterns, thereby raising the evaporative water demand. All of these leads to a shortage of water and increases the frequency of extreme climate change-related incidents such as drought. The northern part of Burundi is vulnerable to climate variations, soil degradation, extensive deforestation, and the hilly landscape with its dominant steep slopes. The SPEI was thought to be the best index due to its capability to consider the potential effects of climate change [58]. On the other hand, taking into consideration only precipitation, SPI detected more extreme drought incidents than SPEI. In addition, the considerable difference is evident basically in the higher timescales. It is undeniable that rainfall plays a significant role in determining droughts. A temperature rise has essential effects on the severity of droughts and the amount of soil moisture available, which in turn affect agricultural droughts. The SPEI index is a powerful tool for determining the historical pattern of dry conditions in the northern part of Burundi.
Both the SPEI and SPI indices can quantify droughts and identify the onset and end of dryness incidents. Notwithstanding, this study’s aim was to determine how the SPEI differs from the SPI in the quantification and characterization of drought incidents. All of them can detect different types of droughts, but with different characteristics. SPEI detected more drought incidents characterized by long duration and greater magnitude but with lower intensity, while SPI detected drought incidents characterized by limited duration and lesser magnitude but with higher intensity. Therefore, SPEI is more accurate for quantifying droughts than SPI, while SPI is more accurate for indicating drought severity. Thus, this study suggests that: more attention should be paid when applying one index like SPI; with caution, SPEI can be effective in climatological conditions where the influence of evapotranspiration is noticeable, moreover, when assessing drought, the use of both SPEI and SPI indices is highly suggested. Furthermore, this study will serve as a reference for the studies ahead for as long as this study recommends using multiple indices in characterizing dryness and wetness conditions.

Author Contributions

Conceptualization, J.M.N.; Data curation, J.M.N.; Formal analysis, J.M.N.; Funding acquisition, F.L.; Methodology, J.M.N.; Project administration, F.L.; Resources, J.M.N.; Software, J.M.N.; Supervision, F.L.; Validation, J.M.N.; Visualization, A.N.; Writing—original draft, J.M.N.; Writing—review and editing, J.M.N. All authors have read and agreed to the published version of the manuscript.

Funding

This work was supported by the China Postdoctoral Science Foundation (No. 2019M651976).

Institutional Review Board Statement

Not applicable.

Informed Consent Statement

Not applicable.

Data Availability Statement

Data is available upon reasonable request from authors.

Acknowledgments

The authors would like to express their sincere thanks to Yangzhou University (YZU) for the provision of a better learning environment and making all materials needed for this study available. A special appreciation goes to IGEBU, which provided the data used in this work.

Conflicts of Interest

The authors declare no conflict of interest in this research.

References

  1. Maybank, J.; Bonsai, B.; Jones, K.; Lawford, R.; O’Brien, E.G.; Ripley, E.A.; Wheaton, E. Drought as a natural disaster. Atmos. Ocean 1995, 33, 195–222. [Google Scholar] [CrossRef]
  2. Yusa, A.; Berry, P.; Cheng, J.J.; Ogden, N.; Bonsal, B.; Stewart, R.; Waldick, R. Climate Change, Drought and Human Health in Canada. Int. J. Environ. Res. Public Health 2015, 12, 8359–8412. [Google Scholar] [CrossRef] [PubMed]
  3. Marengo, J.A.; Cunha, A.P.; Cuartas, L.A.; Deusdará Leal, K.R.; Broedel, E.; Seluchi, M.E.; Michelin, C.M.; de Praga Baião, C.F.; Chuchón Ângulo, E.; Almeida, E.K.; et al. Extreme Drought in the Brazilian Pantanal in 2019–2020: Characterization, Causes, and Impacts. Front. Water 2021, 3, 639204. [Google Scholar] [CrossRef]
  4. Tijdeman, E.; Menzel, L. The Development and Persistence of Soil Moisture Stress during Drought across Southwestern Germany. Hydrol. Earth Syst. Sci. 2021, 25, 2009–2025. [Google Scholar] [CrossRef]
  5. Kalisa, W.; Zhang, J.; Igbawua, T.; Kayiranga, A.; Ujoh, F.; Aondoakaa, I.S.; Tuyishime, P.; Li, S.; Simbi, C.H.; Nibagwire, D. Spatial Multi-Criterion Decision Making (SMDM) Drought Assessment and Sustainability over East Africa from 1982 to 2015. Remote Sens. 2021, 13, 5067. [Google Scholar] [CrossRef]
  6. Otkin, J.A.; Svoboda, M.; Hunt, E.D.; Ford, T.W.; Anderson, M.C.; Hain, C.; Basara, J.B. Flash Droughts: A Review and Assessment of the Challenges Imposed by Rapid-Onset Droughts in the United States. Bull. Am. Meteorol. Soc. 2018, 99, 911–919. [Google Scholar] [CrossRef]
  7. Tosunoğlu, F.; Onof, C. Joint Modelling of Drought Characteristics Derived from Historical and Synthetic Rainfalls: Application of Generalized Linear Models and Copulas. J. Hydrol. Reg. Stud. 2017, 14, 167–181. [Google Scholar] [CrossRef]
  8. Fluixá-Sanmartín, J.; Pan, D.; Fischer, L.; Orlowsky, B.; García-Hernández, J.; Jordan, F.; Haemmig, C.; Zhang, F.; Xu, J. Searching for the Optimal Drought Index and Time Scale Combination to Detect Drought: A Case Study from the Lower Jinsha River Basin, China. Hydrol. Earth Syst. Sci. 2018, 22, 889–910. [Google Scholar] [CrossRef] [Green Version]
  9. Rehana, S.; Sireesha Naidu, G. Development of Hydro-Meteorological Drought Index under Climate Change–Semi-Arid River Basin of Peninsular India. J. Hydrol. 2021, 594, 125973. [Google Scholar] [CrossRef]
  10. Mckee, T.B.; Doesken, N.J.; Kleist, J. The relation of drought frequency and duration to time scales. In Proceedings of the Eighth Conference Applied Climatology, Anaheim, CA, USA, 17–22 January 1993; Department of Atmospheric Science Colorado State University: Fort Collins, CO, USA, 1993; Volume17, pp. 179–184. [Google Scholar]
  11. Palmer, W.C. Keeping Track of Crop Moisture Conditions, Nationwide: The New Crop Moisture Index. Weatherwise 1968, 21, 156–161. [Google Scholar] [CrossRef]
  12. Vicente-Serrano, S.M.; Beguería, S.; López-Moreno, J.I. A Multiscalar Drought Index Sensitive to Global Warming: The Standardized Precipitation Evapotranspiration Index. J. Clim. 2010, 23, 1696–1718. [Google Scholar] [CrossRef] [Green Version]
  13. Shiru, M.S.; Shahid, S.; Alias, N.; Chung, E.S. Trend Analysis of Droughts during Crop Growing Seasons of Nigeria. Sustainability 2018, 10, 871. [Google Scholar] [CrossRef] [Green Version]
  14. Nguvava, M.; Abiodun, B.J.; Otieno, F. Projecting Drought Characteristics over East African Basins at Specific Global Warming Levels. Atmos. Res. 2019, 228, 41–54. [Google Scholar] [CrossRef]
  15. Hao, Y.; Baik, J.; Fred, S.; Choi, M. Comparative Analysis of Two Drought Indices in the Calculation of Drought Recovery Time and Implications on Drought Assessment: East Africa’s Lake Victoria Basin. Stoch. Hydrol. Hydraul. 2021, 36, 1943–1958. [Google Scholar] [CrossRef]
  16. Ndayiragije, J.M.; Li, F. Monitoring and Analysis of Drought Characteristics Based on the Climate Change in Burundi Using Standardized Precipitation Evapotranspiration Index. Water 2022, 14, 2511. [Google Scholar] [CrossRef]
  17. Gebremeskel Haile, G.; Tang, Q.; Sun, S.; Huang, Z.; Zhang, X.; Liu, X. Droughts in East Africa: Causes, Impacts and Resilience. Earth Sci. Rev. 2019, 193, 146–161. [Google Scholar] [CrossRef]
  18. GSURR AFRICA. Strategies for Urbanization and Economic Competitiveness in Burundi. June 2015. Available online: https://documents1.worldbank.org (accessed on 16 August 2022).
  19. Schneiderbauer, S.; Baunach, D.; Pedoth, L.; Renner, K.; Fritzsche, K.; Bollin, C.; Pregnolato, M.; Zebisch, M.; Liersch, S.; Rivas López, M.D.R.; et al. Spatial-Explicit Climate Change Vulnerability Assessments Based on Impact Chains. Findings from a Case Study in Burundi. Sustainability 2020, 12, 6354. [Google Scholar] [CrossRef]
  20. Nkunzimana, A.; Shuoben, B.; Guojie, W.; Alriah, M.A.A.; Sarfo, I.; Zhihui, X.; Vuguziga, F.; Ayugi, B.O. Assessment of Drought Events, Their Trend and Teleconnection Factors over Burundi, East Africa. Theor. Appl. Climatol. 2021, 145, 1293–1316. [Google Scholar] [CrossRef]
  21. Elkollaly, M.; Khadr, M.; Zeidan, B. Drought Analysis in the Eastern Nile Basin Using the Standardized Precipitation Index. Environ. Sci. Pollut. Res. 2018, 25, 30772–30786. [Google Scholar] [CrossRef]
  22. Kalisa, W.; Zhang, J.; Igbawua, T.; Ujoh, F.; Ebohon, O.J.; Namugije, J.N.; Yao, F. Spatio-Tempoaral Analysis of Drought and Return Periods over the East African Region Using Standardized Precipitation Index from 1920 to 2016. Agric. Water Manag. 2020, 237, 106195. [Google Scholar] [CrossRef]
  23. Ayugi, B.; Shilenje, Z.W.; Babaousmail, H.; Lim Kam Sian, K.T.C.; Mumo, R.; Dike, V.N.; Iyakaremye, V.; Chehbouni, A.; Ongoma, V. Projected Changes in Meteorological Drought over East Africa Infered from Bias-Adjusted CMIP6 Models. Nat. Hazards 2022, 113, 1151–1176. [Google Scholar] [CrossRef]
  24. Uwimbabazi, J.; Jing, Y.; Iyakaremye, V.; Ullah, I.; Ayugi, B. Observed Changes in Meteorological Drought Events during 1981–2020 over Rwanda, East Africa. Sustainability 2022, 14, 1519. [Google Scholar] [CrossRef]
  25. Han, X.; Li, Y.; Yu, W.; Feng, L. Attribution of the Extreme Drought in the Horn of Africa during Short-Rains of 2016 and Long-Rains of 2017. Water 2022, 14, 409. [Google Scholar] [CrossRef]
  26. Kim, J.-B.; Habimana, J.D.D.; Kim, S.-H.; Bae, D.-H. Assessment of Climate Change Impacts on the Hydroclimatic Response in Burundi Based on Cmip6 Esms. Sustainability 2021, 13, 12037. [Google Scholar] [CrossRef]
  27. Vicente-Serrano, S.M.; Beguería, S.; Lorenzo-Lacruz, J.; Camarero, J.J.; López-Moreno, J.I.; Azorin-Molina, C.; Revuelto, J.; Morán-Tejeda, E.; Sanchez-Lorenzo, A. Performance of Drought Indices for Ecological, Agricultural, and Hydrological Applications. Earth Interact. 2012, 16, 1–27. [Google Scholar] [CrossRef] [Green Version]
  28. Liu, C.; Yang, C.; Yang, Q.; Wang, J. Spatiotemporal Drought Analysis by the Standardized Precipitation Index (SPI) and Standardized Precipitation Evapotranspiration Index (SPEI) in Sichuan Province, China. Sci. Rep. 2021, 11, 1–14. [Google Scholar] [CrossRef] [PubMed]
  29. Tirivarombo, S.; Osupile, D.; Eliasson, P. Drought Monitoring and Analysis: Standardised Precipitation Evapotranspiration Index (SPEI) and Standardised Precipitation Index (SPI). Phys. Chem. Earth 2018, 106, 1–10. [Google Scholar] [CrossRef]
  30. Nkunzimana, A.; Bi, S.; Jiang, T.; Wu, W.; Abro, M.I. Spatiotemporal Variation of Rainfall and Occurrence of Extreme Events over Burundi during 1960 to 2010. Arab. J. Geosci. 2019, 12, 176. [Google Scholar] [CrossRef]
  31. Batungwanayo, P.; Vanclooster, M.; Koropitan, A.F. Response of Seasonal Vegetation Dynamics to Climatic Constraints in Northeastern Burundi. J. Geosci. Environ. Prot. 2020, 8, 151–181. [Google Scholar] [CrossRef]
  32. Niragira, S.; D’Haese, M.; D’Haese, L.; Ndimubandi, J.; Desiere, S.; Buysse, J. Food for Survival: Diagnosing Crop Patterns to Secure Lower Threshold Food Security Levels in Farm Households of Burundi. Food Nutr. Bull. 2015, 36, 196–210. [Google Scholar] [CrossRef] [PubMed]
  33. Niyongabire, E.; Rhinane, H. Geospatial Techniques Use for Assessment of Vulnerability to Urban Flooding in Bujumbura City, Burundi. ISPRS Int. Arch. Photogramm. Remote Sens. Spat. Inf. Sci. 2019, XLII-4/W12, 147–154. [Google Scholar] [CrossRef] [Green Version]
  34. Taji, S.G.; Keskar, A.P. Drought Identification and Analysis of Precipitation Trends in Beed District, Maharashtra. Mater. Today Proc. 2021, 61, 332–341. [Google Scholar] [CrossRef]
  35. Vélez-Nicolás, M.; García-López, S.; Ruiz-Ortiz, V.; Zazo, S.; Molina, J.L. Precipitation Variability and Drought Assessment Using the SPI: Application to Long-Term Series in the Strait of Gibraltar Area. Water 2022, 14, 884. [Google Scholar] [CrossRef]
  36. Samantaray, A.K.; Ramadas, M.; Panda, R.K. Changes in Drought Characteristics Based on Rainfall Pattern Drought Index and the CMIP6 Multi-Model Ensemble. Agric. Water Manag. 2022, 266, 107568. [Google Scholar] [CrossRef]
  37. Beguería, S.; Vicente-Serrano, S.M.; Reig, F.; Latorre, B. Standardized Precipitation Evapotranspiration Index (SPEI) Revisited: Parameter Fitting, Evapotranspiration Models, Tools, Datasets and Drought Monitoring. Int. J. Climatol. 2014, 34, 3001–3023. [Google Scholar] [CrossRef] [Green Version]
  38. Musonda, B.; Jing, Y.; Iyakaremye, V.; Ojara, M. Analysis of Long-Term Variations of Drought Characteristics Using Standardized Precipitation Index over Zambia. Atmosphere 2020, 11, 1268. [Google Scholar] [CrossRef]
  39. Da Rocha Júnior, R.L.; dos Santos Silva, F.D.; Costa, R.L.; Gomes, H.B.; Pinto, D.D.C.; Herdies, D.L. Bivariate Assessment of Drought Return Periods and Frequency in Brazilian Northeast Using Joint Distribution by Copula Method. Geosciences 2020, 10, 135. [Google Scholar] [CrossRef] [Green Version]
  40. Henchiri, M.; Igbawua, T.; Javed, T.; Bai, Y.; Zhang, S.; Essifi, B.; Ujoh, F.; Zhang, J. Meteorological Drought Analysis and Return Periods over North and West Africa and Linkage with El Niño–Southern Oscillation (Enso). Remote Sens. 2021, 13, 4730. [Google Scholar] [CrossRef]
  41. Rolbiecki, R.; Yücel, A.; Kocięcka, J.; Atilgan, A.; Marković, M.; Liberacki, D. Analysis of SPI as Drought Indicator during the Maize Growing Period in the Cukurova Region (Turkey). Sustainability 2022, 14, 3697. [Google Scholar] [CrossRef]
  42. Stagge, J.H.; Tallasken, L.M.; Xu, C.Y.; Van Lanen, H.A.J. Standardized Precipitation-Evapotranspiration Index (SPEI): Sensitivity to Potential Evapotranspiration Models and Parameters. In Hydrology in a Changing World—Copernicus GmbH (IAHS-AISH Proceedings and Reports); Copernicus Publications: Göttingen, Germany, 2014; pp. 367–373. [Google Scholar]
  43. Mekonen, A.A.; Berlie, A.B.; Ferede, M.B. Spatial and Temporal Drought Incidence Analysis in the Northeast Highlands of Ethiopia. Geoenviron. Disasters 2020, 7, 10. [Google Scholar] [CrossRef]
  44. Borona, P.; Busch, F.; Krueger, T.; Rufin, P. Uncertainty in Drought Identification Due to Data Choices, and the Value of Triangulation. Water 2021, 13, 3611. [Google Scholar] [CrossRef]
  45. Hui-Mean, F.; Yusop, Z.; Yusof, F. Drought Analysis and Water Resources Availability Using Standardized Precipitation Evapotranspiration Index. Atmos. Res. 2018, 201, 102–115. [Google Scholar] [CrossRef]
  46. Pei, Z.; Fang, S.; Wang, L.; Yang, W. Comparative Analysis of Drought Indicate by the SPI and SPEI at Various Timescales in Inner Mongolia, China. Water 2020, 12, 1925. [Google Scholar] [CrossRef]
  47. Da Rocha, R.L.; dos Santos Silva, F.D.; Lisboa Costa, R.; Barros Gomes, H.; Luis Herdies, D.; Rodrigues Da Silva, V.D.P.; Candido Xavier, A. Analysis of the Space–Temporal Trends of Wet Conditions in the Different Rainy Seasons of Brazilian Northeast by Quantile Regression and Bootstrap Test. Geosciences 2019, 9, 457. [Google Scholar] [CrossRef] [Green Version]
  48. Ayugi, B.; Tan, G.; Rouyun, N.; Zeyao, D.; Ojara, M.; Mumo, L.; Babaousmail, H.; Ongoma, V. Evaluation of Meteorological Drought and Flood Scenarios over Kenya, East Africa. Atmosphere 2020, 11, 307. [Google Scholar] [CrossRef] [Green Version]
  49. Sheffield, J.; Wood, E.F.; Roderick, M.L. Little Change in Global Drought over the Past 60 Years. Nature 2012, 491, 435–438. [Google Scholar] [CrossRef]
  50. Ogunrinde, A.T.; Olasehinde, D.A.; Olotu, Y. Assessing the Sensitivity of Standardized Precipitation Evapotranspiration Index to Three Potential Evapotranspiration Models in Nigeria. Sci. Afr. 2020, 8, e00431. [Google Scholar] [CrossRef]
  51. Hargreaves, G.H.; Asce, F.; Allen, R.G. History and Evaluation of Hargreaves Evapotranspiration Equation. J. Irrig. Drain. Eng. 2003, 129, 53–63. [Google Scholar] [CrossRef]
  52. Gao, X.; Zhao, Q.; Zhao, X.; Wu, P.; Pan, W.; Gao, X.; Sun, M. Temporal and Spatial Evolution of the Standardized Precipitation Evapotranspiration Index (SPEI) in the Loess Plateau under Climate Change from 2001 to 2050. Sci. Total Environ. 2017, 595, 191–200. [Google Scholar] [CrossRef]
  53. Zhang, R.; Chen, T.; Chi, D. Global Sensitivity Analysis of the Standardized Precipitation Evapotranspiration Index at Different Time Scales in Jilin Province, China. Sustainability 2020, 12, 1713. [Google Scholar] [CrossRef]
  54. Tadese, M.; Kumar, L.; Koech, R. Long-Term Variability in Potential Evapotranspiration, Water Availability and Drought under Climate Change Scenarios in the Awash River Basin, Ethiopia. Atmosphere 2020, 11, 883. [Google Scholar] [CrossRef]
  55. Scott, R.L.; Knowles, J.F.; Nelson, J.A.; Gentine, P.; Li, X.; Barron-Gafford, G.; Bryant, R.; Biederman, J.A. Water Availability Impacts on Evapotranspiration Partitioning. Agric. For. Meteorol. 2021, 297, 108251. [Google Scholar] [CrossRef]
  56. Chang’a, L.B.; Kijazi, A.L.; Luhunga, P.M.; Ng’ongolo, H.K.; Mtongor, H.I. Spatial and Temporal Analysis of Rainfall and Temperature Extreme Indices in Tanzania. Atmos. Clim. Sci. 2017, 7, 525–539. [Google Scholar] [CrossRef] [Green Version]
  57. Nkurunziza, I.F.; Guirong, T.; Paul Ngarukiyimana, J.; Sindikubwabo, C.; Nasim, W.; Sori Gomez, R.; Ayugi, B.; Ngarukiyimana, J.P. Open Access Nkurunziza et al Influence of the Mascarene High on October-December Rainfall and Their Associated Atmospheric Circulation Anomalies over Rwanda. J. Environ. Agric. Sci. 2019, 20, 1–20. [Google Scholar]
  58. Polong, F.; Chen, H.; Sun, S.; Ongoma, V. Temporal and Spatial Evolution of the Standard Precipitation Evapotranspiration Index (SPEI) in the Tana River Basin, Kenya. Theor. Appl. Climatol. 2019, 138, 777–792. [Google Scholar] [CrossRef]
Figure 1. The geographical location of the study area, including the meteorological stations of Muyinga, Kirundo, Cankuzo, and Rwegura.
Atmosphere 13 01882 g001
Figure 2. Temporal patterns of annual mean precipitation (mm) for the four meteorological stations in the study region during the period (1981–2020).
Atmosphere 13 01882 g002
Figure 3. Temporal patterns of annual mean maximum and minimum temperature (°C) for the meteorological stations utilised in this study during the study period of (1981–2020).
Atmosphere 13 01882 g003
Figure 4. (A) Temporal variation of monthly SPI at different timescales across the northern part of Burundi during 1981 to 2020 rainfall data. (B) Temporal variation of monthly SPEI at different timescales across the northern part of Burundi during 1981to 2020 rainfall and temperature data.
Atmosphere 13 01882 g004
Figure 5. Drought months, quantified for each station during the study period based on SPI and SPEI indices at various timescales.
Atmosphere 13 01882 g005
Figure 6. Number of moderate, severe, and extreme drought incidents at various timescales for the northern part of Burundi, generated based on SPI and SPEI indices.
Atmosphere 13 01882 g006
Table 1. Geographical location of meteorological stations and length of climatic records taken into consideration in this study.
StationLatitudeLongitudeElevation (m)Type of DataLength
Muyinga−2.8530.351756Rainfall &Temperature1981–2020
Kirundo−2.5830.111449Rainfall & Temperature1981–2020
Cankuzo−3.3130.531652Rainfall & Temperature1981–2020
Rwegura−2.9129.512302Rainfall & Temperature1981–2020
Table 2. Classification of dry and wet states based on drought indices values [10].
CategoriesSPI, SPEI
Extremely wet 2
Severely wet1.5–1.99
Moderately wet1–1.49
Near normal−0.99 to −0.99
Moderately dry−1 to −1.19
Severely dry−1.5 to −1.99
Extremely dry 2
Table 3. The characteristics and categories of some main dry incidents (SPI ≤ −1) in the study domain.
StationsSPI IndexDate of OccurrenceDuration (Month)SeverityIntensityCategory
MuyingaSPI 2October 1998–January 19994−8.00−2.00Extreme
June 2002–Sepember 20024−4.85−1.21Moderate
July 2010–October 20104−5.06−1.26Moderate
SPI 6December 1993–July 19948−13.53−1.67Severe
August 1998–October 199915−25.72−1.72Severe
April 2000–October 20007−10.83−1.55Severe
August 2010–December 20105−7.55−1.51Severe
April 2016–March 201712−17.50−1.46Moderate
SPI 24November 1999–August 200122−52.80−2.4Severe
February 2010–October 20109−12.30−1.37Moderate
November 2016–January 201815−19.73−1.31Moderate
SPI 48November 2001–August 200322−45.43−2.06Severe
November 2016–February 201816− 24.15−1.51Severe
KirundoSPI 2August 1992–May 199310−14.22−1.42Moderate
SPI 6October 1993–January 199852−73.70−1.42Moderate
November 1992–January 200087−132.50−1.53Severe
January 2001–June 20016−7.07−1.20Moderate
SPI 24October 1993–January 200188−136.13−1.55Severe
SPI 48November 1994–April 200290−134.65−1.50Severe
CankuzoSPI 2September 1993–November 19933−5.05−1.68Severe
August 2000–October 20003−5.00−1.66Severe
September 2005–December 20054−6.82−1.70Severe
January 2012–March 20123−4.47−1.50Severe
SPI 6October 1993–December 19933−4.90−1.63Severe
November 1998–July 19999−18.00−2.00Extreme
April 2000–November 20008−15.24−1.90Severe
June 2005–February 20069−15.44−1.72Severe
January 2011–May 20115−8.40−1.68Severe
April 2014–September 20146−8.50−1.42Moderate
SPI 24December 1999–March 200228−52.76−1.88Severe
January 2005–October 200622−36.55−1.66Severe
January 2015–December 201512−13.82−1.15Moderate
SPI 48November 2001–April 200318−32.50−1.81Severe
August 2005–December 200729−40.00−1.40Moderate
October 2016–February 201817−22.81−1.34Moderate
RweguraSPI 2July 2002–November 20025−6.54−1.30Moderate
September 2005–February 20066−11.00−1.83Severe
SPI 6May 2000–October 20006−11.08−1.85Severe
July 2002–March 20039−12.00−1.33Moderate
September 2005–June 200610−24.70−2.47Severe
SPI 24May 1994–November 19947−7.72−1.10Moderate
January 2004–November 200411−17.35−1.58Severe
September 2005–January 200829−64.00−2.20Extreme
SPI 48November 2005–December 200950−108.00−2.10Extreme
Table 4. The characteristics and categories of some main dry incidents (SPEI ≤ −1) in the study domain.
StationsSPEI IndexDate of OccurrenceDuration (Month)SeverityIntensityCategory
MuyingaSPEI 2August 1982–October 19823−4.66−1.55Severe
January 1984–March 19843−4.67−1.55Severe
October 1998–January 19994−8.11−2.03Extreme
April 2000–August 20005−7.30−1.46Moderate
SPEI 6November 1983–July 19849−14.32−1.60Severe
August 1998–October 199911−19.36−1.76Severe
April 2000–October 20007−11.70−1.67Severe
August 2010–December 20105−6.71−1.34Moderate
May 2016–April 201712−16.06−1.33Moderate
SPEI 24November 1999–August 200123−48.21−2.10Extreme
December 2005–May 200718−27.32−1.52Severe
June 2017–January 20188−10.86−1.35Moderate
SPEI 48March 2001–May 200323−49.40−2.15Severe
January 2006–December 200836−43.00−1.20Moderate
KirundoSPEI 2July 2010–December 20106−8.13−1.35Moderate
June 2014–August 20144−5.48−1.37Moderate
July 2015–October 20154−5.43−1.35Moderate
June 2016–October 20165−7.67−1.53Moderate
April 2020–July 20204−6.00−1.50Moderate
SPEI 6August 2010–November 201116−22.09−1.40Moderate
June 2016–December 201719−25.70−1.35Moderate
SPEI 24May 2009–October 201461−62.72−1.03Moderate
September 2016–August 201824−32.26−1.34Moderate
SPEI 48November 1994–April 2002105−120.9−1.15Moderate
CankuzoSPEI 2November 1998–October 19994−6.72−1.68Severe
April 2010–October 20107−10.87−1.55Moderate
July 2005–December 20056−10.36−1.73Severe
SPEI 6January 1999–July 19997−13.20−1.88Severe
February 2000–December 200011−18.04−1.64Severe
February 2005–April 200615−24.38−1.63Severe
August 2008–December 20085−7.72−1.54Severe
January 2011–May 20115−7.10−1.42Moderate
SPEI 24December 1999–March 200228−44.16−1.60Severe
May 2004–December 200632−50.60−1.60Severe
November 2008–March 201017−21.30−1.25Moderate
SPEI 48January 2002–March 200427−35.00−1.30Moderate
January 2005–November 200961−83.00−1.40Moderate
January 2011–June 20116−7.02−1.20Moderate
RweguraSPEI 2September 1993–November 19933−5.20−1.73Severe
September 2005–April 20068−14.00−1.75Severe
SPEI 6September 1993–March 19947−11.02−1.57Severe
May 2000–October 20006−11.00−1.83Severe
July 2002–March 20039−12.00−1.33Moderate
June 2005–December 200619−38.00−2.00Extreme
March 2011–July 20115−6.00−1.20Moderate
SPEI 24April 1994–August 199517−20.30−1.20Moderate
May 2000–October 20006−7.32−1.22Moderate
December 2003–December 200749−81.30−1.66Severe
SPEI 48October 1996–August 199711−12.43−1.13Moderate
November 2005–December 200951−89.10−1.75Severe
Publisher’s Note: MDPI stays neutral with regard to jurisdictional claims in published maps and institutional affiliations.

