Abstract
Data from historical observatories and future simulations were analyzed using the representative concentration pathway (RCP) 8.5 scenario, which covered the period from 1951 to 2100. In order to characterize the drought, three widely used drought indicators were used: the standardized precipitation index (SPI), the reconnaissance drought index (RDI), and the standardized precipitation and evapotranspiration index (SPEI). The ensemble of the seven (7) GCMs that used RCA-4 was able to capture several useful characteristics of Nigeria’s historical climatology. Future climates were forecasted to be wetter than previous periods during the study period based on the output of drought characteristics as determined by SPI. SPEI and RDI predicted drier weather, in contrast. SPEI and RDI’s predictions must have been based on the effect of rising temperatures brought on by global warming as depicted by RCP 8.5, which would then have an impact on the rate of evapotranspiration. According to drought studies using the RCP 8.5 scenario, rising temperatures will probably cause more severe/extreme droughts to occur more frequently. SPEI drought frequency changes in Nigeria often range from 0.75 (2031–2060) to 1.80 (2071–2100) month/year, whereas RDI changes typically range from 0.30 (2031–2060) to 0.60 (2071–2100) month/year. The frequency of drought incidence has recently increased and is now harder to forecast. Since the Sendai Framework for Disaster Risk Reduction 2015–2030 (SFDRR) and the Sustainable Development Goals (SDGs) have few more years left to be completed, drastic efforts must be made to create climate-resilient systems that can tackle the effects that climate change may have on the water resources and agricultural sectors.
1. Introduction
Nigeria has been identified as being particularly vulnerable to the effects of climate change, which primarily appear as natural disasters such as flood or drought. Because hydroelectric power and food production are heavily dependent on precipitation in this area, any considerable decrease in precipitation will have a long-term dramatic impact on people’s socioeconomic activities. Over the past 50 years, there have been significant changes in the country’s land and water resource management policies as a result of the precipitation declines in the 1970s and 1980s [1,2,3,4]). According to the geographical zone, the future climate outlook is expected to have a variety of extreme characteristics in different parts of the world [5]. Nigeria is the key stakeholder, and West Africa has been regarded as one of the most susceptible regions [6,7]. Since the majority of Nigerians work in industries that are susceptible to climate change, any tilt toward dryness in the future climate may enhance this area’s susceptibility to severe drought. Therefore, it is important to assess and have knowledge about the expected characteristics of the region’s climate in the future in order to improve the impact and vulnerability evaluations.
Drought has been directly or indirectly linked to water scarcity as well as many other environmental problems. The Intergovernmental Panel on Climate Change Assessment Report of 2021 has indicated various impact of changes in climate on global and regional water resources [8]. Many studies have also indicated an increasing hydrological cycle as a result of variability in the frequency and magnitude of precipitation on a regional scale [9,10,11,12]. However, it is important to recognize that this type of alteration will have a regional impact on the frequency of drought or flood conditions. An evaluation of regional climate can either be conducted through statistical analysis of historical data or mathematical modelling of the physical hydrological procedures for future forecasting purposes [13].
Modeling for West African countries, or basins using global circulation models, (GCMs) has highlighted concerns about the potential connection between precipitation and temperature change [14,15]. When it comes to the timing of changes in rainfall and evapotranspiration, predictions made using the Coupled Model Inter-comparison Project Phases 5 and 6 (CMIP5 and CMIP6) are out of sync [16,17], thereby crippling investment strategies [14,18]. Additionally, a review by Druyan [19] of studies based on eight GCMs and two RCMs on Sahel precipitation during the past century indicated a lack of consensus, underscoring the necessity for additional studies that can provide hydrological pointers for climate change in the region. Shiru et al. [20]; Ogunrinde et al. [21]; Ajayi and Ilori [18]; Adeyeri et al. [22]; Kumi and Abiodun [23]; Oguntunde et al. [14] and Sylla et al. [24] emphasized both historical and future prediction changes based on GCMs in extreme climate variability and trends over either some sub-regions in West Africa or the whole West Africa.
One of the studies [18] was based on a single global climate model (GCM), without taking into account the biases in the projection. The indices computed in some of the studies include the length of warm spell, string of rainy and dry days, the start and end of precipitation, and the length of the growing season; however, it does not provide enough information on the local drought conditions. Additionally, there are no studies specifically on the projection of drought features based on climate change scenarios on a national scale. Furthermore, the specific atmospheric circulation and climate of Nigeria prevent the straightforward transfer or application of projections from other nations to the development of mitigation mechanisms.
This study focuses on the investigation of important drought characteristics on the long seasonal (hydrological) drought type over Nigeria. The investigations that completely understudy drought occurrence in the country using both observatory and simulated dataset-based climate change scenario are not readily available. Thus, studies such as this one can support adequately organizing agricultural and water resources under global warming conditions. Consequently, the specific aims of this study are: (i) to define drought in Nigeria using three drought indices; and (ii) to analyze the influences of climate change on the probable increases in drought frequency and intensity over Nigeria under the RCP 8.5 scenario.
2. Materials and Methods
2.1. Study Area
Nigeria has a total land mass area of about 930,000 km2 and is situated between latitudes 4°15′ and 13°55′ N and longitudes 2°40′ and 14°45′ E (Figure 1). Nigeria has only two distinct seasons (dry and wet) because it is a tropical country. The dry season is marked by low relative humidity and higher temperatures than during the wet season due to strong winds from the Sahara Desert. The mean annual temperature in the country is usually around 25 °C. It is usually very hot in the northern region between March and June and between February and April in the south, as the temperature may rise above 30 °C during the day and drop a little during the night period. Rainfall magnitude and frequency in Nigeria relies primarily on the latitude. As the latitude increases, so the rainfall strength also increases. The southern region generally sees convectional rains because of the region’s closeness to the equatorial belt.
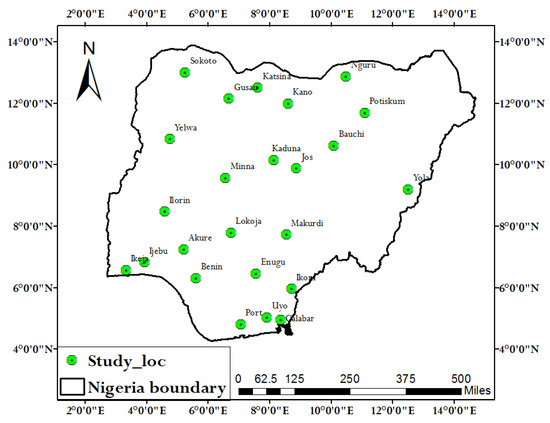
Figure 1.
The study area indicating the meteorological stations used.
2.2. Datasets and Analytical Procedure
Both observatory (NIMET) and numerical models are used in this study’s analysis. The two datasets include minimum and maximum temperatures as well as rainfall. The NIMET datasets were gathered at the Nigeria Meteorological Agency’s Abuja, Nigeria, headquarters. Twenty-five stations were covered using historical NIMET datasets with a daily temporal resolution between 1981 and 2015. The retrieved NIMET datasets underwent a homogeneity and quality control test. The datasets for the models were developed using a dynamic downscaling strategy. This is one of the techniques for producing a higher resolution climatic reality from global circulation models with a lower resolution (GCMs). In this study, the Rossby Center Regional Climate Model (RCA-4) as reported by Nikulin et al. [25] was used to downscale seven GCMs spanning the CORDEX-African region. The historical period, which runs from 1951 to 2005, and the future period, which runs from 2006 to 2100, are both included in the downscaling’s output.
The RCA-4 historical simulations between 1981 and 2005 were compared with observatory datasets in order to gauge the effectiveness of the model in reproducing the historical climate of Nigeria within the study area (NIMET). The high emission scenario included in the simulations, known as RCP 8.5, covers the period from 1951 to 2100. According to the RCP8.5 scenario, CO2 levels will be around 950 ppm by 2100 [14].
The standardized precipitation index (SPI), standardized precipitation evapotranspiration index (SPEI), and reconnaissance drought index (RDI) are the three drought indices that have been studied. SPI is a probability-based indicator that assesses how much a given period’s rainfall deviates from the long-term average value, which is ideally not less than 25 to 30 years [26]. The rainfall data series was fitted using the gamma distribution. The greatest likelihood technique was used to determine the distribution factors and the probability density function (PDF) of the gamma distribution can be written as follows:
where α is the shape factor, β is the scale factor and is the rainfall value and is the gamma function.
In terms of computation, the SPI and SPEI are similar. The main modification is the inclusion of PET data, which is a measure of evaporation demand. When PET is subtracted from rainfall values, the climatic water balance during the time period being evaluated is calculated [27]. Next, a three-parameter log-logistic distribution is fitted to the difference. In this work, the Hargreaves empirical model was used to calculate the PET [28]. The SPI and SPEI within the study region were calculated using the R programming language over a 12-month timeline, which is crucial for hydrological drought evaluation.
The basic form of RDI, like the SPEI, is the ratio of total rainfall to PET for a particular reference time. Because it includes the primary input and outflow of a natural water system, the RDI may be a suitable index for assessing water availability. The DrinC (Drought Indices Calculator) program was utilized to streamline the RDI computing process. The NIMET and RCA-4 model datasets were used to generate the indices individually. Using monthly, seasonal, and yearly timesteps, the initial value (ak) is displayed in aggregated form. The ak is calculated as follows for the year i and a time basis of k (months):
The preparation of RDIst used the assumption that ak values follow a lognormal distribution, and RDIst is computed as follows:
where y(i) is the ln, is mean and is its standard deviation.
3. Results and Discussion
3.1. Assessment of Climate Models over Nigeria
This section briefly discusses the capacity of the climate models to accurately represent the climate of the research area. Prior to the model’s assessment, Figure 2a shows the long-term historical average monthly distribution of Tmin and Tmax, while Figure 2b displays that of the precipitation (PRCP) and evapotranspiration (ET) of the study area. The performance of each model dataset in relation to the observed datasets is shown in Figure 3. Since the correlation coefficient (r) value is more than 0.6, the performance of each of the seven models is adequate. The observed data in Figure 4 provide as an example of how well the models captured the important aspects of the annual seasonal cycle of the climate parameters and the size of the cycles. For example, the highest temperatures are recorded in both observed and model data during the months of March and November, which also happen to be transition months between the Dry–Wet and Wet–Dry seasons, respectively (Figure 4b). The models also correctly predicted the minimum local temperature in August, which also happens to be the month with the most clouds (Figure 4c). The measured air temperature does, however, exhibit some bias according to the models. For Tmin from January to December and for Tmax from April to November, the models showed a cold bias. Except for August, the observed Tmax curve coincided with the ensemble members of the model datasets, and values have generally been near to the ensemble median throughout the year. With few exceptions, the models also accurately depicted the observed annual seasonal rainfall cycle over Nigeria (Figure 4a). For instance, the observed rainfall pattern peaked in July, whereas the simulated rainfall pattern shows two modal peaks in April and August. The observed peak can be connected to the Intertropical Convergence Zone (ITCZ) movement because Nigeria is known for having numerous climate belts, which can produce volatility over the area between April and August, which may not have been considered in the development of the climate models [21]. The observed rainfall values only deviated from the ensemble members of the models in the months of May and June. According to [14], the pattern of rainfall distribution in the West African region might either have a single modal characteristic or a double modal characteristic. This demonstrates that the single modal peak reported by the NIMET observation dataset and the twin modal peaks suggested by the ensembles of RCA-4 are nonetheless consistent with the research area’s climatology.
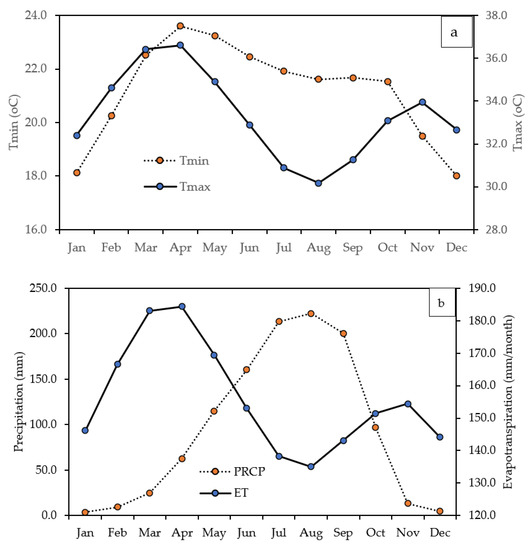
Figure 2.
Long-term historical average monthly distribution of (a) Tmin and Tmax; and (b) precipitation (PRCP) and evapotranspiration (ET) of the study area.
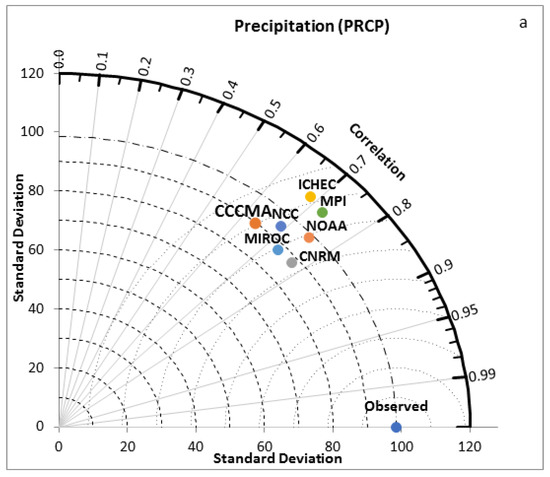
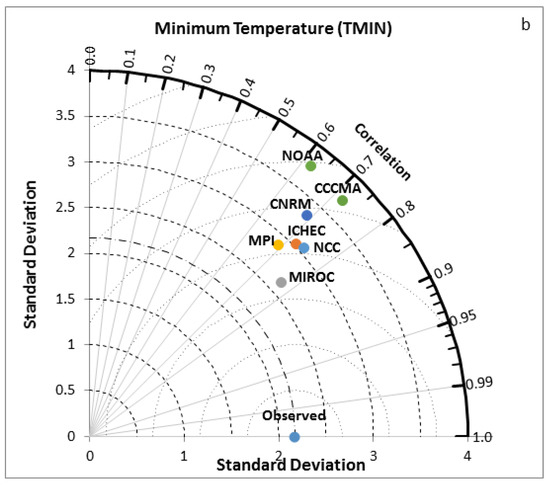
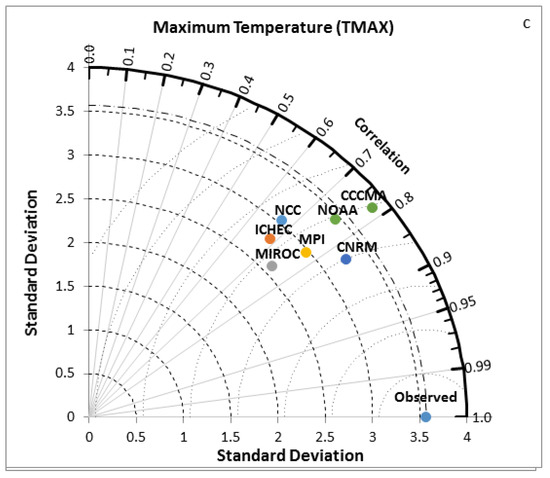
Figure 3.
Taylor Diagram to compare the seven models and their combinations with respect to the observed data in terms of correlation coefficient and standard deviation. (a) for precipitation, (b) for minimum temperature, and (c) for maximum temperature.
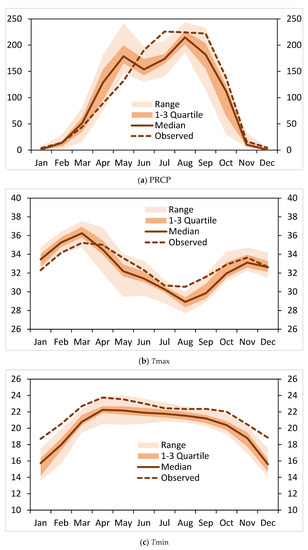
Figure 4.
The annual seasonal cycle of observed and modelled of (a) Precipitation (PRCP) in mm/month; (b) Maximum Temperature (Tmax) in °C; and (c) Minimum Temperature (Tmin) in °C over Nigeria between 1981 and 2005. Note: The light pink color indicates the range between the maximum and minimum values; the dark pink shows the range between the 25th and 75th percentiles, while the thick line indicates the models’ median and the dashed line shows the NIMET observation.
3.2. Future Prediction of Drought Characteristics
Figure 5a–c display predicted variations in drought frequency and intensity over Nigeria using SPI, SPEI, and RDI. The RCA-4 ensemble median over the research area suggests that the SPEI will see greater negative oscillations under the RCP 8.5 scenario, especially toward the end of the twenty-first century. According to this pattern, from 2035 to 2100, Nigeria would experience an increase in the frequency and severity of droughts. A comparable circumstance is also noticed with RDI (Figure 5c). On the other hand, as the twenty-first century goes on, the RCA-4 ensembles median shows a relatively stable to minimal changes in SPI for RCP8.5 scenario (Figure 5a). According to some earlier studies [27,29], drought indices that included PET (SPEI and RDI) are preferable to rainfall-based (SPI) indices in conditions of high temperatures. The current study’s future drought projections are in good agreement with the findings of Oguntunde et al. [14] which state that, under historical climatic conditions, there is a strong correlation and similar trend pattern between the rainfall-based index (SPI) and the PET drought indices (SPEI and RDI). However, there are significant deviations in both the frequency and intensity of drought under RCP 8.5, particularly from the middle to the end of the twenty-first century.
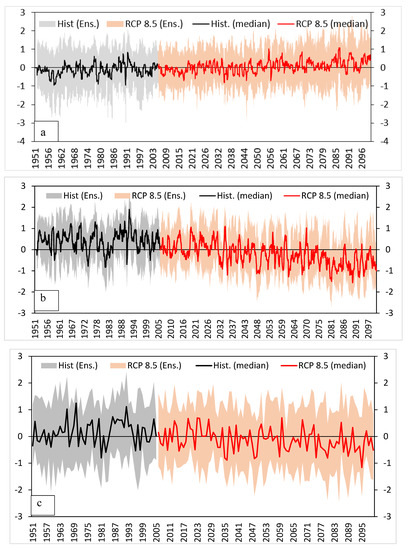
Figure 5.
Historical and projected future changes in 12-month drought intensity over Nigeria for RCP 8.5 climate scenario. The droughts are characterized using (a) SPI; (b) SPEI; and (c) RDI.
In Figure 6, the 12-month RDI, SPEI, and SPI drought indices for the near and far eras are used to indicate the change in the frequency of drought. The SPEI indicates 0.75 month/year during 2031–2060 (relative to the reference era, 1976–2005) and 1.80 month/year in 2071–2100 (relative to the far era), whereas the RDI indicates 0.3 month/year in 2031–2060 and 0.6 month/year in 2071–2100, although the variations from the SPI are negligible. Projections of the change in drought frequency based on the RDI or SPEI are anticipated to be higher than estimates based on the SPI, indicating a higher atmospheric water demand as a result of global warming (RCP 8.5). Under the RCP 8.5, changes in drought frequency based on SPI are forecast to decrease during the near and far eras whereas drought occurrence based on RDI and SPEI is projected to increase. The SPI’s reduction in the frequency of droughts indicates that precipitation is expected to rise, especially as the twenty-first century comes to a close.
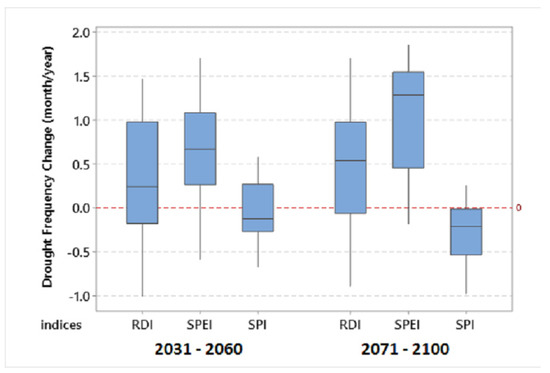
Figure 6.
Projected future changes in 12-month drought frequency over Nigeria.
This shows that a good mitigation approach must be carefully considered when assessing the danger of future droughts. With the exception of flash floods caused by an abrupt rise in sea level, an increase in temperature of between 2 and 4 °C has the power to cancel out the effects of any increase in the intensity and duration of precipitation within a short period. In order to better understand how precipitation, evaporative demand, and streamflow might affect drought conditions, drought indices can be used [11].
Global natural disasters have become more frequent since the turn of the century, according to data from CRED [30], and they have in fact become the new normal. The frequency of natural disasters has been steadily rising over the past 20 years at a significant rate. The rate of occurrence was 360 incidents per year on average in the 2010s, compared to 100 and 90 events on average in the 1980s and 1970s, respectively. Natural catastrophes are occurring more frequently than ever, and this has a tremendous impact on both the economies and people’s way of life. Globally, the cost of major natural disasters (related to geophysics, biology, hydrology, and climate) has been projected to be above USD 170 billion annually for the past twelve years. Since the global average surface temperature has been steadily rising at an alarming rate over the past five decades compared to the rate of growth between 1961 and 1980, there has been a clear correlation between climate-related disasters and climate change. We are starting to notice how climate change is causing an increase in the frequency and intensity of extreme weather events (for example, severe drought episodes), even as many studies on the impact of climate change are still in the early stages of development.
Particularly in Nigeria, the overpopulation, changing climate, and lack of effective river development strategies are projected to produce issues in the agricultural and water resources sectors in the future [14]. According to earlier climate simulation studies over West Africa, there is a high likelihood that as the current century goes on, temperatures will rise and there will be an increase in the number of extreme climate events (such as droughts, floods, and protracted dry spells during the rainy season) [15,31]. In a few decades, a fierce competition for water resources is anticipated to lead to disputes between upstream and downstream parties, underlining the necessity of sound water policy and effective drought mitigation measures in Nigeria.
More regional climate models (RCMs) could improve the assessment of prediction uncertainty in the future. Additionally, CORDEX’s higher resolution models will make it possible to spatially analyze future projections, providing more helpful information on high-risk areas within Nigeria. Other climatic scenarios, such as RCP 4.5 and 6.0, should be taken into account.
4. Conclusions
Natural disasters have always posed a danger to society, the economy, and the environment. The frequency of incidence has recently increased and is now harder to forecast. Since the Sendai Framework for Disaster Risk Reduction 2015–2030 (SFDRR) and the Sustainable Development Goals (SDGs) have less than ten years left to be completed, serious efforts must be made to create climate-resilient systems that will battle the effects that climate change may have on the water resources and agricultural sectors. The study’s key findings suggest that the ensemble of RCA-4 offers an accurate representation of Nigeria’s seasonal changes in its yearly cycle climatology. The variation of drought using NIMET data is comparable to the deviation in the drought indices derived using models from RCA-4 ensemble members. The frequency and severity of droughts will also rise as the twenty-first century goes on due to the effects of climate change, according to RDI and SPEI under the RCP 8.5 climatic scenario. The current analysis will help governments and stakeholders at all levels design tactical adaptation and mitigation systems, according to its forecasts.
Author Contributions
A.T.O., P.G.O., Q.B.P., N.T.T.L. and D.T.A.: Original project, Conceptualization, Methodology, Software, Writing—Original version, Visualization, Reviewing and Editing. A.S.A., J.T.F., D.A.O. and Q.B.P.: Conceptualization, Methodology, and Software. D.T.A.: Formal analysis, Original version, Conceptualization, Writing, Supervision, and Revision. J.T.F., D.A.O., Q.B.P. and N.T.T.L.: Formal analysis, Revision, and Writing. All authors have read and agreed to the published version of the manuscript.
Funding
This research received no external funding.
Institutional Review Board Statement
Not applicable.
Informed Consent Statement
Not applicable.
Data Availability Statement
The data that support the findings of this study are available upon reasonable request.
Conflicts of Interest
The authors declare that they have no known competing financial interests or personal relationships that could have appeared to influence the work reported in this paper. This manuscript has not been published or presented elsewhere in part or entirety and is not under consideration by another journal. There are no conflicts of interest to declare.
References
- Ogunrinde, A.T.; Oguntunde, P.G.; Akinwumiju, A.S.; Fasinmirin, J.T. Analysis of Recent Changes in Rainfall and Drought Indices in Nigeria, 1981–2015. Hydrol. Sci. J. 2019, 64, 1755–1768. [Google Scholar] [CrossRef]
- Oguntunde, P.G.; Lischeid, G.; Abiodun, B.J. Impacts of climate variability and change on drought characteristics in the Niger River basin, West Africa. Stoch. Environ. Res. Risk Assess. 2018, 32, 1017–1034. [Google Scholar] [CrossRef]
- van de Giesen, N.; Liebe, J.; Jung, G. Adapting to climate change in the Volta Basin. West Afr. Curr. Sci. 2010, 98, 1033–1038. [Google Scholar]
- Ogilvie, A.; Mahé, G.; Ward, J.; Serpantié, G.; Lemoalle, J.; Morand, P.; Barbier, B.; Diop, A.T.; Caron, A.; Namarra, R.; et al. Water, agriculture and poverty in The Niger River basin. Water Int. 2010, 5, 594–622. [Google Scholar] [CrossRef]
- Alfieri, L.; Bisselink, B.; Dottori, F.; Naumann, G.; de Roo, A.; Salamon, P.; Wyser, K.; Feyen, L. Global projections of river flood risk in a warmer world. Earth’s Futur. 2017, 5, 171–182. [Google Scholar] [CrossRef]
- IPCC. Climate Change 2007: The Physical Science Basis: Working Group I Contribution to the Fourth Assessment Report of the IPCC; Solomon, S., Qin, D., Manning, M., Chen, Z., Marquis, M., Averyt, K.B., Tignor, M., Miller, H.L., Eds.; Cambridge University Press: Cambridge, UK, 2007. [Google Scholar]
- IPCC. Impacts, Adaptation, and Vulnerability, Part A: Global and Sectoral Aspects: Working Group II to the Fifth Assessment Report of the Intergovernmental Panel on Climate Change; Field, C.B., Barros, V.R., Dokken, D.J., Mach, K.J., Mastrandrea, M.D., Bilir, T.E., Chatterjee, M., Ebi, K.L., Estrada, Y.O., Genova, R.C., et al., Eds.; Cambridge University Press: Cambridge, UK; New York, NY, USA, 2014; p. 1132. [Google Scholar]
- Intergovernmental Panel on Climate Change. Summary for Policymakers. In Climate Change 2021: The Physical Science Basis. Contribution of Working Group I to the Sixth Assessment Report of the Intergovernmental Panel on Climate Change; Cambridge University Press: Cambridge, UK; New York, NY, USA,, 2021; pp. 3–32. [Google Scholar]
- Yao, N.; Zhao, H.; Li, Y.; Biswas, A.; Feng, H.; Liu, F.; Pulatov, B. National-scale variation and propagation characteristics of meteorological, agricultural, and hydrological droughts in China. Remote Sens. 2020, 12, 3407. [Google Scholar] [CrossRef]
- Rudd, A.C.; Kay, A.L.; Bell, V.A. National-scale analysis of future river flow and soil moisture droughts: Potential changes in drought characteristics. Clim. Chang. 2019, 156, 323–340. [Google Scholar] [CrossRef]
- Meresa, H.K.; Osuch, M.; Romanowicz, R. Hydro-Meteorological Drought Projections into the 21-st Century for Selected Polish Catchments. Water 2016, 8, 206. [Google Scholar] [CrossRef]
- Quan, Q.; Liang, W.; Yan, D.; Lei, J. Influences of joint action of natural and social factors on atmospheric process of hydrological cycle in Inner Mongolia, China. Urban Clim. 2022, 41, 101043. [Google Scholar] [CrossRef]
- Commonwealth Scientific and Industrial Research Organization. Hydrological consequences of climate change-summary of outcomes for a scientific meeting. In Proceedings of the CSIRO Discovery Centre, Canberra, Australia, 15–16 November 2007; Commonwealth Scientific and Industrial Research Organization: Canberra, Australia, 2011; pp. 1–6. [Google Scholar]
- Oguntunde, P.G.; Abiodun, B.J.; Lischeid, G. Impacts of climate change on hydro-meteorological drought over the Volta Basin. West Afr. Glob. Planet. Change 2017, 155, 121–132. [Google Scholar] [CrossRef]
- Patricola, C.M.; Cook, K.H. Sub-Saharan Northern African climate at the end of the twenty-first century: Forcing factors and climate change processes. Clim. Dyn. 2010, 37, 1165–1188. [Google Scholar] [CrossRef]
- Taylor, K.E.; Stouffer, R.J.; Meehl, G.A. An Overview of CMIP5 and the Experiment Design. Bull. Am. Meteorol. Soc. 2012, 93, 485–498. [Google Scholar] [CrossRef]
- Eyring, V.; Bony, S.; Meehl, G.A.; Senior, C.A.; Stevens, B.; Stouffer, R.J.; Taylor, K.E. Overview of the Coupled Model Intercomparison Project Phase 6 (CMIP6) experimental design and organization. Geosci. Model Dev. 2016, 9, 1937–1958. [Google Scholar] [CrossRef]
- Ajayi, V.O.; Ilori, O.W. Projected Drought Events over West Africa Using RCA4 Regional Climate Model. Earth Syst. Environ. 2020, 4, 329–348. [Google Scholar] [CrossRef]
- Druyan, L.M. Studies of twenty-first-century precipitation trends over West Africa. Int. J. Climatol. 2010. [Google Scholar] [CrossRef]
- Shiru, M.S.; Chung, E.-S.; Shahid, S.; Alias, N. GCM selection and temperature projection of Nigeria under different RCPs of the CMIP5 GCMS. Theor. Appl. Climatol. 2020, 141, 1611–1627. [Google Scholar] [CrossRef]
- Ogunrinde, A.T.; Oguntunde, P.G.; Akinwumiju, A.S.; Fasinmirin, J.T. Evaluation of the impact of climate change on the characteristics of drought in Sahel Region of Nigeria: 1971–2060. Afr. Geogr. Rev. 2020, 40, 192–210. [Google Scholar] [CrossRef]
- Adeyeri, O.; Lawin, A.; Laux, P.; Ishola, K.; Ige, S. Analysis of climate extreme indices over the Komadugu-Yobe basin, Lake Chad region: Past and future occurrences. Weather Clim. Extrem. 2019, 23, 100194. [Google Scholar] [CrossRef]
- Kumi, N.; Abiodun, B.J. Potential impacts of 1.5C and 2C global warming on rainfall onset, cessation and length of rainy season in West Africa. Environ. Res. Lett. 2018, 13, 055009. [Google Scholar] [CrossRef]
- Sylla, M.B.; Nikiema, P.M.; Gibba, P.; Kebe, I.; Klutse, N.A.B. Climate Change over West Africa: Recent Trends and Future Projections. In Adaptation to Climate Change and Variability in Rural West Africa; Springer: Berlin/Heidelberg, Germany, 2016; pp. 25–40. [Google Scholar] [CrossRef]
- Nikulin, G.; Jones, C.; Giorgi, F.; Asrar, G.; Büchner, M.; Cerezo-Mota, R.; Christensen, O.B.; Déqué, M.; Fernandez, J.; Hänsler, A.; et al. Precipitation climatology in an ensemble of CORDEX-Africa regional climate simulations. J. Clim. 2012, 25, 6057–6078. [Google Scholar] [CrossRef]
- McKee, T.B.; Doesken, N.J.; Kleist, J. The relationship of drought frequency and duration to time scales. In Proceedings of the 8th Conference on Applied Climatology, Anaheim, CA, USA, 17–22 January 1993; American Meteorological Society: Boston, MA, USA, 1993; pp. 179–184. [Google Scholar]
- Vicente-Serrano, S.M.; Beguería, S.; López-Moreno, J.I. A multi-scalar drought index sensitive to global warming: The standardized precipitation evapotranspiration index. J. Clim. 2010, 23, 1696–1718. [Google Scholar] [CrossRef]
- Hargreaves, G.H.; Samani, Z.A. Reference Crop Evapotranspiration from Temperature. Appl. Eng. Agric. 1985, 1, 96–99. [Google Scholar] [CrossRef]
- Beguería, S.; Vicente-Serrano, S.M.; Reig, F.; Latorre, B. Standardized precipitation evapotranspiration index (SPEI) revisited: Parameter fitting, evapotranspiration models, tools, datasets and drought monitoring. Int. J. Climatol. 2014, 34, 3001–3023. [Google Scholar] [CrossRef]
- Centre for Research on the Epidemiology of Disasters. International Disaster Database-EM-DAT CRED. EM-DAT [Online]. Brussels. Updated as at 18 January 2021. Available online: http://www.emdat.be/database (accessed on 30 August 2022).
- Oguntunde, P.G.; Abiodun, B.J. The impact of climate change on the Niger River Basin hydroclimatology, West Africa. Clim. Dyn. 2013, 40, 81–94. [Google Scholar] [CrossRef]
Publisher’s Note: MDPI stays neutral with regard to jurisdictional claims in published maps and institutional affiliations. |
© 2022 by the authors. Licensee MDPI, Basel, Switzerland. This article is an open access article distributed under the terms and conditions of the Creative Commons Attribution (CC BY) license (https://creativecommons.org/licenses/by/4.0/).