Abstract
We analyzed the C-structures in the mesospheric metal layers. We used two datasets: one from a narrow band Sodium (Na) Density and Temperature LIDAR and the other from a high-resolution dual band Na and Potassium (K) LIDAR, both operated at São José dos Campos, Brazil (23° S, 46° W). We also investigated the Es layer occurrence and wind shear influences forming these structures. We found three C-type events over 82 analyzed nights in the first data set. They all showed lower temperatures inside C-structures compared to the borders. The squared Brunt-Väissälä frequency analyses showed positive values in the region of C-structures. In two out of three cases, dynamical instability was present (Ri < 0.25). We compared these results with the nine simultaneous C-type events identified in the 185 nights from the second data set. They showed height and time simultaneity correspondence as observed in the Na and K layers. Our results showed a low correlation between Es occurrence and C-structures. Additionally, strong wind shears in the altitude and time where C-structures appeared were always present. The advection of a metal cloud to the LIDAR station and a wind distortion seems to be the plausible mechanism that can explain all the observations.
1. Introduction
Sporadic events of enhancement in neutral metal layers concentration within thin layers (Ns) were reported for the first time by [1]. Several authors have investigated these layers and showed they are much thinner than the background metal layer, lasting for a few minutes to hours, and do not present rapid temporal height variation. Despite its name “sporadic”, the studies reveal that this is a regular event, as shown by [2], they occurred in more than 88% of the analyzed simultaneous Sodium (Na) and Potassium (K) data.
However, Kane et al. [3] reported a rare phenomenon over Arecibo (18.35° N, 66.75° W) characterized by density enhancement extended for several kilometers vertically and lasting for around an hour. These peculiar structures presented their shape similar to the alphabet letter “C” when observed in the Height-time-intensity (Lidargrams) plots. Ref. [3] interpreted these layers as a manifestation of field-aligned ionospheric irregularities. Other possible mechanisms suggested by those authors were related to wave breaking and Kelvin-Helmholtz (KH) instabilities. On the other hand, Clemesha et al. [4] identified six similar events in 766 h of Na LIDAR observations over São José dos Campos (23° S, 46° W) and correlated them with winds and ionospheric Sporadic E layers (Es) occurrences. The results presented by [4] did not support the mechanisms presented by [3]. One result was the lower correlation with the Es layers appearance. This was why authors found it hard to believe the source of these layers was related to ionospheric irregularities. Another result was that the structure’s upper part lasts for a shorter time than the bottom; furthermore, they did not present any shape going down similar to the overturning wave; hence Clemesha et al. [4] concluded these events were not related to wave-breaking manifestation. In addition, from simultaneous wind measurements, the authors proposed that these structures resulted from a wind distortion of pre-existing Na cloud or remnant of spatial structures advected over the lidar site. The lack of simultaneous temperature measurements at that time made it difficult for the authors to draw more precise conclusions about the formation mechanism.
Several authors have suggested dynamical instability to be related to these complex structures e.g., [5,6,7]. Dynamical instability refers to a process in which the atmosphere becomes unstable and its movement cannot be considered a laminar fluid. To determine whether the flow will become turbulent is necessary to evaluate both buoyancy and wind shear. High accuracy and resolution measurements of wind and temperature are essential for this purpose. Even though much effort has focused on developing instruments that can make precise high-resolution wind and temperature measurements in the MLT region, only a few sites of such measurements are working worldwide. Meanwhile, mesospheric metal layers’ density and emission intensity can be used as an accurate tracer of atmospheric dynamics and have helped to improve the understanding of atmospheric wave propagation and instabilities in that region, e.g., [8,9,10,11,12].
Therefore, this paper aims to study the role of convective and dynamic instabilities in forming that particular structure. In this sense, we investigate Na data from 2007 to 2009, when a narrow band Na LIDAR operated to measure density and temperature at São José dos Campos. We also used ionosonde data for Es layer investigation and wind measurements from an all-sky interferometric meteor radar, both located at Cachoeira Paulista (22.7° S, 45° W), a nearby location. Based on these multiple data sets, we investigate three C-structures in terms of the dynamical and convective instabilities present in the region of their occurrences. We found lower temperatures inside the structure and a stable convective structure in all cases. All events presented strong vertical wind shear, although only two presented dynamical instability. In addition, we presented an analysis of nine events observed simultaneously in the K and Na layers. Up to now, investigation of such structures simultaneously observed in two mesospheric metal layers was done only in case studies [13]. This work analyzes several events observed simultaneously in two alkali metals for the first time. The similar characteristics observed in these metal layers indicate the same formation mechanism. In the following sections, we describe the method applied in the present study, the results and discussions, and the conclusions.
2. Materials and Methods
A narrowband Na LIDAR operated at São José dos Campos (SJC) from 2007 to 2009, measuring density and temperature profiles. The 589 nm pulses were generated by mixing the output of two pulsed neodymium: yttrium/aluminum/garnet (Nd:YAG) lasers, seeded by continuous wave Nd:YAG seeders operating at 1064 and 1319 nm, respectively. Thermally tuning the seeders made it possible to switch the output wavelength between the Na D2a resonance peak and the crossover minimum. The temperature was inferred by comparing the scattering from the Na layer at these two wavelengths. This method allowed determining temperature with 300 m and 3 min of height and time resolution, respectively. The details about the LIDAR system and the method for inferring temperature can be found in [11,14]. We found 3 C-type structures over 82 nights (~600 h) of observations.
An all-sky meteor wind radar located at Cachoeira Paulista (CP), about 100 km northeast of LIDAR station, was used to complement the discussion about wind shear and dynamical instabilities at the time of the events. Hourly winds from 80 to 100 km, with a 2 km height resolution, were inferred by this all-sky meteor radar. The equipment details and techniques employed to determine the wind can be found in [15,16,17].
Richardson’s () number was used as a dynamical instability indicator. It is a non-dimensional index that measures the fluid’s tendency to remain stratified. When drops down to 0.25, the flow starts to be turbulent. So, a necessary condition but not sufficient condition for instability is less than ¼ [18]. It can be calculated by
With
where: is the vertical shear in horizontal wind; z is height, is the vertical gradient of temperature measured by Na LIDAR; is the gravity acceleration; and is the dry adiabatic lapse rate. Equation (2) is the square of Brunt-Väissällä frequency () and convective instability may occur when is negative.
Ionospheric Es layer occurrence was evaluated using data from the Digisonde installed at CP. This equipment is a radar that transmits radio waves continuously into the ionosphere ranging from 1 to 30 MHz [19]. We manually checked the data every 10 min using the SAO-Explorer software since significant discrepancies can be found between the automatically scaled and the correct values over the Brazilian stations [20]. The ionosondes provide the ionospheric profile in graphs of frequency versus virtual height, from which it is possible to obtain the desired parameters.
On 20 November 2016, a dual beam Na-K lidar was installed at the same place as the narrow band Na density and temperature LIDAR. Based on the resonance fluorescence scattering mechanism, this lidar can simultaneously obtain Na and K atom signals from the MLT region. Details about the system and data acquisition can be found in [21] and [22]. This LIDAR provides Na and K photon counts with a resolution of 20 s and 96 m for time and height, respectively. To increase the signal-to-noise ratio (SNR), we combine ten profiles in time in the analysis. Then the data temporal and height resolution are changed to 3.3 min and 96 m, respectively, to infer Na and K densities at MLT for details about the method of inferring Na and K concentrations, see [23]. We used data set of this LIDAR from 2017 to 2019.
3. Results
In Table 1, the events and their main characteristics studied in the first data set are listed. Three instruments operated simultaneously during those events providing information about Na density, atmospheric temperature, winds, and Es layer occurrence. Table 2 shows the events observed with the second data set, a LIDAR using simultaneously two different wavelengths (589 nm and 770 nm).

Table 1.
List of the three cases of C-Type events observed in SJC and their main characteristics.

Table 2.
Main characteristics of C-type events observed by Dual beam Na-K CBJLSW LIDAR. Last column represents the occurrence of the Es layer: “No” means the Es absence; Esf refers to the flat Es layer type; Esa the auroral type; and Ess layer refers to the slant type.
3.1. First Data Set 2007 and 2008: C-Type Events and Convective and Dynamical Instability Relation
Concerning the several atmospheric parameters available in the first data set, we could investigate the convective and dynamical instabilities during the events by evaluating the and . In Table 1, we can see some characteristics of the three events analyzed during 82 observational nights. All events occurred on the topside of the Na layer ranging from 94 to 102 km, having a vertical width from 5 to 7 km. Note that all cases showed positive values for frequency, indicating a convectively stable medium. The number shown in the last column will be discussed afterward. Interestingly, except for case 3, all others showed more than one structure through the night. Figure 1 presents the Lidargrams showing these structures’ height and time evolution.
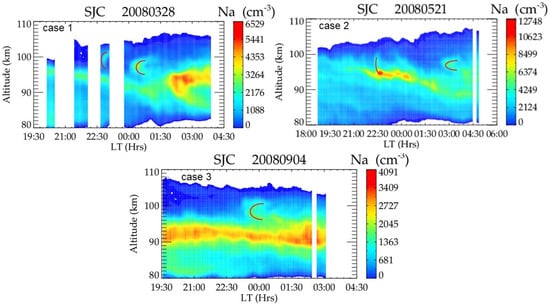
Figure 1.
Height-time intensity profiles of Na concentration measured in SJC on Case 1: 28–29 March 2008; Case 2: 21–22 May 2008 and Case 3: 4 September 2008. Curves sketched in red highlight the positions of the C-type structures.
In Figure 1, we can see the well-defined C-structures, highlighted with a red line at the top of the Na layer for all the cases which are very similar to those reported by other works e.g., [3,4,24]. Besides the data interruptions, we can identify two C-structures in case 1, on the night of 28–29 March 2008. The first one started at 22:40 LT around 98 km with a vertical range of 5 km and lasted for 20 min. The second one (case 2) began at 00:00 LT around 97 km, with a vertical range of 6 km, and lasted for 90 min. Two C-shapes can also be identified in case 2, during the night of 21–22 May 2008. The first structure arises at 22:12 LT at around 98 km, and we can see the density enhancement as upward and downward, covering a total of 5 km vertical range, lasting for 36 min. The second enhancement occurred on 02:18 LT at around 97 km, with a similar 5 km vertical range, but it lasted twice as long as the first (72 min), and the branches are better visualized. Unlike the two previous cases, in case 3, only one structure can be identified on 4 September 2008, around 98 km at 23:30 LT, lasting for one hour and with a 7 km vertical range.
The height and time evolution plots of temperature measured for those three events are presented in Figure 2. The contours represent the overplotted Na density concentrations to identify better the location of the C-type events and the temperature around them. We can see in all the cases that the temperatures inside the structures are lower than in the borders. Moreover, it seems that there is a negative temperature gradient of around 20 K from the lower border to the inner part of the structure. For example, the temperature inside the first structure in case 1, as shown in Figure 2, is 160 K and increases to 180 K at the lower border surroundings; the second shows an inner temperature of 180 K and increases to 200 K at the bottom. In Figure 2, case 2, the inside temperature for the two structures is around 180 K, ranging from 190 K to 200 K outside, mainly compared to the bottom of the structure. In Figure 2, in case 3, the inside temperature is 160 K, and the outside is around 180 K. Maps showing the height and time intensity of are shown in Figure 3. Note that all C-type structures presented positive values of in their area, which is a convective stability indication. Besides these positive values, they are also close to zero inside the structure, which means a limit for instability conditions. The negative vertical temperature gradients shown in Figure 2 are the most probable cause of these convective instability occurrences.
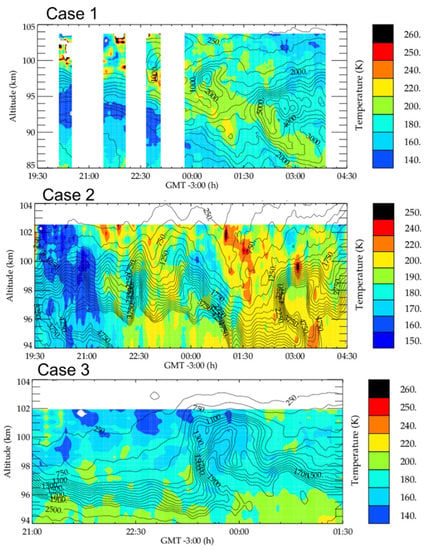
Figure 2.
Height-time evolution of Temperature measured by Na-LIDAR for the three cases reported in Figure 1. Overplotted contours represent Na concentrations. Case 1 represents data measured on 28–29 March 2008; Case 2: 21–22 May 2008 and Case 3: 4–5 September 2008.
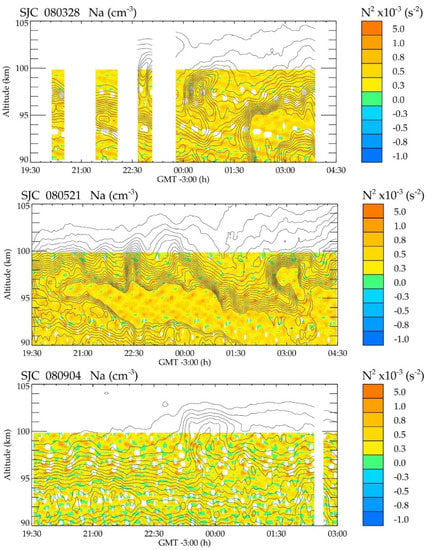
Figure 3.
Height and time maps of evolution observed in thethree cases of C-type events and over-plotted with Na concentration. The white points in the contour plots are the values that exceed the scale limits. We used a routine that considers a small grid and a cell filling to avoid bias in the analysis. SJC 080328 represents case 1, data measured on 28–29 March 2008; SJC 080521 is Case 2: 21–22 May 2008 and SJC 080904 is case 3: 4–5 September 2008.
Figure 4 presents zonal and meridional winds’ height and time color contours over CP. Each contour represents a module of 25 m/s wind velocity. The winds vary greatly in a few kilometers of altitude over 94 km, where the C-structures occurred, indicating strong vertical wind shear. We calculated the vertical shear of horizontal wind, as expressed in the denominator of Equation (1). The values reached a minimum of 40 m/s/km in case 1, 35 m/s/km in case 2, and 20 m/s/km in case 3. These strong values of the vertical wind gradients trigger dynamical instability and can be evaluated by the number, presented in Figure 5. Observe that the drops to values below 0.25 at 98 km in cases 1 and 2 for almost the whole night, suggesting the presence of turbulence.
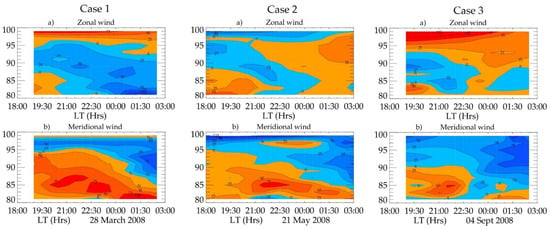
Figure 4.
Zonal (Upper panels) and Meridional (Bottom panels) winds measured at Cachoeira Paulista at the time of C-type events on 28–29 March 2008 (Case 1); 21–22 May 2008 (Case 2) and 4–5 September 2008 (Case 3). Cold colors represent negative (Westward and Southward) values and hot colors represent positive values of wind (Eastward and Northward). Each contour corresponds to 25 m/s.
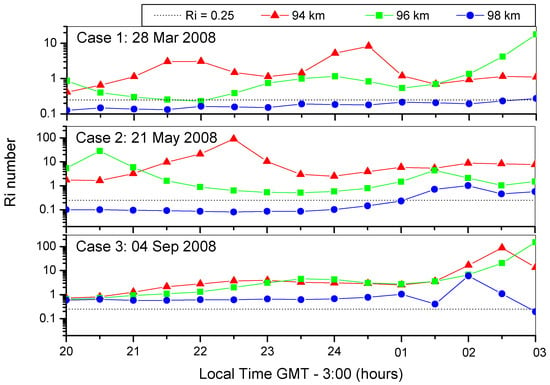
Figure 5.
Richardson Number for the three cases of C-type structures presented previously at three different altitudes.
3.2. Second Data Set 2017–2019: C-Type Observed in Two Different Metal Layers, Na and K Simultaneously
The present section analyzes nine C-type events observed simultaneously in the Na and K layer. Although Na and K layers are alkali metals, their layers present different characteristics in the MLT region. For example, on average, the K centroid height is 1.3 km lower and its width is thinner than that of the Na. Hence the simultaneous observation of a phenomenon in these two metals can bring information about its generation mechanism. Figure 6 presents K and Na concentrations measured on the night of 5–6 September 2017. A clear C-type structure can be seen in both layers around 03:30 LT, from 89 to 94 km, and last until 05:40 LT. Notice that C-structure presents the same height and time range and the same time occurrence in both metal layers. In other words, the structure in the Na layer overlaps that in the K layer. This means the C-structures are independent of the type of metal species.
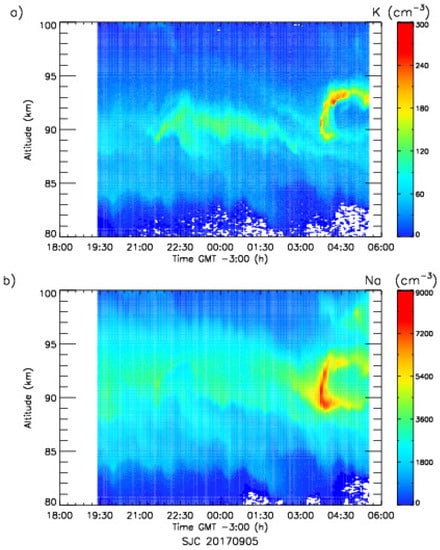
Figure 6.
Height time intensity of K (panel a) and Na (panel b) concentration maps measured simultaneously in SJC by the Dual-beam Na-K CBJLSW LIDAR on 5–6 September 2017. C-structure can be observed around 03:30 on 6 September.
Table 2 shows the time of occurrence and the altitude range of the nine C-type events simultaneously observed in the Na and K layers. As reported in the previous example shown in Figure 6, the C-structure is independent of the metal layer. The structure in the Na layer overlaps that in the K layer in nine simultaneous cases observed. Hence, we registered in this table the time of occurrence, altitude range, an average of vertical shear in horizontal wind, and the Es layer occurrence for each event independent of the wavelength used for its observation. Notice that the earlier event occurred at 21:00 LT and the latter at 04:48 LT, 90% after 01:00 LT. They all happened on the topside of the layers at altitudes from 87 to 100 km, reaching an average thickness of 4.8 km. The Es layers were observed only in about 40% of the events.
Figure 7 shows the zonal (panel a) and meridional (panel b) neutral wind measured at CP on 5 September 2017. The C-structure appears at 03:30 LT, above 89 km, shown in Figure 6. Note that the zonal wind in this region is close to zero. However, the meridional wind has the highest values, reaching a peak of −75 m/s at around 89 km altitude at the same time that C-structure occurred.
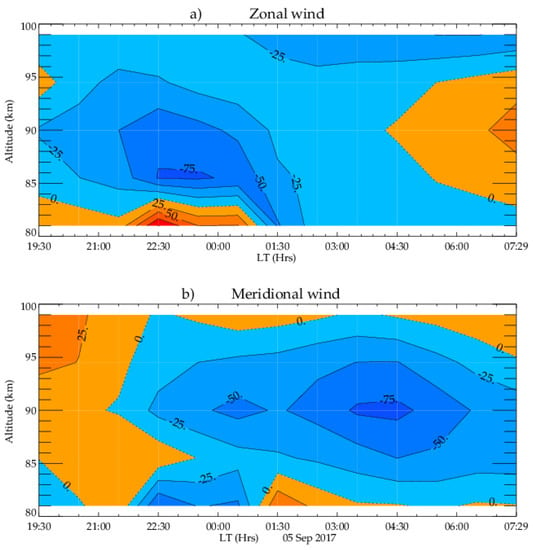
Figure 7.
(a) Zonal and (b) meridional wind measured by all-sky meteor radar at Cachoeira Paulista on 5 September 2017.
4. Discussion
C-type sporadic layers were analyzed using simultaneous data of a narrow band of Na Density and Temperature LIDAR data at SJC, a meteor wind, and an ionosonde, both located at CP, far 100 km from SJC. From this set of measurements, 82 nights of data from 2007 to 2008 were analyzed, and three C-type events were found at the top of the layer, similar to the events presented by [3,4].
Larsen et al. [25] studied a similar type of structure, and they concluded it to be due to convective instability instead of KH instability. On the other hand, the works based on the observations with a Na LIDAR over Gadanki, India [5,6,7,26] supported the hypothesis of KH instability for the formation of these sporadic complex structures. Additionally, the works done by [6,7] using a meteor radar from Thiruvananthapuram, India, and satellite-borne measurements indicated that KH billow formation occurs over Thiruvananthapuram. The authors suggested that the wind shear initially modifies the billow, and then it eventually got ‘frozen-in’ the background due to the reduction of vertical wind shear and was advected to the lidar site. Also, they concluded that the lifetime of KH billows could be of the order of a few hours, under favorable background conditions, in the MLT region. Therefore, those long-lasting KH billow manifests as a long-lasting “C-type” structure in the Na Lidargram. The results presented in cases 1, 2, and 3, using the first set of data, showed that the duration of most events was longer than one hour and can be compared to long-lasting C-type. All three cases showed lower temperatures inside C- structures than the borders. Besides, the squared Brunt-Väissälä frequency () was not negative in the region of C-structures; their values were close to zero, which indicates a threshold to convective instability. All three cases showed strong wind shear in the altitude and time C-structures appeared. In two out of three cases, dynamical instability was present ( < 0.25). Ref. [25] analyzed six cases of long-lasting C-type structures in the Na Lidargrams over low, mid, and high latitudes. To discuss these long-lasting C-type structures, they investigated several parameters of convective and dynamical stability, like Reynolds number, , and Prandtl number. The authors tried to show the atmospheric background conditions enabling KH billows to survive hours together without much deformation. Their results show positive in all cases. Moreover, the inside of the C-structures were always larger than 0.25. The authors concluded that the long-lasting C-type in Na layers was a manifestation of a KH billow in MLT, which was generated in other locations and advected to the Na lidar stations by a “frozen-in” condition. Simultaneous wind and temperature measurements presented by [24] revealed convective and dynamic stabilities in the region of C-type structures. The results presented here partially agree with them, in which our findings showed positive values of in all events. However, the two analyzed cases are dynamically unstable, disagreeing with Mondal’s work.
Jiao et al. [27] observed a kind of similar C-structure in the lower thermosphere Na layer at Haikou (19.99° N, 110.34° E) to distinguish from those observed in the standard Na layer they call thermospheric convective Na layer (TCSL). They observed 14 events in 180 nights, all occurring in a region separated from the main Na layer (≤103 km). Note that the frequency of occurrence of TCSL reported by [27] (7.7%) is almost twice those presented in this study. They found a strong correlation between TCSL with the Es layer and field-aligned ionospheric irregularities (FAI), as suggested by [3]. They also suggested a “fountain effect” to be responsible for the reservoir of convective structures and attribute the TCSL to the KH instability and FAI. We also investigate the possible relationship between FAI and C-structures by analyzing Ionospheric Es layers occurrences. In the first three cases analyzed, the Es layer was only present in Case 2, being very weak. The ionosonde data showing this Es layer evolution is presented in Figure 8, and a flat type characterizes its shape. Likewise, its virtual height evolution ranges from 112 km at 21:15 LT to 95 km at 22:45 LT. Notice that the blanketing frequency of the Es layer, related to the electron density, reached values around 1.6 MHz. Moreover, it was only present in the first event, completely disrupted at around 2:30 UT (23:30 LT).
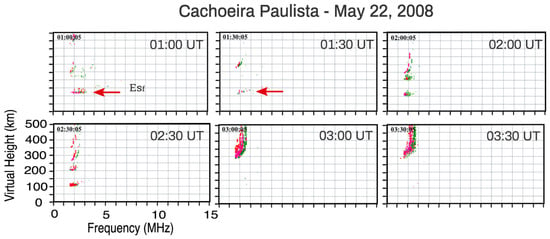
Figure 8.
Ionosonde data showing a week Es measured simultaneously with C-structure on 22 May 2008 at Cachoeira Paulista. The time indicated at the top of the figures is in Universal Time (UT: GMT 00:00).
A low correlation between Es layer occurrences and C-structures is also observed in the other nine cases studied using the second data set. The fact that there was no one-to-one correspondence between Es layers and C-type events in metal layers does not entirely invalidate the occurrence of FAI responsible for C-type formation. There are at least two explanations for the correlation absence between observations in the ionosonde and the events in the Na layer: (1) the instruments are not placed at the same site, the separation of 100 km and the winds typically 50 m/s would correspond to a time difference of more than half an hour; and (2) is related to the time constant involved in the reaction of ion neutralization, even if the metal atoms associated with the C-structures are produced by the neutralization of ions associated with Es layer, because of the time constants involved we cannot expect a one-to-one correspondence. According to [28] and the references therein, the neutralization of metallic ions in the MLT occurs through the formation of a molecular ion, followed by dissociative recombination with electrons. Na+ and K+ can only form cluster ions because they are chemically inert and have closed outer electron shells (see Figure 10, in [28], for clarification). Although both atoms have similar ion−molecule chemistry, once the K+ ion is larger than Na+, it binds less strongly to ligands. It means that K+ can only form clusters and be neutralized via dissociative recombination at very low temperatures. Considering the overlapping of C-structures events observed in the Na and K layers, shown in Figure 6, the local production of the metallic cloud from an Es layer is very unlikely to occur at the same location of their formation. First, a flat Es will produce a flat neutral metallic cloud. As shown in the meteor wind radar data, there is a strong vertical wind shear during the event. The vertical wind shear causes vertical trapping of ions, keeping them in thin layers without significant vertical variations. Meanwhile, it is hard to think about ion-neutralization to form C-structures in both Na and K layers, at the same height and time, even though the lower temperature inside the C-structures suggests this possibility.
Another thing to consider is that the LIDAR observes a fixed point in the sky. We have no information about horizontal structures or their velocities. Consequently, these structures can be formed in other locations and drift to the LIDAR field of view. Interestingly, they appear first as the vertical rapid variation enhancement and then as two branches. In our analysis of these two data sets, we have found no event that shows the opposite: first branches and after the vertical development, indicating pre-formed C-structures that drifted through the LIDAR station. cases 1 and 2 seem to be related to dynamical instability generation. However, case 3 is both dynamically and convectively stable. The only common characteristic is the strong vertical wind shear, presented in all the events studied in the two data sets. Considering all these arguments, the advection of a pre-existing Na cloud to the LIDAR station and a wind distortion, as proposed by [4], seems to be the plausible mechanism to explain all the three C-structures observed.
In addition, we presented an analysis of 3 years of simultaneous Na and K meteor layers from 2017 to 2019. In this data set, we found nine events of C-type structures. Andrioli et al. [2] studied the simultaneous sporadic layers as seen in Na and K for all kinds of Ns using the same data set. Among the lack of similarities and differences between Ns behavior in Na and K layers that they reported, we highlight the peak height, rising time, and decay time here. The sporadic events in the K layers have longer rising (12 min) and decay (24 min) times, and their peak height occurred on average 1.8 km lower than the Ns observed in the Na layer. The interesting point is that in this sub-set of the Ns layer, the C-type structures appeared with the same altitude range and were simultaneous at these two layers. Moreover, all the events observed in the present studies were located at the top side of the layers. Xu et al. [10] studied the evolution of the Na layer in the presence of the overturning gravity wave using LIDAR data and a model. Their results showed that the Na density perturbation has a more pronounced overturning behavior on the bottom side of the layer than on the top side. This significant result reinforces that the structures studied here do not represent a convective overturning manifestation. The wind distortion of a pre-existent Na and K cloud advected to the LIDAR station is the most probable mechanism that explains the C-structures observations.
5. Conclusions
Peculiar sporadic layers were observed at the top of metal mesospheric layers as C-Shapes in the height time intensity plots. These events were carefully investigated in the present work, first using the data of a narrow band Density and Temperature LIDAR and second a high-resolution simultaneous and LIDAR, both operated at São José dos Campos, Brazil (23° S, 46° W). This phenomenon is much rarer than the Neutral Sporadic layers, as studied by [2], around 3.6% of the observational nights from the first set of data, and 4.8% in the second data set. Considering the temperature analysis, all the three cases presented lower temperatures inside of C-structures. Although was positive in the region of C-structures, their values were close to zero, which indicates a threshold to convective instability. Dynamical instability was present ( < 0.25) in two out of three cases, diverging from the results presented by [24].
The present work analyzed several events of sporadic C-structure in two metallic layers simultaneously observed for the first time. They showed similar characteristics found in the first data set. Since exists the height and time simultaneity correspondence between C-structures events observed in the Na layer and K layers, the same mechanism can explain C-type in the both layers. Moreover, the low correlation between Es occurrence and C-structures turn challenging to relate them to the FAI and KH instabilities. Additionally, strong wind shear in the altitude and time where C-structures appeared were always present. Hence, the mechanism proposed by [4], a wind distortion of a pre-existing metallic cloud, seems to be the plausible mechanism that can explain all the C-structures observed. This work helps the understanding of the mechanism responsible for C-structure formation.
Author Contributions
Data curation, C.G.T.; Formal analysis, V.F.A., L.C.A.R. and G.Y.; Funding acquisition, C.W.; Investigation, V.F.A.; Methodology, J.J.; Project administration, Z.L.; Supervision, J.X. and P.P.B.; Visualization, A.A.P., M.P.M. and S.S.; Writing—original draft, V.F.A.; Writing—review & editing, L.C.A.R. All authors have read and agreed to the published version of the manuscript.
Funding
This work was supported by the International Partnership Program of Chinese Academy of Sciences, Grant No. 183311KYSB20200003 and 183311KYSB20200017.
Institutional Review Board Statement
Not applicable.
Informed Consent Statement
Not applicable.
Data Availability Statement
All the data used are available at: The all-sky meteor wind data can be found at: https://doi.org/10.5281/zenodo.5510648 (accessed on 31 October 2022). The Na/K LIDAR data are available online at http://doi.org/10.5281/zenodo.4127023 (accessed on 31 October 2022. The Digisonde data from Cachoeira Paulista can be downloaded upon registration at the Embrace webpage from INPE Space Weather Program in the following link: http://www2.inpe.br/climaespacial/portal/en/ (accessed on 31 October 2022).
Acknowledgments
We are grateful to Dilmar Santos who helped with the Na-K LIDAR observations. V.F.A. and L.C.A.R. would like to thank the China-Brazil Joint Laboratory for Space Weather (CBJLSW), National Space Science Center (NSSC), Chinese Academy of Sciences (CAS) for supporting their postdoctoral fellowship. The authors acknowledge China-Brazil Joint Laboratory of Space weather to provide Na-K lidar data. This work was supported by the International Partnership Program of Chinese Academy of Sciences, Grant No. 183311KYSB20200003 and 183311KYSB20200017. We also thank to the Brazilian National Council for Scientific and Technological Development (CNPq) for supporting scientific equipment and through the PCI program.
Conflicts of Interest
The authors declare no conflict of interest.
References
- Clemesha, B.R.; Kirchhoff, V.; Simonich, D.M.; Takahashi, H. Evidence of an extra-terrestrial source for mesospheric sodium layer. Geophys. Res. Lett. 1978, 5, 873–876. [Google Scholar] [CrossRef]
- Andrioli, V.F.; Xu, J.; Batista, P.P.; Pimenta, A.A.; Martins, M.P.P.; Savio, S.; Targon, C.G.; Yang, G.; Jiao, J.; Wang, C.; et al. Simultaneous observation of sporadic potassium and sodium layers over São José dos Campos, Brazil (23.1° S, 45.9° W). J. Geophys. Res. 2021, 126, e2020JA028890. [Google Scholar] [CrossRef]
- Kane, T.; Grime, B.; Franke, S.; Kudeki, E.; Urbina, J.; Kelley, M.; Collins, S. Joint observations of sodium enhancements and field-aligned ionospheric irregularities. Geophys. Res. Lett. 2001, 28, 1375–1378. [Google Scholar] [CrossRef]
- Clemesha, B.R.; Batista, P.P.; Simonich, D.M.; Batista, I.S. Sporadic structures in the atmospheric sodium layer. J. Geophys. Res. 2004, 109, D11306. [Google Scholar] [CrossRef]
- Sarkhel, S.; Raizada, S.; Mathews, J.D.; Smith, S.; Tepley, C.A.; Rivera, F.; Gonzalez, S.A. Identification of largescale billows-like structure in the neutral Na layer over Arecibo. J. Geophys. Res. 2012, 117, A10301. [Google Scholar] [CrossRef]
- Sarkhel, S.; Mathews, J.D.; Raizada, S.; Sekar, R.; Chakrabarty, D.; Guharay, A.; Jee, G.; Kim, J.-H.; Kerr, R.B.; Ramkumar, G.; et al. A case study on occurrence of an unusual structure in the sodium layer over Gadanki. India. Earth Planets Space 2015, 67, 19. [Google Scholar] [CrossRef]
- Sarkhel, S.; Mathews, J.D.; Raizada, S.; Sekar, R.; Chakrabarty, D.; Guharay, A.; Jee, G.; Kim, J.-H.; Kerr, R.B.; Ramkumar, G.; et al. Erratum to: A case study on occurrence of an unusual structure in the sodium layer over Gadanki, India. Earth Planets Space 2015, 67, 145. [Google Scholar] [CrossRef]
- Fritts, D.C.; Alexander, M.J. Gravity wave dynamics and effects in the middle atmosphere. Rev. Geophys. 2003, 41, 1003. [Google Scholar] [CrossRef]
- Hecht, J.H.; Walterscheid, R.L.; Fritts, D.C.; Isler, J.R.; Senft, D.C.; Gardner, C.S.; Franke, S.J. Wave breaking signatures in OH airglow and sodium densities and temperature: 1. Airglow imaging, Na lidar, and MF radar observations. J. Geophys. Res. 1997, 102, 6655–6668. [Google Scholar] [CrossRef]
- Xu, J.; Smith, A.K.; Collins, R.L.; She, C.-Y. Signature of an overturning gravity wave in the mesospheric sodium layer: Comparison of a nonlinear photochemical-dynamical model and lidar observations. J. Geophys. Res. 2006, 111, D17301. [Google Scholar] [CrossRef]
- Yang, G.; Clemesha, B.; Batista, P.; Simonich, D. Seasonal variations of gravity wave activity and spectra derived from sodium temperature lidar. J. Geophys. Res. 2010, 115, D18104. [Google Scholar] [CrossRef]
- She, C.Y.; Liu, A.Z.; Yuan, T.; Yue, J.; Li, T.; Ban, C.; Friedman, J.S. MLT science enabled by atmospheric lidars. In Upper Atmosphere Dynamics and Energetics; John Wiley & Sons, Inc.: Hoboken, NJ, USA, 2021; pp. 395–450. [Google Scholar] [CrossRef]
- Raizada, S.; Tepley, C.A.; Zhou, Q.; Sarkhel, S.; Mathews, J.D.; Aponte, N.A.; Seker, I.; Kerr, R.; Cabassa, E. Dependence of mesospheric Na and Fe distributions on electron density at Arecibo. Earth Planet Space 2015, 67, 146. [Google Scholar] [CrossRef]
- Clemesha, B.; Simonich, D.; Batista, P. Sodium lidar measurements of mesopause region temperatures at 23° S. Adv. Space Res. 2011, 47, 1165–1171. [Google Scholar] [CrossRef]
- Hocking, W.K.; Fuller, B.; Vandepeer, B. Real-time determination of meteor-related parameters utilizing modern digital technology. J. Atmos. Terr. Phys. 2001, 63, 155–169. [Google Scholar] [CrossRef]
- Batista, P.P.; Clemesha, B.R.; Tokumoto, A.S.; Lima, L.M. Structure of the mean winds and tides in the meteor region over Cachoeira Paulista, Brazil (22.7° S, 45° W) and its comparison with models. J. Atmos. Terr. Phys. 2004, 66, 623–636. [Google Scholar] [CrossRef]
- Andrioli, V.F.; Batista, P.P.; Xu, J.; Yang, G.; Chi, W.; Zhengkuan, L. Strong temperature gradients and vertical wind shear on MLT region associated to instability source at 23° S. J. Geophys. Res. Space Phys. 2017, 122, 4500–4511. [Google Scholar] [CrossRef]
- Miles, J.W. On the stability of heterogeneous shear flows. J. Fluid Mech. 1961, 10, 496–508. [Google Scholar] [CrossRef]
- Reinisch, B.W.; Galkin, I.A.; Khmyrov, G.M.; Kozlov, A.V.; Bibl, K.; Lisysyan, I.A.; Cheney, G.P.; Huang, X.; Kitrosser, D.F.; Paznukhov, V.V.; et al. New Digisonde for research and monitoring applications. Radio Sci. 2009, 44, RS0A24. [Google Scholar] [CrossRef]
- Resende, L.C.A.; Shi, J.; Denardini, C.M.; Batista, I.S.; Nogueira, P.A.B.; Arras, C.; Andrioli, V.F.; Moro, J.; da Silva, L.A.; Carrasco, A.J.; et al. The influence of disturbance dynamo electric field in the formation of strong sporadic E layers over Boa Vista, a low-latitude station in the American sector. J. Geophys. Res. 2020, 125, e2019JA027519. [Google Scholar] [CrossRef]
- Jiao, J.; Yang, G.; Cheng, X.; Liu, Z.; Wang, J.; Yan, Z.; Wang, C.; Batista, P.; Pimenta, A.; Andrioli, V.; et al. Simultaneous lidar observation of peculiar sporadic K and Na layers at São José dos Campos (23.1° S, 45.9° W), Brazil. Adv. Space Res. 2018, 61, 1942–1951. [Google Scholar] [CrossRef]
- Du, L.; Jiao, J.; Li, F.; Lin, X.; Liu, Z.; Batista, P.P.; Pimenta, A.A.; Andrioli, V.F.; Wang, J.; Chen, X.; et al. The technical optimization of Na-K lidar and to measure mesospheric Na and K over Brazil. J. Quant. Spectrosc. Radiat. Transf. 2021, 259, 107383. [Google Scholar] [CrossRef]
- Andrioli, V.F.; Xu, J.; Batista, P.P.; Pimenta, A.A.; Resende, L.C.A.; Savio, S.; Fagundes, P.R.; Yang, G.; Jiao, J.; Cheng, X.; et al. Nocturnal and seasonal variation of Na and K layers simultaneously observed in the MLT Region at 23° S. J. Geophys. Res. 2020, 125, e2019JA027164. [Google Scholar] [CrossRef]
- Mondal, S.; Sarkhel, S.; Agarwal, J.; Chakrabarty, D.; Sekar, R.; Yuan, T.; Russell, J.M., III. On the long lasting “C-type” structures in the sodium lidargram: The lifetime of Kelvin-Helmholtz billows in the mesosphere and lower thermosphere region. J. Geophys. Res. 2019, 124, 3110–3124. [Google Scholar] [CrossRef]
- Larsen, M.F.; Liu, A.Z.; Gardner, C.S.; Kelley, M.C.; Collins, S.; Friedman, J.; Hecht, J.H. Observations of overturning in the upper mesosphere and lower thermosphere. J. Geophys. Res. 2004, 109, D02S04. [Google Scholar] [CrossRef]
- Sridharan, S.; Prasanth, P.V.; Kumar, Y.B.; Ramkumar, G.; Sathishkumar, S.; Raghunath, K. Observations of peculiar sporadic sodium structures and their relation with wind variations. J. Atmos. Terr. Phys. 2009, 71, 575–582. [Google Scholar] [CrossRef]
- Jiao, J.; Yang, G.; Wang, J.; Zhang, T.; Peng, H.; Xun, Y.; Liu, Z.; Wang, C. Characteristics of convective structures of sodium layer in lower thermosphere (105–120 km) at Haikou (19.99° N, 110.34° E), China. J. Atmos. Terr. Phys. 2017, 164, 132–141. [Google Scholar] [CrossRef]
- Plane, J.M.C.; Feng, W.; Dawkins, E.; Chipperfield, M.P.; Höffner, J.; Janches, D.; Marsh, D.R. Resolving the strange behavior of extraterrestrial potassium in the upper atmosphere. Geophys. Res. Lett. 2014, 41, 4753–4760. [Google Scholar] [CrossRef]
Publisher’s Note: MDPI stays neutral with regard to jurisdictional claims in published maps and institutional affiliations. |
© 2022 by the authors. Licensee MDPI, Basel, Switzerland. This article is an open access article distributed under the terms and conditions of the Creative Commons Attribution (CC BY) license (https://creativecommons.org/licenses/by/4.0/).